Abstract
The advantageous performance in terms of energy conversion for the flow-induced motion (FIM) of T-section prisms has been experimentally reported recently. In order to further understand the oscillation and energy conversion of multiple T-section prisms, a series of tests of two T-section prisms arranged in tandem with five different spacing ratios (3 ≤ L/D ≤ 15) and seven load resistances (8 Ω ≤ RL ≤ 41 Ω) were conducted. The effects of the spacing ratio and load resistances on energy conversion were discussed. The main conclusions can be summarized as follows. For most tests, the amplitudes of the upstream T-section prism (UTP) and downstream T-section prism (DTP) were both lower than the amplitude of the single T-section prism (STP) due to the mutual interference of the two prisms. Because of the mutual interference, the active powers of UTP and DTP were both less than that of STP, but at some special spacing ratios or load resistances, the mutual interference benefited the energy converted by the two prisms. In the presented tests, the total optimal active power of the upstream T-section prism and downstream T-section prism (UTP + DTP) was 30.12 W, which was 1.5 times that of STP (20.12 W).
1. Introduction
Ocean current energy is a new type of sustainable energy with huge reserves. With the gradual development of ocean energy and the continuous development of flow-induced motion (FIM), more scholars are focusing on exploiting ocean current energy by means of the FIM phenomenon [1,2]. A lot of research has been conducted on oscillation characteristics and energy conversion of FIM for a single oscillator or multi-oscillators, and most research has concentrated on circular cylinders.
Previously, research methods were mostly experimental studies which were mainly focused on the variation of oscillation characteristics and wakes with spacing, as well as the correlation between Reynolds number and oscillation characteristics of FIM [3]. King et al. [4] conducted a series of FIM experiments on two cylinders coupled and uncoupled in tandem with a spacing ratio of 0.25 ≤ L/D ≤ 6, and complex mutual interactions were observed between the flow and wake. As oscillation occurred in the crossflow direction, the Reynolds number must exceed 100. It can be concluded that the amplitude of the downstream uncoupled cylinder was strongly influenced by the vortices shed from the upstream cylinder and the spacing ratio. For L/D > 3, the wake of the upstream cylinder had a positive effect on the oscillation of the downstream cylinder. Considering the interference of the cylinders, Zdravkovich [5,6,7] and Zhou et al. [8] concluded three wake interference regions, as shown in Figure 1. For the regime between the two cylinders, the wake vortex of the upstream cylinder was attached to the downstream cylinder, the two cylinders almost acted as a single structure, and the two cylinders were similar to a single cylinder and a joint vortex, the so-called extended-body regime (1 ≤ L/D ≤ 2). For 2 ≤ L/D ≤ 5, mutual interference occurred between two cylinders in this range. The distance between the downstream cylinder and the upstream cylinder was smaller than the vortex distance of the upstream cylinder. The vortex wake of the upstream cylinder was attached to the downstream cylinder before the vortex was completely formed, and the downstream cylinder had an effect on the formation of the wake of the upstream cylinder, the so-called reattachment regime. For L/D ≥ 5, the two cylinders were vortexed in the co-shedding regime.
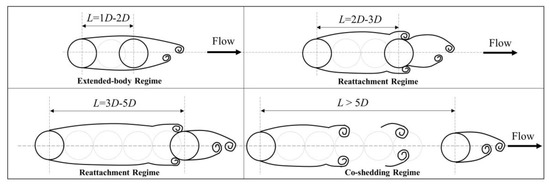
Figure 1.
Simplified classification scheme of the flow patterns for two tandem circular cylinders in cross-flow.
Subsequently, scholars began to pay more attention to the effect of spacing and the Reynolds number on oscillation. Igarashi et al. [9] defined and analyzed the wake path with different spacing ratios based on the oscillation wake of the upstream and downstream cylinders for a Reynolds number of 8.7 × 10³ ≤ Re ≤ 5.2 × 10⁴ and spacing ratios of 1.03 ≤ L/D ≤ 5. Bokaian et al. [10,11] presented a series of physical experiments for the fluid-dynamic instability of a smooth circular cylinder that freely oscillated with linear springs in the wake of an identical stationary cylinder. The results showed that the wake of the upstream cylinder was affected by the amplitude of the downstream cylinder and functioned through the static forces on the downstream cylinder with its proximity to a fixed identical body. Yao et al. [12] concluded that the cylinder oscillation not only affected the lift coefficient and the steady-state drag coefficient but also influenced the mutual interference between the two cylinders at 4.5 × 10⁴ ≤ Re ≤ 5.8 × 10⁵ and 2.5 ≤ L/D ≤ 5.02. Mahir et al. [13,14] found that the interacting wake vortices exhibited different wake patterns for different phase angles in the resonance region by an experimental method used to study the wake of tandem and two parallel cylinders. Brika and Laneville [15] found that the resonance region of the tandem cylinders was larger than that of the isolated cylinder, and the region decreased as the spacing ratio L/D increased. In addition, it was found that there were two kinds of vortex shedding modes of 2P and 2S (2P is a pattern where, in each complete cycle, a pair of vortexes are shed. 2S is a pattern where, in each complete cycle, a single vortex is shed [16]) at Ur = U/(fn. D) = 7.8 and 5000 ≤ Re ≤ 27,000. Meneghini et al. [17] observed the flow field structure of two cylinders in tandem arrangement with different spacing ratios and calculated the vorticity lines and the force on the cylinders. The calculation results were basically consistent with the experiment results of Bearman [18] and Williamson [19]. As L/D < 3, the downstream cylinder received a negative effect. On the other hand, as L/D ≥ 3, there was a positive influence. In recent years, with the development of technology, Lin et al. [20] presented the flow field of tandem cylinders by the particle image velocimetry (PIV) method. It can be observed that the wake of the upstream cylinder influenced the inflow condition of the downstream cylinder, and the downstream cylinder reacted upon the wake dynamics and the wake vortex region of the upstream cylinder. Alam et al. [21,22] and Lee et al. [23] determined the separation points of the wake by measuring the pulsating pressure distribution and applying a hot-film sensor on the surface of the cylinder.
In later papers, scholars paid more attention to the oscillation interference of two cylinders. Assi et al. [24] concluded that the wake-induced vibration (WIV) phenomenon of the downstream cylinder was caused by the interaction of the fluid and the unsteady vortex structure between the wakes of the upstream cylinder, as shown in Figure 2. If the unsteady vortices from the wake were removed, WIV would not be excited. The amplitude response of the WIV region decreased as the spacing ratio increased for x0/D ≥ 4.0. In the tests, for x0/D = 20.0, the amplitude was drastically reduced and closely resembled that of the vortex-induced vibration (VIV) of a single cylinder; the WIV grew weaker as the spacing ratio increased until the interference was irrelevant and the cylinder behaved similar to an isolated body. A favorable phase lag between the displacement and the fluid force guaranteed that the positive energy that was transferred from the flow to the structure sustained the oscillations. Feng et al. [25,26] established a three-dimensional numerical model to analyze the fluid-structure interaction in the tube bundle. The results showed that the lift and amplitude of the downstream tube increased with the increase of the spacing ratio. For L/D > 2, the fluid force coefficient and amplitude of the upstream tube were close to those of the single tube.
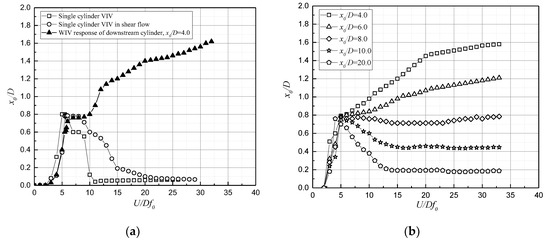
Figure 2.
The amplitude response of a downstream cylinder to a circular cylinder: (a) Response of the downstream cylinder for typical VIV and WIV responses; (b) Response of the downstream cylinder at different spacing Reproduced with permission from [24], Copyright Cambridge University Press, 2010.
Most of the previous investigations were performed on two cylinders, and the physical experiments and number simulations were focused on the wake, fluid forces on the surface of cylinders, and near-body disturbance of the cylinders, etc. It can be concluded that the mutual disturbance on the amplitude responses of two cylinders was mostly effect by the spacing of the two cylinders, and the wake characteristics of the cylinders were determined by the Reynolds number. Furthermore, the oscillation responses of the downstream cylinder (circular and non-circular) were greatly affected by the gas (water) dynamics and the vortex shedding [27,28].
In the past decade, scholars have begun to pay more attention to the mutual disturbance of prisms and energy conversion with different cross-sections [20,21,22,23,24,25,26,27,28,29,30,31]. The previous researchers showed that non-circular bluff bodies were more prone to galloping, and the passive turbulence control (PTC) cylinder [32], triangular prism [33,34], rectangular cylinder [35], and T-section prism [36] were experimentally proved to have better energy conversion capacity, and the harnessed power in water was much higher than that in air. Dai et al. [37,38] proposed an optimized experimental design method for a piezoelectric energy generator which effectively collected kinetic energy from FIM and provided sustainable power for microelectronic products. Various cross-sections of the interference cylinder were proposed; with a wind speed of 2.36 m/s and L/D = 0.9, the average output power of a square prism was 803.4 μW. Lai et al. [39] produced a novel wind energy harvester named a vibro-impact dielectric elastomer generator (VI DEG) which can harness power up to 0.16 mW by increasing the stiffness of the system and adjusting the distance between the DEMs appropriately. Kim [40] carried out a series of experiments of two smooth cylinders and two PTC cylinders to compare the oscillation responses. The results showed that the amplitude of the downstream PTC was close to that of the upstream PTC and single PTC for U*water = U/(fwater D) ≥ 8. Based on the experiments, Sun et al. [41] and Bernitsas et al. [42] conducted a series of comprehensive tests on the free vibration of multi-PTC cylinders and concluded the optimal arrangement of PTC cylinders. Ding et al. [43] also performed numerical simulation of the energy conversion of tandem PTC cylinders. The peak energy conversion efficiency reached 37%, which was close to the efficiency of experiments. Zhang et al. [44,45] proposed a two-dimensional numerical simulation method to study the vortex-induced vibration energy conversion with a spacing ratio of 2 ≤ L/D ≤ 50, and the cir-tria section (η = 26.5 %) was the best of five cross sections. Meanwhile, the energy conversion of rectangue with different aspect ratios has been discussed and analyzed. [46] The influence of the submergence depths of cylinders had been examined to explore more thoroughly the VIV responses based on simulation and experimental results. As the submergence depth decreases, the VIV amplitude decreases, with a similar decrease in the hydrokinetic energy conversion [47]. Zhu et al. [48] creatively proposed a new converter consisting of an elastically mounted circular cylinder and a free-to-rate pentagram impeller to harness hydrokinetic energy. The average energy conversion efficiency is about 22.6%, and the power density can reach 885.53 W/m3, which can be achieved by two-way fluid-structure interaction simulations.
FIM responses and energy conversion tests of T-section prisms have been conducted at Tianjin University with the maximum active power of 21.23 W [36], which was slightly lower than that of the PTC cylinder (23.54 W) reported by Ding [49]. The hard galloping (HG) and soft galloping (SG) investigated experimentally for triangular prisms [33] can also be observed for T-section prisms. There are still many issues that remain to be addressed. For example, the oscillation responses of UTP and DTP are not clear, especially for variation of spacing and load resistances. The experimental study has two objectives. The first one is to determine the mutual interference responses of the upstream T-section prism (UTP) and downstream T-section prism (DTP). The second aim is to estimate the energy conversion of UTP and DTP, as well as the influence of the spacing ratio and load resistances on energy conversion. In order to fully take advantage of oscillation characteristics and the energy conversion of multi T-section prisms in tandem arrangement, a series of tests were proposed, including the following three aspects: (1) The FIM oscillation tests were carried out to investigate the amplitudes and frequencies of UTP and DTP in tandem; (2) The FIM energy conversion tests were carried out to investigate the energy conversion of UTP and DTP in tandem; (3) In order to reveal the influential parameters of two tandem T-section prisms, the variations of the active power and efficiency with five different spacing ratios and seven different load resistances were discussed. The experimental research on the two T-section prisms in tandem aimed to find out the optimal energy conversion parameters of UTP + DTP.
2. Experimental Methods
2.1. Physical Model
2.1.1. Recirculating Water Tunnel
All experiments were conducted in a one-meter-wide channel of the recirculating water tunnel at Tianjin University. The test area of the tunnel was 1.34 m in terms of the water depth. The water in the tunnel was driven by a 90 kW variable frequency power pump with a velocity range of 0.0~1.8 m/s achieved by a frequency conversion controller (FCC), as shown in Figure 3. The differences in the flow velocity and turbulence in the vertical direction were small, which illustrated that the incoming flow in the test area of the T-section prism was uniform [36]. The current velocities were set at 0.516 m/s ≤ U ≤ 1.332 m/s, with a corresponding Reynolds numbers of 45,263 ≤ Re ≤ 116,842 in the transition in the shear layer 3 (TrSL3) (20,000–40,000 ≤ Re ≤ 100,000–200,000) flow regime [50]. The relevant parameters are listed in Table 1.
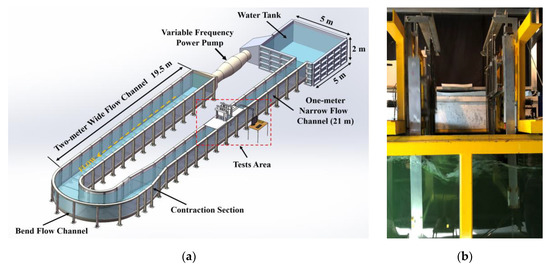
Figure 3.
Recirculating water channel system: (a) Overview of the recirculating water tunnel; (b) Actual devices.

Table 1.
Test conditions.
2.1.2. Test Apparatus and Energy Conversion System
The test apparatus consisted of two parts: the oscillation system and energy conversion system [36]; the arrangement of the devices and the details of the system are shown in Figure 4. Based on the single T-section prism system, a new test apparatus and energy conversion system was built in this paper. The oscillation system mass, system stiffness, and natural frequency in air were adjusted to ensure the parameters of the two systems were very close, as shown in Table 2. The FIM characteristics (mutual disturbance) and energy conversion characteristics of the two T-section prisms in tandem arrangement were analyzed. The linear motion of the T-section prism initiated the rotational motion of the gear, and the gear was connected to the rotor of the generator to drive the generator to output electricity which was dissipated through the load resistances.
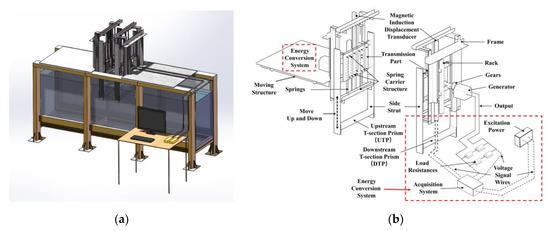
Figure 4.
Test apparatus and energy conversion system: (a) Test area diagram; (b) Details of the system.
Table 2.
Physical model parameters.
2.1.3. T-Section Prisms
In the tests, the T-section prism was made of polymethyl methacrylate, and the parameters of the T-section prism are listed in Table 3. In order to investigate the influence of the spacing ratio of the T-section prisms on FIM responses and energy conversion characteristics, five different distances (L = 0.3 m, 0.6 m, 0.9 m, 1.2 m, 1.5 m) were selected in the experiments. The corresponding spacing ratios (L/D) were 3.0, 6.0, 9.0, 12.0, and 15.0, respectively, as shown in Figure 5.
Table 3.
The parameters of the T-section prism.
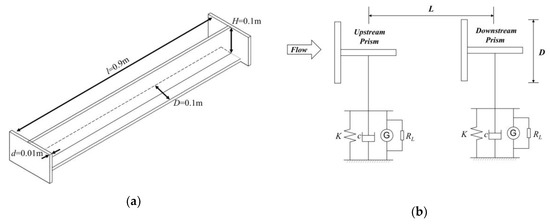
Figure 5.
T-section prisms: (a) T-section prism size diagram; (b) Spacing ratio of prisms.
2.1.4. Free Decay Tests
Free decay tests with different load resistances were conducted to obtain the natural frequency of the experimental system in air (fn,air). The load resistances (RL) were varied from 8 Ω to 41 Ω. The damping ratios (ζtotal) were obtained by free decay tests with different load resistance values [32]. For each RL, free decay tests were performed four times for the respective cases in air, as shown in Figure 6. Then, fn,air was calculated by using a simple averaging method. The results are listed in Table 4.
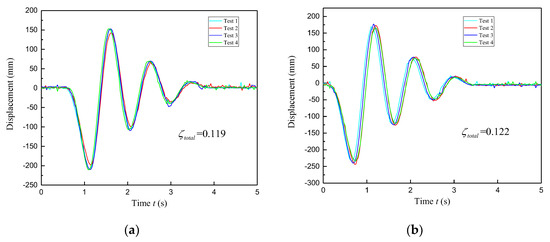
Figure 6.
Free decay tests for K = 1400 N/m and RL = 41 Ω: (a) Upstream prism; (b) Downstream prism.
Table 4.
The parameters of the two T-section prisms.
The damping ratio ζtotal expression is defined as:
where ζtotal is the damping ratio, Ai is the ith peak of the free decay curve, Ai+1 is the i + 1th peak of the free decay curve.
The damping (Ctotal) of the experimental system:
where Ctotal is damping, ζtotal is the damping ratio, K is the system stiffness, mosc is the system oscillation mass.
2.2. Test Method and Data Processing
In the tests, the amplitude (A) was collected in the form of a voltage signal by a magnetic induction displacement transducer with a sensitivity of 0.1%, error range of ±0.05%, and testing range of 0~800 mm. The oscillation frequency fosc was calculated by the fast Fourier transform (FFT) method of the displacement time-history curves of the prism under continuous oscillation for 60 s. The instantaneous voltage of the system was measured by a data acquisition system in the form of a voltage signal, as shown in Figure 7.
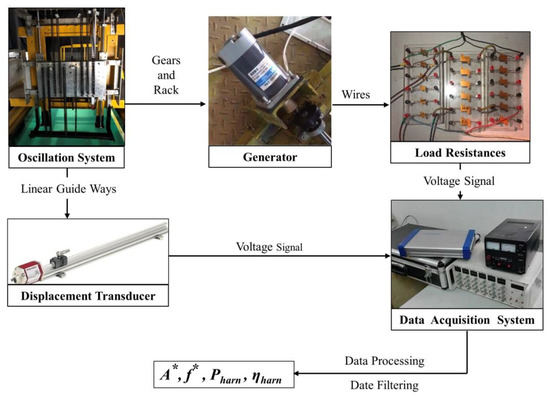
Figure 7.
Data acquisition system.
Active power (Pharn) and energy conversion efficiency (ηharn) were two significant parameters to estimate the energy conversion capacity of the system and were calculated by the following equations:
The instantaneous power expression is calculated as:
where P(t) is instantaneous power; u(t) is instantaneous voltage, RL is the load resistance value.
The active power is written as:
where Pharn is active power, T is a period of oscillation.
The energy conversion efficiency is derived as:
where ηharn is energy conversion efficiency [41]; Pw is the total power in the fluid which is written as:
where ρ is water density, U is incoming flow velocity, D is the projection width of the triangular prism in the direction of incoming flow, l is prism length.
3. Results and Discussion
3.1. Oscillation of Two T-Section Prisms in Tandem
The oscillation characteristics curves were considered separately for each of the five spacing ratios between the two T-section prisms. The amplitude ratio A* = A/D and the frequency ratio f* = fosc/fn,air along with the hard galloping (HG) and soft galloping (SG) are presented and discussed in this section. The amplitude (A) of the T-section prism was calculated by averaging the absolute values of the highest values of positive and negative peaks in 60 s of continuous oscillation; D is the projection width of the prism in the direction of incoming flow.
In this section, two typical working conditions were selected to illustrate the FIM responses of UTP (1st) and DTP (2nd), comparing the FIM responses of UTP and DTP with different spacing ratios to the single T-section prism (STP).
3.1.1. Typical Oscillation Responses of Hard Galloping (HG)
In the tests, under increasing velocity and no manual external excitation, UTP and DTP vibrated freely. Then, after applying a threshold initial displacement (exceeding 1 × D) at Ur = 12.25, the prisms entered the hard galloping branch accompanied with a high amplitude and low frequency. As velocity decreased (Ur = 10.375), the prism suddenly dropped in the VIV lower branch. The oscillation responses are described below.
(1) Amplitude Response:
For RL = 11 Ω (ζtotal,UTP = 0.246, ζtotal,DTP = 0.251), the UTP and DTP experienced the VIV initial branch, followed by the VIV upper branch, ending with the VIV lower branch, indicating that the prisms only present the characteristics of VIV. That was similar to the STP, as shown in Figure 8. For 4.75 ≤ Ur ≤ 7.25, A* of UTP increased rapidly from 0 to 0.5 and approached that of STP regardless of the spacing ratio in Figure 8a. However, A* of DTP increased to 0.15~0.45 at Ur = 7.25, and the amplitude response of DTP was similar to that of STP but lower than that of STP in Figure 8b. The suppression can be observed at all the spacing ratios for DTP.
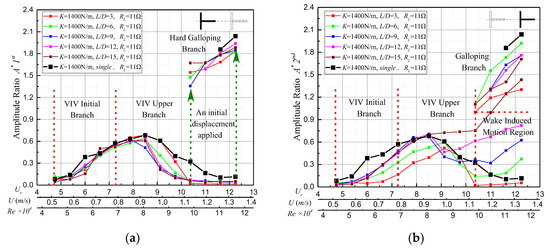
Figure 8.
Amplitude responses for UTP and DTP in HG: (a) Amplitude ratio responses of UTP; (b) Amplitude ratio responses of DTP.
In the range of 7.25 ≤ Ur ≤ 8.5, A* of UTP kept increasing with an uptrend to about 0.7, and the amplitude of UTP was close to that of STP. For 8.5 ≤ Ur ≤ 10.375, the oscillation gradually weakened, and the amplitude of UTP was lower than that of STP, which indicated that the oscillation response of UTP was similar to that of STP and UTP was negatively influenced by DTP as Ur ≥ 8.5. For Ur ≥ 10.375, the UTP experienced the VIV lower branch, and the amplitude decreased to about 0 as the velocity increased. In the VIV upper branch, the oscillation response of DTP was similar to that of STP for L/D = 3~6, and A* increased to about 0.48~0.59 at Ur = 9.125 and then started to decrease. In the range of L/D = 9~12, the wake vortex of UTP had a positive influence on DTP, so that the amplitude of DTP increased with a slight upward trend to 0.15D~0.6D. In addition, A* of DTP kept increasing with a slight uptrend; the amplitude varied from 0.45D to 0.75D for L/D = 15. As Ur ≥ 10.375, the amplitude response of DTP was higher than that of STP for L/D = 6~15, which showed that the DTP was positively promoted by UTP. The VIV lower branch did not appear in the wake-induced motion (WIM) region. In the WIM region, the maximum amplitude of DTP varied from 0.4D (L/D = 6) to 1.47D (L/D = 15) at Ur = 12.25.
For 10.375 ≤ Ur ≤ 12.25, there was an initial displacement applied to the UTP and DTP. A stable growth in the amplitude of UTP can be observed as the velocity increases. Amplitude varied from 1.35D (L/D = 9) at Ur = 10.375 to 1.94D (L/D = 12) at Ur = 12.25. If Ur continued to increase, the oscillation would remain in the galloping branch. Furthermore, the amplitude of DTP was lower than that of UTP and STP in general due to the wake of UTP, while the A* of DTP varied from 1.05 (L/D = 3, Ur = 10.375) to 1.94 (L/D = 6, Ur = 12.25).
(2) Frequency Responses:
In the VIV initial branch (4.75 ≤ Ur ≤ 7.25), the frequency responses of both UTP and DTP were close to that of STP regardless of the spacing ratios in Figure 9a; f* for all the conditions increased gradually from 0.6 to 0.75. In the range of 7.25 ≤ Ur ≤ 10.375, the f* of UTP was a little higher than that of STP, and the f* of UTP continued to increase from 0.75 to about 1~1.35 with a strong upward trend. In the VIV upper branch, the f* of DTP dropped and increased with different spacing ratios, as shown in Figure 9b. The f* of DTP was close to that of STP until Ur = 9.125. As Ur ≥ 9.125, the f* of L/D = 9~15 decreased from 0.9 to about 0.8, and the f* of L/D = 3~6 increased to about 1.05~1.30 with a slight upward trend. As Ur ≥ 10.375, the f* of UTP dropped and increased in the VIV lower branch, and the f* of DTP continued to increase, varying from 1.2 (L/D = 3) to 1.38 (L/D = 6). For L/D = 9~15, the f* of DTP almost remained at 0.8 in the WIM region. In the galloping branch, the f* of UTP and DTP was similar to that of STP and almost remained at 0.65~0.75 in Figure 9.
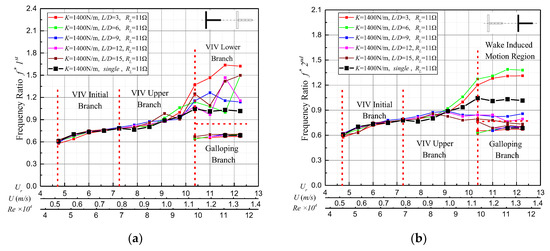
Figure 9.
Frequency responses of UTP and DTP in HG: (a) Frequency ratio responses of UTP; (b) Frequency ratio responses of DTP.
3.1.2. Typical Oscillation Responses of Soft Galloping (SG)
In the tests, under increasing velocity and no manual external excitation, UTP and DTP vibrated freely. Then, after applying an external force at Ur = 12.25, UTP entered VIV lower and DTP entered the WIM branch. As velocity decreased to a certain value (Ur = 10.375), UTP and DTP suddenly jumped in the VIV-galloping transition branch. The oscillation responses are described below.
(1) Amplitude Responses:
For RL = 21 Ω (ζtotal,UTP = 0.153, ζtotal,DTP = 0.152), the STP oscillated freely and experienced the VIV initial branch, followed by the VIV-galloping branch and ended with the soft galloping branch, as shown in Figure 10.
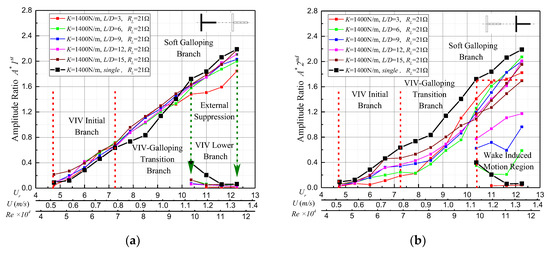
Figure 10.
Amplitude responses for UTP and DTP in SG: (a) Amplitude ratio responses of UTP; (b) Amplitude ratio responses of DTP.
In Figure 10a, the amplitude response of UTP was similar to that of STP, and the amplitude of UTP was a little higher than that of STP as Ur ≤ 9.75. In the galloping branch, the amplitude of UTP was lower than that of STP, but the amplitude of different spacing ratios was similar. In Figure 10b, the suppression can be observed at all the spacing ratios for DTP; as the spacing ratio increased, the negative influence gradually decreased for 6 ≤ L/D ≤ 15 in the VIV initial branch and transition branch. For 7.25 ≤ Ur ≤ 10.375, the amplitude of L/D = 3 increased sharply from 0.2D to 1.4D, but the amplitude was still lower than that of STP because the disturbance from the wake of UTP on DTP was stronger. In the galloping branch (10.375 ≤ Ur ≤ 12.25), the amplitude curves of DTP intersected with each other and for all spacing ratios were also lower than those of STP. In addition, in the WIM region, the amplitude of DTP was much higher than that of STP for 6 ≤ L/D ≤ 15. The A* of DTP varied from 0.59 (L/D = 6) to 1.69 (L/D = 15) at Ur = 12.25. For L/D = 3, the amplitude of DTP was lower than that of STP.
(2) Frequency Responses:
The frequency responses of UTP were similar to those of STP, and the f* of UTP almost remained at 0.65~0.75 as the velocity increased. In the VIV upper branch, the f* of STP was a little higher than that of UTP. The frequency response of DTP was also similar to that of STP, but there were some fluctuations as the velocity increased. In the WIM region, the f* of DTP was lower than that of STP and similar to the f* of the galloping branch for 6 ≤ L/D ≤ 15, as shown in Figure 11.
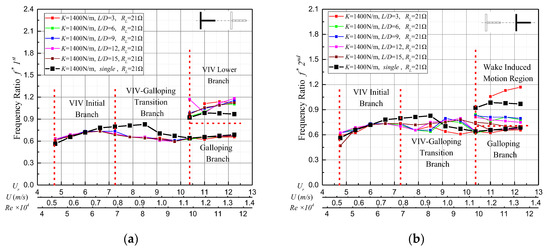
Figure 11.
Frequency responses of UTP and DTP in SG: (a) Frequency ratio responses of UTP; (b) Frequency ratio responses of DTP.
In summary, the amplitude and frequency of UTP were similar to those of STP in both HG and SG with the variation of flow velocity, indicating that the oscillation responses of UTP and STP were basically the same. The amplitude of DTP in VIV (initial branch, upper branch) and galloping was less than that of UTP and STP, indicating that the oscillation intensity of DTP was weakened by the wake of UTP. In the WIM region, there was an evident upward trend in the amplitude of DTP with the increase of the flow velocity, and the uptrend became more significant as the spacing ratio increased, indicating that DTP experienced WIM due to the influence of the wake, and as the spacing ratio increased, the WIM became stronger.
3.2. Energy Conversion of Two T-Section Prisms in Tandem
The active power and the efficiency of UTP, DTP, and UTP + DTP in the tests were plotted versus Ur, U, and Re in Figure 12. The figure also shows the energy conversion curve of STP with the same configuration for comparison considering the variation of the energy conversion characteristics followed a similar trend. The observations are discussed in detail below.
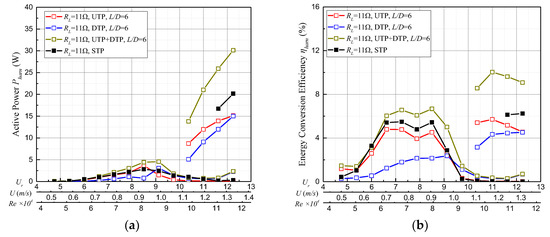
Figure 12.
Energy conversion curves of UTP and DTP for L/D = 6, RL = 11 Ω (ζtotal,UTP = 0.246, ζtotal,DTP = 0.251) compared to STP: (a) Active power; (b) Energy conversion efficiency.
3.2.1. Typical Energy Conversion of Hard Galloping (HG)
At 4.75 ≤ Ur ≤ 8.5, the four active power curves exhibited an upward trend as the velocity increased, and the active power and efficiency of UTP were similar to those of STP which were higher than those of DTP. The local maximum active power of UTP + DTP was 4.42 W; the corresponding efficiency was 6.67%. For Ur ≥ 9.125, the active power and energy conversion efficiency of the system (UTP, DTP, STP) started to decrease; as the velocity continuously increased, the oscillation entered the VIV lower branch (10.375 ≤ Ur ≤ 12.25), as shown in Figure 12.
For Ur ≥ 9.75, DTP increased compared with UTP; the Pharn of DTP increased as the velocity increased and reached 2.25 W, which was much higher than in STP and UTP, as shown in Figure 13. For Ur = 12.25, the Pharn of the galloping branch was about 15.01 W higher than that of the WIM branch, and the voltage time-history curve of the WIM branch was more unstable. It can be concluded that the energy conversion capacity in the WIM branch was poor.
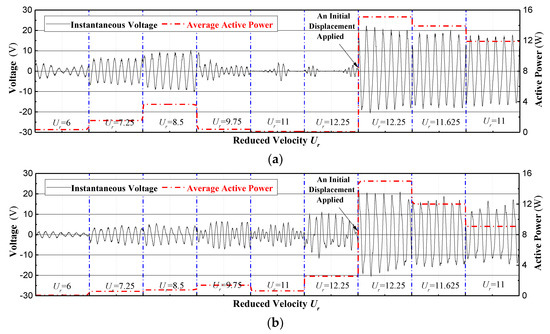
Figure 13.
The instantaneous voltage and active power of different reduced velocities for HG: (a) Upstream prism; (b) Downstream prism.
In the galloping branch, the active power and efficiency of UTP and DTP jumped to about 15 W and 4.5%, respectively, at 12.25, and those of UTP were a little higher than those of DTP, as shown in Table 5. Although the values were lower than those of STP, the active power and efficiency of UTP + DTP were about 1.5 times higher than those of STP.
Table 5.
Comparison of energy conversion for UTP+DTP of L/D = 6 to STP in HG.
3.2.2. Typical Energy Conversion of Soft Galloping (SG)
In Figure 14, in the range of 4.75 ≤ Ur ≤ 12.25, the four active power curves increased with an evident upward trend as the velocity increased. The energy conversion of UTP was similar to that of STP, but the active power and efficiency of UTP were a little lower than those of STP in the galloping branch. For Ur ≤ 8.5, the suppression of energy conversion of DTP was obvious, so the active power and efficiency of DTP were lower than those of UTP and STP due to the wake of UTP. In the galloping branch (10.375 ≤ Ur ≤ 12.25), the active power and efficiency of DTP were also lower than those of STP, as shown in Table 6.
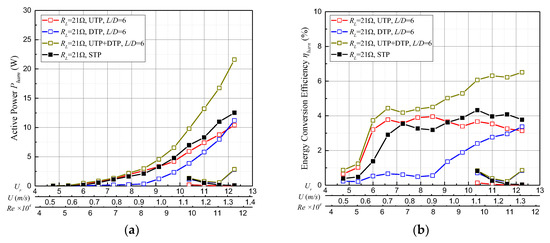
Figure 14.
Energy conversion curves of UTP and DTP for L/D = 6, RL = 21 Ω (ζtotal,UTP = 0.153, ζtotal,DTP = 0.152) compared to STP: (a) Active power; (b) Energy conversion efficiency.
Table 6.
Comparison of energy conversion for UTP+DTP of L/D = 6 to STP in SG.
In the VIV lower branch, the wake of UTP had a positive influence on DTP, the system of DTP output had more active power than that observed for STP and UTP, but the instantaneous voltage fluctuated, as shown in Figure 15. The local maximum active power of DTP reached 2.80 W, and the corresponding efficiency was 0.85%.
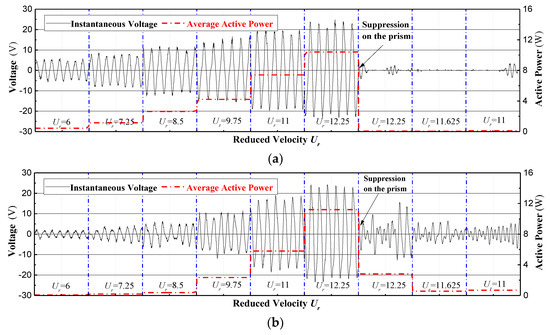
Figure 15.
The instantaneous voltage and active power of different reduced velocities for SG: (a) Upstream prism; (b) Downstream prism.
In summary, the global energy conversion optimum branch was the galloping branch. The active power and efficiency of UTP and DTP were lower than those of STP with the same configuration. However, the active power of UTP + DTP was about 1.5 times that of STP. In the tests, mutual interference between UTP and DTP transformed from negative to positive as the velocity increased.
3.3. The Effects of Load Resistances and Spacing Ratios on Energy Conversion
The dependence of active power and the efficiency of the damping ratio and spacing ratio were studied and discussed separately based on the experimental results.
3.3.1. Effect of Damping Ratio on Energy Conversion
(a) For UTP (1st), the active power curves crossed each other, and the rules were similar. As the load resistances decreased, the active power and the efficiency increased considerably for 11 Ω ≤ RL ≤ 21 Ω, as shown in Figure 16. For 16 Ω ≤ RL ≤ 41 Ω, SG occurred; the UTP experienced the VIV initial branch, followed by the VIV-galloping transition branch and ended with the galloping branch. For Ur ≥ 8.5, the active power gradually increased from 1.93 W~3.11 W to 6.14 W~13.44 W. For 11 Ω ≤ RL ≤ 13 Ω, as the velocity increased, the VIV occurred; for Ur ≥ 10.375, HG occurred. The active power of UTP changed from 8W (RL = 13 Ω) to 16.63 W (RL = 11 Ω) at Ur = 12.25. However, the efficiency did not exhibit an upward trend but maintained a stable value. As the load resistances decreased, the active power and efficiency increased. In the tests, the active power and efficiency of UTP at the load resistance of RL = 8 Ω were lower than the corresponding values at RL = 11 Ω.
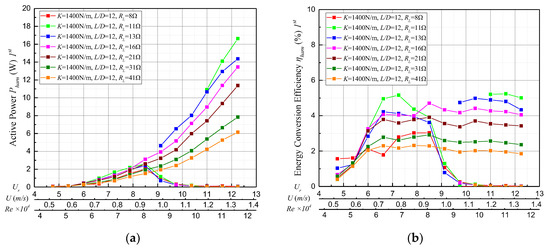
Figure 16.
Energy conversion of UTP under various load resistances: (a) Active power; (b) Energy conversion efficiency.
(b) For DTP (2nd), in the VIV responses, the active power showed a slight upward trend as the velocity increased. The active power changed from 1.67 W (RL = 8 Ω) to 5.0 W (RL = 13 Ω) and at Ur = 12.25 was higher than that of UTP. In the VIV lower branch, for 16 Ω ≤ RL ≤ 41 Ω, the active power was also higher than that of UTP. In the galloping branch, the active power increased from 5.21 W (RL = 41 Ω) to 12.47 W (RL = 11 Ω) at Ur = 12.25 as the load resistances decreased to a certain value RL (11 Ω).
At the load resistances of 11 Ω ≤ RL ≤ 41 Ω, decreasing the load resistance resulted in increases in efficiency; the efficiency of DTP changed from 1.52% (RL = 41 Ω) to 3.67% (RL = 11 Ω) respectively, as shown in Figure 17.
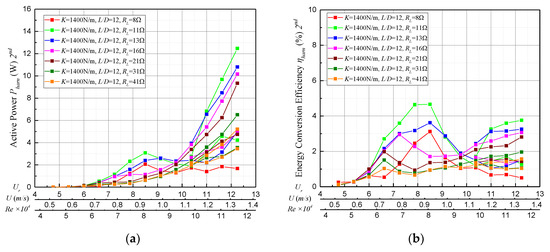
Figure 17.
Energy conversion of DTP at various load resistances: (a) Active power; (b) Energy conversion efficiency.
3.3.2. Effect of Spacing Ratio on Energy Conversion
(a) For UTP, Ur ≤ 9.125, the prism performed better compared to STP in terms of active power and efficiency for RL = 21 Ω, shown in Figure 18. As Ur ≥ 9.125, the active power and efficiency of the STP were higher than those of UTP. At the end of the galloping branch at Ur = 12.25, Pharn = 11.36 W, L/D = 12, corresponding, ηharn = 3.43%. The active power and efficiency of STP (Pharn = 12.52 W, ηharn = 3.78%) were a little higher at Ur = 12.25, as shown in Figure 18.
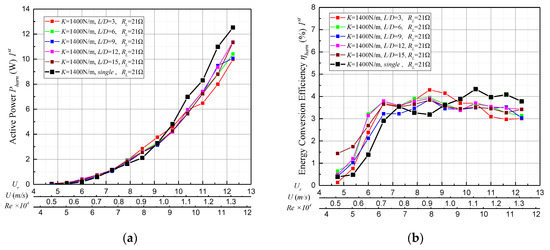
Figure 18.
Energy conversion of UTP at various spacing ratios for RL = 21 Ω: (a) Active power; (b) Energy conversion efficiency.
For UTP, 3 ≤ L/D ≤ 6, SG occurred; as the velocity increased, the active power gradually increased to 14.14 W (L/D = 6) at Ur = 12.25, corresponding to ηharn = 4.26%; the values were lower than those of STP (Pharn = 16.33 W, ηharn = 4.92%) for RL = 13 Ω. For 9 ≤ L/D ≤ 15, HG occurred, and UTP performed worse compared to STP in terms of active power and efficiency, shown in Figure 19.
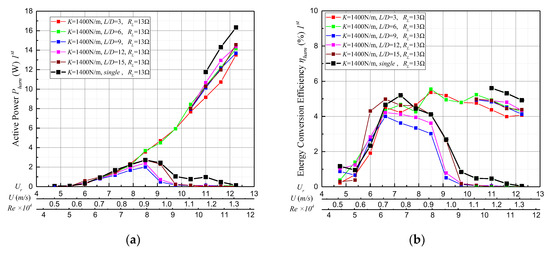
Figure 19.
Energy conversion of UTP at various spacing ratios for RL = 13 Ω: (a) Active power; (b) Energy conversion efficiency.
(b) For DTP, slight suppression was observed for RL = 21 Ω; due to the disruption of the flow between two T-section prisms, the active power and efficiency of DTP were lower than those of UTP and STP. The overall performance of DTP was better at L/D = 6; the active power and efficiency reached 11.2 W and 3.38%, respectively, at Ur = 12.25, as shown in Figure 20.
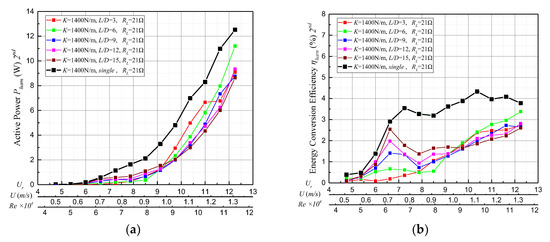
Figure 20.
Energy conversion of downstream prisms at various spacing ratios for RL = 21 Ω: (a) Active power; (b) Energy conversion efficiency.
For DTP, 3 ≤ L/D ≤ 6 and L/D = 15, the active power and efficiency begun to increase sharply as the velocity increased for Ur ≥ 9.125. The active power climbed to 13.79 W (L/D = 6), 11.56 W (L/D = 3), and 8.87 W (L/D = 15) at Ur = 12.25, corresponding to ηharn = 4.15%, ηharn = 3.48%, ηharn = 2.67%; these values are lower than those of the STP (Pharn = 16.33 W, ηharn = 4.92%) for RL = 13Ω. For 9 ≤ L/D ≤ 12, in the VIV lower branch, the DTP performed better compared to the STP in terms of active power and efficiency as shown in Figure 21.
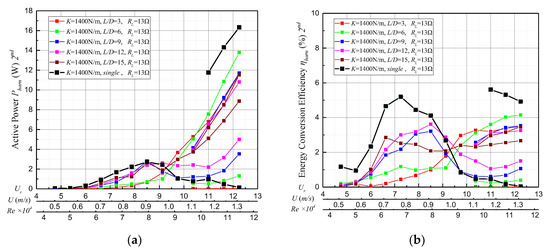
Figure 21.
Energy conversion of DTP at various spacing ratios for RL = 13 Ω: (a) Active power; (b) Energy conversion efficiency.
3.3.3. Optimal Energy Conversion of UTP + DTP
During the texts, under increasing velocity and no manual external excitation, UTP and DTP vibrated freely. For different load resistances, external excitation or suppression was applied to the prism. In general, the active power of UTP+DTP increased with the flow velocity and exhibited drops and jumps, as shown in Figure 22.
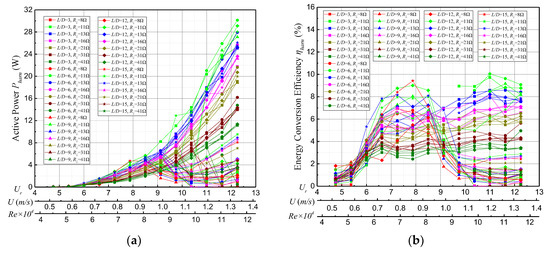
Figure 22.
Active power and efficiency at K = 1400 N/m: (a) Active power; (b) Energy conversion efficiency.
(1) For RL = 8 Ω, the active power of UTP + DTP increased as the velocity increased until Ur = 8.5; the local maximum active power was 4.72 W (L/D = 15). As the velocity continuously increased, the active power showed a downward trend at Ur = 8.5 which was consistent with the STP case. For most spacing ratios, the active power decreased to about 0. With the variation of the spacing ratio, the active power showed a similar response.
(2) For RL = 11 Ω, as the velocity increased, the VIV phenomenon occurred for all spacing ratios. The active power increased as the velocity increased and then decreased at Ur = 8.5; the local maximum active power was 5.68 W, which appeared at L/D = 12. The same also occurred at L/D = 12 and L/D = 15 for RL = 13 Ω. In addition, if there was an initial displacement applied to UTP and DTP, the prisms sharply entered the galloping branch with large amplitude and had more output power. The optimal spacing ratio of active power existed for the two T-section prisms. In particular, at a lower spacing ratio, there was a negative effect on the active power. The DTP was disturbed by the alternate shedding vortex from UTP, affecting the oscillation responses. In the tests, the optimal active power of Pharn = 30.12 W (L/D = 6) was that of a single prism (20.12 W), i.e., 1.5 times for RL = 11 Ω.
(3) For 16 Ω ≤ RL ≤ 41 Ω, the active power increased as the flow velocity increased for 4.75 ≤ Ur ≤ 12.25. Lower load resistances resulted in higher active power. In general, the active power of L/D = 6 performed best, and as spacing ratio increased, the variation of active power was slight. For RL = 16 Ω, the local maximum active power of UTP + DTP at different spacing ratios at Ur = 12.25 was 21.7 W (L/D = 3), 25.67 W (L/D = 6), 23.2 W (L/D = 9), 23.61 (L/D = 12), and 20 W (L/D = 15); these values are less than twice the value of STP.
In summary, the comparison of active power for UTP+DTP to STP in the galloping branch for each spacing ratio with the same configuration is presented in Table 7. A few observations can be drawn.
Table 7.
Comparison of active power for UTP + DTP to STP at RL = 11 Ω.
For 4.75 ≤ Ur ≤ 8.5~9.125, the active power variation of UTP + DTP was similar to that of STP; the system started to output power at a flow velocity of 0.516 m/s in the tests. A steady growth was observed as the velocity increased until Ur = 8.5~9.125, and then a drop occurred. As velocity increased, oscillation was experienced in the VIV lower branch; the active power of UTP + DTP for L/D ≥ 6 was much higher than that of STP and increased as velocity increased in this region. For RL = 11 Ω, in the range of 10.375 ≤ Ur ≤ 12.25, if there was an initial displacement applied to the prism, the active power of UTP+DTP increased sharply in all tests due to the increase in amplitude caused by the external excitation for both UTP and DTP. As the velocity decreased, the amplitude and the active power decreased. In the galloping branch (10.375 ≤ Ur ≤ 12.25), HG occurred, the optimal configuration of UTP+DTP enhanced the active power by around 1.5 times, and the best performance in active power was at a spacing ratio of L/D = 6, followed by spacing ratios of L/D = 12 (29.10 W), L/D = 15 (28.04 W), and L/D = 9 (27.10 W); the lowest occured at L/D = 3 (25.36 W), as shown in Table 7.
4. Conclusions
The synergistic FIM and the energy conversion capacity of two T-section prisms in tandem were investigated experimentally for various values of the spacing ratio, damping ratios, and Reynolds numbers of 45,263 ≤ Re ≤ 116,842, which fall in the TrSL3 flow regime. The results, including oscillatory response, active power, and the efficiency of the two T-section prisms, were analyzed and presented. The effect of load resistances and spacing ratio on energy conversion were presented and discussed separately. The following conclusions can be drawn from the tests conducted.
(1) For all the tested spacing ratios, the amplitude of UTP was generally lower than that of STP. Except for RL = 13 Ω and 3 ≤ L/D ≤ 6, the UTP underwent SG instead of the VIV that occurred for STP because of the positive influence from DTP. The amplitude of DTP was also lower than that of STP in general. One particularly notable phenomenon was that the amplitude of DTP continuously increased as the velocity increased and was higher than that of STP for 8 Ω ≤ RL ≤ 13 Ω and Ur ≥ 8.5 due to the wake of UTP.
(2) The WIM phenomenon was observed for DTP for 6 ≤ L/D ≤ 15 and 8 Ω≤ RL ≤ 41 Ω, accompanied by an evident upward trend in the amplitude of DTP with the increase of the flow velocity and a stronger WIM as the spacing ratio increased.
(3) In the VIV lower branch, the hydrokinetic power harnessed by UTP + DTP (9.52 W, L/D = 15) was much higher than that of STP (0.32 W) at Ur = 12.25, mainly because the wake of UTP had a positive influence on the DTP, resulting in the growth of energy conversion.
(4) For UTP and DTP, the active power curves that varied with load resistances crossed each other, and the rules were similar. As the load resistances decreased, the active power increased considerably for 11 Ω ≤ RL ≤ 41 Ω.
(5) For different spacing ratios, both UTP and DTP were suppressed to different degrees due to the mutual interference. Except for RL = 13 Ω and 3 ≤ L/D ≤ 6, the UTP output power gradually increased as the velocity increased and underwent soft galloping because of the positive influence from DTP. For 8 Ω ≤ RL ≤ 13 Ω, the active power of DTP increased as Ur ≥ 8.5.
(6) In the tests, the highest active power occurred at Ur = 12.25 for L/D = 6, RL = 11 Ω, and Pharn = 30.12 W, corresponding to ηharn = 9.08%. The highest efficiency reached in this set of tests was 10.04%. It occurred at Ur = 12.25 for L/D = 6 and RL = 11 Ω, corresponding to Pharn = 21.02 W. The active power of UTP and DTP was lower than that of STP in general. It can be concluded that the active power of UTP + DTP was less than twice that the STP, and the optimal active power of two T-section prisms (30.12 W, L/D = 6) in the tests was that of single prism (20.12 W), i.e., 1.5 times for RL = 11 Ω.
Author Contributions
G.X. provided methodology. F.L. designed the experiments; N.S., H.D., and Z.Z. performed the experiments; X.Y. and N.S. analyzed the data; N.S. built and wrote the majority of the manuscript text; all authors reviewed the manuscript. X.Y. and X.W. made contributions to the structure and language of the manuscript. All authors have read and agree to the published version of the manuscript.
Funding
This research was funded by [General Program of National Natural Science Foundation of China] grant number [51779166] and [National Natural Science Foundation of China] grant number [No. 51909190].
Acknowledgments
This work is supported by the National Natural Science Foundation of China (No. 51909190). All workers from the State Key Laboratory of Hydraulic Engineering Simulation and Safety of Tianjin University are acknowledged. The authors are also grateful for the assistance of the anonymous reviewers.
Conflicts of Interest
The authors declare no conflict of interest.
References
- Bernitsas, M.M.; Raghavan, K.; Ben-Simon, Y.; Garcia, E.M.H. VIVACE (Vortex Induced Vibration Aquatic Clean Energy): A new concept in generation of clean and renewable energy from fluid flow. J. Offshore Mech. Arct. Eng. 2008, 130, 041101. [Google Scholar] [CrossRef]
- Rostami, A.B.; Armandei, M. Renewable energy harvesting by vortex-induced motions: Review and benchmarking of technologies. Renew. Sustain. Energy Rev. 2017, 70, 193–214. [Google Scholar] [CrossRef]
- Zhou, T.; Mohd Razali, S.F.; Hao, Z.; Cheng, L. On the study of vortex-induced vibration of a cylinder with helical strakes. J. Fluid Struct. 2011, 27, 903–917. [Google Scholar] [CrossRef]
- King, R.; Johns, D.J. Wake interaction experiments with two flexible circular cylinders in flowing water. J. Sound Vib. 1976, 45, 259–283. [Google Scholar] [CrossRef]
- Zdravkovich, M.M. Review of flow interference between two circular cylinders in various arrangements. ASME J. Fluids Eng. 1977, 99, 618–633. [Google Scholar] [CrossRef]
- Zdravkovich, M.M. Flow induced oscillations of two interfering circular cylinders. J. Sound Vib. 1985, 101, 511–521. [Google Scholar] [CrossRef]
- Zdravkovich, M.M. The effects of interference between circular cylinders in cross flow. J. Fluid Struct. 1987, 1, 239–261. [Google Scholar] [CrossRef]
- Zhou, Y.; Yiu, M.W. Flow structure, momentum and heat transport in a two-tandem-cylinder wake. J. Fluid Mech. 2006, 548, 17. [Google Scholar] [CrossRef]
- Igarashi, T. Characteristics of the flow around two circular cylinders arranged in tandem: 1st report. JSME Int. J. 1981, 29, 2061–2067. [Google Scholar] [CrossRef]
- Bokaian, A.; Geoola, F. Wake-induced galloping of two interfering circular cylinders. J. Fluid Mech. 1984, 146, 383–415. [Google Scholar] [CrossRef]
- Bokaian, A.; Geoola, F. Wake displacement as cause of lift force on cylinder pair. J. Eng. Mech. 1985, 111, 92–99. [Google Scholar] [CrossRef]
- Yao, X.L.; Chen, Q.F. Experimental research on two circular cylinders in tandem arrangements at critical reynolds numbers. J. Vib. Eng. 1994, 7, 17–22. (In Chinese) [Google Scholar]
- Mahir, N.; RockWell, D. Vortex formation from a forced system of two cylinders. Part I: Tandem arrangement. J. Fluid Struct. 1996, 10, 473–489. [Google Scholar] [CrossRef]
- Mahir, N.; RockWell, D. Vortex formation from a forced system of two cylinders. Part II: Side-by-side arrangement. J. Fluid Struct. 1996, 10, 491–500. [Google Scholar] [CrossRef]
- Brika, D.; Laneville, A. Wake interference between two circular cylinders. J. Wind Eng. Ind. Aerodyn. 1997, 72, 61–70. [Google Scholar] [CrossRef]
- Williamson, C.H.K.; Roshko, A. Vortex formation in the wake of an oscillating cylinder. J. Fluid Struct. 1988, 2, 355–381. [Google Scholar] [CrossRef]
- Meneghini, J.R.; Saltara, F.; Siqueira, C.L.R.; Ferrari, J.A., Jr. Numerical simulation of flow interference between two circular cylinders in tandem and side-by-side arrangements. J. Fluid Struct. 2001, 15, 327–350. [Google Scholar] [CrossRef]
- Bearman, P.W.; Wadcock, A.J. The interaction between a pair of circular cylinders normal to a stream. J. Fluid Mech. 1973, 61, 499. [Google Scholar] [CrossRef]
- Williamson, C.H.K. Evolution of a single wake behind a pair of bluff bodies. J. Fluid Mech. 1985, 159, 1–18. [Google Scholar] [CrossRef]
- Lin, J.C.; Yang, Y.; RockWell, D. Flow past two cylinders in tandem: Instantaneous and averaged flow structure. J. Fluid Struct. 2002, 16, 1059–1071. [Google Scholar] [CrossRef]
- Alam, M.M.; Moriya, M.; Sakamoto, H. Aerodynamic characteristics of two side-by-side circular cylinders and application of wavelet analysis on the switching phenomenon. J. Fluid Struct. 2003, 18, 325–346. [Google Scholar] [CrossRef]
- Alam, M.M.; Moriya, M.; Takai, K.; Sakamoto, H. Fluctuating fluid forces acting on two circular cylinders in a tandem arrangement at a subcritical Reynolds number. J. Wind Eng. Ind. Aerodyn. 2003, 91, 139–154. [Google Scholar] [CrossRef]
- Lee, K.; Yang, K.S.; Yoon, D.H. Flow-induced forces on two circular cylinders in proximity. Comput. Fluids 2009, 38, 111–120. [Google Scholar] [CrossRef]
- Assi, G.R.S.; Bearman, P.W.; Meneghini, J.R. On the wake-induced vibration of tandem circular cylinders: The vortex interaction excitation mechanism. J. Fluid Mech. 2010, 661, 365–401. [Google Scholar] [CrossRef]
- Feng, Z.P.; Zhang, Y.X.; Zang, F.G. Numerical simulation of fluid-structure interaction for tube bundles. Appl. Math. Mech. 2013, 34, 1165–1172. (In Chinese) [Google Scholar]
- Feng, Z.P.; Zhang, Y.X.; Zang, F.G. Study on flow induced vibration characteristics of two inline tubes and two parallel tubes. Nucl. Power Eng. 2014, 35, 87–91. (In Chinese) [Google Scholar]
- Sumner, D.; Price, S.J.; PaÏDoussis, M.P. Flow-pattern identification for two staggered circular cylinders in cross-flow. J. Fluid Mech. 2000, 411, 263–303. [Google Scholar] [CrossRef]
- Sumner, D. Two circular cylinders in cross-flow: A review. J. Fluid Struct. 2010, 26, 849–899. [Google Scholar] [CrossRef]
- Zhang, M.; Zhao, G.; Wang, J. Study on fluid-induced vibration power harvesting of square columns under different attack angles. Geofluids 2017, 2017, 1–18. [Google Scholar] [CrossRef]
- Zhang, L.B.; Dai, H.L.; Abdelkefi, A.; Wang, L. Experimental investigation of aerodynamic energy harvester with different interference cylinder cross-sections. Energy 2019, 167, 970–981. [Google Scholar] [CrossRef]
- Zhou, S.; Wang, J. Dual serial vortex-induced energy harvesting system for enhanced energy harvesting. AIP Adv. 2018, 8, 075221. [Google Scholar] [CrossRef]
- Park, H.; Kumar, R.A.; Bernitsas, M.M. Enhancement of fluid induced vibration of rigid circular cylinder on springs by localized surface roughness at 3 × 10⁴ ≤ Re ≤ 1.2 × 10⁵. Ocean Eng. 2013, 72, 403–415. [Google Scholar] [CrossRef]
- Lian, J.; Yan, X.; Liu, F.; Zhang, J.; Ren, Q.; Yang, X. Experimental investigation on soft galloping and hard galloping of triangular prisms. Appl. Sci. 2017, 7, 198. [Google Scholar] [CrossRef]
- Zhang, J.; Liu, F.; Lian, J.; Yan, X.; Ren, Q. Flow induced vibration and energy extraction of an equilateral triangle prism at different system damping ratios. Energies 2016, 9, 938. [Google Scholar] [CrossRef]
- Mannini, C.; Marra, A.M.; Massai, T.; Bartoli, G. Interference of vortex-induced vibration and transverse galloping for a rectangular cylinder. J. Fluid Struct. 2016, 66, 403–423. [Google Scholar] [CrossRef]
- Shao, N.; Lian, J.; Xu, G.; Liu, F.; Deng, H.; Ren, Q.; Yan, X. Experimental investigation of flow-induced motion and energy conversion of a T-section prism. Energies 2018, 11, 2035. [Google Scholar] [CrossRef]
- Dai, H.L.; Abdelkefi, A.; Wang, L. Theoretical modeling and nonlinear analysis of piezoelectric energy harvesting from vortex-induced vibrations. J. Intell. Mater. Syst. Struct. 2014, 25, 1861–1874. [Google Scholar] [CrossRef]
- Dai, H.L.; Abdelkefi, A.; Wang, L. Piezoelectric energy harvesting from concurrent vortex-induced vibrations and base excitations. Nonlinear Dyn. 2014, 77, 967–981. [Google Scholar] [CrossRef]
- Lai, Z.H.; Wang, J.L.; Zhang, C.L.; Zhang, G.Q.; Yurchenko, D. Harvest wind energy from a vibro-impact DEG embedded into a bluff body. Energy Convers. Manag. 2019, 199, 111993. [Google Scholar] [CrossRef]
- Kim, E.S.; Bernitsas, M.M.; Kumar, A.R. Multi-cylinder flow induced motions: Enhancement by passive turbulence control at 28,000 ≤ Re ≤ 120,000. In Proceedings of the ASME 30th International Conference on Ocean, Offshore and Arctic Engineering (OMAE), Rotterdam, The Netherlands, 19–24 June 2011; Volume 135. [Google Scholar]
- Sun, H.; Ma, C.; Kim, E.S.; Nowakowski, G.; Mauer, E.; Bernitsas, M.M. Hydrokinetic energy conversion by two rough tandem-cylinders in flow induced motions: Effect of spacing and stiffness. Renew. Energy 2017, 107, 61–80. [Google Scholar] [CrossRef]
- Kim, E.S.; Bernitsas, M.M. Performance prediction of horizontal hydrokinetic energy converter using multiple-cylinder synergy in flow induced motion. Appl. Energy 2016, 170, 92–100. [Google Scholar] [CrossRef]
- Ding, L.; Bernitsas, M.M.; Kim, E.S. 2-D URANS vs. experiments of flow induced motions of two circular cylinders in tandem with passive turbulence control for 30,000 ≤ Re ≤ 105,000. Ocean Eng. 2013, 72, 429–440. [Google Scholar] [CrossRef]
- Zhang, B.; Song, B.; Mao, Z.; Tian, W.; Li, B. Numerical investigation on VIV energy harvesting of bluff bodies with different cross sections in tandem arrangement. Energy 2017, 133, 723–736. [Google Scholar] [CrossRef]
- Zhang, B.; Wang, K.H.; Song, B.; Mao, Z.; Tian, W. Numerical investigation on the effect of the cross-sectional aspect ratio of a rectangular cylinder in FIM on hydrokinetic energy conversion. Energy 2018, 165, 949–964. [Google Scholar] [CrossRef]
- Zhang, B.; Mao, Z.; Song, B.; Ding, W.; Tian, W. Numerical investigation on effect of damping-ratio and mass-ratio on energy harnessing of a square cylinder in FIM. Energy 2017. [Google Scholar] [CrossRef]
- Gu, M.; Song, B.; Zhang, B.; Mao, Z.; Tian, W. The effects of sfigureubmergence depth on Vortex-Induced Vibration (VIV) and energy harvesting of a circular cylinder. Renew. Energy 2019. [Google Scholar] [CrossRef]
- Zhu, H.; Zhao, Y.; Zhou, T. CFD analysis of energy harvesting from flow induced vibration of a circular cylinder with an attached free-to-rotate pentagram impeller. Appl. Energy 2018, 212, 304–321. [Google Scholar] [CrossRef]
- Lin, D. Research on Flow Induced Motion of Multiple Circular Cylinders with Passive Turbulence Control; Chong Qing University: Chong Qing, China, 2013. (In Chinese) [Google Scholar]
- Zdravkovich, M.M. Flow around Circular Cylinders. Volume 1: Fundamentals; Oxford Science Publications: Oxford, UK, 1997. [Google Scholar]


© 2020 by the authors. Licensee MDPI, Basel, Switzerland. This article is an open access article distributed under the terms and conditions of the Creative Commons Attribution (CC BY) license (http://creativecommons.org/licenses/by/4.0/).