Abstract
Textural and intensity changes between Visible Spectrum (VS) and Infra-Red (IR) images degrade the performance of feature points. We propose a new method based on a regression technique to overcome this problem. The proposed method consists of three main steps. In the first step, feature points are detected from VS-IR images and Modified Normalized (MN)-Scale Invariant Feature Transform (SIFT) descriptors are computed. In the second step, correct MN-SIFT descriptor matches are identified between VS-IR images with projection error. A regression model is trained on correct MN-SIFT descriptors. In the third step, the regression model is used to process the MN-SIFT descriptors of test VS images in order to remove misalignment with the MN-SIFT descriptors of test IR images and to overcome textural and intensity changes. Experiments are performed on two different VS-IR image datasets. The experimental results show that the proposed method works really well and demonstrates on average 14% and 15% better precision and matching scores compared to recently proposed Histograms of Directional Maps (HoDM) descriptor.
1. Introduction
Visible Spectrum (VS) and Infra-Red (IR) images are used in a wide variety of computer vision applications, such as image registration [1,2], face recognition [3], scene category recognition [4], stereo matching [5] and medical image analysis [6]. IR images provide complementary information to visible spectrum images in order to make image analysis more reliable [4].
In the last two decades, a large number of feature point detectors and descriptors have been proposed [7]. These detectors and descriptors have been designed for grayscale and RGB images to overcome common types of transformations and deformations between the images [8]. In cross-spectral applications, such as VS-IR image matching, the detectors and descriptors under perform due to high textural and intensity changes between VS-IR images [9]. To overcome this problem, several new and modified versions of Scale Invariant Feature Transform (SIFT) [10] have been proposed in order to minimize the effects of intensity and textural changes between the images by using features such as Canny edges [11], local contrast and differential excitations [12], local binary patterns [13,14], normalized gradients [15] and local self similarity [16] for descriptor construction.
In contrast, this paper proposes a regression based method to overcome the effects of intensity and textural changes. The proposed method consists of three steps. In the first step it detects SIFT feature points [10]. Then it computes Modified Normalized(MN)-SIFT [17] descriptors for every detected feature point. It identifies correct MN-SIFT descriptor matches between pairs of training VS-IR images with projection error [18]. It fits a regression model on correct MN-SIFT descriptors. The MN-SIFT descriptors of test VS images are passed through the regression model to remove the effects of textural and intensity changes prior to their descriptor matching with the MN-SIFT descriptors of test IR images. To the best of our knowledge, no similar method exists in the literature. The main contributions of this paper are as follows:
- A performance evaluation of different feature point detectors and descriptors on VS-IR images.
- A new regression based method for VS-IR image matching.
2. Related Work
Intensity and textural changes between multisensor images degrade the performance of feature points. Various new and modified versions of SIFT algorithm have been proposed to overcome such changes. Gradient Orientation Modification (GOM)-SIFT, is an extension of SIFT, to makes the SIFT descriptor robust against textural and intensity changes. It is based on modifying image gradients around the SIFT feature points [1] and then uses the modified gradients for descriptor construction. Orientation Restricted (OR)-SIFT is based on a similar idea. It computes SIFT descriptors and combines the elements of the SIFT descriptor in the opposite orientation directions [2] to overcome textural and intensity changes.
In the Edge Oriented Histogram (EOH) method, the distribution and orientation of Canny edges are used instead of image gradients for descriptor construction [5]. The EOH descriptor works well on VS-IR images but under performs in the presence of rotational changes between the images. Directional filters are used in Reference [11] to overcome this problem and to construct VAR-EOH descriptors. Similarly, the image edges are computed with Local Contrast (LC) and Differential Excitation (DE) kernels and are used instead of image gradients in the SIFT algorithm to compute LC-SIFT and DE-SIFT descriptors [12].
In the Local Binary Patterns of Gradients (LBPG) [14] approach, the Center Symmetric Local Binary Patterns (CSLBP) [13] is used to modify both gradient magnitude and orientation maps around the feature points. This gives modified image gradients, which are used as features in the construction of LBPG descriptor. LBPG shows superior performance against textural and intensity changes but its large descriptor size (256 dimensions) makes the descriptor matching process computationally expensive. To overcome this limitation, image gradients around the feature points are normalized and used as features in the construction of Normalized Gradient (NG)-SIFT descriptors [15]. NG-SIFT works well on multisensor images of structured scenes, but under performs on textured scene images. In the Modified Normalized gradient (MN)-SIFT method, the MN features are used to overcome this problem [17].
The Local Self Similarity (LSS) descriptor [16] uses self-similarity of pixels, edges, and repetitive patterns in descriptor construction. The extended versions of LSS are Dense Adaptive Self Correlation [19] and Fully Convolutional Self Similarity [20] descriptors, both they are computed in a dense manner over the whole image.
Ye et al. [21] propose a phase congruency approach. They generate features by computing amplitude and orientation of the phase congruency model to match multi-modal images. They call the descriptor as Histogram of Orientated Phase Congruency (HOPC), which encapsulates both edges and structural information for multi-modal image matching.
Kim et al. [22] propose Local Self Similarity Frequency (LSSF) descriptors. They compute LSSF with features, which are obtained through frequency domain analysis of local internal layout of the self similarities. The LSSF employs a correlation surface to reduce intensity and textural differences between VS and near IR images. LSSF is invariant to rotational changes and uses a log polar binning scheme for descriptor construction.
Sedaghat and Ebadi propose an adaptive binning strategy to construct descriptors for remote sensing images [23]. They use Hessian affine feature point detector to extract normalized image patches for descriptor construction. Unlike SIFT, they use an adaptive histogram quantization strategy to incorporate both location and gradient orientation information to make the descriptors robust against viewpoint, intensity and textural changes.
Nunes and Padua compute descriptors by extracting structural properties of the image [24]. They use log-Gabor filters and named the descriptor as Multispectral Feature Descriptor (MFD). Similarly, Sobel filters are used in four different directions to compute Histograms of Directional Maps (HoDM) descriptor [25]. Binary descriptors such as Oriented FAST and Rotated BRIEF (ORB) [26] and Binary Robust Invariant Scalable Keypoints (BRISK) [27] are also used to overcome intensity changes between the images. There are some methods, which employ the theory of physics to understand the phenomena of textural and intensity changes to improve the cross spectral image matching results [28,29].
In Reference [9], the authors compare different descriptors on multisensor images using the image matching framework of [18]. These descriptors are gradient based descriptors like SIFT, NG-SIFT, LG-SIFT, DE-SIFT, MN-SIFT, and intensity order based descriptors [30], Haar wavelet based descriptors [31] and Local binary pattern based descriptors [13,14]. It is shown that descriptors computed on normalized image patches extracted through Harris feature points [32] and SIFT feature points demonstrate better performance than descriptors computed on normalized image patches extracted with ORB and Brisk detectors. It is also shown that MN-SIFT compared to others, demonstrates better results on multisensor images.
The regression method proposed in this paper is also based on MN-SIFT descriptors. It uses MN-SIFT descriptors to train a regression model to overcome textural and intensity changes between VS-IR images. The regression model processes the MN-SIFT descriptors of test VS images prior to their descriptor matching with the MN-SIFT descriptors of IR images and improves the image matching results.
3. Proposed Method
This section presents the proposed method. It consists of three main steps: feature point detection, MN-SIFT descriptor construction and regression model training & testing. Figure 1 shows a block diagram for the proposed method. Each block is briefly described below:
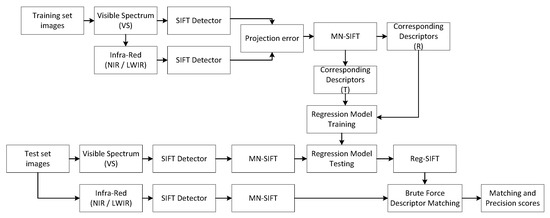
Figure 1.
Proposed regression based method for image matching between Visible Spectrum–Infra-Red (VS-IR) images.
3.1. Image Datasets
We use two different image datasets: (i) RGB-NIR dataset [4], and (ii) Multimodal Stereo dataset (MSD) [5]. The RGB-NIR dataset consists of Visible Spectrum (VS: 400–700 nm) and Near-Infra-Red (NIR: 750–1100 nm) images of 477 different indoor and outdoor scenes. The MSD dataset consists of VS and Long-Wave-Infra-Red (LWIR: 800–1500 nm) images of 100 different outdoor scenes. We randomly divide each dataset into two disjoint sets: Training set and Test set. The training set consists of 10 percent image pairs of the dataset and only used for regression model training. Whereas the test set consists of the remaining 90% image pairs and used only to evaluate the proposed descriptor (Reg-SIFT) and to compare its performance with other state of the art descriptors.
3.2. SIFT Feature Point Detection
We use the SIFT feature point detector [10] to detect feature points from VS-IR images of the train and test sets. The SIFT detector is based on scale space images which are computed by convolving the input image with variable-scale Gaussian kernel.
3.3. Projection Error
Projection error () is defined as the Euclidian distance between the reference image feature points and the projected feature points [18]. The projected feature points are obtained by projecting the feature points of the target image onto reference image with a ground truth homography K. This homography is known in advance between the reference and target images according to Reference [18,33]. We use a threshold of 2 pixels as projection error in this paper to identify corresponding feature points between the reference and target images for the proposed methods.
3.4. MN-SIFT
To compute MN-SIFT [17] descriptors, a circular region around each detected SIFT feature point is cropped from the image. The radius of the region is proportional to scale () of the SIFT feature point. The region is sub divided into location bins as shown in Figure 2. The bins are denoted as where . The region is convolved with kernels to obtain derivatives and along horizontal and vertical directions, respectively. The gradient magnitude () and gradient orientation () are calculated at each pixel location as:
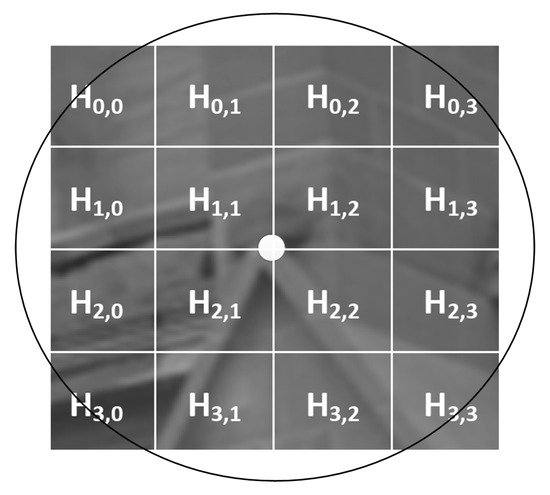
Figure 2.
An illustration of locations bins of Modified Normalized-Scale Invariant Feature Transform (MN-SIFT) [17].
Then modified gradient magnitudes () are computed as:
where and are the region’s minimum and maximum gradient magnitude values, respectively. The pixels of each location bin are identified as follows:
The pixels of a location bin are denoted as where s represents the region’s size. The gradient orientations of the region are quantized into eight different levels as follows:
where represents a modular operator i.e, the modular operation on produces . Then a feature histogram is computed for each location bin as follows:
where and is defined as:
The histograms are concatenated over all the location bins to obtain MN-SIFT descriptor.
3.5. Regression Modeling Using Corresponding Descriptors
We trained a regression model on corresponding MN-SIFT descriptors of the train set. To understand the training process, let I and I be two images of the same scene. These images depict the same scene contents in VS and IR bands, respectively. Feature points are detected on I and I images and the feature point locations (pixels) are stored as and , respectively, where , . u and v represent total number of feature points detected on I and I images, respectively. The feature points of I are projected onto I with a homography K, which acts as ground truth data between I and I. This homography is known in advance between every VS-IR images of the training set according to Reference [18,34]. We use a projection error of 2 pixels to identify corresponding feature points between I and I. Figure 3 shows detected and corresponding feature points as blue ’+’ and green ’o’ between VS-LWIR images of a MSD scene. respectively.
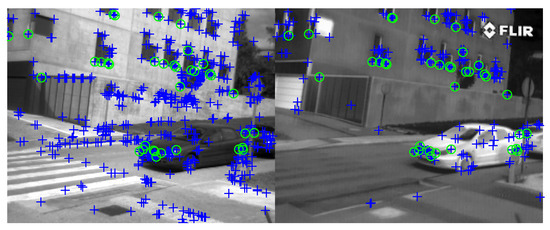
Figure 3.
Feature points are shown as ’+’ and the repeated /corresponding feature points as ’o’.
Then MN-SIFT descriptors are computed for corresponding feature points. Such descriptors are referred to as corresponding/correct descriptors. Let be a descriptor of image and let its corresponding descriptor match is in image:
where represents the length of and MN-SIFT descriptors. Let be a model function that gives an error when it is subtracted from the first element of :
where are the parameters of which are required to be learnt to minimize the error i.e., square of error between the first element of and the model function . To learn , projection error equal to or less than 2 pixels is used to identify n corresponding MN-SIFT descriptors between and images. Then corresponding descriptors are stored as R and T matrices where and are corresponding MN-SIFT descriptors, which are stored as the ith row of R and T, where . With n corresponding descriptors, n errors are obtained as:
Here is learnt with an objective to minimize i.e., sum of squared error. Similarly, , , …, are learnt with the same objective to minimize , respectively, where
The regression modeling, as explained above, was based on a single image pair, that is, and . In the case of a dataset, for instance RGB-NIR and MSD datasets, each dataset is randomly divided into two disjoint sets. One set for training and the other one for testing. The corresponding descriptors are obtained from each image pair of the training set and are appended as rows to from matrices R and T. SIFT detector gives on average 380 corresponding feature points per image pair with projection error of equal to less than 2 pixels. If there are 10 image pairs in the training set, then total number of corresponding descriptors (i.e rows of R and T) obtained is and the unknown s of the model functions are learnt on these corresponding descriptors as explained above.
In fact s represent the parameters of a regression model. In this paper we use five different regression models to compute the proposed -SIFT. These regression models are Linear Regression (LR), Decision Tree Regression (DTR), Random Forest Regression (RFR), Support Vector Machine Regression (SVMR) and Multi-Layer Perceptron Regression (MLPR). All these models are implemented in Python with Sklearn library except the MLPR, which is implemented using the Keras and Tensorflow libraries.
Figure 1 shows -SIFT block, which is obtained by processing the MN-SIFT descriptors of test VS images with the trained regression model. We are using five different models; therefore, . To understand the processing of MN-SIFT to get Reg-SIFT, consider and be two images of the test set depicting the same scene in VS and IR bands, respectively. SIFT feature points are detected and MN-SIFT descriptors are computed. Let and be two sets of MN-SIFT descriptors that belong to and images, respectively, where and . Total number of descriptors computed for and images are denoted as w and z, respectively. Each descriptor is processed through the regression model (i.e., testing) to obtain a Reg-SIFT descriptor () and then the Reg-SIFT descriptors are matched with the MN-SIFT descriptors () of image . To understand the process, let be an MN-SIFT descriptor which is converted into a Reg-SIFT descriptor as follows:
After that, image matching using Reg-SIFT is carried out and the matching results are compared with state of the art descriptors.
We use MN-SIFT for proposed Reg-SIFT because of its better robustness towards intensity and textual changes. MN-SIFT is based on MN features, which contain both local textural and structure information and performs well in cross spectral applications compared to NG-SIFT in [9] . NG-SIFT encapsulates only the structural information [15]. The experimental results of [9] show that MN-SIFT demonstrates better performance on multisensor images than SIFT, LC-SIFT, LBPG, DE-SIFT, and CS-LBP descriptors.
Another reason for choosing MN-SIFT is its descriptor construction process, which is simple compared to that of EOH, LSS, MFD and HoDM descriptors. EOH uses Canny edges. The detection of Canny edges is relatively simple on VS images, but fails on LWIR/NIR images due to low contrast. LSS is based on local self-similarity between a small region and a larger one around the feature points and computed with sum of square differences approach. MFD uses directional Log-Gabor filters. These filters are more computationally expensive than simple directional filters used in MN-SIFT. HoDM uses Sobel filters in four different directions to compute image gradients. Then absolute values of the gradients are calculated and the weak gradients are suppressed with a hypothesis. The four image gradient values at each pixel location are compared and binarized. The absolute and binary gradients are then read with a spatial pooling scheme to compute HoDM descriptors. The HoDM process is also computationally expensive than MN-SIFT.
4. Experimental Setup and Results
This section presents image matching, image datasets, evaluation criteria, experimental setup and results.
4.1. Image Matching
Image matching is used as a test problem in this paper to evaluate the performance of Reg-SIFT and to present a comparison of Reg-SIFT with respect to state of the art feature point descriptors. Image matching is widely used as a test problem for the performance evaluation of feature points [15,34,35,36]. In this paper, an image matching framework of Heinly et al. [18] is used which is based on projection error. Image matching is carried out in three steps [18]: (i) Feature point detection (ii) Feature point description and (iii) Feature point matching. Image matching is performed between pairs of images of the same scene under scale, rotation, affine, and common type of deformations and transformations. In this paper, the image matching is performed between VS and IR images, which possess high textural and intensity changes.
4.2. Feature Points
We use OpenCV implementation of SIFT, Oriented FAST and Rotated BRIEF (ORB) [26], Speeded Up Robust Features (SURF) [31], and Binary Robust Invariant Scalable Keypoints (BRISK) [27] feature points. Whereas CS-LBP, LBPG, LC-SIFT, DE-SIFT, NG-SIFT, MN-SIFT and other descriptors are computed with publicly available source codes.
4.3. Descriptor Matcher
We use a Brute Force Descriptor Matcher (BFDM) of OpenCV for descriptor matching. BFDM is based on L2 norm (Euclidean distance) and Hamming distance. L2 norm is suitable for SIFT, CS-LBP, GLOH, LIOP, LBPG, LC-SIFT, DE-SIFT, NG-SIFT, MN-SIFT and Reg-SIFT descriptors whereas hamming distance is best for binary descriptors such as BRIEF, ORB, FREAK, and BRISK.
4.4. Evaluation Criteria
BFDM returns a list of putative descriptor matches, which we store in a matrix from as:
where and are two descriptors of VS/RGB and LWIR/NIR images, respectively. If BFDM identifies them as a putative match then we use logic 1 otherwise 0 to store the matching result. To identify correct and false matches present in matrix M, we compute a ground truth matrix with the help of projection error [18] as follows:
If the feature points of and descriptors are at , they are assigned a logic 1 otherwise logic 0. Then the total number of correct () and false () matches are computed as follows:
Matching and precision scores are computed as performance metrics [18,34]. Matching score is a ratio between number of correct descriptor matches () and smaller of the number of descriptors in the pair of images ( ). Precision is defined as a ratio between number of correct descriptor matches () and total number of descriptor matches (). Matching and precision scores are computed on image pair basis of the test set as illustrated in Figure 4 and then average matching and precision scores are presented.
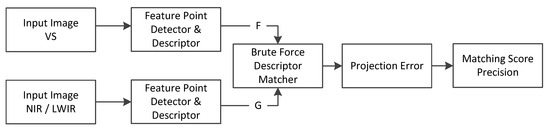
Figure 4.
Image matching frame work for performance evaluation of feature points on VS and near infra-red/long-wave-infra-red (NIR/LWIR) images of the test set.
4.5. Experimental Results
The experimental results are divided into three parts. In the first part, a comparison of different feature point detectors is presented with objective to identify the best ones for VS-IR images. Repeatability score and number of correspondences are used as performance metrics for this comparison. The repeatability score is defined as a fraction of feature points, identified as corresponding feature points between two images. In the second part, the two best detectors are paired with seventeen different descriptors one by one in order to find the best detector-descriptor combinations for VS-IR images. In the third part, the proposed Reg-SIFT is computed with LR, DTR, RFR, SVMR and MLPR regression techniques for comparison and the best regression technique is selected for subsequent comparisons where the Reg-SIFT is compared with the best detector-descriptor pair of the second part.
4.5.1. Comparison of Feature Point Detectors
We use SIFT, SURF, ORB, BRISK, FAST and Harris [32] detectors. Table 1 shows the comparison results. It can be seen that SIFT detector obtains on average the best performance compared to other detectors. It demonstrates the best number of feature point correspondences and repeatability scores, that is, 903% and 62.3%, respectively, on RGB-NIR dataset. Harris detector achieves the second best results. Harris obtains the best results on MSD followed by the SIFT detector.

Table 1.
Average number of correspondences and repeatability scores (%) achieved by different detectors on RGB-NIR and multimodal stereo dataset (MSD) datasets. Maximum value in each column is highlighted with bold face font.
4.5.2. Comparison of Feature Point Descriptors
We pair Harris and SIFT detectors with different descriptor types for this comparison. Harris and SIFT detectors are chosen based on their better performance on VS-IR images compared to other detectors as discussed in the previous section. Harris and SIFT detectors are paired one by one with seventeen different descriptor types to evaluate the performances of different detector-descriptor combinations on RGB-NIR and MSD datasets and to identify the best detector-descriptor combinations for VS-IR images. The comparison is based on average matching and precision scores. We use a notation detector+descriptor to represent a detector-descriptor pair. For example SIFT + ORB means that detector is SIFT and the descriptor is ORB. BFDM is used for descriptor matching.
Table 2 shows average matching score. SIFT + SIFT achieves a matching score of 34% on RGB-NIR dataset whereas Harris+SIFT achieves 24% matching score. SIFT + MN-SIFT achieves the best matching score of 46% on RGB-NIR dataset and outperforms all other descriptor combinations with SIFT detector. In case of Harris detector, Harris + HoDM demonstrates the best performance. It can be seen that descriptors combination with SIFT detector gives better results compared to pairing descriptors with Harris detector. The matching scores achieved on MSD are very low compared to RGB-NIR dataset. This is due to very high textural and intensity changes between VS-LWIR images compared to RGB-NIR images. The comparison shows that SIFT + HoDM obtains better results and outperforms all others detector-descriptor combinations on MSD dataset. Similarly, Harris + HoDM also demonstrates good results on MSD.
Table 2.
Average matching score (%) achieved by different detector-descriptor pairs on RGB-NIR and MSD datasets for image matching. Maximum value in each column is highlighted with bold face font.
Table 3 shows average precision score obtained by different detector-descriptor combinations. SIFT+MN-SIFT and Harris+HoDM demonstrates the best precision scores on RGB-NIR dataset whereas SIFT+HoDM and Harris+HoDM outperform others on MSD. The above comparisons show that combining SIFT detector with different descriptors produces better results than combining descriptors with Harris detector. Thats why, we use SIFT detector to detect feature points to compute MN-SIFT and Reg-SIFT descriptors, in the proposed method.
Table 3.
Average precision score (%) achieved by different detector-descriptor pairs on RGB-NIR and MSD datasets for image matching. Maximum value in each column is highlighted with bold face font.
4.5.3. Comparison between Proposed Descriptor and State of the Art
In this section the performance of the proposed descriptor (Reg-SIFT) is compared with different state of the art descriptors. The comparison is based on average matching and precision scores. Only SIFT detector is used as it obtains better results than Harris detector on VS-IR images. Reg-SIFT and other descriptors evaluated in this section are computed for SIFT feature points.
Table 4 shows a comparison between different regression models for computing Reg-SIFT descriptors. The models which are compared are LR, DTR, RFR, SVMR and MLPR. The Reg-SIFT computed with LR model is referred to as -SIFT, similarly for other models. The comparison shows that MLPR model gives better precision and matching scores compared to others. In the subsequent sections we use MLPR for Reg-SIFT, to compare its performance with seventeen different descriptors.
Table 4.
Average matching and precision scores (%) achieved by Reg-SIFT using different regression techniques.
Figure 5 shows image matching results obtained on a MSD scene. Each sub-figure shows a reference (left: VS) and a target (right: LWIR) image. SIFT feature points are detected and SIFT, MFD, HoDM, and Reg-SIFT (MLPR) descriptors are computed. Descriptor matching is carried out with BFDM. Correct and false descriptor matches are shown as green and blue lines, respectively. Correct and false descriptor matches are identified with projection error less than or equal to 2 pixels as explained above. It can be seen that SIFT+SIFT gives only one correct match. It obtains matching and precision scores of 0.5% and 0.8%, respectively. SIFT+MFD obtains 9% matching and 24% precision scores. SIFT + HoDM obtains matching and precision scores of 12% and 44%, respectively. Whereas the proposed Reg-SIFT works really well. It obtains matching and precision scores of 20.5% and 72.4%, respectively, (see Figure 5d) and outperforms SIFT, MSD and HoDM. Reg-SIFT obtains almost 8.5% (matching) and 28.4% (precision) better scores than HoDM.
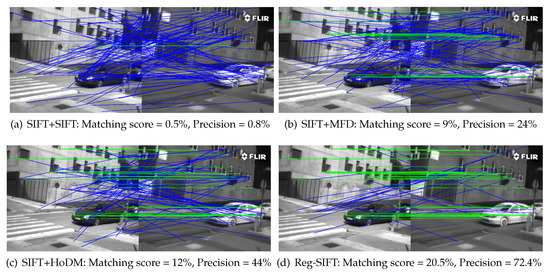
Figure 5.
Image matching results achieved on a scene of MSD with SIFT, MFD, HoDM and Reg-SIFT. SIFT detector is used. Green and blue lines connect correct and false descriptor matches, respectively. Each sub-figure shows a VS (left) and a LWIR (right) image.
Figure 6 shows a comparison of proposed descriptor with seventeen different state of the art descriptors. It can be seen that the proposed descriptor obtains average matching score of 60% and 27% on RGB-NIR and MSD datasets respectively, and outperforms all other descriptors. Similarly the average precision scores shows that the proposed descriptor achieves 81% and 37% scores on RGB-NIR and MSD dataset respectively, and outperforms all other descriptors. Compared to HoDM, the proposed descriptor demonstrates 15% and 13% better matching and precision scores on RGB-NIR dataset. Whereas on MSD, it performs 11% (matching) and 14% (precision) better than HoDM, respectively.
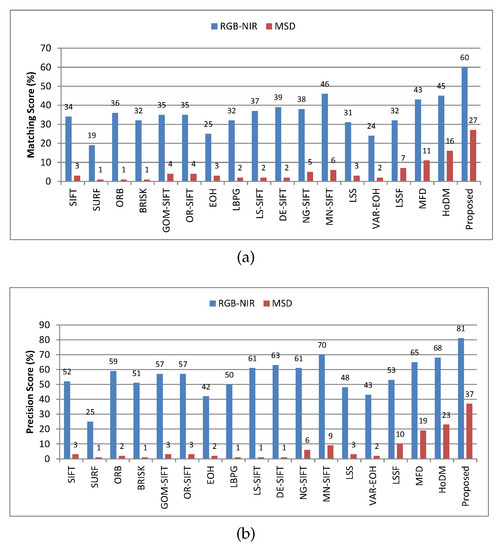
Figure 6.
(a) Average matching and (b) precision scores and precision scores achieved on MSD and RGB-NIR datasets with proposed Reg-SIFT (MLPR) and other descriptors.
The experimental results show that state of the art descriptors do not perform well on VS-LWIR images. This is due to very high textural and intensity changes between VS-LWIR compared to RGB-NIR images. SIFT, GOM-SIFT, OR-SIFT, LC-SIFT, NG-SIFT and MN-SIFT, all obtain less than 7% matching scores whereas LSSF, MFD and HoDM demonstrates better matching scores compared to them. Similarly, the precision scores show that descriptors also under perform on VS-LWIR images. Compared to them the proposed Reg-SIFT descriptor achieves better results.
4.5.4. Descriptor Matching Using Different Matching Strategies
Table 5 presents a comparison between Reg-SIFT and state of art descriptors using different feature matching strategies. The matching strategies used are Triangle Area Representation (TAR) [37], Fast Sample Consensus (FSC) [38], Locally Linear Transforming (LLT) [39], Particle Swarm Optimization Sample Consensus (PSOSAC) [40], and Guided Locality Preserving Matching (GLPM) [41]. The ratio test based matching, which is used in [10,42] can also be used but it normally works well only on SIFT descriptors.
Table 5.
Average matching scores (%) achieved by different descriptors using different feature matching strategies. The Scale-Invariant-Feature transform (SIFT) detector is used for feature point detection.
Similarly, Table 6 shows average precision score (%) based comparison between Reg-SIFT and others using different feature matching strategies, respectively. Both comparisons show that the performance of descriptors varies with respect to feature matching strategies and Reg-SIFT (MLPR) compared to others, works really well with all of them and outperforms all other descriptors.
Table 6.
Average precision scores (%) achieved by different descriptors using different feature matching strategies. SIFT detector is used for feature point detection.
4.5.5. Computational Complexity
This section presents computational complexity comparisons. All the experiments are performed on a single desktop PC, with Window 7 as operating system and i5-2520M CPU and 16 GB memory space. GPU and parallel computations are not used.
Table 7 shows the average time taken (in seconds) by different feature point detectors to detect 1000 feature points per image. Ten different images of the same size, that is, 1024 × 768 are used and then average time is presented. The comparison shows that the FAST detector takes less time on average to detect feature points compared to other detectors.
Table 7.
Average time taken by different detectors to detect 1000 feature points per image.
Table 8 shows average time taken (in seconds) by different descriptor construction methods to compute 1000 descriptors per image. Ten different images of the same size, that is, 1024 × 679 are used for this comparison. Then, average time is reported in the table. The comparison shows that ORB takes less time on average to compute descriptors compared to others.
Table 8.
Average time taken by descriptor construction methods to construct 1000 descriptors per image.
5. Conclusions
Textural and intensity changes between visible spectrum and infrared images degrade the performance of feature points. The proposed method overcomes such changes by training a regression model on correct feature point descriptor matches. It uses the regression model to align the descriptors prior to their descriptor matching. The experimental results show that the proposed method gives promising results. It gives relatively better results on RGB-NIR images compared to VS-LWIR images. The experimental results show that the proposed method obtains on average matching scores of 60% and 27% on RGB-NIR and MSD datasets, respectively, whereas HoDM obtains 45% and 16% average matching scores, respectively. The proposed method also achieves average precision scores of 81% and 37% and performs better than HoDM, which achieves 68% and 23% precision scores on RGB-NIR and MSD datasets, respectively. The experiments are also performed with different state-of-the-art feature matching strategies. The experimental results show that the proposed method also demonstrates better matching and precision scores with them compared to other descriptors.
Author Contributions
Conceptualization, S.S. and A.B.; methodology, S.S., and A.B.; software, S.S.; Data curation, A.B., validation, A.B.; formal analysis, S.S. and A.B.; investigation, S.S. and A.B.; resources, A.B.; writing-original draft preparation, S.S. and A.B.; writing-review and editing, S.S. and A.B.; visualization, A.B.; project administration, A.B.; funding acquisition, A.B. All authors discussed the results and contributed to the final manuscript. All authors have read and agreed to the published version of the manuscript
Funding
This research received no external funding.
Conflicts of Interest
The authors declare no conflict of interest.
References
- Yi, Z.; Zhiguo, C.; Yang, X. Multi-spectral remote image registration based on SIFT. Electron. Lett. 2008, 44, 107–108. [Google Scholar] [CrossRef]
- Vural, M.; Yardimci, Y.; Temizel, A. Registration of multispectral satellite images with orientation-restricted SIFT. IEEE Int. Geosci. Remote Sens. Symp. 2009, 3, 243–246. [Google Scholar]
- Osia, N.; Bourlai, T. A spectral independent approach for physiological and geometric based face recognition in the visible, middle-wave and long-wave infrared bands. Image Vis. Comput. 2014, 32, 847–859. [Google Scholar] [CrossRef]
- Brown, M.; Süsstrunk, S. Multi-spectral SIFT for scene category recognition. In Proceedings of the 24th IEEE Conference on Computer Vision and Pattern Recognition, Colorado Springs, CO, USA, 20–25 June 2011; pp. 177–184. [Google Scholar]
- Aguilera, C.; Barrera, F.; Lumbreras, F.; Sappa, A.D.; Toledo, R. Multispectral image feature points. Sensors 2012, 12, 12661–12672. [Google Scholar] [CrossRef]
- Godoy, S.E.; Ramirez, D.A.; Myers, S.A.; von Winckel, G.; Krishna, S.; Berwick, M.; Padilla, R.S.; Sen, P.; Krishna, S. Dynamic infrared imaging for skin cancer screening. Infrared Phys. Technol. 2015, 70, 147–152. [Google Scholar] [CrossRef]
- Mukherjee, D.; Wu, Q.J.; Wang, G. A comparative experimental study of image feature detectors and descriptors. Mach. Vis. Appl. 2015, 26, 443–466. [Google Scholar] [CrossRef]
- Van De Sande, K.; Gevers, T.; Snoek, C. Evaluating color descriptors for object and scene recognition. IEEE Trans. Pattern Anal. Mach. Intell. 2010, 32, 1582–1596. [Google Scholar] [CrossRef]
- Saleem, S.; Bais, A.; Sablatnig, R.; Ahmad, A.; Naseer, N. Feature points for multisensor images. Comput. Electr. Eng. 2017, 62, 511–523. [Google Scholar] [CrossRef]
- Lowe, D.G. Distinctive image features from scale-invariant keypoints. Int. J. Comput. Vis. 2004, 60, 91–110. [Google Scholar] [CrossRef]
- Li, Y.; Shi, X.; Wei, L.; Zou, J.; Chen, F. Assigning main orientation to an EOH Descriptor on multispectral images. Sensors 2015, 15, 15595–15610. [Google Scholar] [CrossRef]
- Saleem, S.; Sablatnig, R. A modified SIFT descriptor for image matching under spectral variations. In Proceedings of the 17th International Conference on Image Analysis and Processing, Naples, Italy, 11–13 September 2013; pp. 652–661. [Google Scholar]
- Heikkilä, M.; Pietikäinen, M.; Schmid, C. Description of interest regions with center-symmetric local binary patterns. In Computer Vision, Graphics and Image Processing; Springer: Berlin/Heidelberg, Germany, 2006; pp. 58–69. [Google Scholar]
- Saleem, S.; Sablatnig, R. Interest Region Description Using Local Binary Pattern of Gradients. In Scandinavian Conferences on Image Analysis; Springer: Berlin/Heidelberg, Germany, 2013; pp. 468–477. [Google Scholar]
- Saleem, S.; Sablatnig, R. A robust SIFT descriptor for multispectral images. IEEE Signal Proc. Lett. 2014, 21, 400–403. [Google Scholar] [CrossRef]
- Shechtman, E.; Irani, M. Matching local self-similarities across images and videos. In Proceedings of the IEEE Conference on Computer Vision and Pattern Recognition, Minneapolis, MN, USA, 17–22 June 2017; pp. 1–8. [Google Scholar]
- Saleem, S.; Bais, A.; Sablatnig, R. Towards feature points based image matching between satellite imagery and aerial photographs of agriculture land. Comput. Electr. Agric. 2016, 126, 12–20. [Google Scholar] [CrossRef]
- Heinly, J.; Dunn, E.; Frahm, J.M. Comparative evaluation of binary features. In Proceedings of the 2012 European Conference on Computer Vision, Florence, Italy, 7–13 October 2012; pp. 759–773. [Google Scholar]
- Kim, S.; Min, D.; Ham, B.; Do, M.N.; Sohn, K. DASC: Robust dense descriptor for multi-modal and multi-spectral correspondence estimation. IEEE Trans. Pattern Anal. Mach. Intell. 2017, 39, 1712–1729. [Google Scholar] [CrossRef]
- Kim, S.; Min, D.; Ham, B.; Jeon, S.; Lin, S.; Sohn, K. FCSS: Fully convolutional self-similarity for dense semantic correspondence. In Proceedings of the IEEE Conference on Computer Vision and Pattern Recognition, Honolulu, HI, USA, 21–26 July 2017. [Google Scholar]
- Ye, Y.; Shan, J.; Bruzzone, L.; Shen, L. Robust registration of multimodal remote sensing images based on structural similarity. IEEE Trans. Geosci. Remote Sens. 2017, 55, 2941–2958. [Google Scholar] [CrossRef]
- Kim, S.; Ryu, S.; Ham, B.; Kim, J.; Sohn, K. Local self-similarity frequency descriptor for multispectral feature matching. In Proceedings of the IEEE International Conference on Image Processing, Paris, France, 27–30 October 2014; pp. 5746–5750. [Google Scholar]
- Sedaghat, A.; Ebadi, H. Remote sensing image matching based on adaptive binning SIFT Descriptor. IEEE Trans. Geosci. Remote Sens. 2015, 53, 5283–5293. [Google Scholar] [CrossRef]
- Nunes, C.F.G.; Padua, F.L.C. A Local Feature Descriptor Based on Log-Gabor Filters for Keypoint Matching in Multispectral Images. IEEE Geosci. Remote Sens. Lett. 2017, 14, 1850–1854. [Google Scholar] [CrossRef]
- Fu, Z.; Qin, Q.; Luo, B.; Wu, C.; Sun, H. A local feature descriptor based on combination of structure and texture information for multispectral image matching. IEEE Geosci. Remote Sens. Lett. 2019, 16, 100–104. [Google Scholar] [CrossRef]
- Rublee, E.; Rabaud, V.; Konolige, K.; Bradski, G. ORB: An efficient alternative to SIFT or SURF. In Proceedings of the IEEE International Conference on Computer Vision, Barcelona, Spain, 6–13 November 2011; pp. 2564–2571. [Google Scholar]
- Leutenegger, S.; Chli, M.; Siegwart, R.Y. BRISK: Binary robust invariant scalable keypoints. In Proceedings of the IEEE International Conference on Computer Vision, Barcelona, Spain, 6–13 November 2011; pp. 2548–2555. [Google Scholar]
- Pavlidis, I.; Tsiamyrtzis, P.; Buddharaju, P.; Manohar, C. Biometrics: face recognition in thermal infrared. In Medical Devices and Systems; CRC Press: Boca Raton, FL, USA, 2006; pp. 625–640. [Google Scholar]
- Buddharaju, P.; Pavlidis, I. Multispectral face recognition: fusion of visual imagery with physiological information. In Face Biometrics for Personal Identification; Springer: Berlin/Heidelberg, Germany, 2007; pp. 91–108. [Google Scholar]
- Wang, Z.; Fan, B.; Wu, F. Local intensity order pattern for feature description. In Proceedings of the IEEE International Conference on Computer Vision, Barcelona, Spain, 6–13 November 2011; pp. 603–610. [Google Scholar]
- Bay, H.; Tuytelaars, T.; Van Gool, L. SURF: Speeded up robust features. In Proceedings of the European Conference on Computer Vision, Graz, Austia, 7–13 May 2006; pp. 404–417. [Google Scholar]
- Harris, C.; Stephens, M. A combined corner and edge detector. In Proceedings of the Fourth Alvey Vision Conference, Manchester, UK, 31 August–2 September 1988; pp. 147–151. [Google Scholar]
- Mikolajczyk, K.; Tuytelaars, T.; Schmid, C.; Zisserman, A.; Matas, J.; Schaffalitzky, F.; Kadir, T.; Gool, L. A comparison of affine region detectors. Int. J. Comput. Vis. 2005, 65, 43–72. [Google Scholar] [CrossRef]
- Mikolajczyk, K.; Schmid, C. A performance evaluation of local descriptors. IEEE Trans. Pattern Anal. Mach. Intell. 2005, 27, 1615–1630. [Google Scholar] [CrossRef]
- Heikkilä, M.; Pietikäinen, M.; Schmid, C. Description of interest regions with local binary patterns. Pattern Recognit. 2009, 42, 425–436. [Google Scholar] [CrossRef]
- Saleem, S.; Bais, A.; Sablatnig, R. A performance evaluation of SIFT and SURF for multispectral image matching. In Proceedings of the International Conference on Image Analysis and Recognition, Aveiro, Portugal, 25–27 June 2012; pp. 166–173. [Google Scholar]
- Zhang, K.; Li, X.; Zhang, J. A robust point-matching algorithm for remote sensing image registration. IEEE Geosci. Remote Sens. Lett. 2014, 11, 469–473. [Google Scholar] [CrossRef]
- Wu, Y.; Ma, W.; Gong, M.; Su, L.; Jiao, L. A novel point-matching algorithm based on fast sample consensus for image registration. IEEE Geosci. Remote Sens. Lett. 2015, 12, 43–47. [Google Scholar] [CrossRef]
- Ma, J.; Zhou, H.; Zhao, J.; Gao, Y.; Jiang, J.; Tian, J. Robust feature matching for remote sensing image registration via locally linear transforming. IEEE Trans. Geosci. Remote Sens. 2015, 53, 6469–6481. [Google Scholar] [CrossRef]
- Wu, Y.; Miao, Q.; Ma, W.; Gong, M.; Wang, S. PSOSAC: Particle swarm optimization sample consensus algorithm for remote sensing image registration. IEEE Geosci. Remote Sens. Lett. 2018, 15, 242–246. [Google Scholar] [CrossRef]
- Ma, J.; Jiang, J.; Zhou, H.; Zhao, J.; Guo, X. Guided locality preserving feature matching for remote sensing image registration. IEEE Trans. Geosci. Remote Sens. 2018, 56, 4435–4447. [Google Scholar] [CrossRef]
- Manzo, M.; Petrosino, A. Attributed Relational SIFT Based Regions Graph for Art Painting Retrieval. In Proceedings of the International Conference on Image Analysis and Processing, Naples, Italy, 9–13 September 2013; pp. 833–842. [Google Scholar]


© 2020 by the authors. Licensee MDPI, Basel, Switzerland. This article is an open access article distributed under the terms and conditions of the Creative Commons Attribution (CC BY) license (http://creativecommons.org/licenses/by/4.0/).