Article

Cyclic Behavior of Anchored Blind-Bolted Extended End-Plate Joints to CFST Columns

1
School of Civil Engineering and Transportation, South China University of Technology, Guangzhou 510641, China
2
State Key Laboratory of Subtropical Building Science, South China University of Technology, Guangzhou 510641, China
3
School of Civil and Transportation Engineering, Guangdong University of Technology, Guangzhou 510006, China
*
Author to whom correspondence should be addressed.
Appl. Sci. 2020, 10(3), 904; https://doi.org/10.3390/app10030904
Submission received: 31 December 2019 / Revised: 22 January 2020 / Accepted: 28 January 2020 / Published: 30 January 2020
(This article belongs to the Special Issue Advances on Structural Engineering)

Abstract

:
As the square steel tube in the tension zone is always the weakest part of moment-resisting joints, modified blind bolts (Hollo-Bolts) and a locally strengthened steel tube in the panel zone were adopted to enhance the joint performance. Cyclic loading tests were carried out on eight anchored blind-bolted extended end-plate joints between square concrete-filled steel tube (CFST) columns and steel beams. The test parameters included the end-plate thickness, steel tube wall thickness, beam section size, local strengthening connection method, blind bolt anchorage method, and stiffeners. The failure mode, hysteretic behavior, stiffness, strength, ductility, strength degradation, stiffness degradation, and energy dissipation capacity of the joints were studied and analyzed. The test results showed that the application of anchored blind bolts and a locally strengthened steel tube can fully utilize the bolt strength and significantly improve the joint performance, especially in terms of strength and strength degradation. The test observations revealed three typical failure modes for the joints, and the failure mode depended on the weakest component. In addition, the local reinforcement of C-channel and change in the anchorage method had a limited effect on the initial stiffness. Greater end-plate thickness and the use of stiffeners significantly increased the joint stiffness and decreased the rate of stiffness degradation. The use of stiffeners also significantly enhanced the ductility and energy dissipation by moving plastic hinge outward from the joints. Finally, finite element analysis (FEA) models were developed and validated against the experimental results, and the stress distribution and force transfer pattern were investigated.

1. Introduction

Concrete-filled steel tube (CFST) columns have been widely used in multistory and high-rise buildings in many countries, mainly due to their high structural efficiency, low cost and fast construction time [1,2,3,4]. Currently, most existing CFST columns are connected to H-steel beams via welding processes, but this kind of installation is complex, time consuming and costly. Moreover, it is quite difficult to ensure the quality of the site construction, and these connections are prone to brittle welding fractures. A bolted connection between a CFST column and a steel beam can solve these problems; however, it is difficult to access the inside of the hollow section, and ordinary high-strength bolts cannot be directly used in the connections. However, this problem can be overcome with blind bolts that are installed only from one side of the steel tube wall. Currently, the most commonly used blind bolts are the Hollo-Bolt, Molabolt, Flowdrill, Ajax Oneside, and Ultra-Twist.
Currently, the applications of the available blind-bolting systems are restricted to the construction of shear-resisting joints, whereas blind-bolting systems have not been developed for moment-resisting joints. This is because when the blind-bolted joint is resisting a moment, the square steel tube in the tension zone is always the weakest part due to the poor outward bending stiffnesses of the square steel tube wall; therefore, the blind bolts are unable to utilize their full strengths, which limits the performance of this type of moment-resisting joint. In a study on the flexural behavior of square CFST column joints with ordinary blind bolts, the joints typically failed due to cracking at the corner, excessive deformation of the tube face, and slippage and pull-out of the blind bolt [5,6].
Some researchers have proposed increasing the outward stiffness of steel tubes by using constructional measures for the bolted connections between the CFST columns and H-steel beams, including strengthening the panel zone of the joint or transferring the load to the sidewalls or the back of the column [5,7,8,9]. Although these measures have certain effects, they are too complicated in fabrication and are unfavourable to the construction of space connections.
A more convenient and effective method is installing an anchoring device at the end of the blind bolt to improve its anchorage performance in the tension zone, thereby enhancing the flexural behaviors of CFST column joints. Gardner and Goldsworthy [10] initially proposed welding a straight or cogged reinforcing bar to the ends of blind bolts to form a complete unit; several studies have focused on this type of modified blind bolt [11,12,13,14,15]. Thereafter, Tizani W et al. [16] extended the blind bolt and installed a nut at the end, similar to a headed stud; this bolt is referred to as the Extended Hollo-Bolt (EHB), as shown in Figure 1. Pitrakkos T et al. [17] and Agheshlui H et al. [18,19] investigated the tensile behavior of a modified blind bolt with a nut on the end. Their results indicated that an anchored blind bolt could ultimately achieve the full tensile capacity of its internal bolt and could limit the local outward deformation of the column and dramatically improve the strength and stiffness. Moreover, anchorage failure could occur for short extensions, welding fractures between the bolts and the reinforcing bars. Tizani W et al. [20,21] investigated the rotational stiffness and hysteretic performance of a blind-bolted end-plate connection to CFST columns with EHBs. Their results indicated that the connection can offer an appropriate energy dissipation capacity and ductility for its potential use in seismic design.
To date, research on anchored blind-bolted joints to CFST columns is limited, especially for cyclic loading tests, and the experimental parameters are incomplete, presenting limitations in these studies. Moreover, when considering increasing the tube wall thickness in previous studies, the thickness generally varied along its length; the traditional studies conducted on locally strengthened steel tube joints consistently increased the tube thickness in the panel zone, resulting in a less economical structure.
The objective of this study is to develop a new anchored blind-bolted moment connection to CFST columns to be applied effectively and economically. It is suggested that modified blind bolts (Hollo-Bolts) and a locally strengthened steel tube in the panel zone be used to improve the joint performance, making full use of the capability of each component and achieving a greater economic benefit. The cyclic characteristics of eight anchored blind-bolted joints to CFST columns with different configurations were analyzed and evaluated in detail.

2. Materials and Methods

2.1. Specimen Design

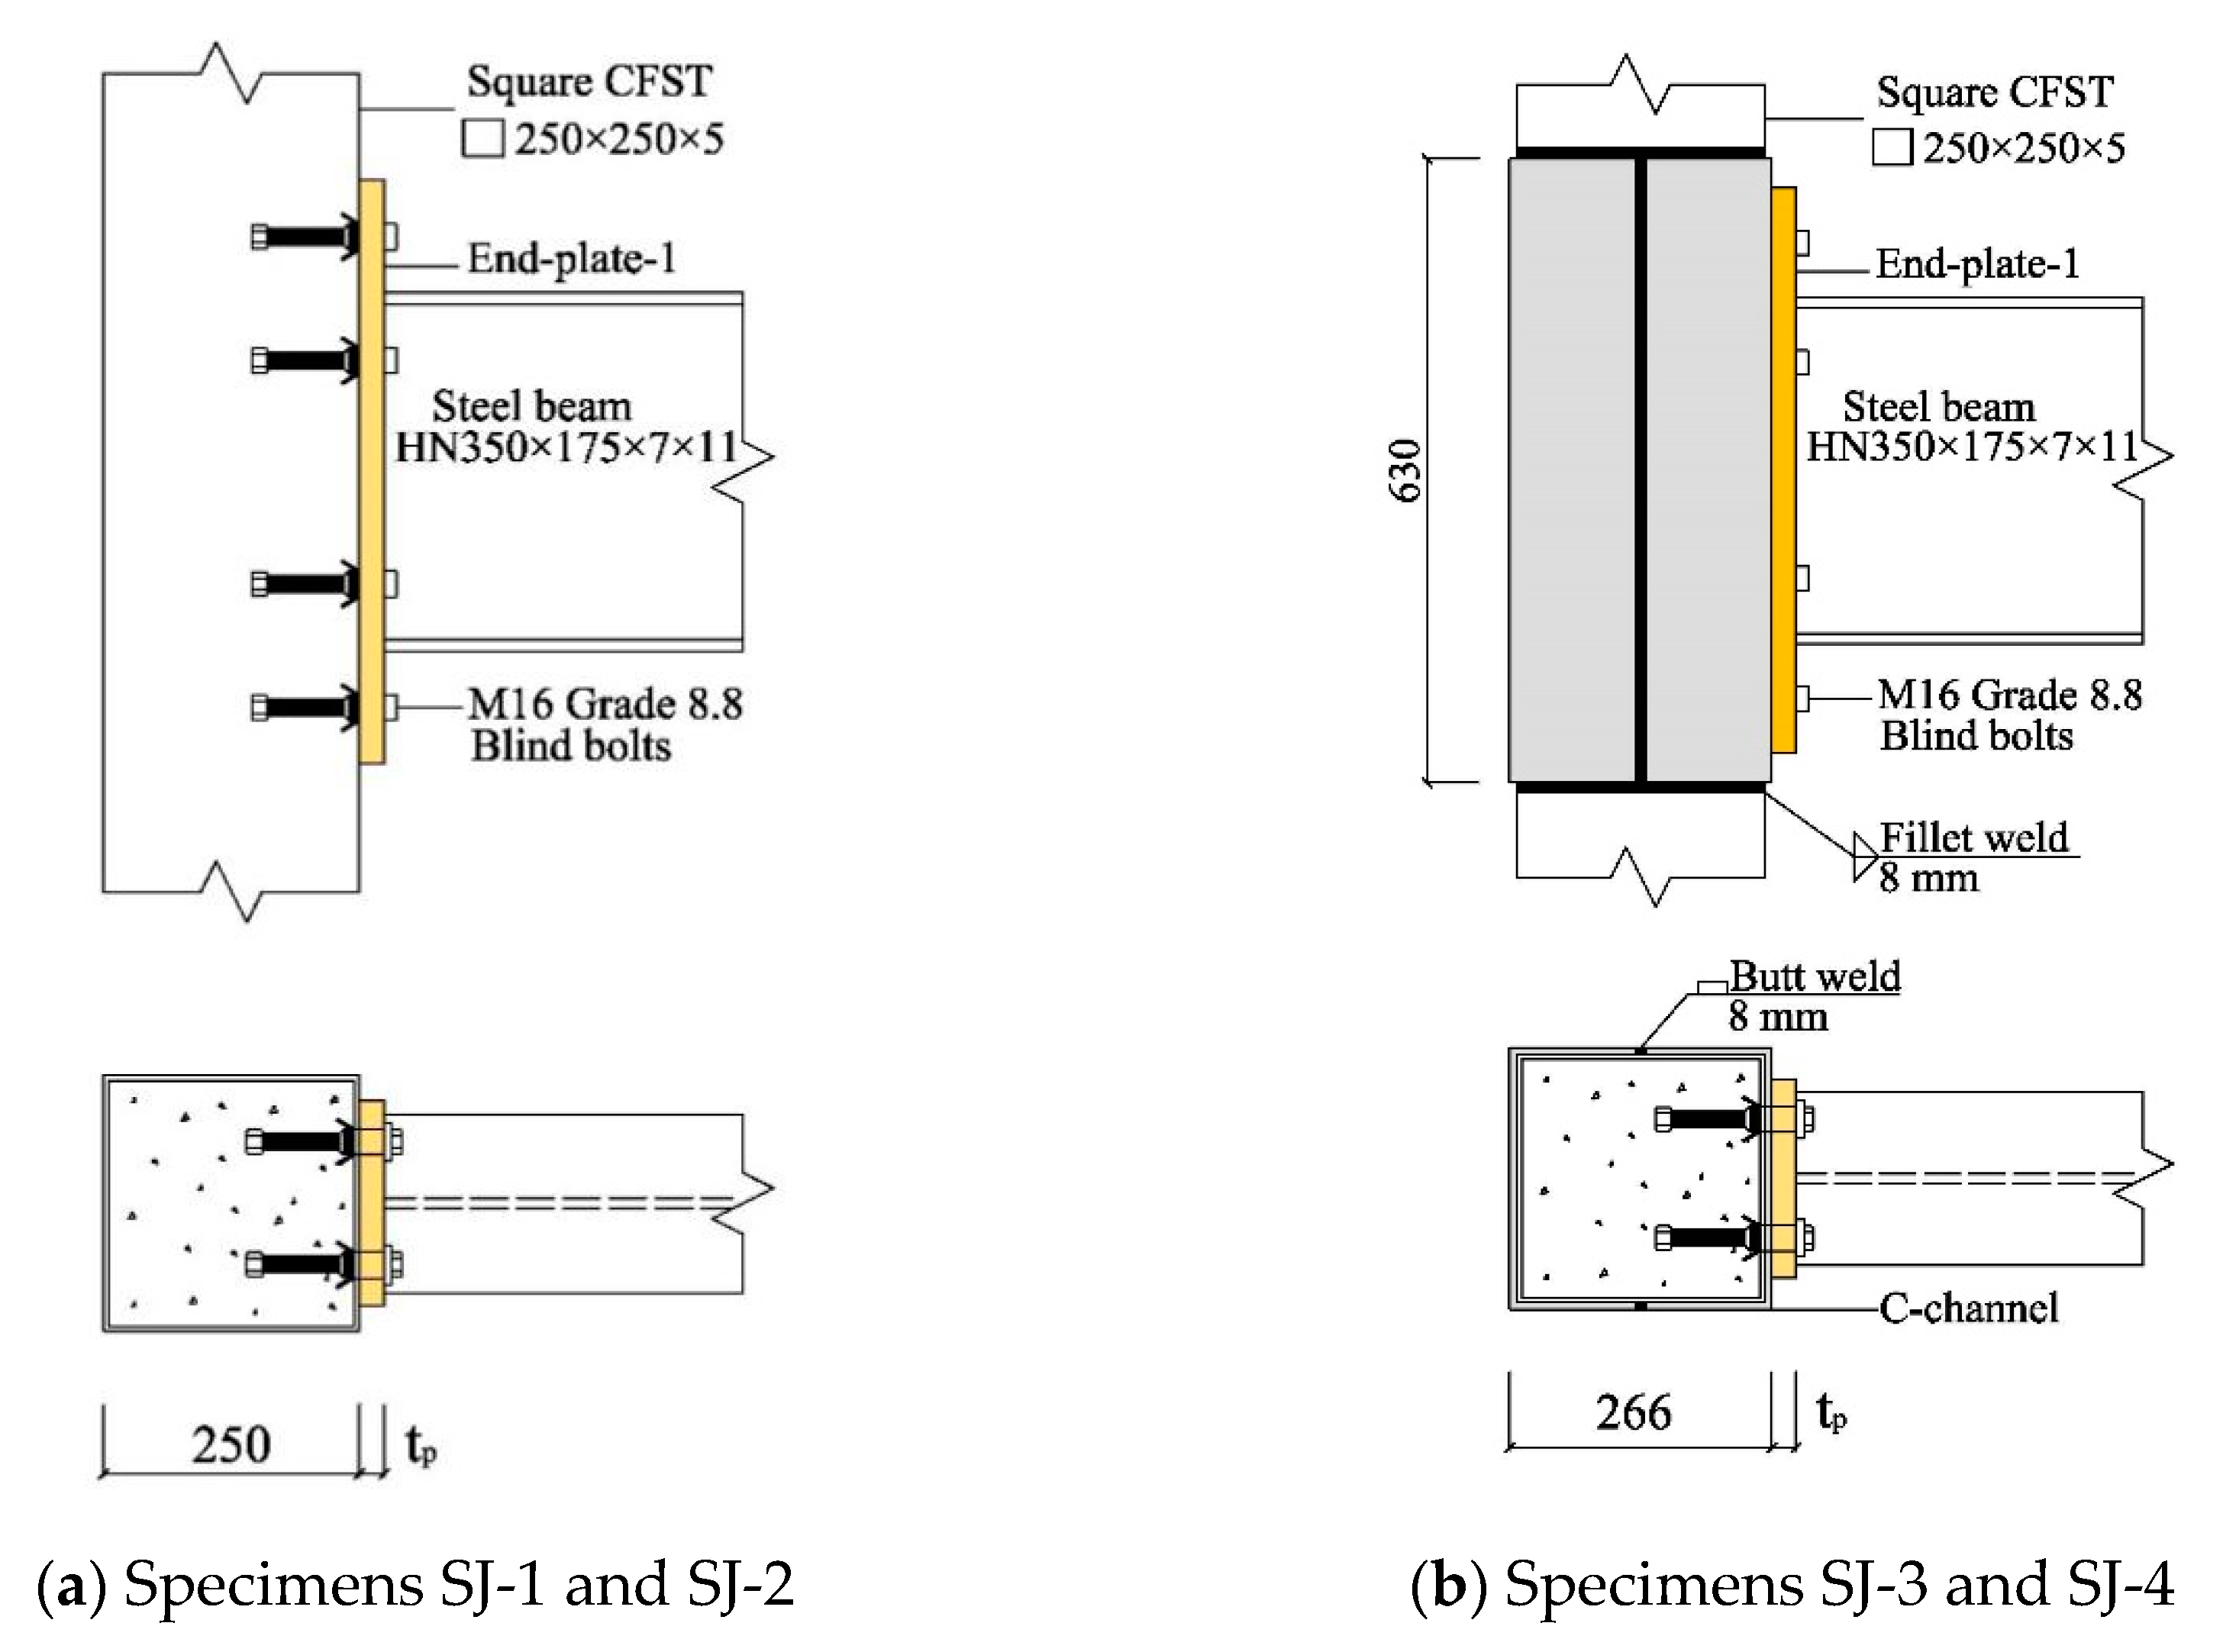
In the test, eight anchored blind-bolted extended end-plate joints between CFST columns and steel beams were designed and tested. The main parameters of the specimens are listed in Table 1, and the basic configurations of the joint are shown in Figure 2. The specimen parameters include the steel tube wall thickness in the panel zone, end-plate thickness, beam section size, local strengthening connection method, blind bolt anchorage method, and stiffeners. A cold-formed square steel tube with cross-sectional dimensions of 200 mm × 200 mm × 5 mm was used. Grade 8.8 M16 Hollo-Bolts, made in the UK, were adopted as high-strength blind bolts with extended bolt shanks and grade 8.8 anchor nuts at the end, as shown in Figure 1. The embedded depth (demb) for the blind bolts was 90 mm, which is the length along the bolt between the inner surface of the steel tube and the bearing surface of the anchor nut. HN350 × 175 × 7 × 11 (mm) H-beam sections were used for specimens SJ-1 through SJ-5, whereas HN300 × 150 × 6 × 9 (mm) H-beam sections used for specimens SJ-6 through SJ-8. For specimens SJ-3 through SJ-8, two C-channels were externally welded in the panel zone to increase the local steel tube wall thickness. Moreover, as shown in Figure 3, the C-channels in SJ-5 were connected to the steel tube by fillet welding only, whereas the C-channels in the other specimens were additionally connected to the steel tube wall through plug welding. In SJ-5, only the bolts were extended, and no nuts were installed on the end of the bolts. The design of the specimens is outlined as follows:
Specimens SJ-1 versus SJ-3 and specimens SJ-2 versus SJ-4 were used to study the effect of the wall thickness of the steel tube;
Specimens SJ-1 versus SJ-2 and specimens SJ-3 versus SJ-4 were used to study the effect of the end-plate thickness;
Specimens SJ-3 and SJ-5 were used to investigate the effect of the local strengthening connection method and anchorage method on joint performance;
Specimens SJ-3 and SJ-6 and specimens SJ-4 and SJ-7 were used to examine the effect of steel beam sections;
Specimens SJ-6 and SJ-8 were used to study the effect of stiffeners.
To install a blind bolt, first, an impact wrench was used for pretightening, and then a torque wrench was used for the final tightening. According to the instructions provided by Lindapter International, a torque of 190 N∙m was applied, corresponding to a pretension load of 70 kN. Prior to installing the blind bolt, the nut and the bolt were fixed with glue or a spot weld to prevent the nut from falling off due to vibration during installation or concrete casting.

2.2. Testing of Material Properties

The steel used for the beams in SJ-6 through SJ-8 had a nominal yield strength of 235 MPa, whereas the steel used for all other steel components had a nominal yield strength of 345 MPa. The steel tensile coupons were fabricated and subjected to tensile tests, and Table 2 presents the test results of the primary properties for each steel component. Grade 8.8 blind bolts have a nominal yield strength of 640 MPa, a nominal ultimate strength of 800 MPa, and an elastic modulus of 206 GPa. Commercially available self-compacting concrete (SCC) was used for the CFST columns in all specimens. Six standard concrete cubes (150 × 150 × 150 mm) were cast simultaneously for use as compression testing samples; these cubes were cured naturally under the same conditions as the joint specimens. On the testing day, the concrete test cubes had an average cubic compressive strength of 39.92 N/mm2 and an average elastic modulus of 3.27 × 10⁴ N/mm2.
tp is the end-plate thickness, which was 12 mm for specimens SJ-1, SJ-3 and SJ-6 and 24 mm for specimens SJ-2, SJ-4, and SJ-7; specimens SJ-3 and SJ-5 were the same except for the connection mode of the C-channel and the anchorage method of the anchor bolts.

2.3. Test Setup

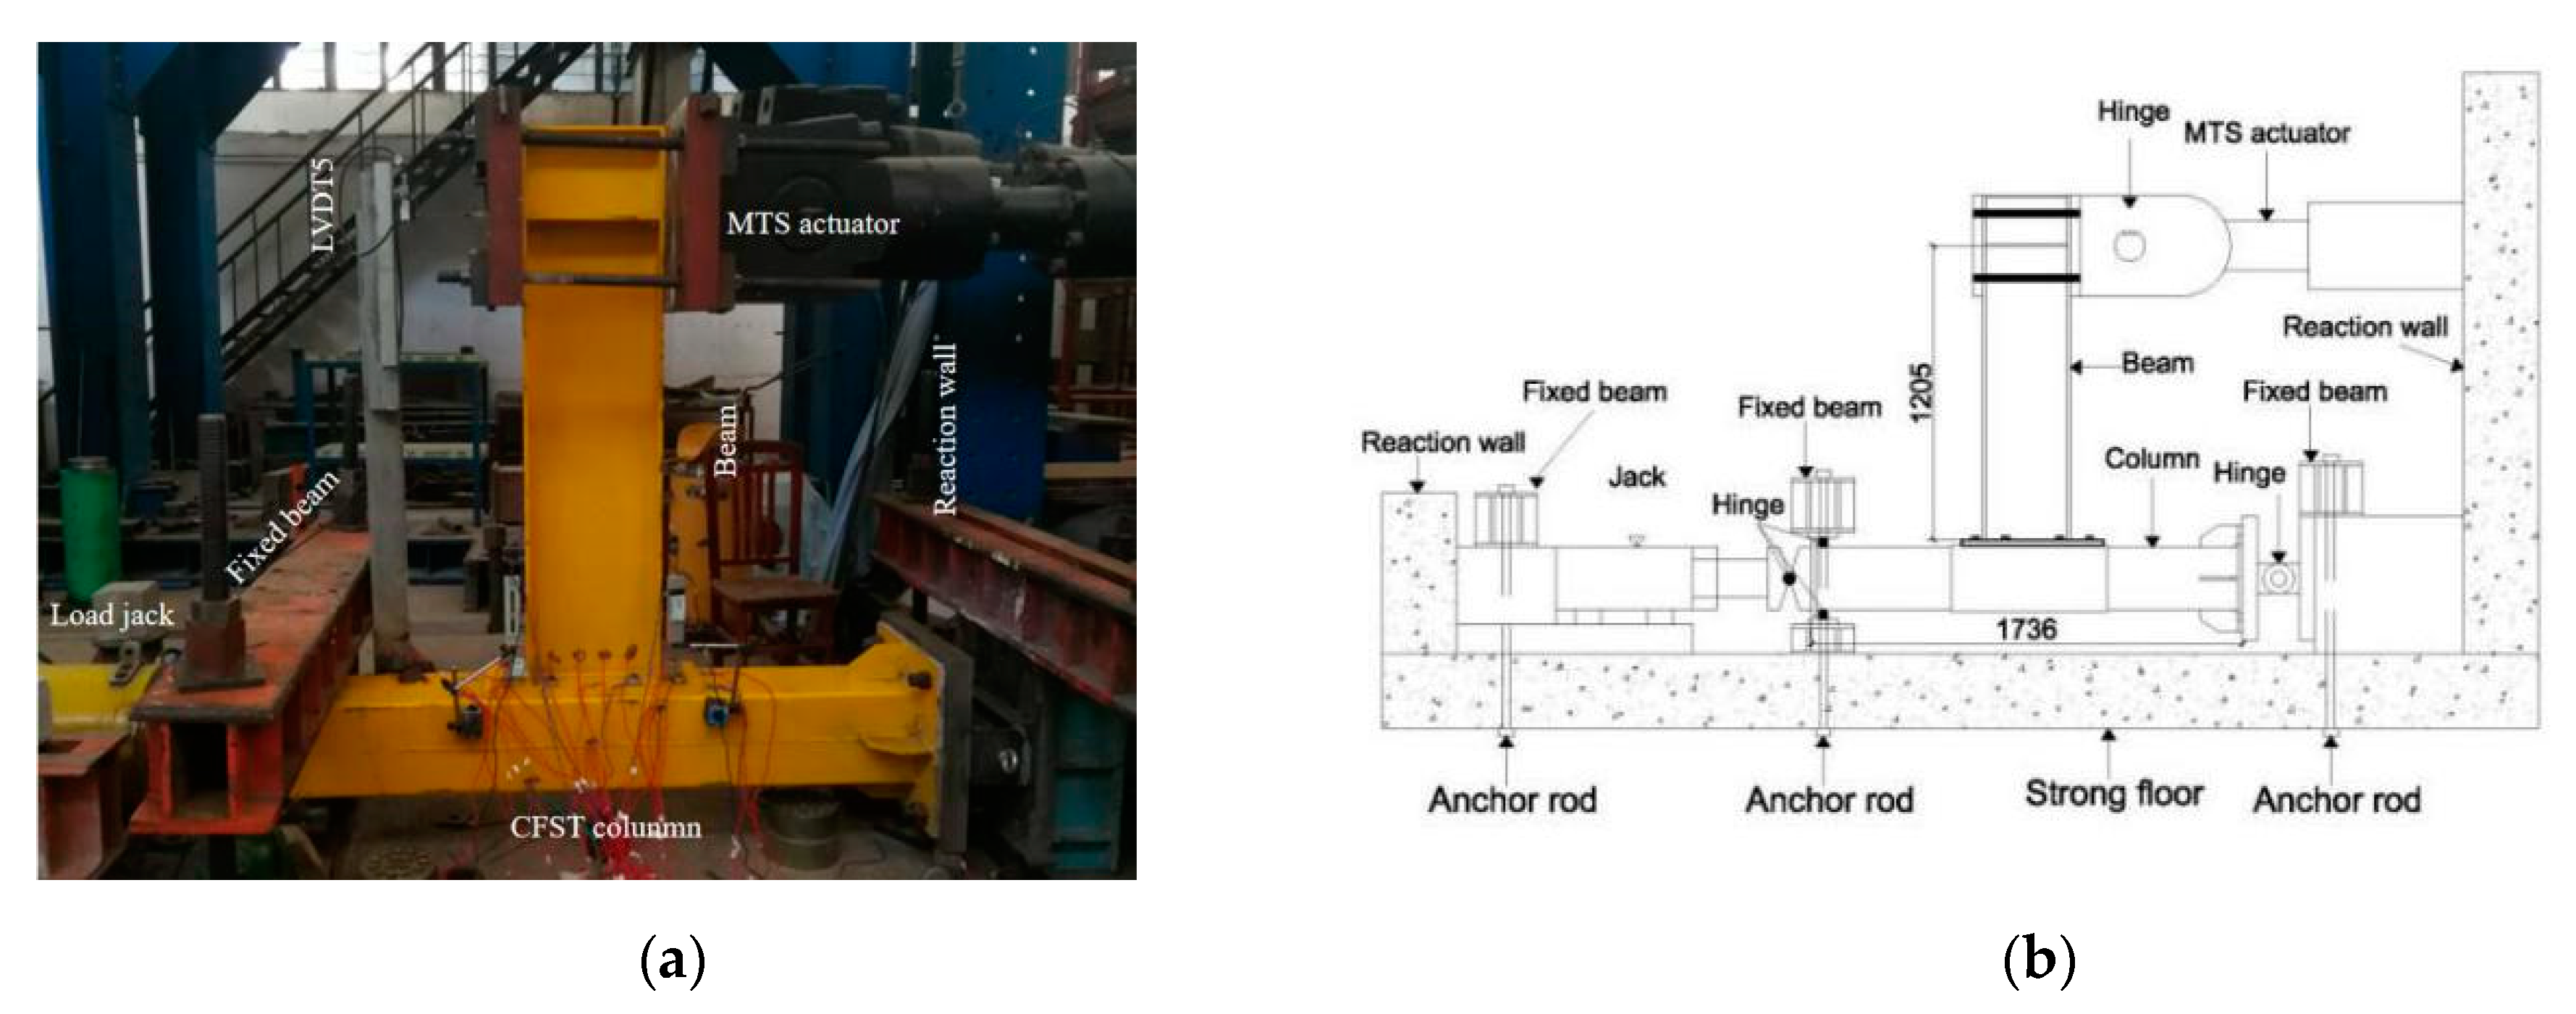
The experiment was conducted on an MTS hydraulic actuator in the State Key Laboratory of Subtropical Building Science at the South China University of Technology. The test setup is shown in Figure 4. The CFST column was connected to the reaction wall through two hinge supports to allow the rotation of the column end, and the beam end was connected to the MTS actuator through a loading plate to apply the cyclic load. The loading point at the beam end was 1.2 m away from the column face. To reflect the axial pressure of the CFST column in a practical structural system, an axial load with an axial compression ratio (n) of 0.3 was applied to the top of the column through a hydraulic jack. The axial pressure ratio is expressed as follows:
n = N/Nu
where N is the axial compression applied on the top of the column, and Nu is the nominal ultimate axial compression of the CFST column. In accordance with standard JGJ3-2010 [22], Nu = fcAc + faAa. Here fc and fa are respectively the compressive strength of the concrete and steel, and Ac and Aa are respectively the section area of the concrete and steel.
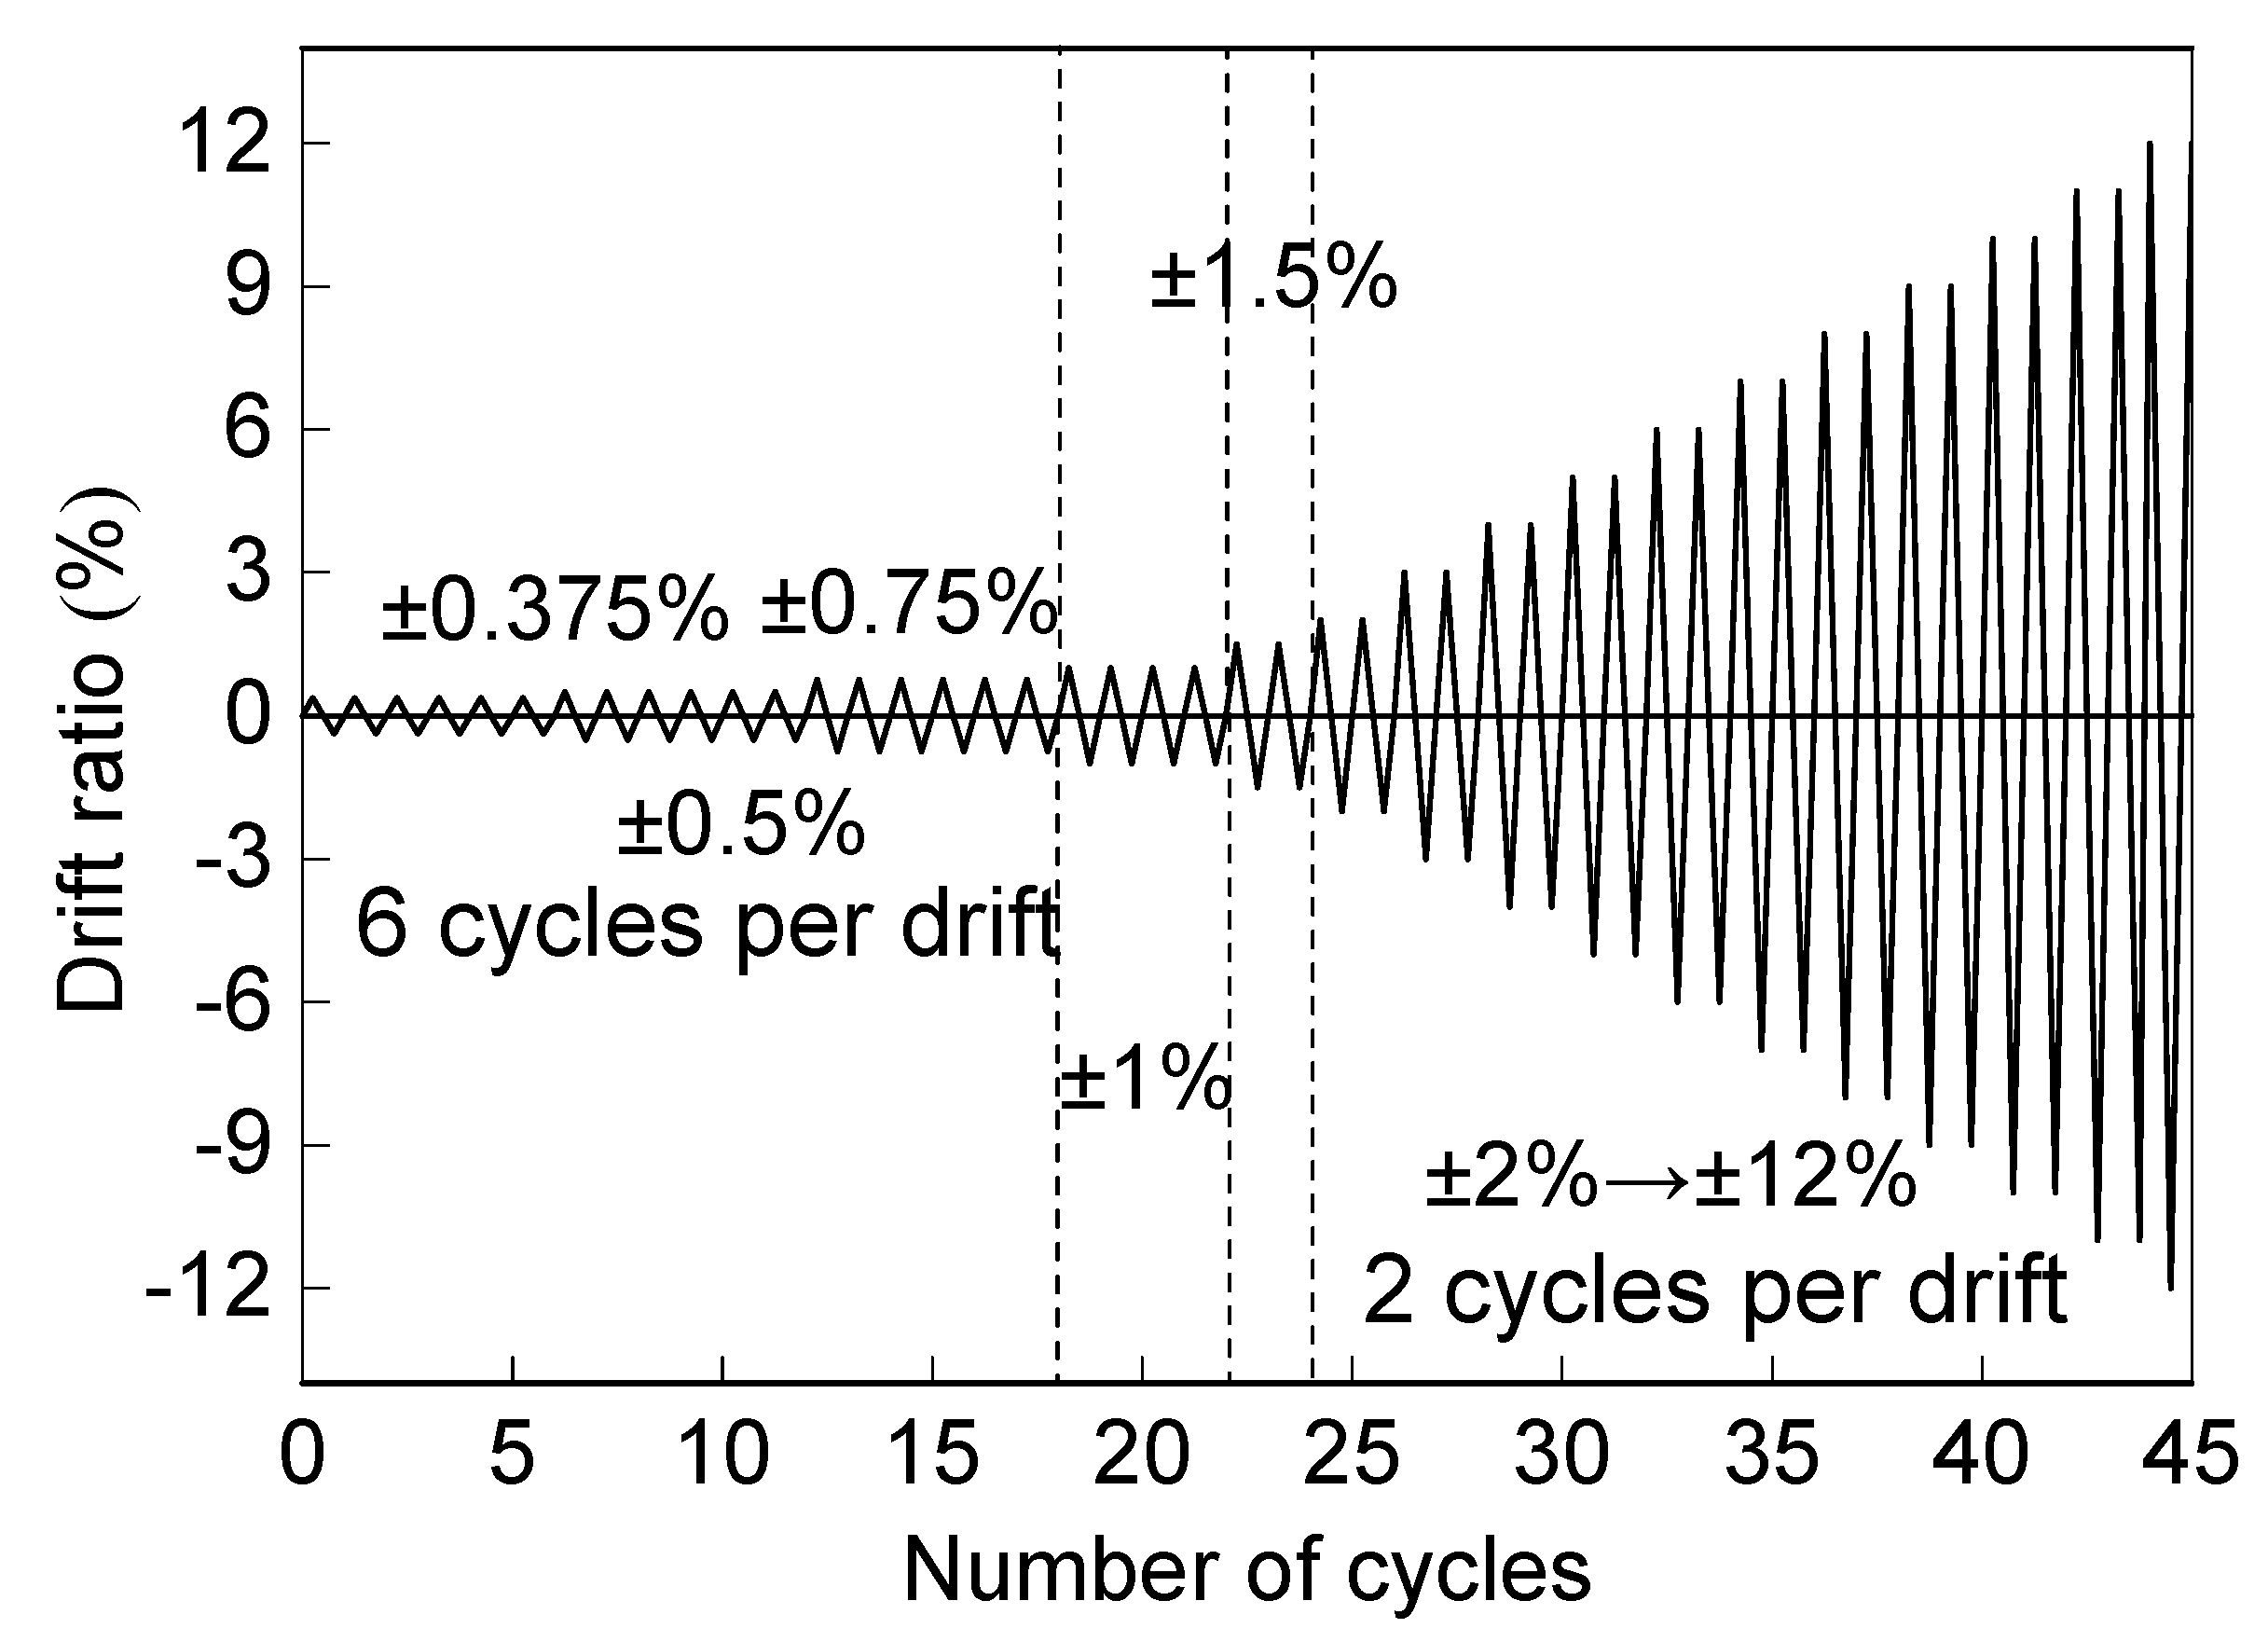
The required axial load was calculated as 980 kN in accordance with standard JGJ3-2010 [22]. The cyclic loading was controlled using the layer angular displacement, and the loading procedure recommended in SAC Joint Venture (1997) [23] was adopted for cyclic testing, as shown in Figure 5. In the test, the load was stopped when the connection failed or the loading device limit was reached.

2.4. Displacement Measurement

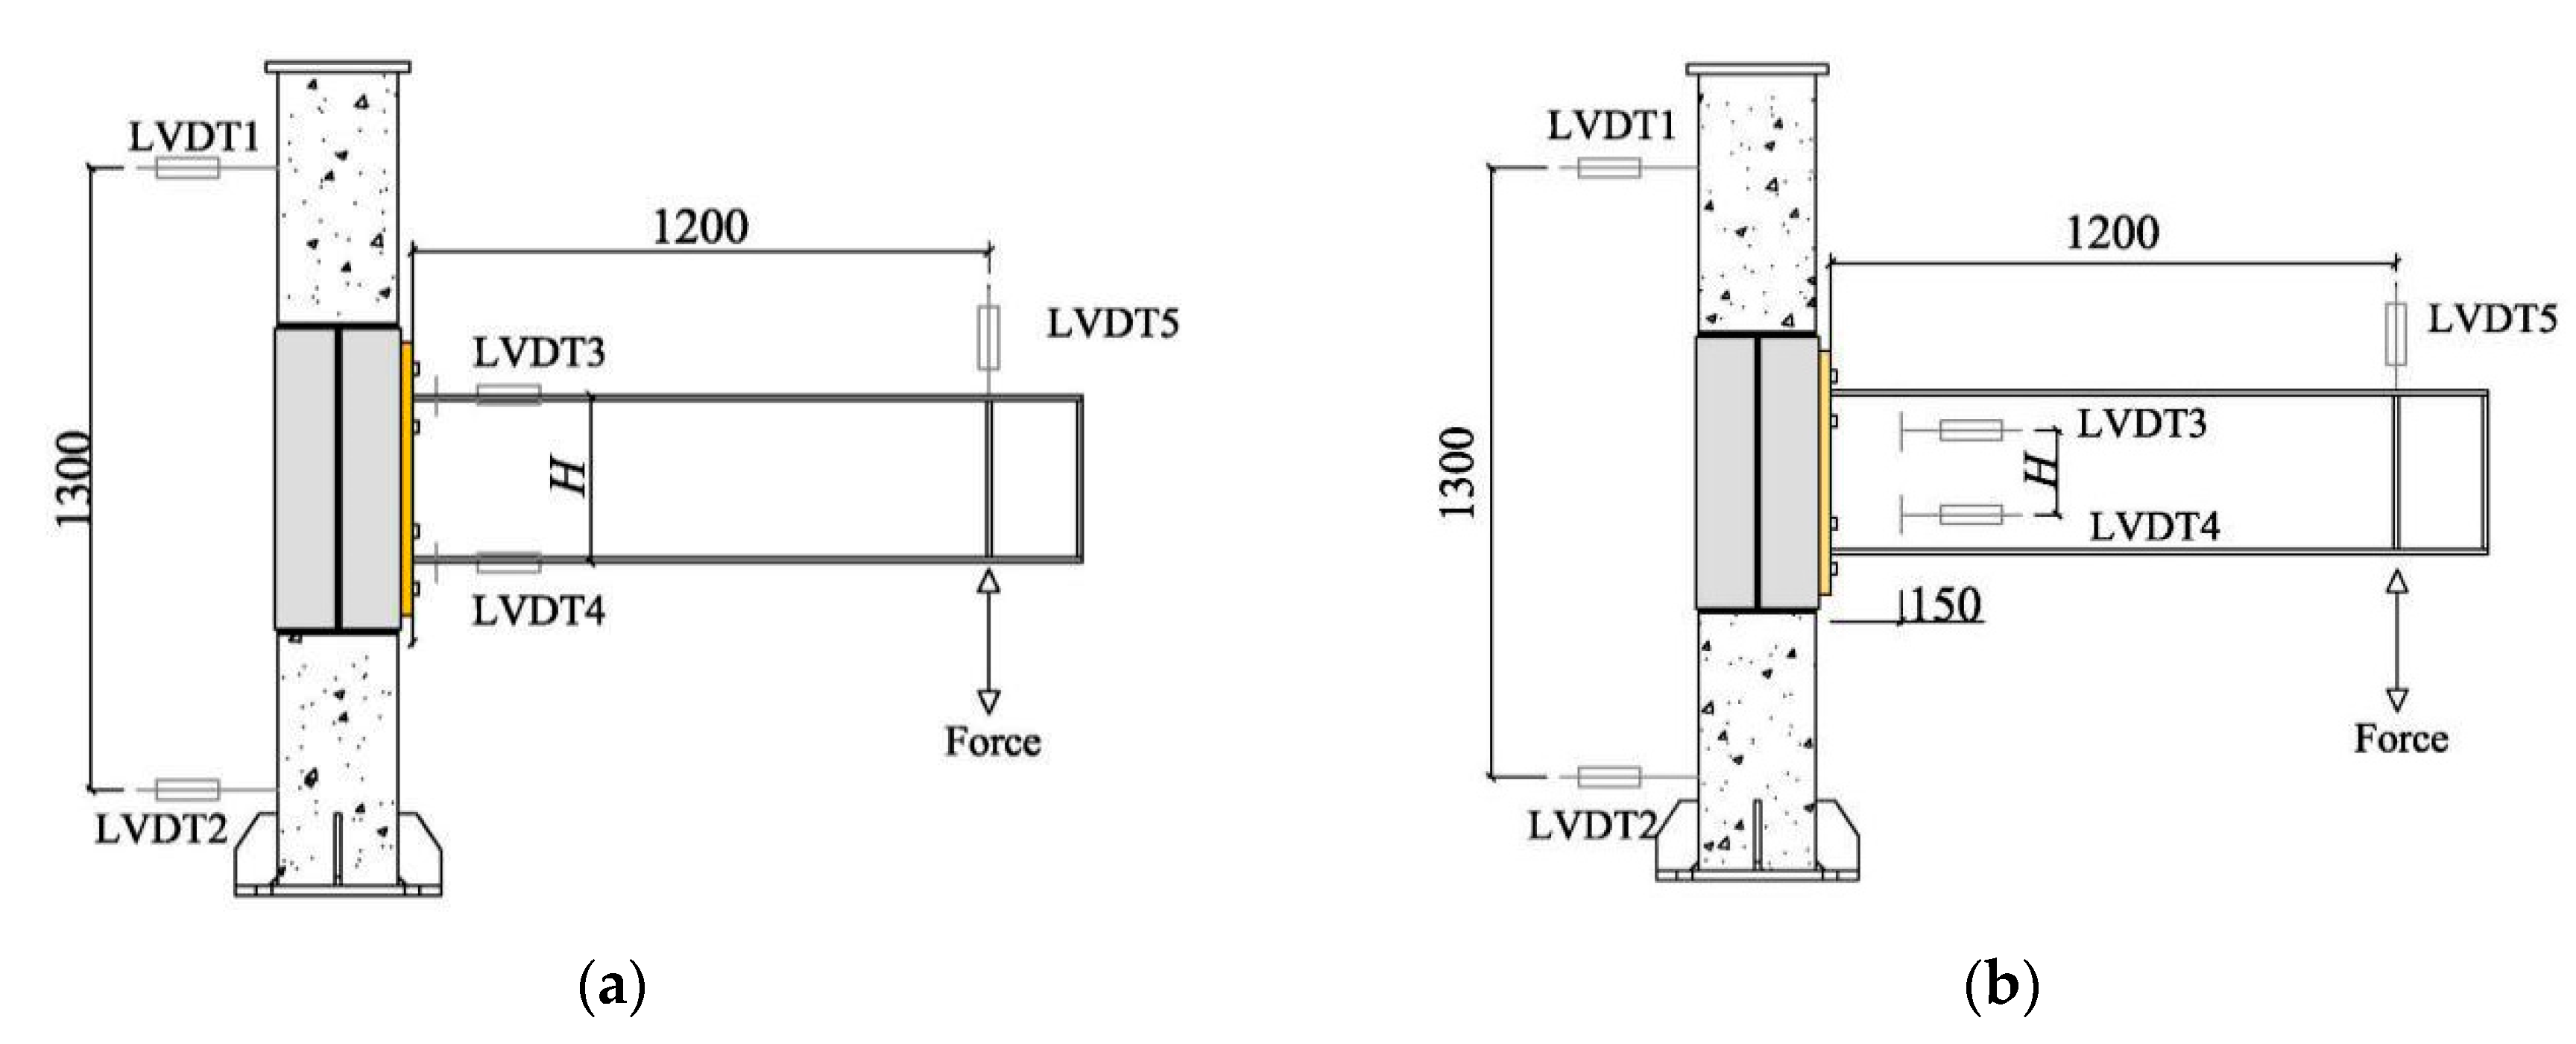
The load-displacement hysteresis curve was automatically recorded by the MTS loading system, and the layout of the Linear Variable Differential Transformers (LVDTs) used for the joint displacement measurements is shown in Figure 6; the accuracy of the LVDTs is 0.01 mm. LVDT3 and LVDT4 were used to monitor the rotation of the beam. For specimens with a strong beam, LVDT3 and LVDT4 were located 30 mm away from the column face, as shown in Figure 6a. For specimens with a weak beam, taking into account the local buckling at the root of the beam flange, LVDT1 and LVDT2 were placed on the beam web, 150 mm away from the column face, as shown in Figure 6b. LVDT1 and LVDT2 were placed at the column end to measure the rotation of the column, and LVDT5 was placed at the beam end to measure the displacement of the loading point.
The relative rotation between the beam and column flange can be obtained from the following expressions:
θ c = u 1 u 2 1300
θ b = u 3 u 4 H
θ = θ b θ c
where u1, u2, u3, and u4 are the displacements measured by LVDT1 through LVDT4, respectively; θb is the rotation of the steel beam; θc is the rotation of the CFST column; and H is the horizontal distance between LVDT3 and LVDT4, where H is 350 mm for specimens SJ-1 through SJ-5 and 180 mm for specimens SJ-6 through SJ-8.

3. Results

Test Observation and Failure Modes

In the initial stage of testing, the eight specimens behaved similarly, during which a slight gap appeared between the end-plate and the column wall, and the specimens were not significantly deformed. Under subsequent loading, the deformation process and the failure mode were related to the steel tube wall thickness, end-plate thickness, local strengthening connection method, beam section size, anchorage method and stiffeners. There were three main types of failure modes, as shown in Table 3.
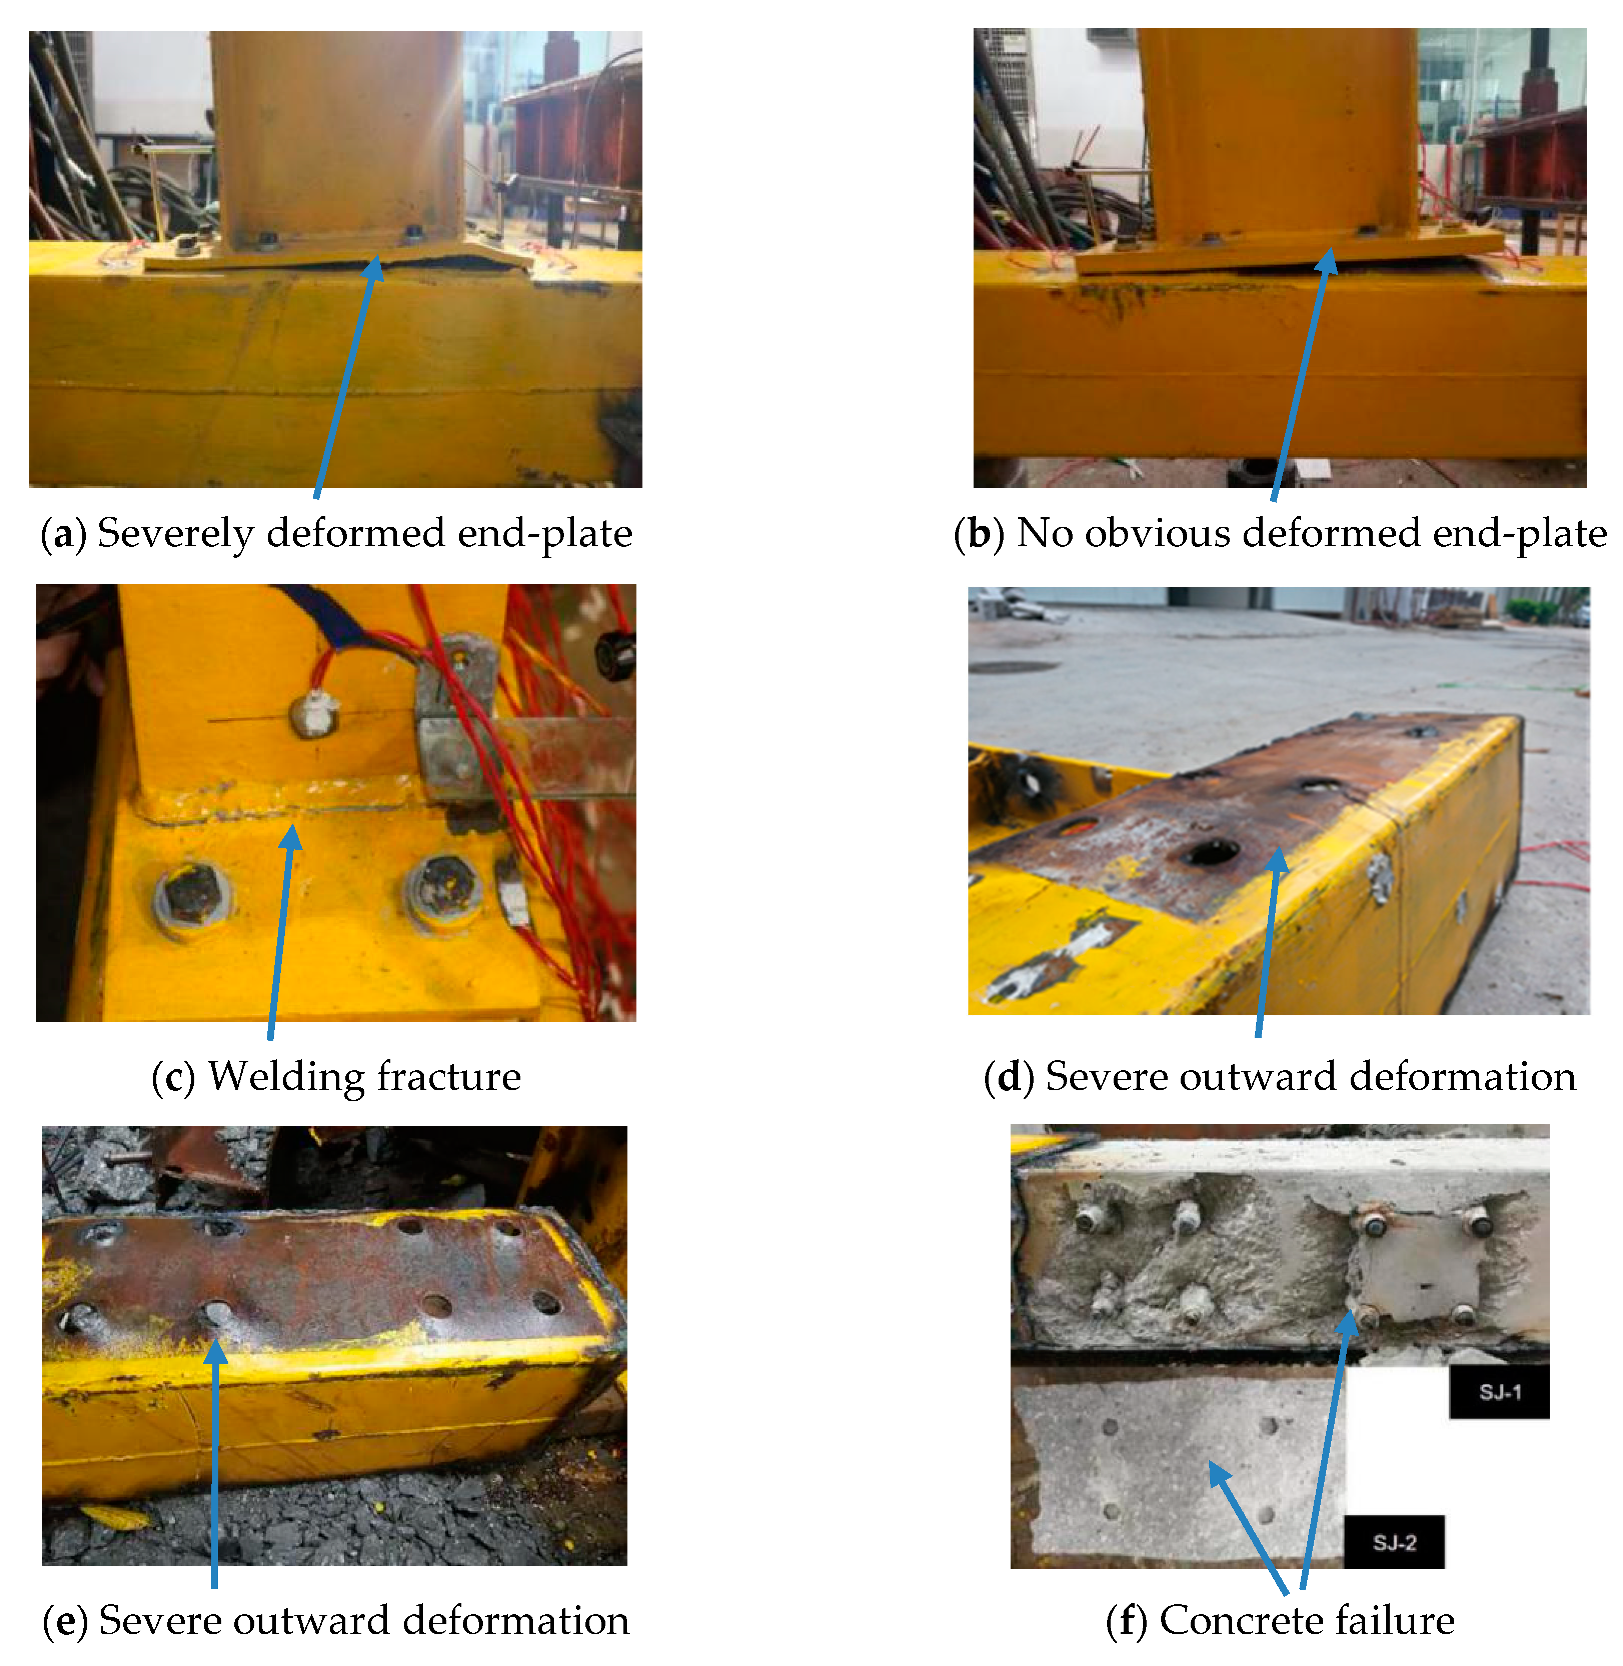
For failure mode I, the following test phenomena were typically observed: the anchored blind bolt was partially pulled out; the steel tube wall underwent significant yielding, and the steel tube wall had remarkable bulging deformation, especially at the bolt holes; and the concrete in the panel of the joint was severely damaged. Therefore, the CFST column became the weakest component. Specimens SJ-1 and SJ-2 exhibited this failure mode, as shown in Figure 7a–f. As the drift ratio increased, a significant gap appeared between the end-plate and the steel tube wall, indicating that the concrete in the panel of these specimens gradually cracked and was damaged; the anchorage and bond from the blind bolts failed during this time. Thus, the bolts were gradually pulled out, and the steel tube wall at the bolt holes gradually bulged.
The thin end-plates in the tension zone of specimen SJ-1 exhibited significant flexural deformation, resulting in a relatively large gap between the adjacent bolts around the flanges. Eventually, the weld between the beam flange and end-plate fractured, and then the loading stopped. However, no obvious flexural deformation was observed for the thick end-plate in specimen SJ-2, which rotated as a rigid body. Finally, a wedge-shaped gap was formed. For specimen SJ-2, the outward deformation of the column flange was more significant than that in specimen SJ-1, and the outward deformation outside the panel was also obvious, which was not observed in specimen SJ-1. The steel tube wall was cut open to observe the failure mechanism of the CFST column. As shown in Figure 7f, severe local concrete crushing and widespread concrete cracks were observed in the panel zone of the column, showing a significant cone-shaped failure; thus, the damage situation was more serious in specimen SJ-1 than in specimen SJ-2. For specimen SJ-1, the anchored bolts were notably loosened, indicating anchorage failure. However, the mechanical anchorage of the nut prevented the bolt from being completely pulled out. For specimen SJ-2, the concrete infill had been completely damaged, and the bolts were completely pulled out.
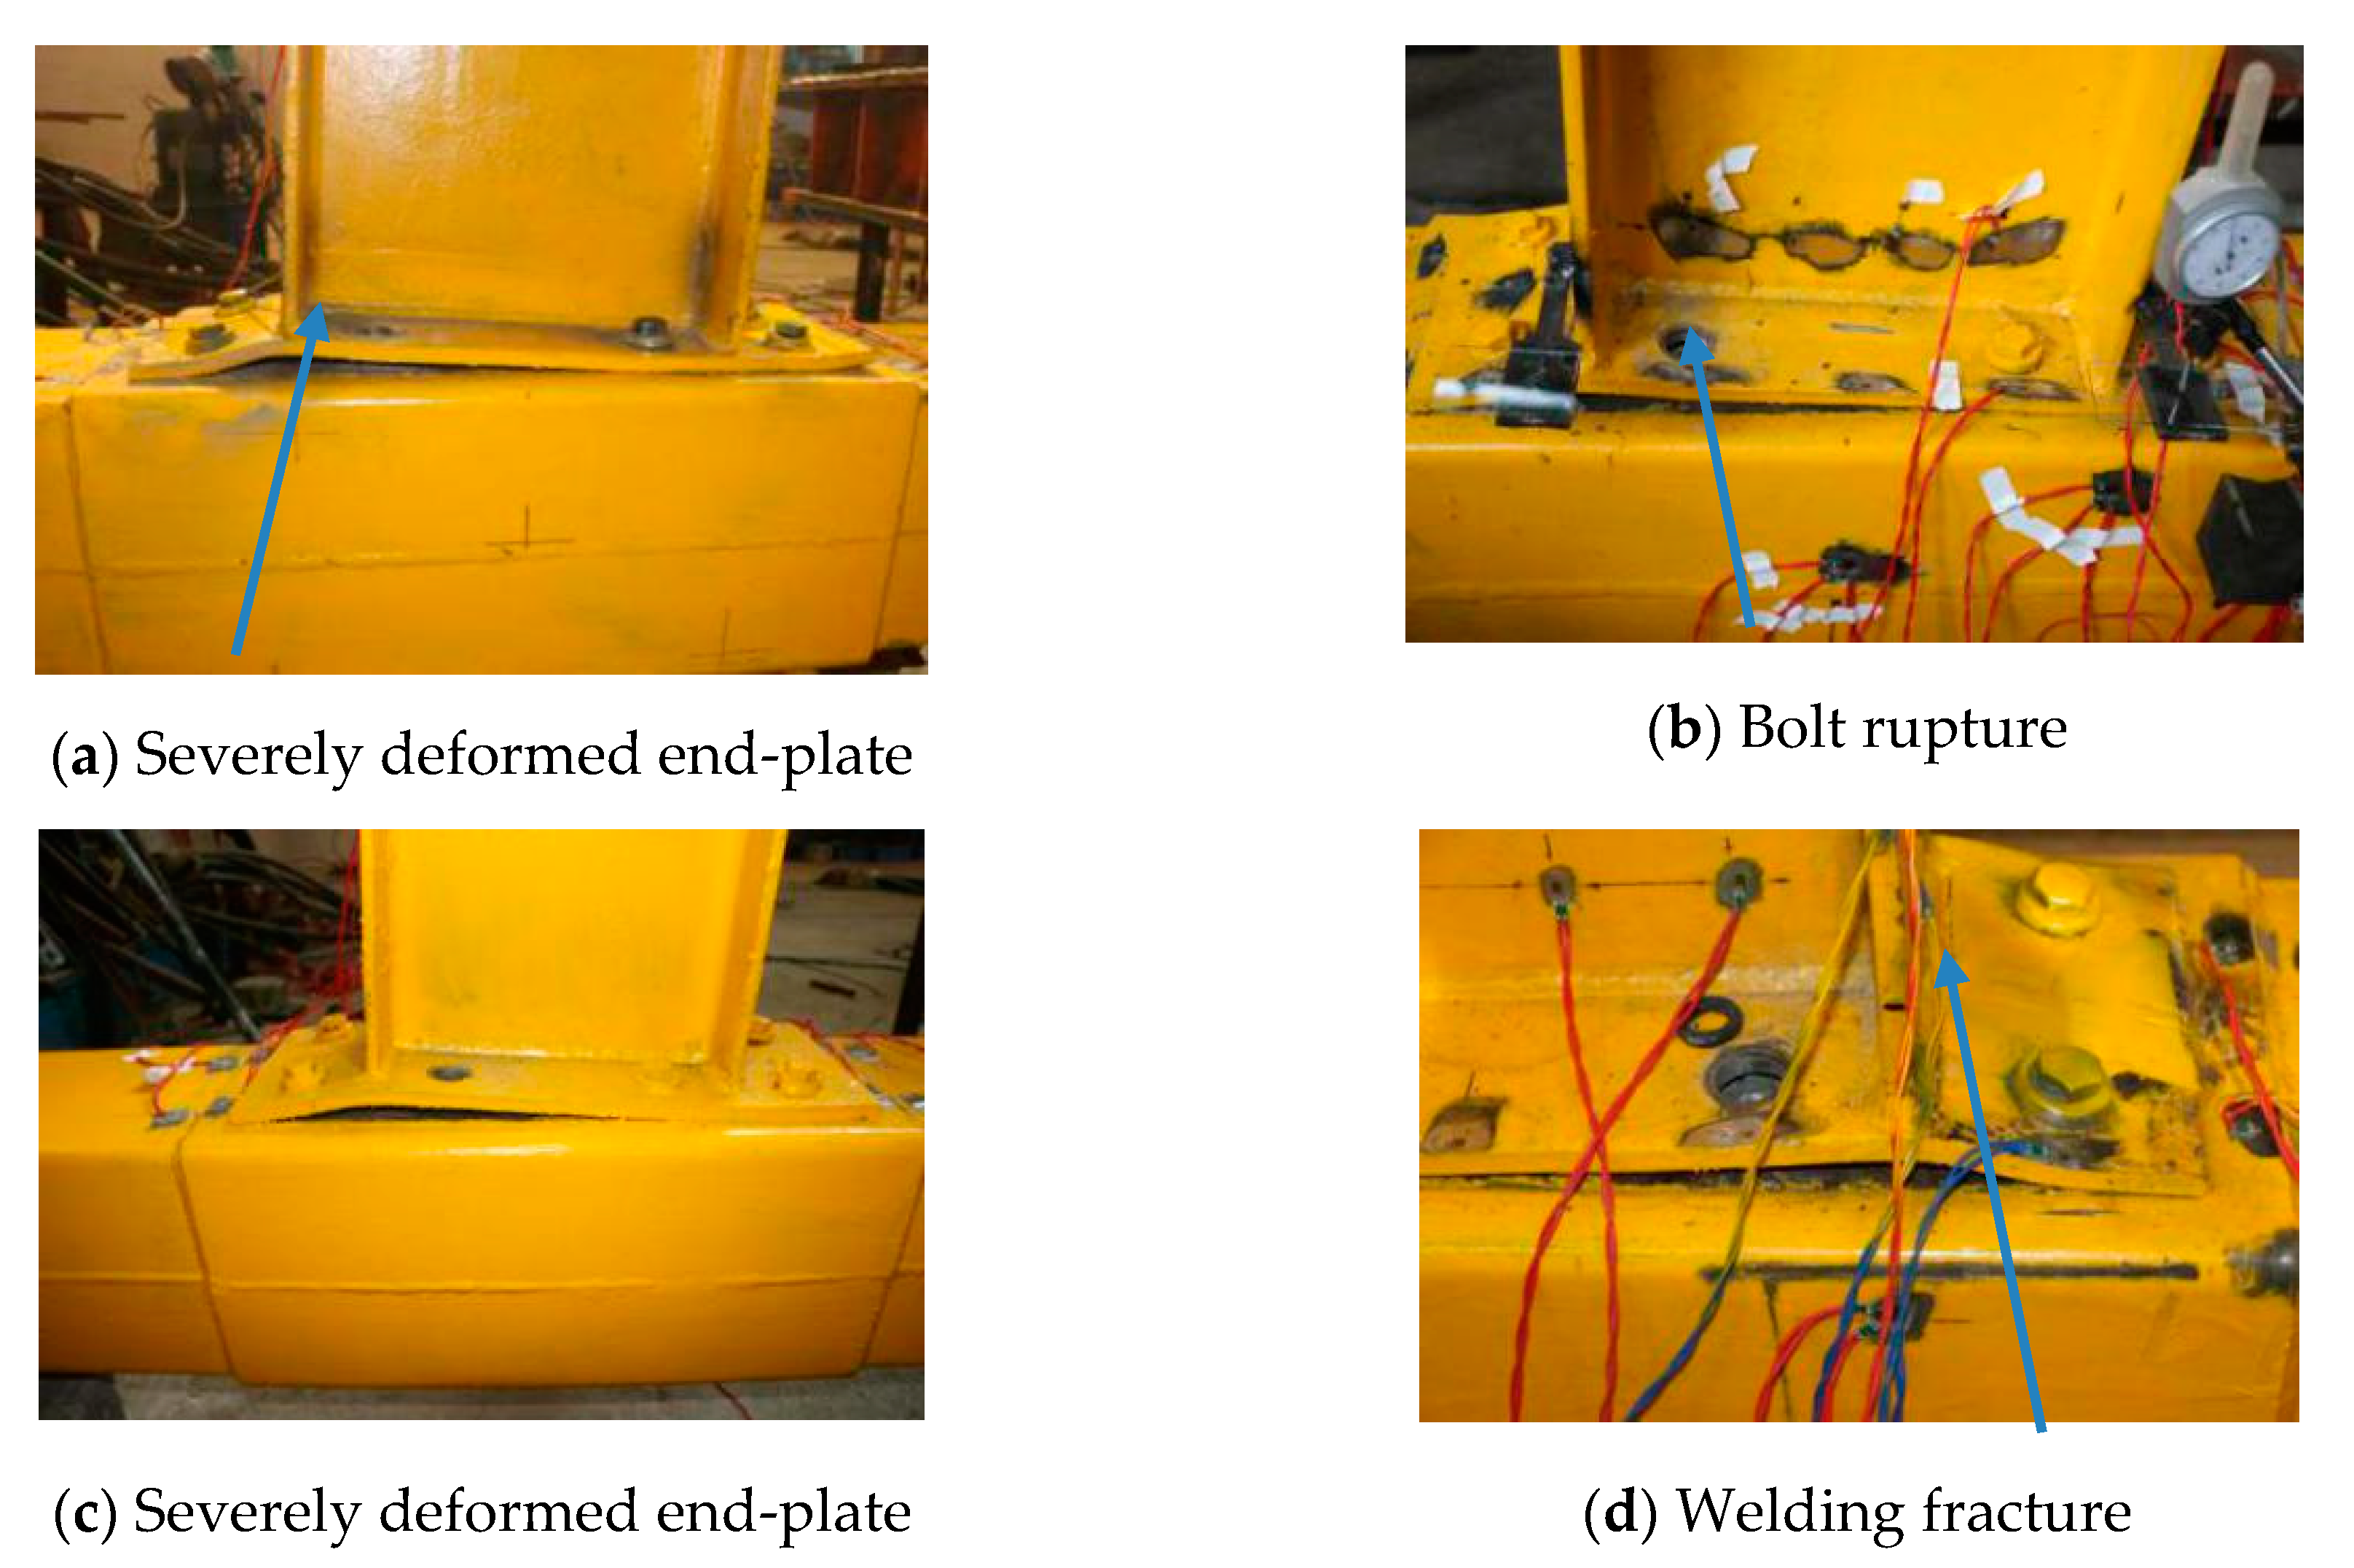
For failure mode II, the following test phenomena were typically observed: the anchored blind bolts experienced shank rupture; the outward deformation of the steel tube wall was very small, and there was only slight bulging at the bolt holes; and the core concrete in the panel of the joint was also basically intact. Therefore, the bolts became the weakest component. Specimens SJ-3, SJ-4, SJ-5, SJ-6 and SJ-8 failed in this mode, as shown in Figure 8 and Figure 9. As the drift ratio increased, a gap appeared between the end-plate and the steel tube column, but the corresponding gap was significantly smaller than that in the first failure mode, indicating that the gap in failure mode II was mainly due to the elongation of the bolt shank itself, whereas the gap in failure mode I was mainly due to the bolt pull-out after the anchorage failed.
For specimens SJ-3, SJ-5, and SJ-6 with thin end-plates, the thin end-plates underwent significant deformation, which was similar to that in SJ-1; when the inner row of blind bolts in the tension zone were ruptured, the transverse weld fractured at the interface between the end-plate near the outer bolts and the steel beam, as shown in Figure 8d. The outward deformation of the steel tube wall in specimen SJ-5 was slightly larger than that in SJ-3, as shown in Figure 8e,f. Local buckling was observed at the root of the beam compression flange in specimen SJ-6 with a weak beam. For specimens SJ-4 and SJ-8 with thick end-plates or end-plates reinforced by stiffeners, only slight end-plate deformation was observed, similar to that of SJ-2; the outer row of blind bolts ruptured, and there was no welding fracture, as shown in Figure 9. Because stiffeners were used to strengthen the end-plate, the end-plate deformation of specimen SJ-8 was notably different from that of SJ-6, and the plastic hinge of the steel beam shifted significantly outwards. Moreover, the bolts of specimens SJ-3, SJ-5, and SJ-6 fractured at a larger drift ratio, indicating that the use of the thinner end-plate and weaker steel beam had an improved effect on the deformation capacity.
The bolt failures in specimens SJ-3 and SJ-4 are compared in Figure 10a. The bolts in specimen SJ-3 failed in flexure-shear mode, whereas those in SJ-4 mainly failed in tension mode. The concrete exposed by cutting open the column is shown in Figure 10b. The concrete in the panel of specimen SJ-3 was basically intact except for local crushing around the expansive sleeve, whose surrounding concrete was likely to experience local cracking under tension. The anchored bolts were not loosened, meaning that the anchorage did not fail and that the concrete could effectively restrain the blind bolt from pulling out. The concrete damage in specimen SJ-4 was similar to that in SJ-3. For specimen SJ-5, some individual anchor bolts were slightly loosened, and the surface concrete was nearly completely crushed, indicating the local failure of the anchorage.
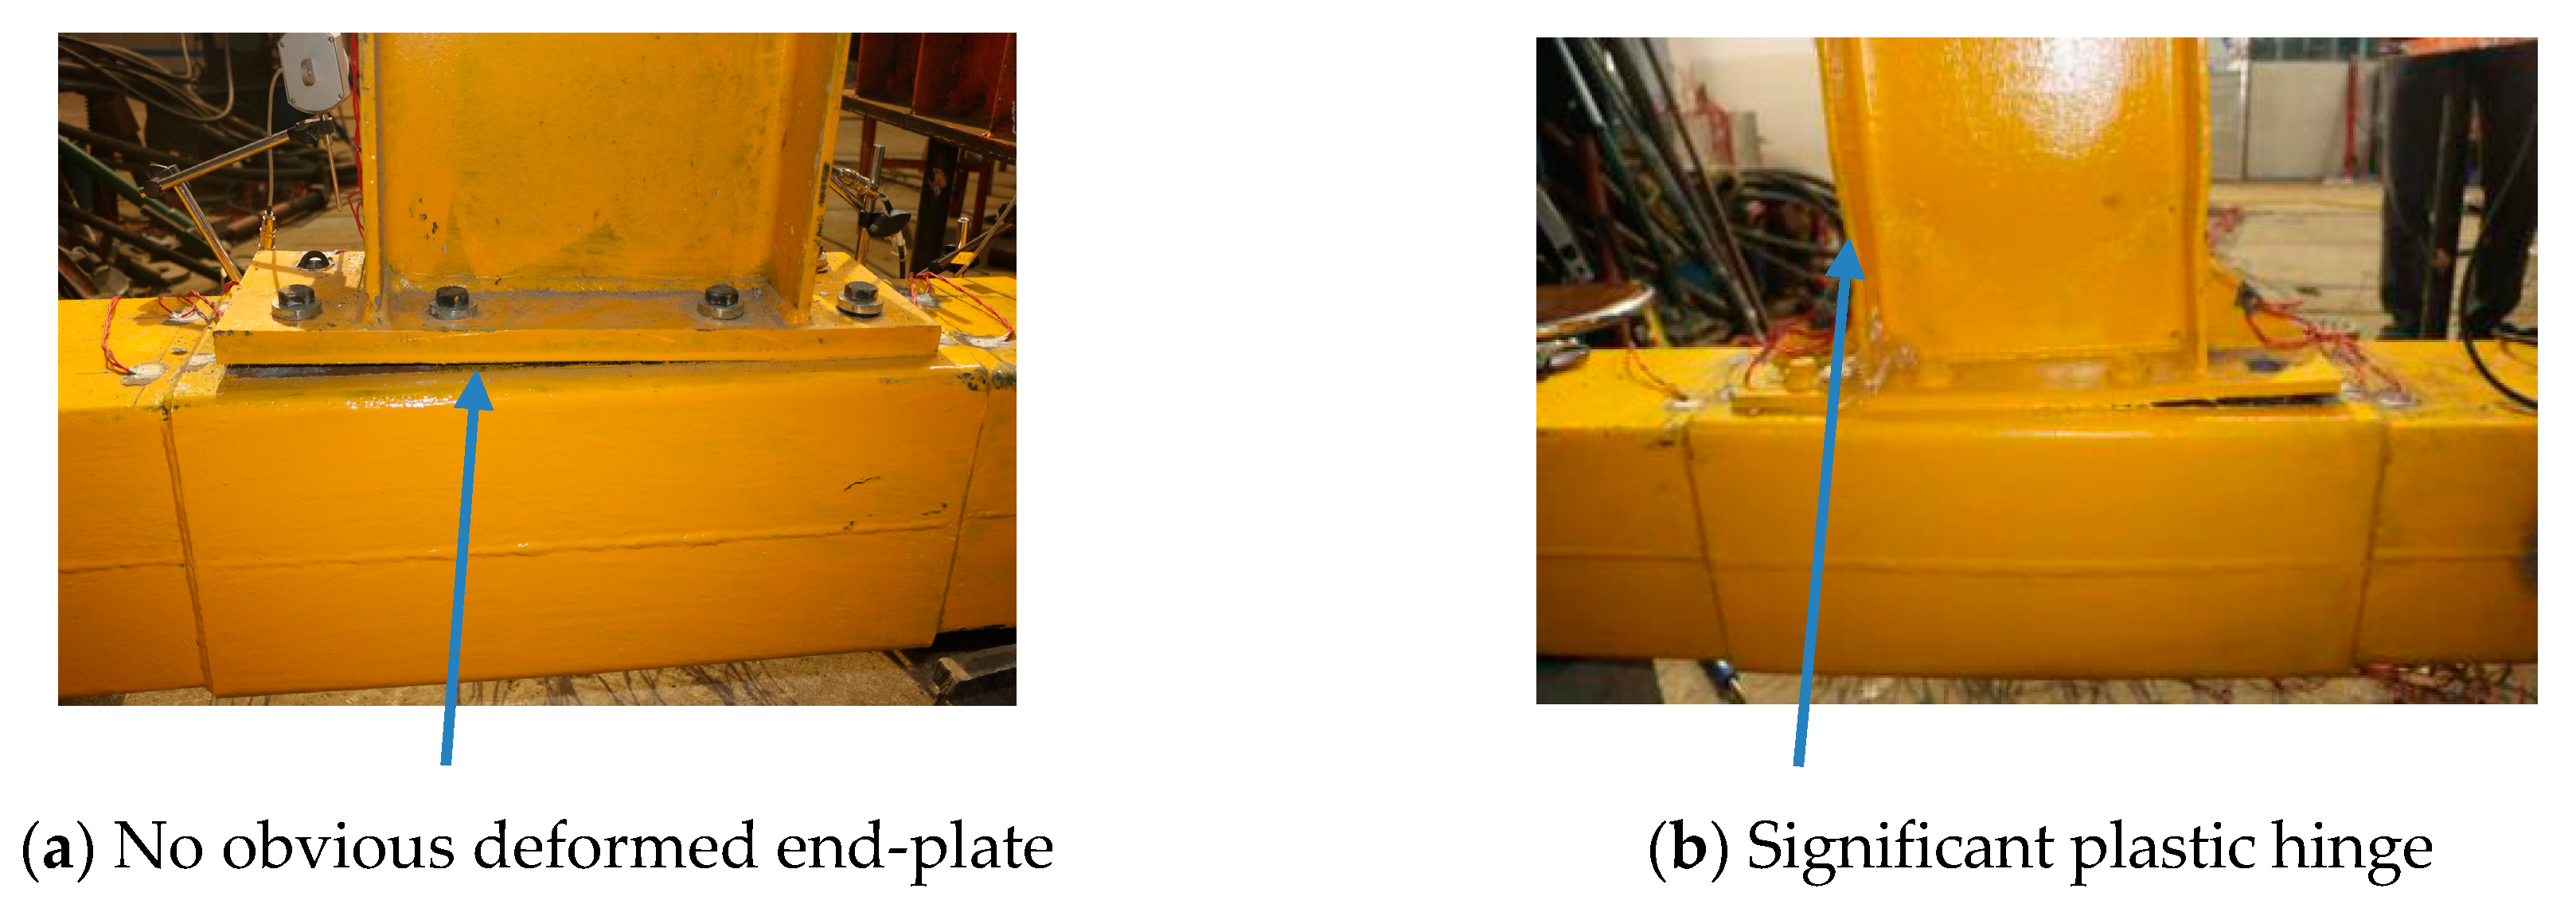
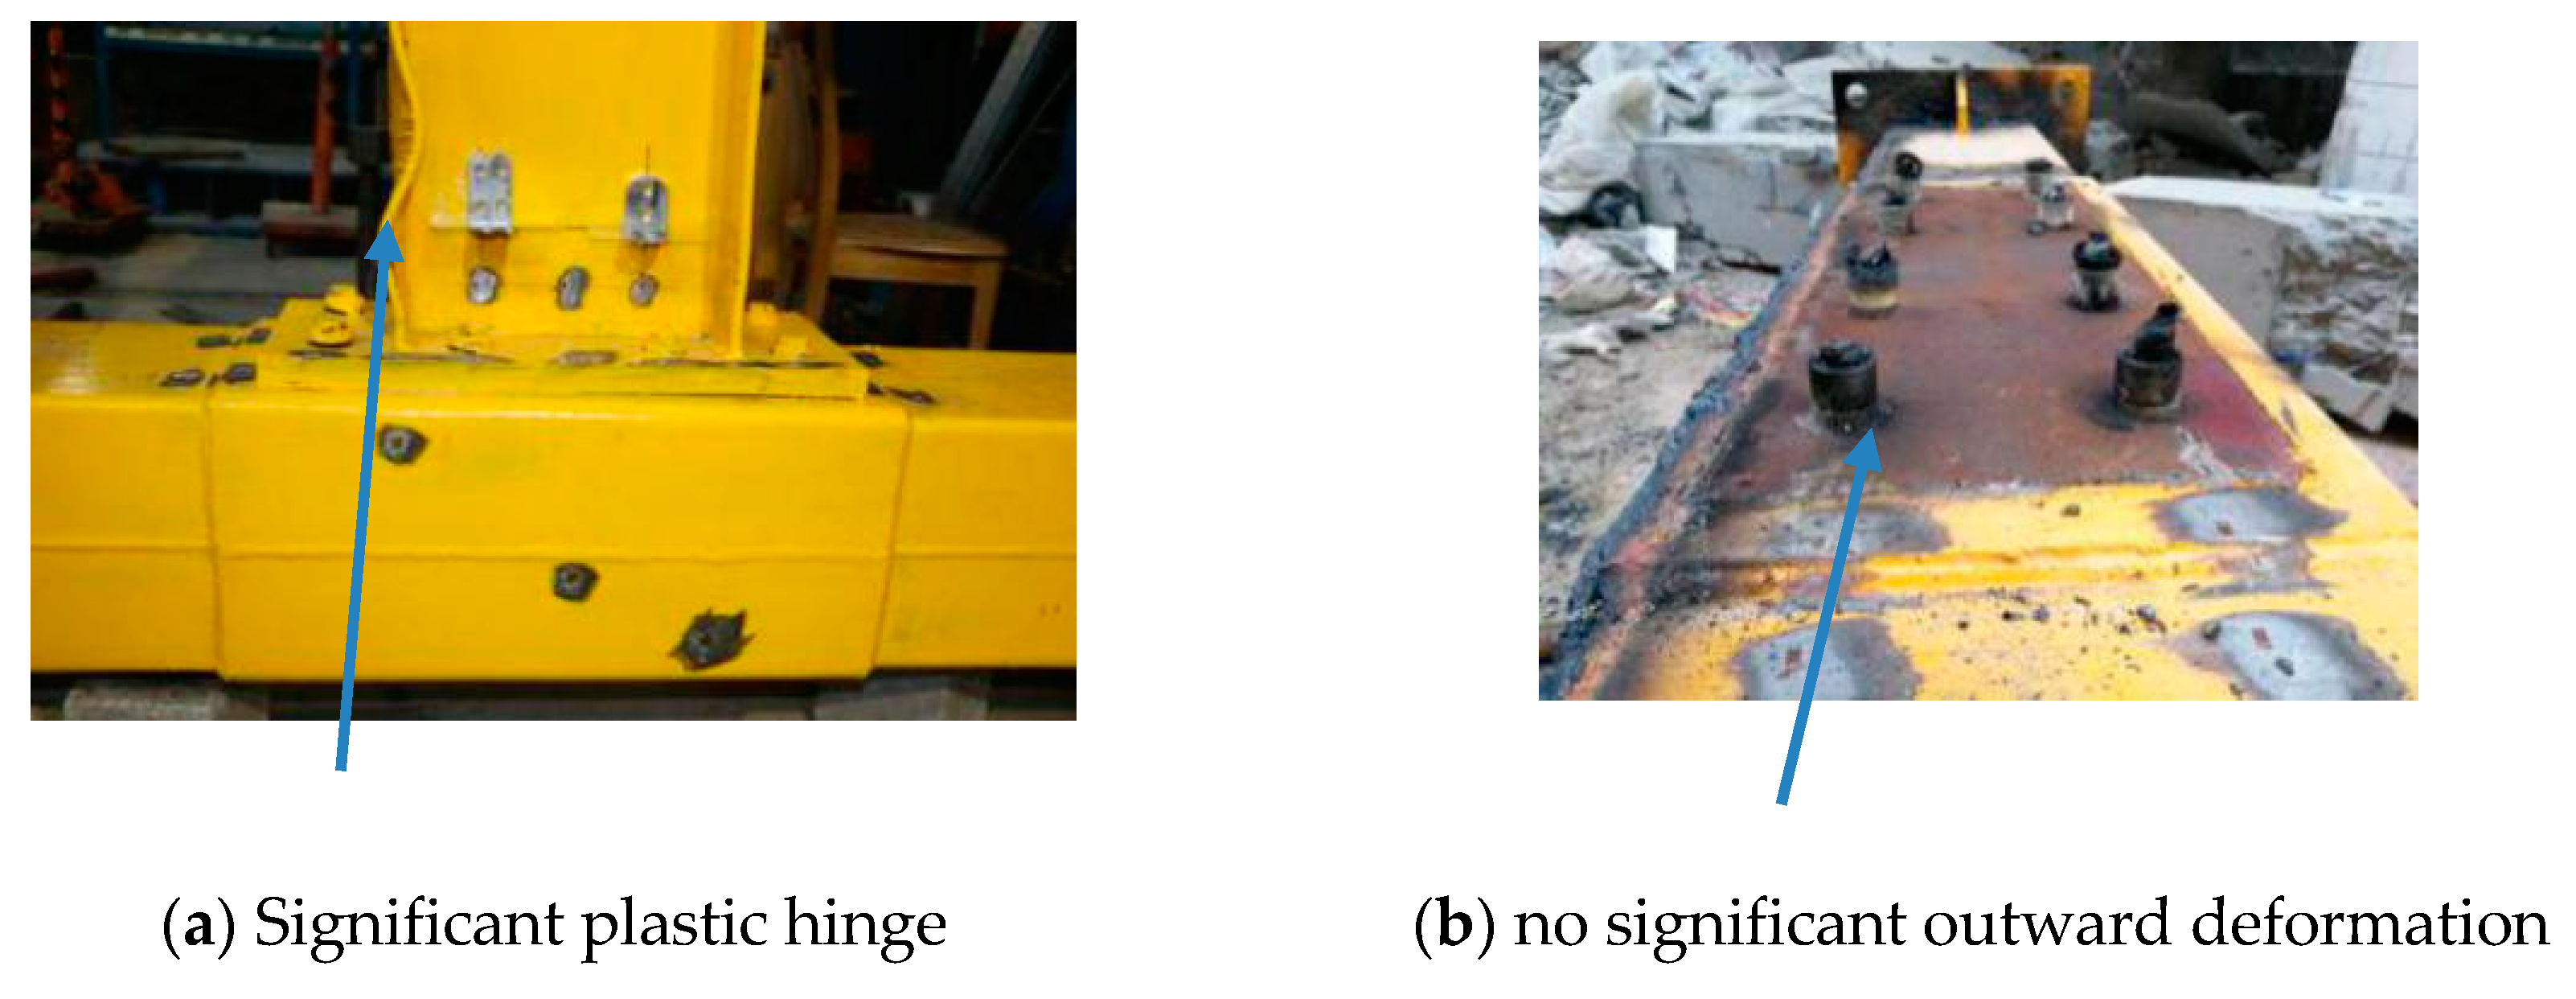
For failure mode III, the following test phenomena were typically observed: the steel beam exhibited significant local buckling; there was basically no deformation in the end-plate, and the gap between the end-plate and the column flange was especially small; no significant outward deformation of the steel tube wall was observed, and the blind bolts did not rupture; and the core concrete in the panel was also basically intact. Therefore, the steel beam became the weakest component. Specimen SJ-7 exhibited this failure mode, as shown in Figure 11. Because a plastic hinge at the root of the beam led to out-of-plane instability in the beam, the loading stopped at a larger drift ratio, demonstrating good deformability.
As shown in Figure 12a,b, for the failure modes described above, the anchored part of blind bolts in the concrete were basically intact, including the bolt sleeve, threaded cone, bolt shank, and anchor nut. There was no damage, such as breaking or bending, for the anchored part. However, notable scratches were found on the anchor nut, apparently caused by the interaction between the mechanical anchorage and the concrete. As shown in Figure 12c,d, for specimen SJ-5, there was a significant gap between the steel tube wall and the C-channel; in contrast, the steel tube and the C-channel fitted closely together for specimen SJ-3. This result implies that the steel tube wall and the C-channel can work well together when a plug weld was adopted between them.
The failure mode was affected by the relative strength of the main components, which included the steel tube, blind bolt, end-plate and steel beam, and the failure mode depends on the weakest component. In the test, the steel tube thickness and the beam section size directly affected the change in the three types of failure modes for such joints. Owing to the large spacing between the blind bolts, the anchorage method did not alter the failure mode. In the failure mode II, the deformation pattern depended on the relative strength-weakness relationship of the bolt and the end-plate. There were three possible modes: the root of the end-plate flange yield, the root of the end-plate flange yield and blind bolt failure, and blind bolt failure. In addition, local strengthening connection method and stiffeners had an effect on the deformation pattern.
When modified blind bolts (Hollo-Bolts) and a locally strengthened steel tube in the panel zone were used for the joints to the CFST column, the strength of the blind bolts can be fully utilized, thereby providing the joint favorable stiffness and strength. Using thinner end-plates and weaker steel beams for the proposed connection can avoid premature brittle failure to the greatest extent and result in favorable deformation capacity. The use of a plug weld to connect the C-channel to the steel tube enables these components to exhibit good synergistic deformation capability.

4. Discussion

4.1. Moment-Rotation Hysteresis Curves

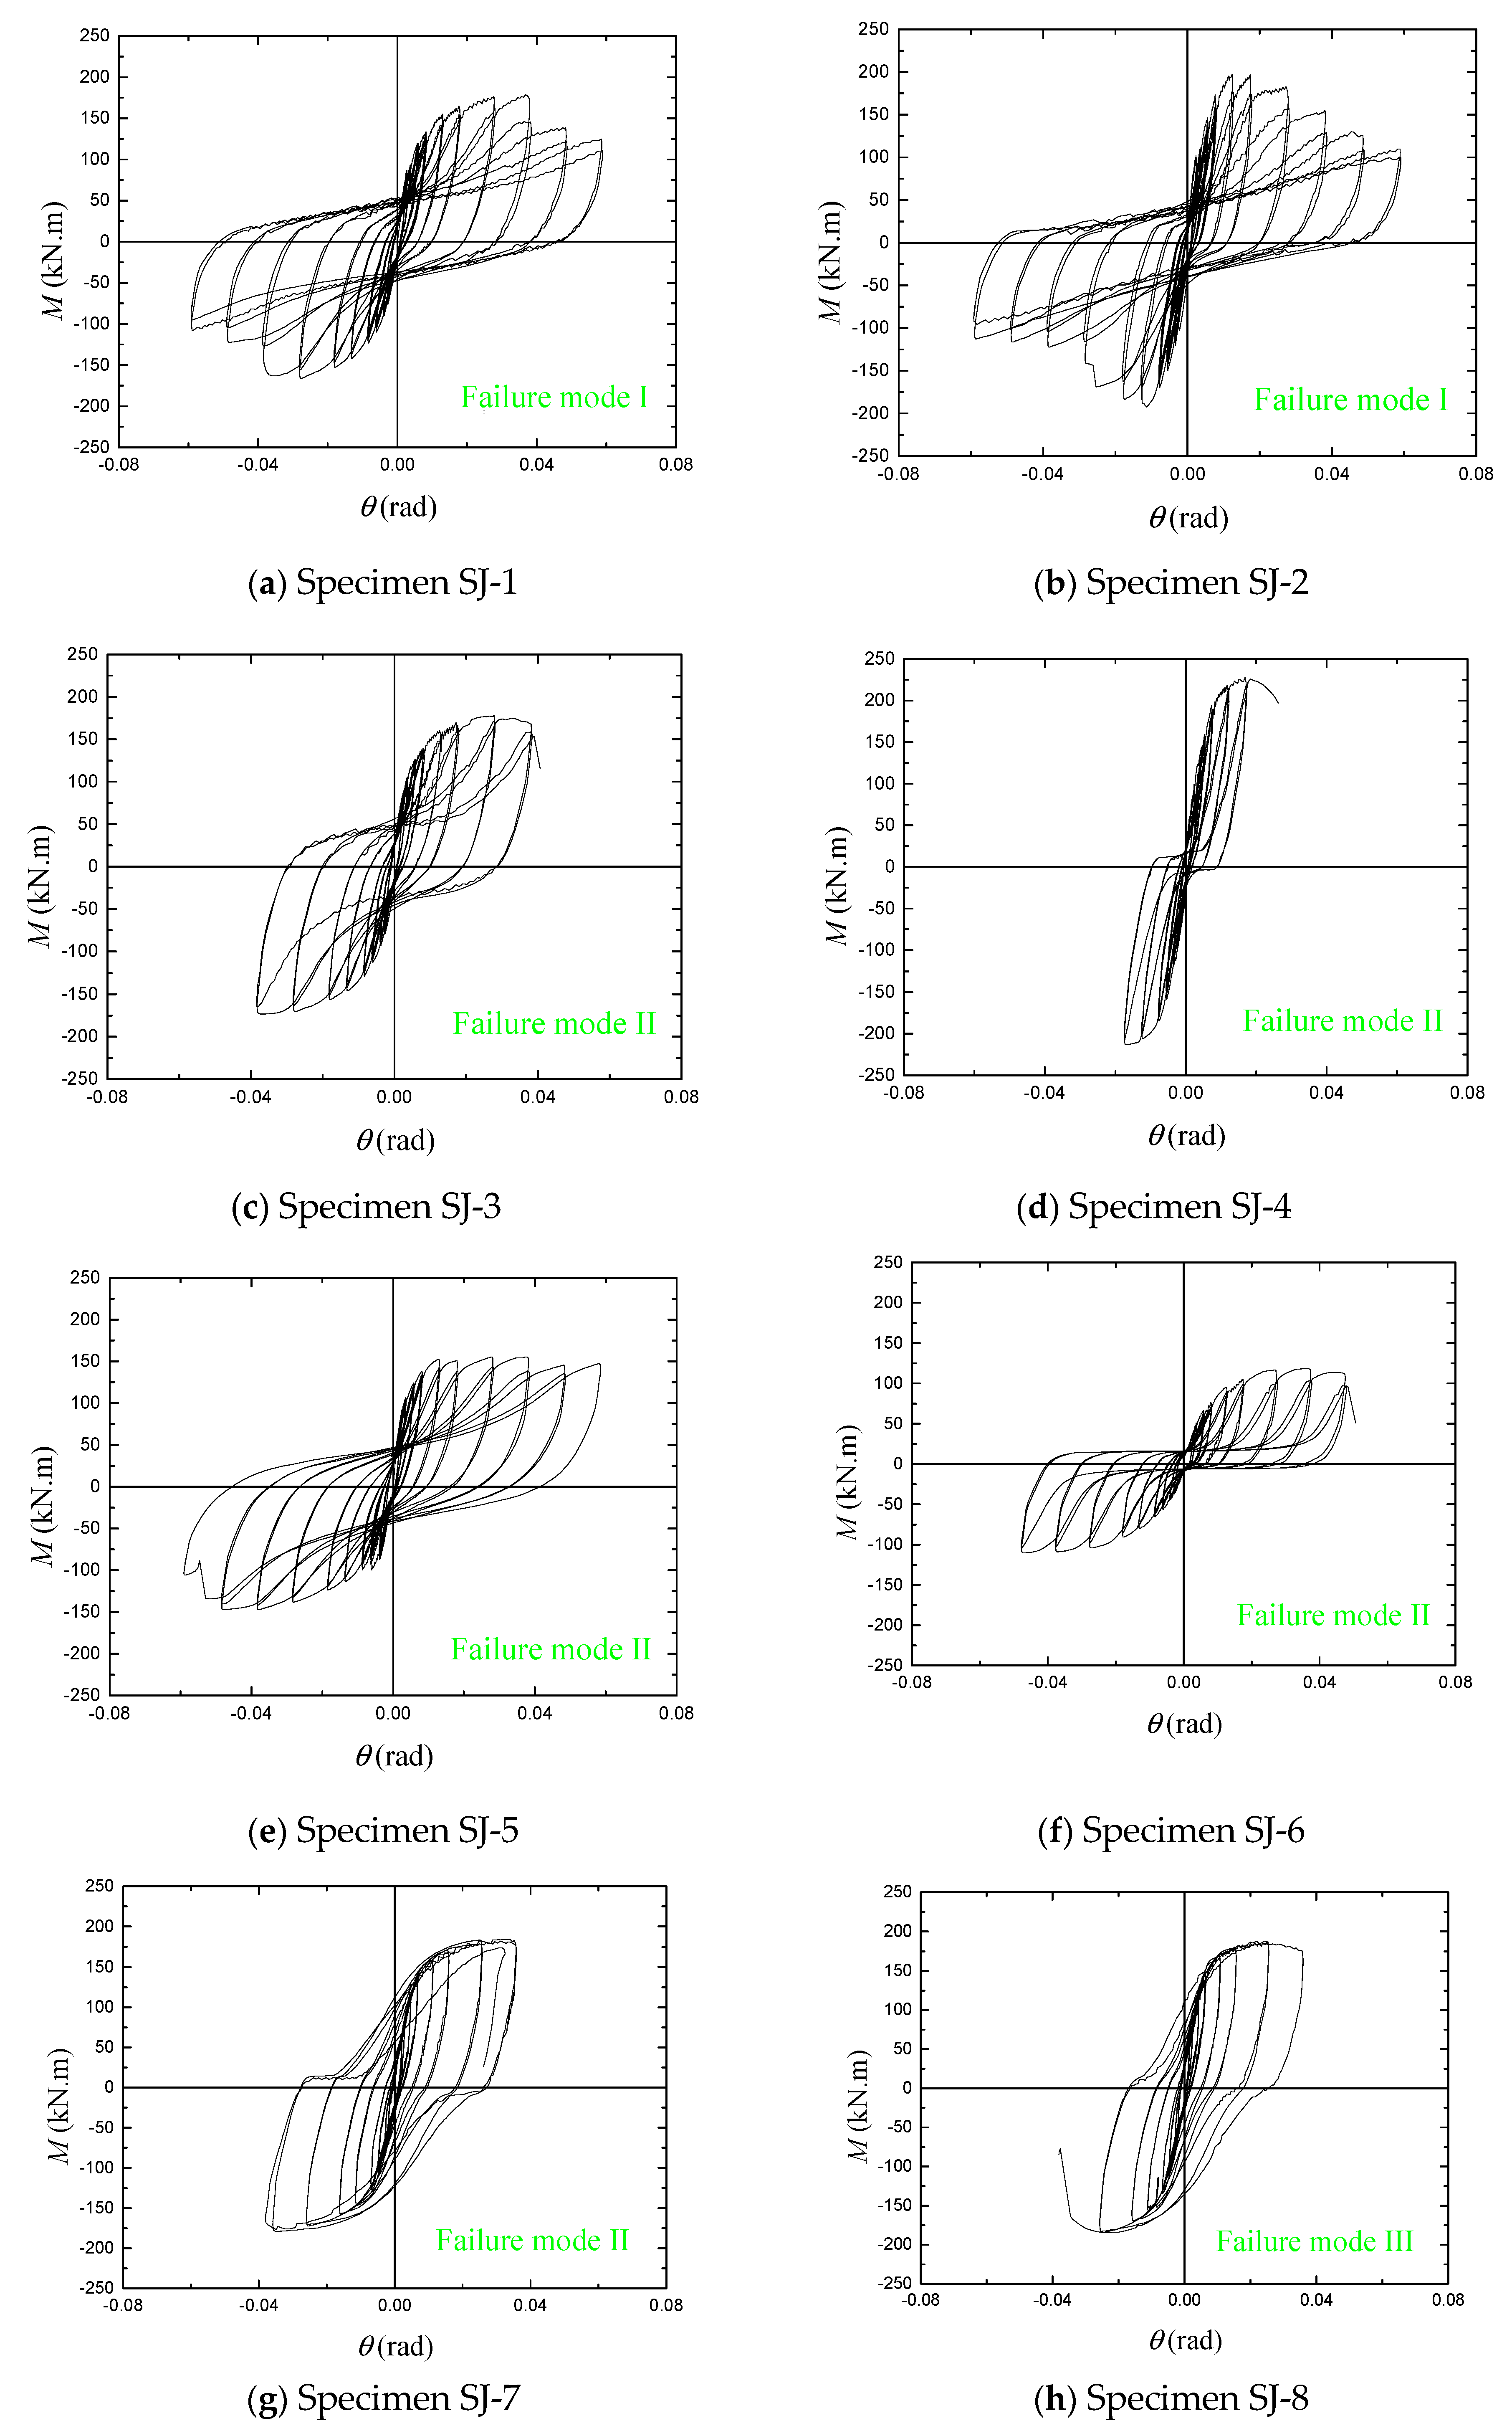
The moment-rotation hysteresis curves of the test specimens are presented in Figure 13. The hysteresis curves of specimens SJ-1 through SJ-6 all exhibit a significant pinching effect, whereas those of specimens SJ-7 and SJ-8 exhibit a far smaller pinching effect. The pinching effect was caused by the bulging deformation of the steel tube face, the deformation of the end-plate, the slippage of the anchored bolts and the crushing of concrete. The moment-rotation curve of each specimen basically exhibited a linear relationship in the initial elastic stage. After entering the inelastic state, the hysteresis curve of the specimen gradually became plump. With increasing drift ratio, the pinching effect became more evident.
Specimens SJ-1, SJ-2, SJ-3, SJ-5, and SJ-6 all have a relatively plump hysteresis loop, demonstrating relatively strong hysteresis performance and seismic energy absorption capacities. The energy dissipation in specimens SJ-1 and SJ-2 was mainly realized by the crushing of concrete in the columns and the deformation of the steel tube walls, which was not an expected failure mode in engineering practice. Moreover, specimens SJ-1 and SJ-2, which experience failure mode I, exhibited particularly remarkable stiffness and strength degradation compared with the other specimens, which is attributed to the same reasons mentioned above. However, for specimens SJ-3, SJ-5, and SJ-6, which exhibit failure mode II, the stiffness and strength degradation were not significant.
Due to its failure mode with brittle bolt fracture, the hysteresis loop of specimen SJ-4 is flat, indicating the poor ductility and energy dissipation capacity of the joint. Due to the weak beam used in specimens SJ-7 and SJ-8, a plastic hinge was observed at the root of the beam end, and the hysteresis loop was very plump, reflecting the highest hysteresis performance of the overall joints and subsequently good seismic performance and energy dissipation capacity.
The different structural parameters of an anchored blind-bolted joint lead to different failure modes, which are eventually reflected in their different hysteresis curves. In addition, the bulging deformation of the steel tube wall can produce a good energy dissipation capacity but will also cause significant stiffness and strength degradation; the use of a thin end-plate and weak beam resulted in better hysteretic performance, which amounts to excellent seismic performance and energy dissipation capacity.

4.2. Moment-Rotation Envelope Curves

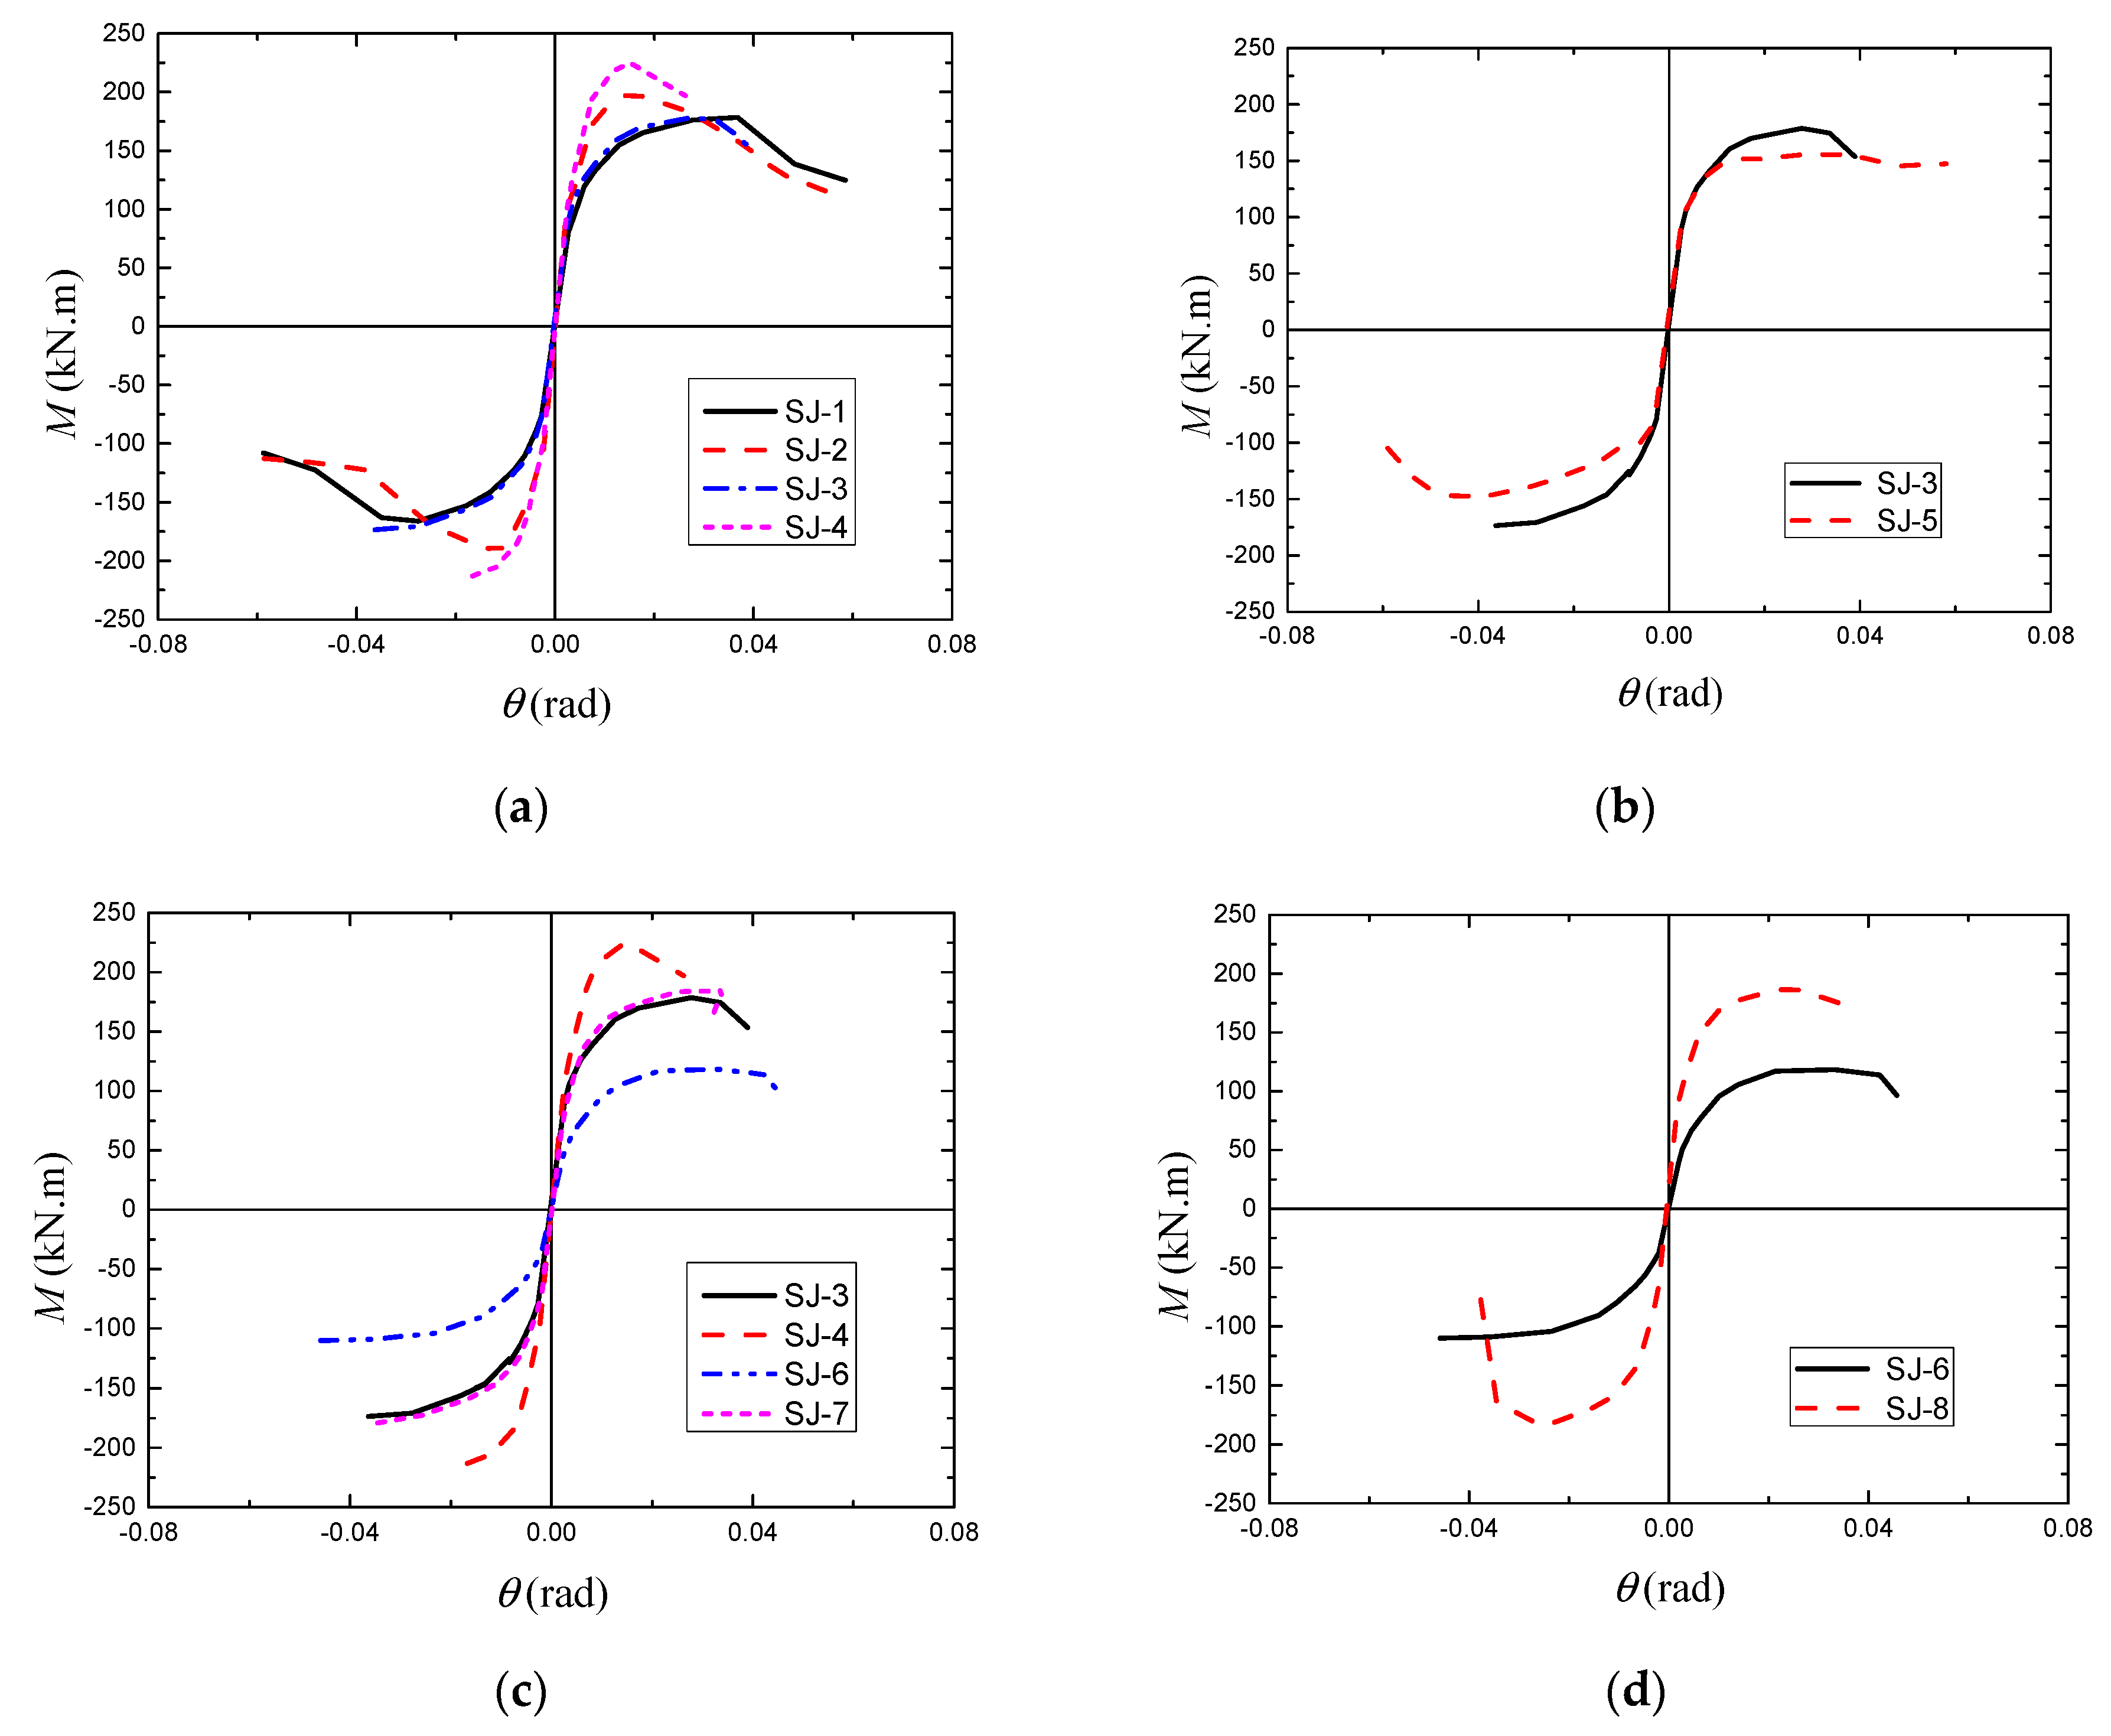
The moment-rotation envelope curves of different specimens are compared in Figure 14, which are averaged for comparative purposes. Figure 15 defines the key parameters in the moment-rotation relationship of the joints. In this study, the yield points of all specimens were determined using the same criterion to conduct a comparative analysis among the specimens. Therefore, a general yield moment method [24], one of the commonly used defining methods, was adopted in this study, where point B is the equivalent yield point. The moment and the rotation corresponding to point B are the yield moment (My) and yield rotation (θy) of the connection. The moment and the rotation corresponding to the highest point of the M-θ curve are defined as the measured flexural resistance (Mmax) and the corresponding rotation (θmax), respectively. With reference to the definitions presented by Wang et al. [5] and Tao et al. [25], Mf = 0.85 Mmax is the failure moment of the connection, and the corresponding rotation is the failure rotation (θf), which represents the rotation ability of a joint in this paper. Table 4 summarizes the main results for each key point of the specimen.

4.2.1. Effect of the Steel Tube Wall Thickness on Joint Performance

Figure 14a shows that the initial stiffness of specimen SJ-3 was 18.4% higher than that of specimen SJ-1. However, the initial stiffness of specimen SJ-4 was approximately equal to that of specimen SJ-2, indicating that a thicker steel tube only increased the stiffness to a limited extent; particularly for joints with thick end-plates, this effect was negligible. The flexural resistance of specimen SJ-3 approximately equal to that of specimen SJ-1, and the flexural resistance of specimen SJ-4 was only 14.1% higher than that of specimen SJ-2. These results indicate that an increase in the steel tube thickness also only had a slight improvement effect on the flexural resistance; particularly for joints with thin end-plates, this effect was negligible. Both the horizontal and vertical spacings of the bolts in the extended end-plate joints were relatively large, and the critical tensile capacity of the anchored blind bolts was higher at anchorage failure. Thus, a greater steel tube thickness did not provide the expected improvement in flexural resistance.

4.2.2. Effect of the End-Plate Thickness on Joint Performance

Figure 14a illustrates the initial stiffness of specimens SJ-2 and SJ-4 respectively increased by 37.7% and 20.7%, compared to those of specimens SJ-1 and SJ-3, indicating that increasing the end-plate thickness could increase the initial stiffness of the joint; this effect was more pronounced for joints with thin steel tubes. The flexural resistances of specimens SJ-2 and SJ-4 were 10.5% and 26% higher than those of specimens SJ-1 and SJ-3. When the connections exhibited failure mode I, an increase in the end-plate thickness had a limited influence on the flexural resistance, which was controlled by the CFST columns. However, when the connections exhibited failure mode II, a thicker end-plate resulted in a greater increase in the flexural resistance. This phenomenon occurred because the flexural resistance was controlled by the bolts, and the end-plate thickness directly affected the deformation of the bolts.

4.2.3. Effect of the Local Strengthening Connection Method and Anchorage Method on Joint Performance

Figure 14b indicates that specimens SJ-5 and SJ-3 had comparable initial stiffness values. In the initial loading stage, the deformation of the thick steel tube wall was very small. Therefore, the effect of the local strengthening connection method on the joint can be neglected, and only the influence of the anchorage method needs to be considered. Thus, it can be concluded that the change in the anchorage method (with or without an anchor nut) had little influence on the initial stiffness of the joint. The flexural resistance of specimen SJ-5 was 13% less than that of specimen SJ-3, indicating that the local strengthening connection method and anchorage method had a certain weakening effect on the flexural resistance.

4.2.4. Effect of the Steel Beam Section on Joint Performance

As shown in Figure 14c, the flexural resistance and initial stiffness of specimen SJ-3 were 50.9% and 62.4% higher than those of SJ-6, respectively. Moreover, the flexural resistance and initial stiffness of specimen SJ-4 were 22% and 28% higher than those of SJ-7, respectively. Therefore, an increase in the beam section size increased the initial stiffness and flexural resistance of the joint, and this effect was especially pronounced for the joints with thin end-plates. This was due to that the thick end-plate directly affected the failure mode of the joint and had a greater influence on the joint performance than the steel beam section.

4.2.5. Effect of the Stiffeners on Joint Performance

Figure 14d shows that the initial stiffness and flexural resistance of specimen SJ-8 were 47.9% and 59% higher than those of SJ-6, indicating that the use of stiffeners significantly improved the initial stiffness and flexural resistance of the joint.

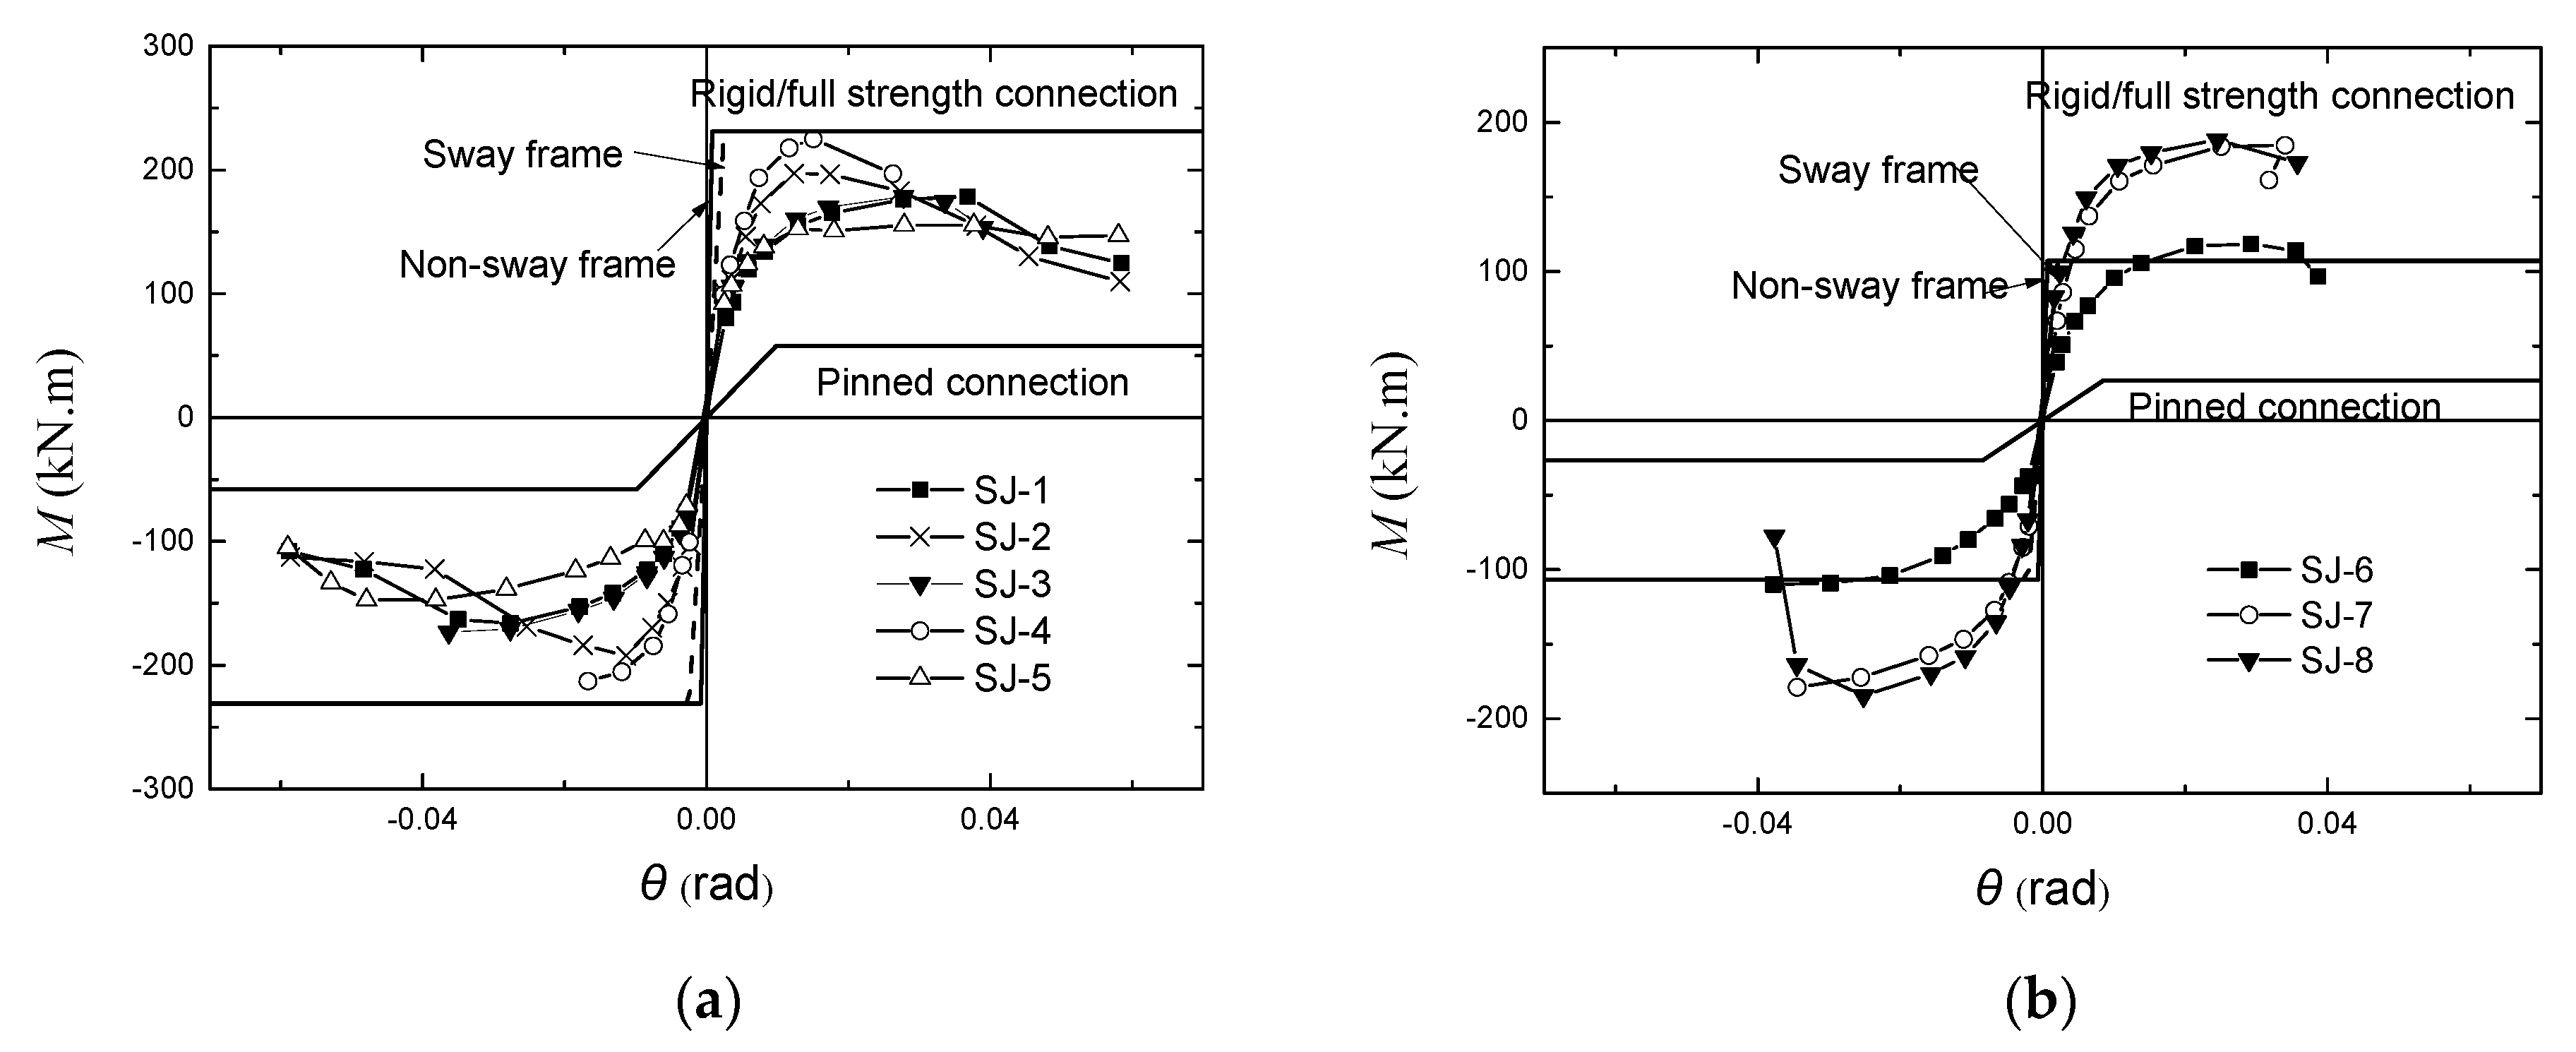
4.3. Classification of the Tested Joints

According to EC3 Part 1-8 [26], joints can be classified as rigid joints, nominal pinned joints, and semi-rigid joints in terms of their rotational stiffness. The detailed classifications are as follows: for a rigid connection, KikbEbIb/Lb; for a pinned connection, Ki ≤ 0.5EbIb/Lb; and for a semirigid connection, 0.5EbIb/Lb < Ki < kbEbIb/Lb. Note that in these classifications, Eb is the elastic modulus of the steel beam, Ib is the second moment of area for the steel beam, Lb is the beam span, and kb = 8 (for a braced frame) or 25 (for a non-braced frame). According to the flexural resistance, joints can be divided into full-strength joints, nominal pinned joints, and partial-strength joints. The detailed classifications are as follows: for a full-strength joint, MuMbp; for a pinned joint, Mu ≤0.25Mbp; and for a partial-strength joint, 0.25Mbp < Mu < Mbp. Note that in these classifications, Mu is the flexural resistance of the joint and Mbp is the designed plastic moment resistance of the steel beam. The classification of the tested joints is shown in Figure 16. The results show that the anchored blind-bolted extended end-plate joints to CFST columns with a strong beam are classified as semi-rigid and partial-strength joints, whereas those with a weak beam are in the range of semi-rigid and full-strength.

4.4. Rotational Capacity and Ductility Ratio

The rotational capacities of the specimens are presented in Table 4 and compared in Figure 17a. The European standard Eurocode-8 [27] specifies a connection rotation [θf] of 0.025rad for the connections in frames of medium ductility class (DCM). Table 4 shows that for all tested joints, the θf-values are greater than 0.025rad. To meet the ductility requirement for seismic design, the American standard FEMA-350 [28] suggests that θf should not be less than 0.03 rad. Only the θf-value of specimen SJ-4 is less than 0.03 rad, due to the premature brittle fracture of bolt. A comparison with the rotational capacity requirements in various codes shows that the anchored blind-bolted joint can exhibit a good rotational capacity and can satisfy the relevant earthquake-resistant requirements of both Eurocode-8 and FEMA-350.
Ductility is a main parameter reflecting the post-yield deformation capacity and is also an important index in the seismic design of composite structures. The angular ductility coefficient (μθ) is used in this study to analyze the deformation capacity of the anchored blind-bolted joint under seismic loading, and this coefficient is expressed as follows:
u θ = θ f θ y
where θf is the failure connection rotation and θy is the yield connection rotation.
Figure 17b shows a comparison of the ductility coefficients of the specimens. The specimens with failure mode I (due to the outward deformation of the steel tube wall) and the specimens with failure mode III (due to the local buckling of the steel beam) both have good ductility. The specimens fail in mode II have good ductility if they have thin end-plates and weak beams but have poorest ductility if they only have thick end-plates, just like specimen SJ-4. However, for the specimens that fail in mode I, significant concrete crushing and local buckling of the steel tube faces occurred, and the blind bolts could not reach their ultimate strength, resulting in a low flexural resistance.
The ductility coefficient of specimen SJ-5 was the highest among all specimens, indicating that the local strengthening of the connection without plug welding and the anchorage method without an anchor nut could greatly increase the ductility. A certain gap could be formed between the C-channel and the steel tube wall, and the absence of an anchor nut caused the bolt to slip to a certain extent, ultimately resulting in the maximum specimen ductility.
The ductility coefficient of specimen SJ-8 with stiffeners was 24.3% higher than that of specimen SJ-6. This phenomenon mainly occurred because the stiffeners resulted in more pronounced local buckling at the root of the beam. It is indicated the use of stiffener can change the deformation pattern of the joint to improve the ductility and ensure the high strength and stiffness.
The effect of the end-plate thickness on the ductility is related to the failure mode. For specimens SJ-1 and SJ-2, which exhibit failure mode I, the ductility of the two specimens was nearly equal because the joint failure was mainly governed by the steel tube wall. For the specimens that exhibit failure mode II, the ductility coefficient of specimen SJ-3 with thin end-plates was 47.6% higher than that of specimen SJ-4 with thick end-plates, indicating that the reduction in the end-plate thickness significantly enhanced the ductility of the joint.

4.5. Strength Degradation

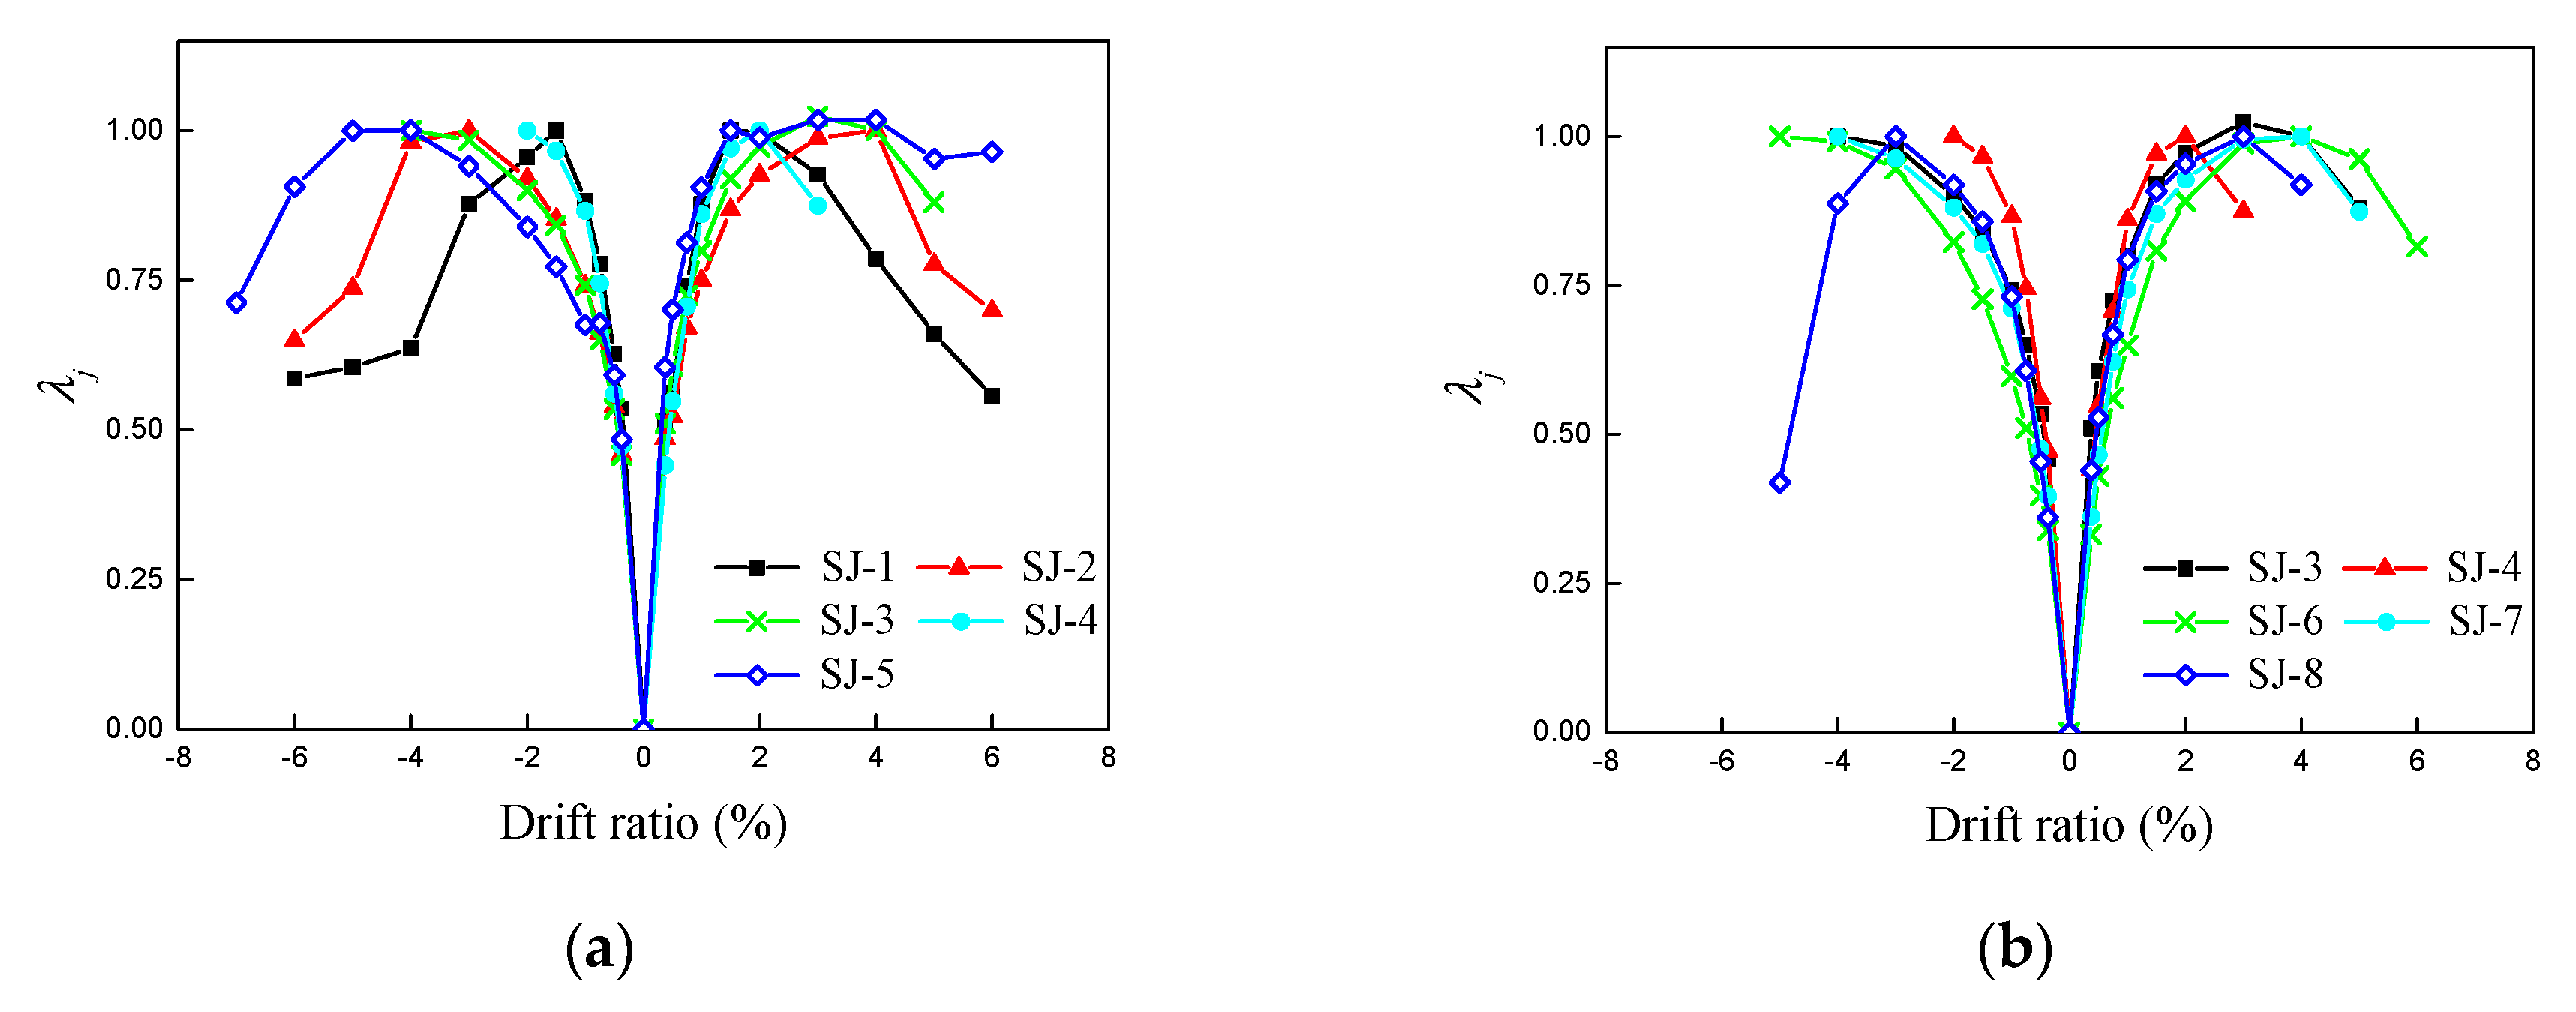
Repeated cyclic loading resulted in strength degradation for the anchored blind-bolted joints. The strength degradation in the specimens under the same drift level can be evaluated using the strength degradation coefficient (λi) recommended by Wang et al. [29]. For the tested joints, a significant stiffness degradation occurred only when the drift ratio exceeded 1%. After reaching that drift ratio, there were only two loading cycles for each drift level. Hence, the strength degradation coefficient (λi) can be expressed as the ratio of the peak point load in the second cycle to the peak point load in the first cycle.
Figure 18 shows the curves of the strength degradation coefficient (λi) at the same drift level versus the drift ratio. There was no significant stiffness degradation in the specimens at the same drift level in the elastic stage. After the specimens reached the flexural resistance, specimens SJ-1 and SJ-2 exhibited significant strength degradation at the same drift level, whereas the other specimens exhibited moderate stiffness degradation. For specimens SJ-1 and SJ-2, which exhibit failure mode I, when the specimens reached the flexural resistance, anchorage failure would occur, and the infill concrete suffered significant damage, directly resulting in significant strength degradation. However, as the loading continued, the stiffness degradation coefficient (λi) of the two specimens gradually increased, mainly due to the redistribution of the internal forces between the different components inside the steel tube after anchorage failure.
To evaluate the degree of strength reduction with increasing drift ratio during the entire loading process, the strength degradation coefficient of the entire loading process (λi) is introduced as follows:
λ j = P j P max
where Pj is the peak load associated with the jth drift level and Pmax is the maximum load during the entire loading process.
Figure 19 shows the curves of the strength degradation coefficient of the entire loading process (λj) versus the drift ratio. After reaching the peak values, the λj curves of specimens SJ-3 and SJ-5 were relatively gentle with an approximately horizontal stage, indicating that the two specimens, which had thick steel tube walls and thin end-plates, did not fail immediately after reaching the flexural resistance and could continue to withstand a certain load, thereby enhancing the joint performance. When specimens SJ-1 and SJ-2 reached the flexural resistance, significant stiffness degradation occurred throughout the entire process. This phenomenon was also due to the failure mode of these two specimens.

4.6. Stiffness Degradation

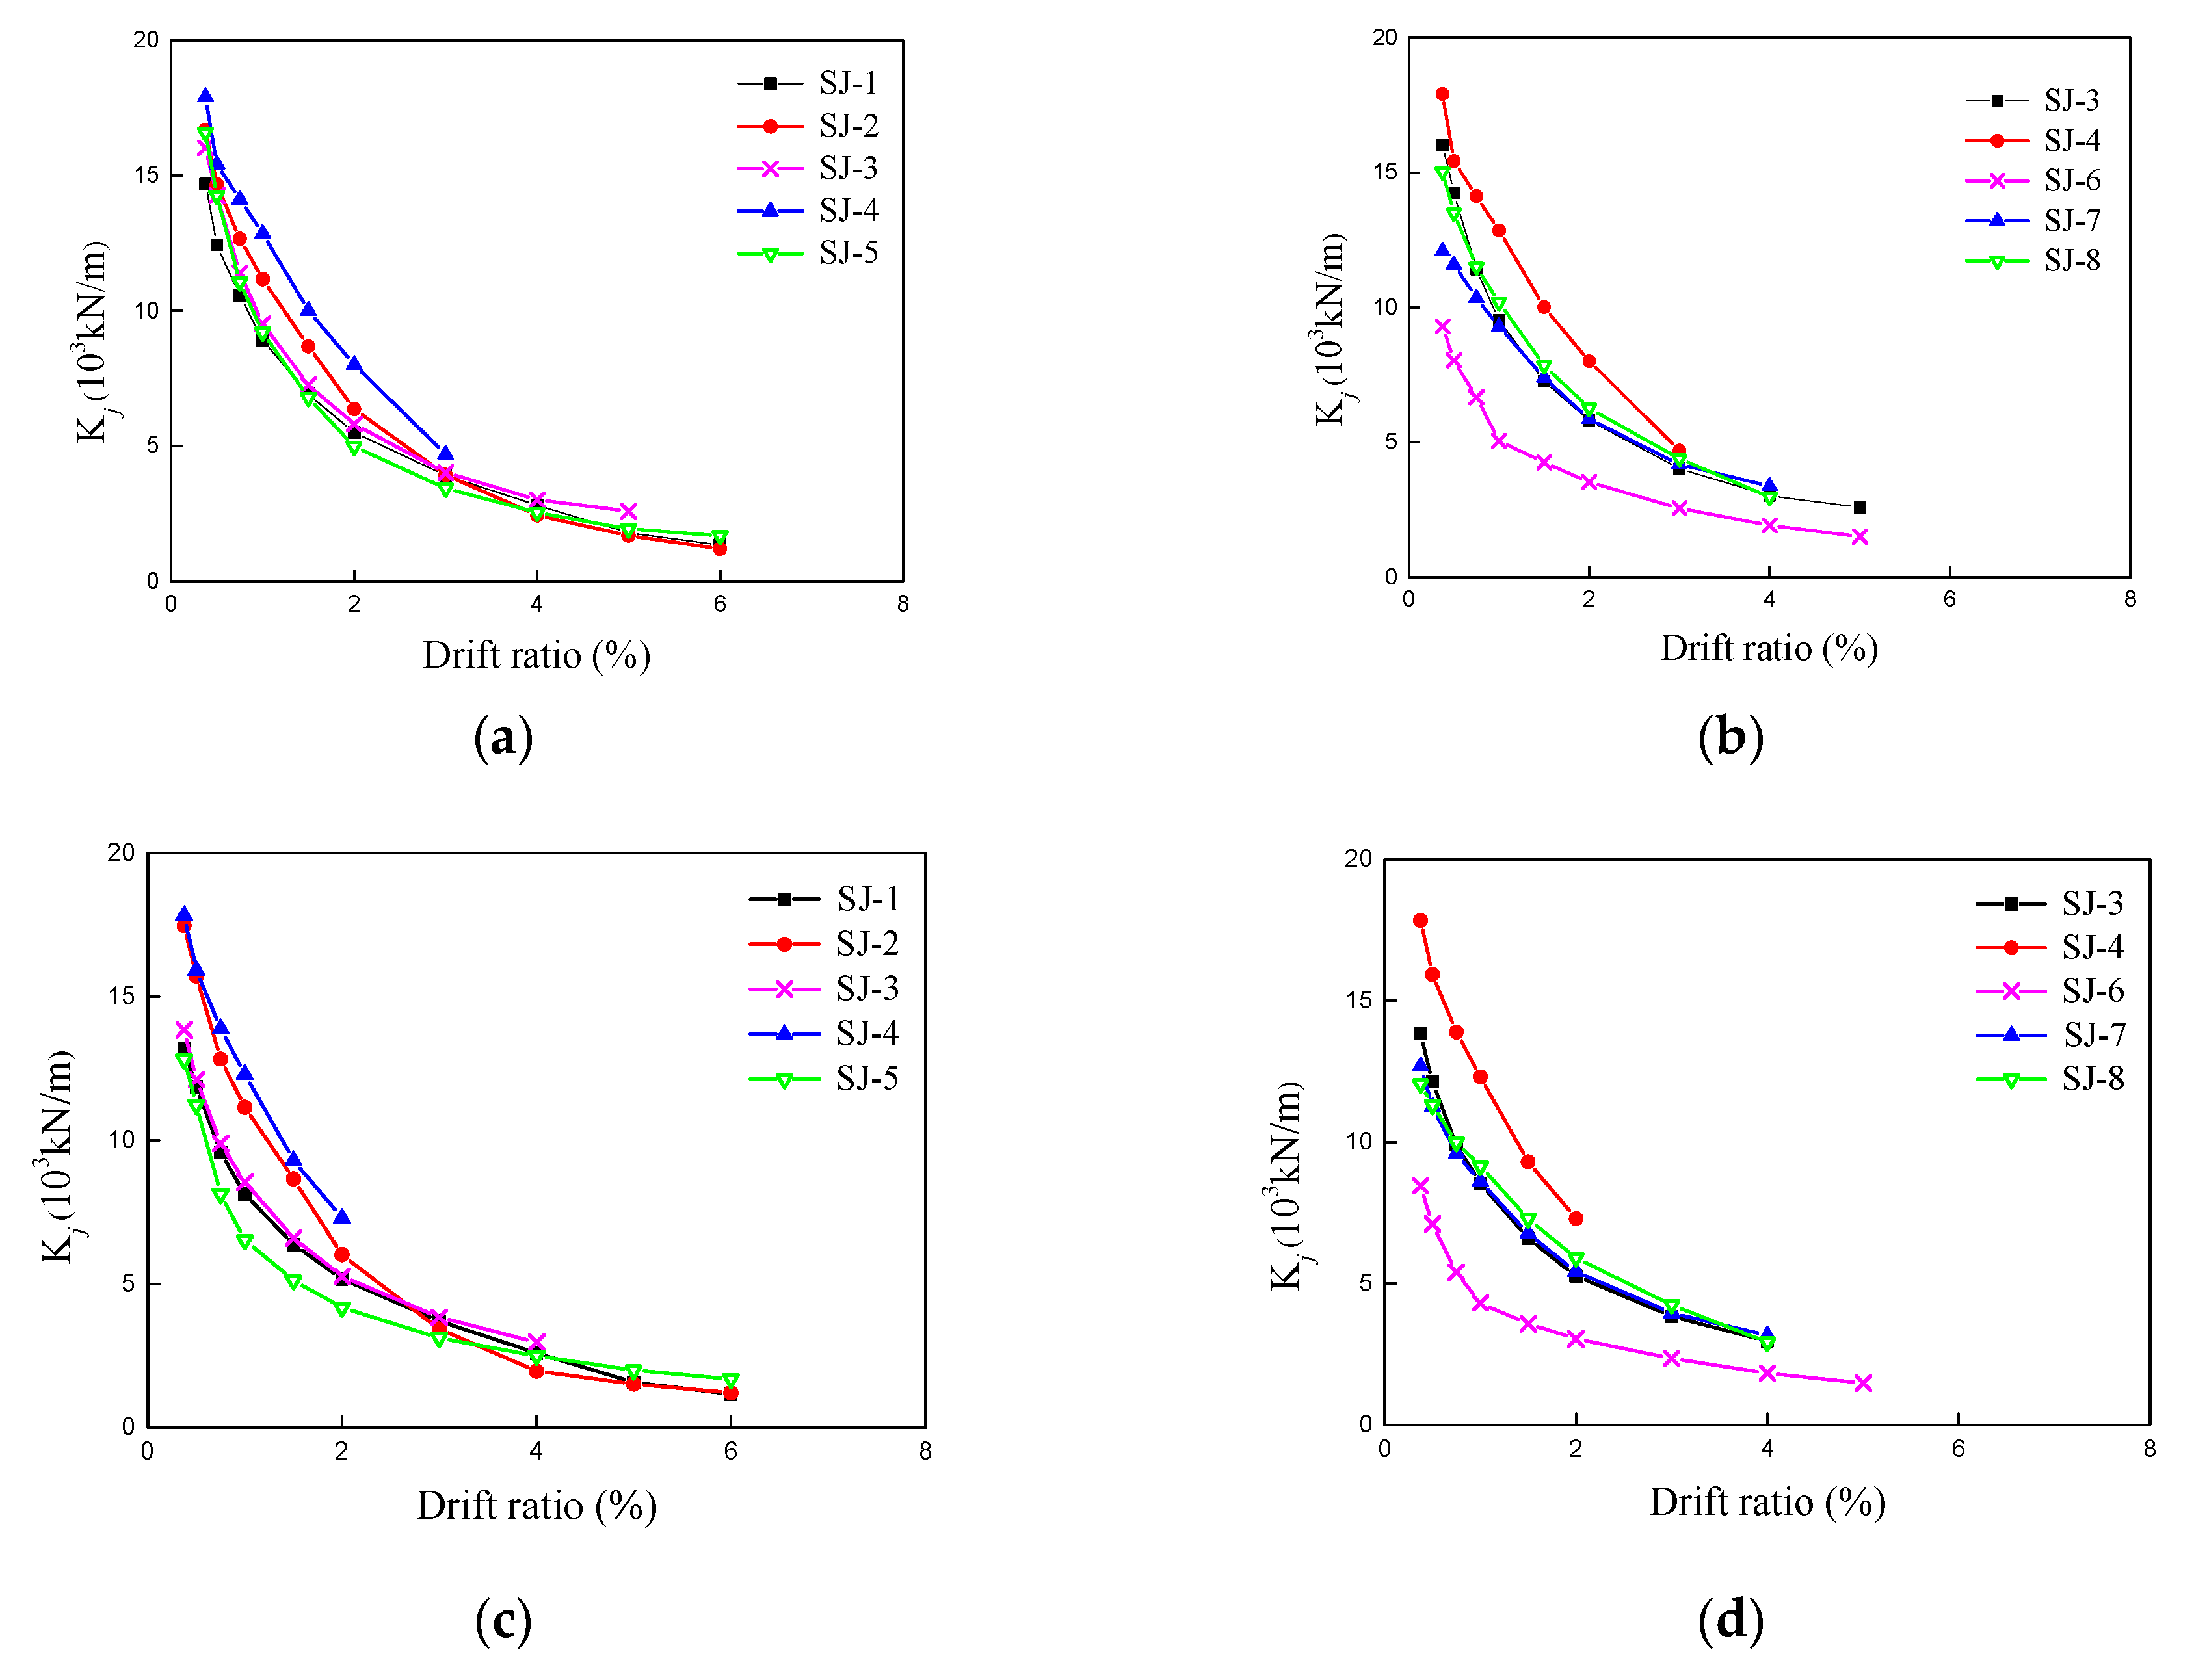
To estimate the stiffness degradation in a specimen during the entire loading process, the stiffness degradation coefficient (Kj) is introduced as follows:
K j = i = 1 n P j i i = 1 n u j i
where Pij and uij are the peak point load and its corresponding displacement in the ith loading cycle at the jth drift level, respectively, and n is the number of cycles.
Figure 20 shows the curves of the stiffness degradation coefficient (Kj) of the specimens versus the drift ratio. Greater end-plate thickness and the use of stiffeners significantly increased the joint stiffness and decreased the rate of stiffness degradation. The thicker steel tube wall resulted in greater stiffness but slowed the stiffness degradation with an insignificant magnitude. The use of a weak beam decreased the joint stiffness and increased the rate of stiffness degradation.

4.7. Energy Dissipation

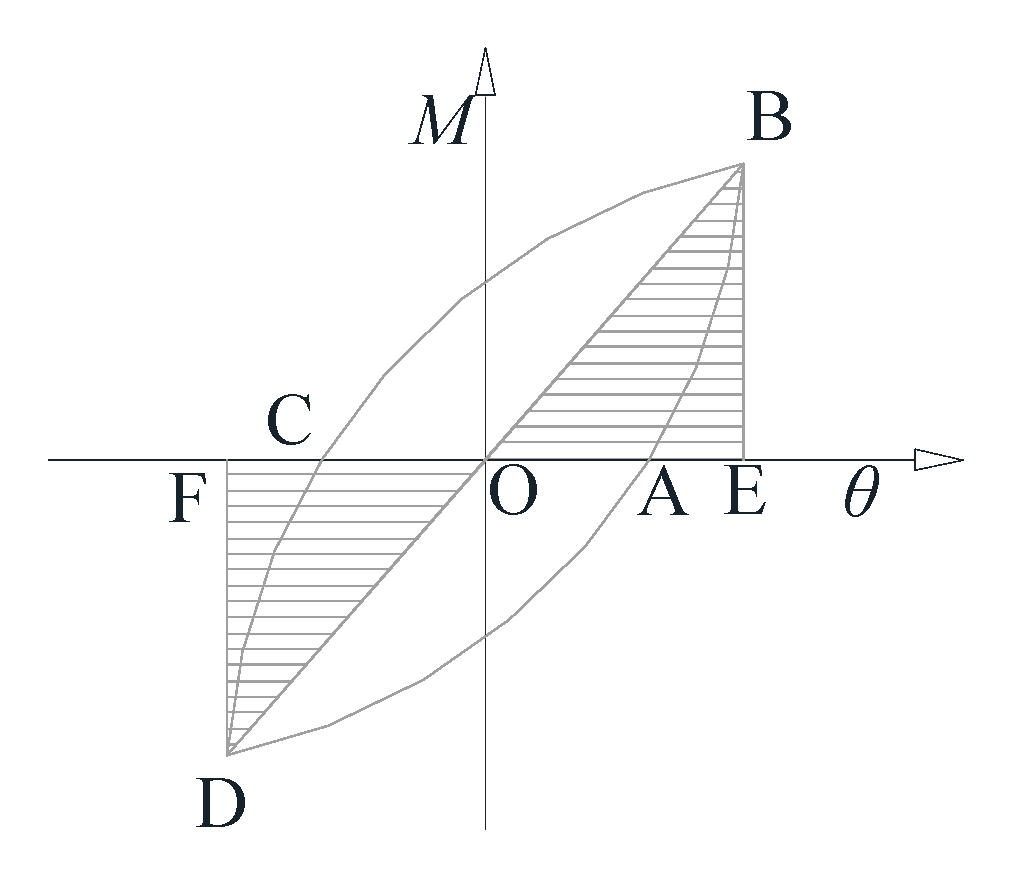
There are three key parameters used to evaluate the energy dissipation performance of a joint: the total dissipated energy (Wtotal), the equivalent viscous damping coefficient (ξe), and the energy dissipation coefficient (Ee). Wtotal is the cumulative dissipated energy (W) of the joint at each drift level of the loading process, where W is the area enclosed by the hysteresis curve at a certain cycle time, Ee is the ratio of the total energy in a hysteresis loop to the elastic energy of the component, and ξe = Ee /2π. The idealized load versus deflection relationship is presented in Figure 21, and E can be defined as follows:
E e = S ABC + S CDA S OBE + S ODF
where SABC and SCDA represent the areas enclosed by the upper half and lower half of the hysteresis loop, respectively, and SOBE and SODF represent the areas of the corresponding triangle, respectively.
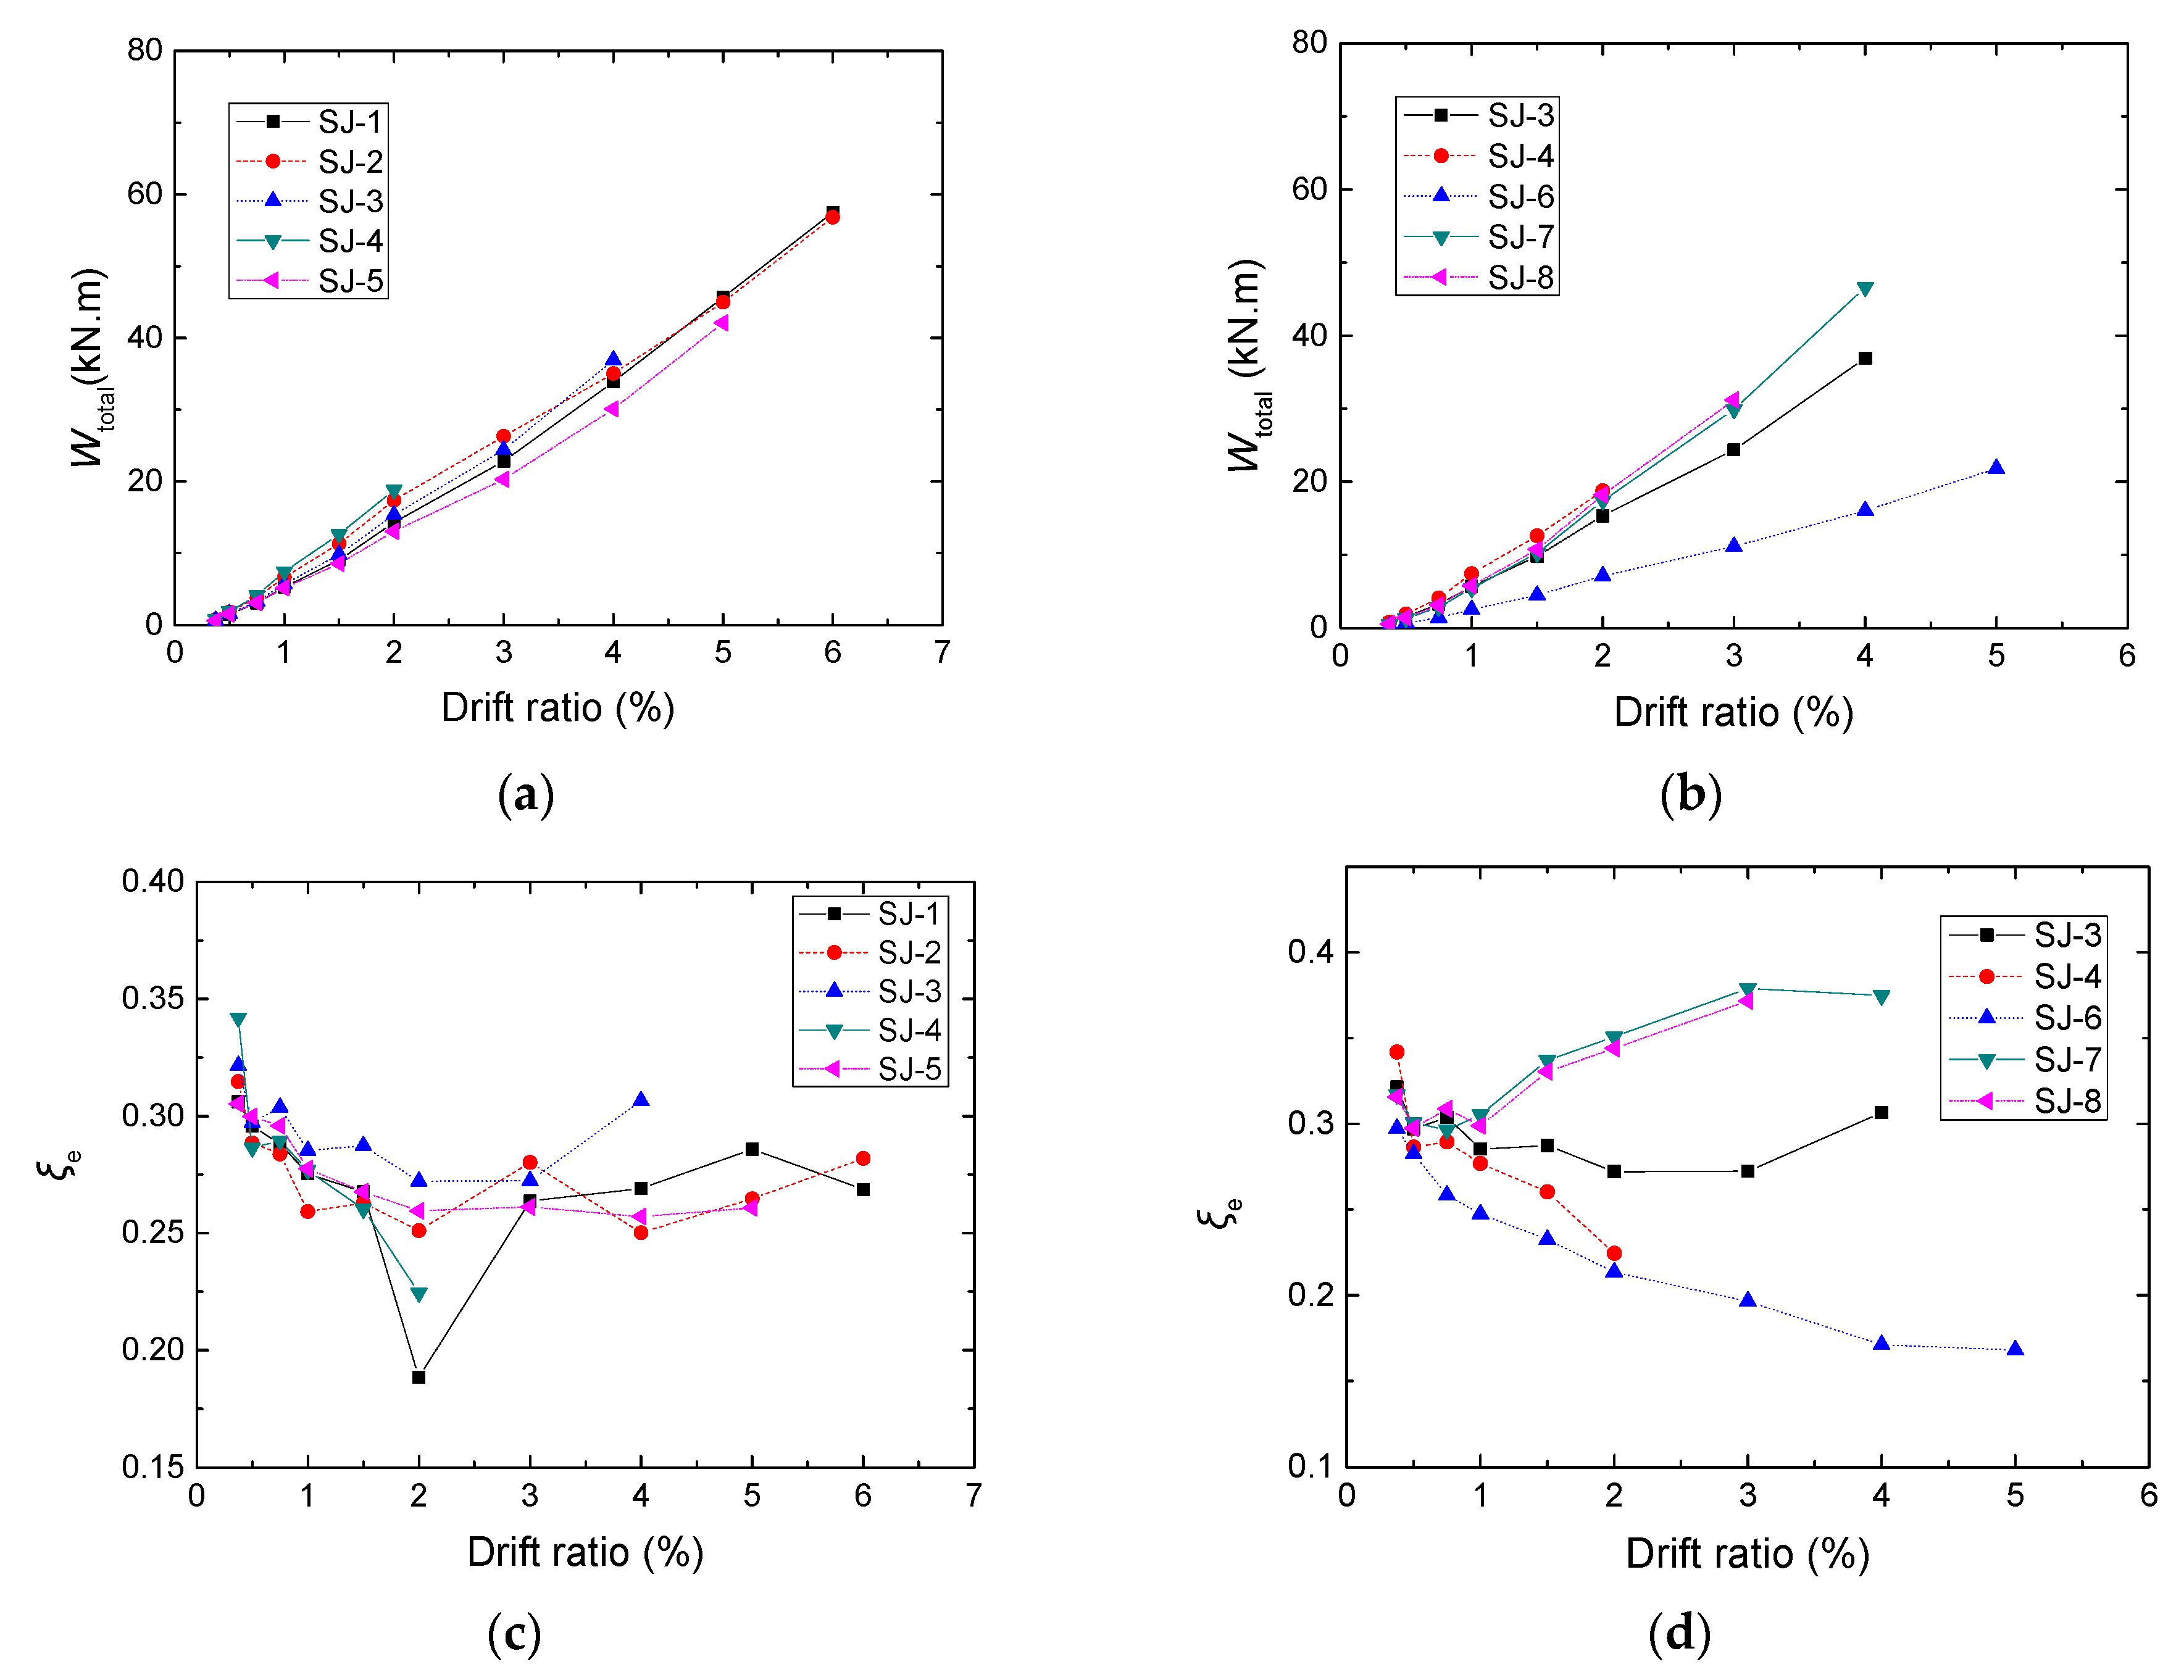
Table 5 compares the values of Wtotal, ξe, and Ee in the limit state, and Figure 22 shows the variation in Wtotal and ξe as a function of the drift ratio. Through comparison, the following conclusions can be drawn:
(1) The ξe values of specimens SJ-7 and SJ-8 are the largest among all the specimens, indicating that beam buckling deformation is the most effective method for dissipating energy in such joints. According to the American standard ANSI/AISC 341-10 [30], they also satisfy the seismic requirement for intermediate moment frames.
(2) The ξe values of specimens SJ-4 and SJ-6 are the smallest among all the specimens. This was due to that dissipating energy in such joints were mainly realized by the deformation of the bolt.
(3) The ξe values of specimens SJ-1, SJ-2, SJ-3 and SJ-5 are in the middle. For specimens SJ-1 and SJ-2, the joint dissipates energy mainly through the crushing of concrete and the deformation of the steel tube wall. For specimens SJ-3 and SJ-4, the energy dissipation is mainly achieved through the end-plate deformation. Those indicate that the energy dissipation of these two deformation modes is in the medium level.
(4) The use of stiffeners enhances the energy dissipation capacity of the joint; although a certain deformation of the end-plate is also found, the joint mainly dissipates energy through the local buckling deformation of the weak beam.
(5) When the joint exhibits failure mode I, increasing the end-plate thickness has little effect on the energy dissipation capacity of the joint. When the joint exhibits failure mode II, increasing the end-plate thickness significantly reduces the energy dissipation capacity of the joint.

5. Finite Element Analysis

5.1. Finite Element Modeling

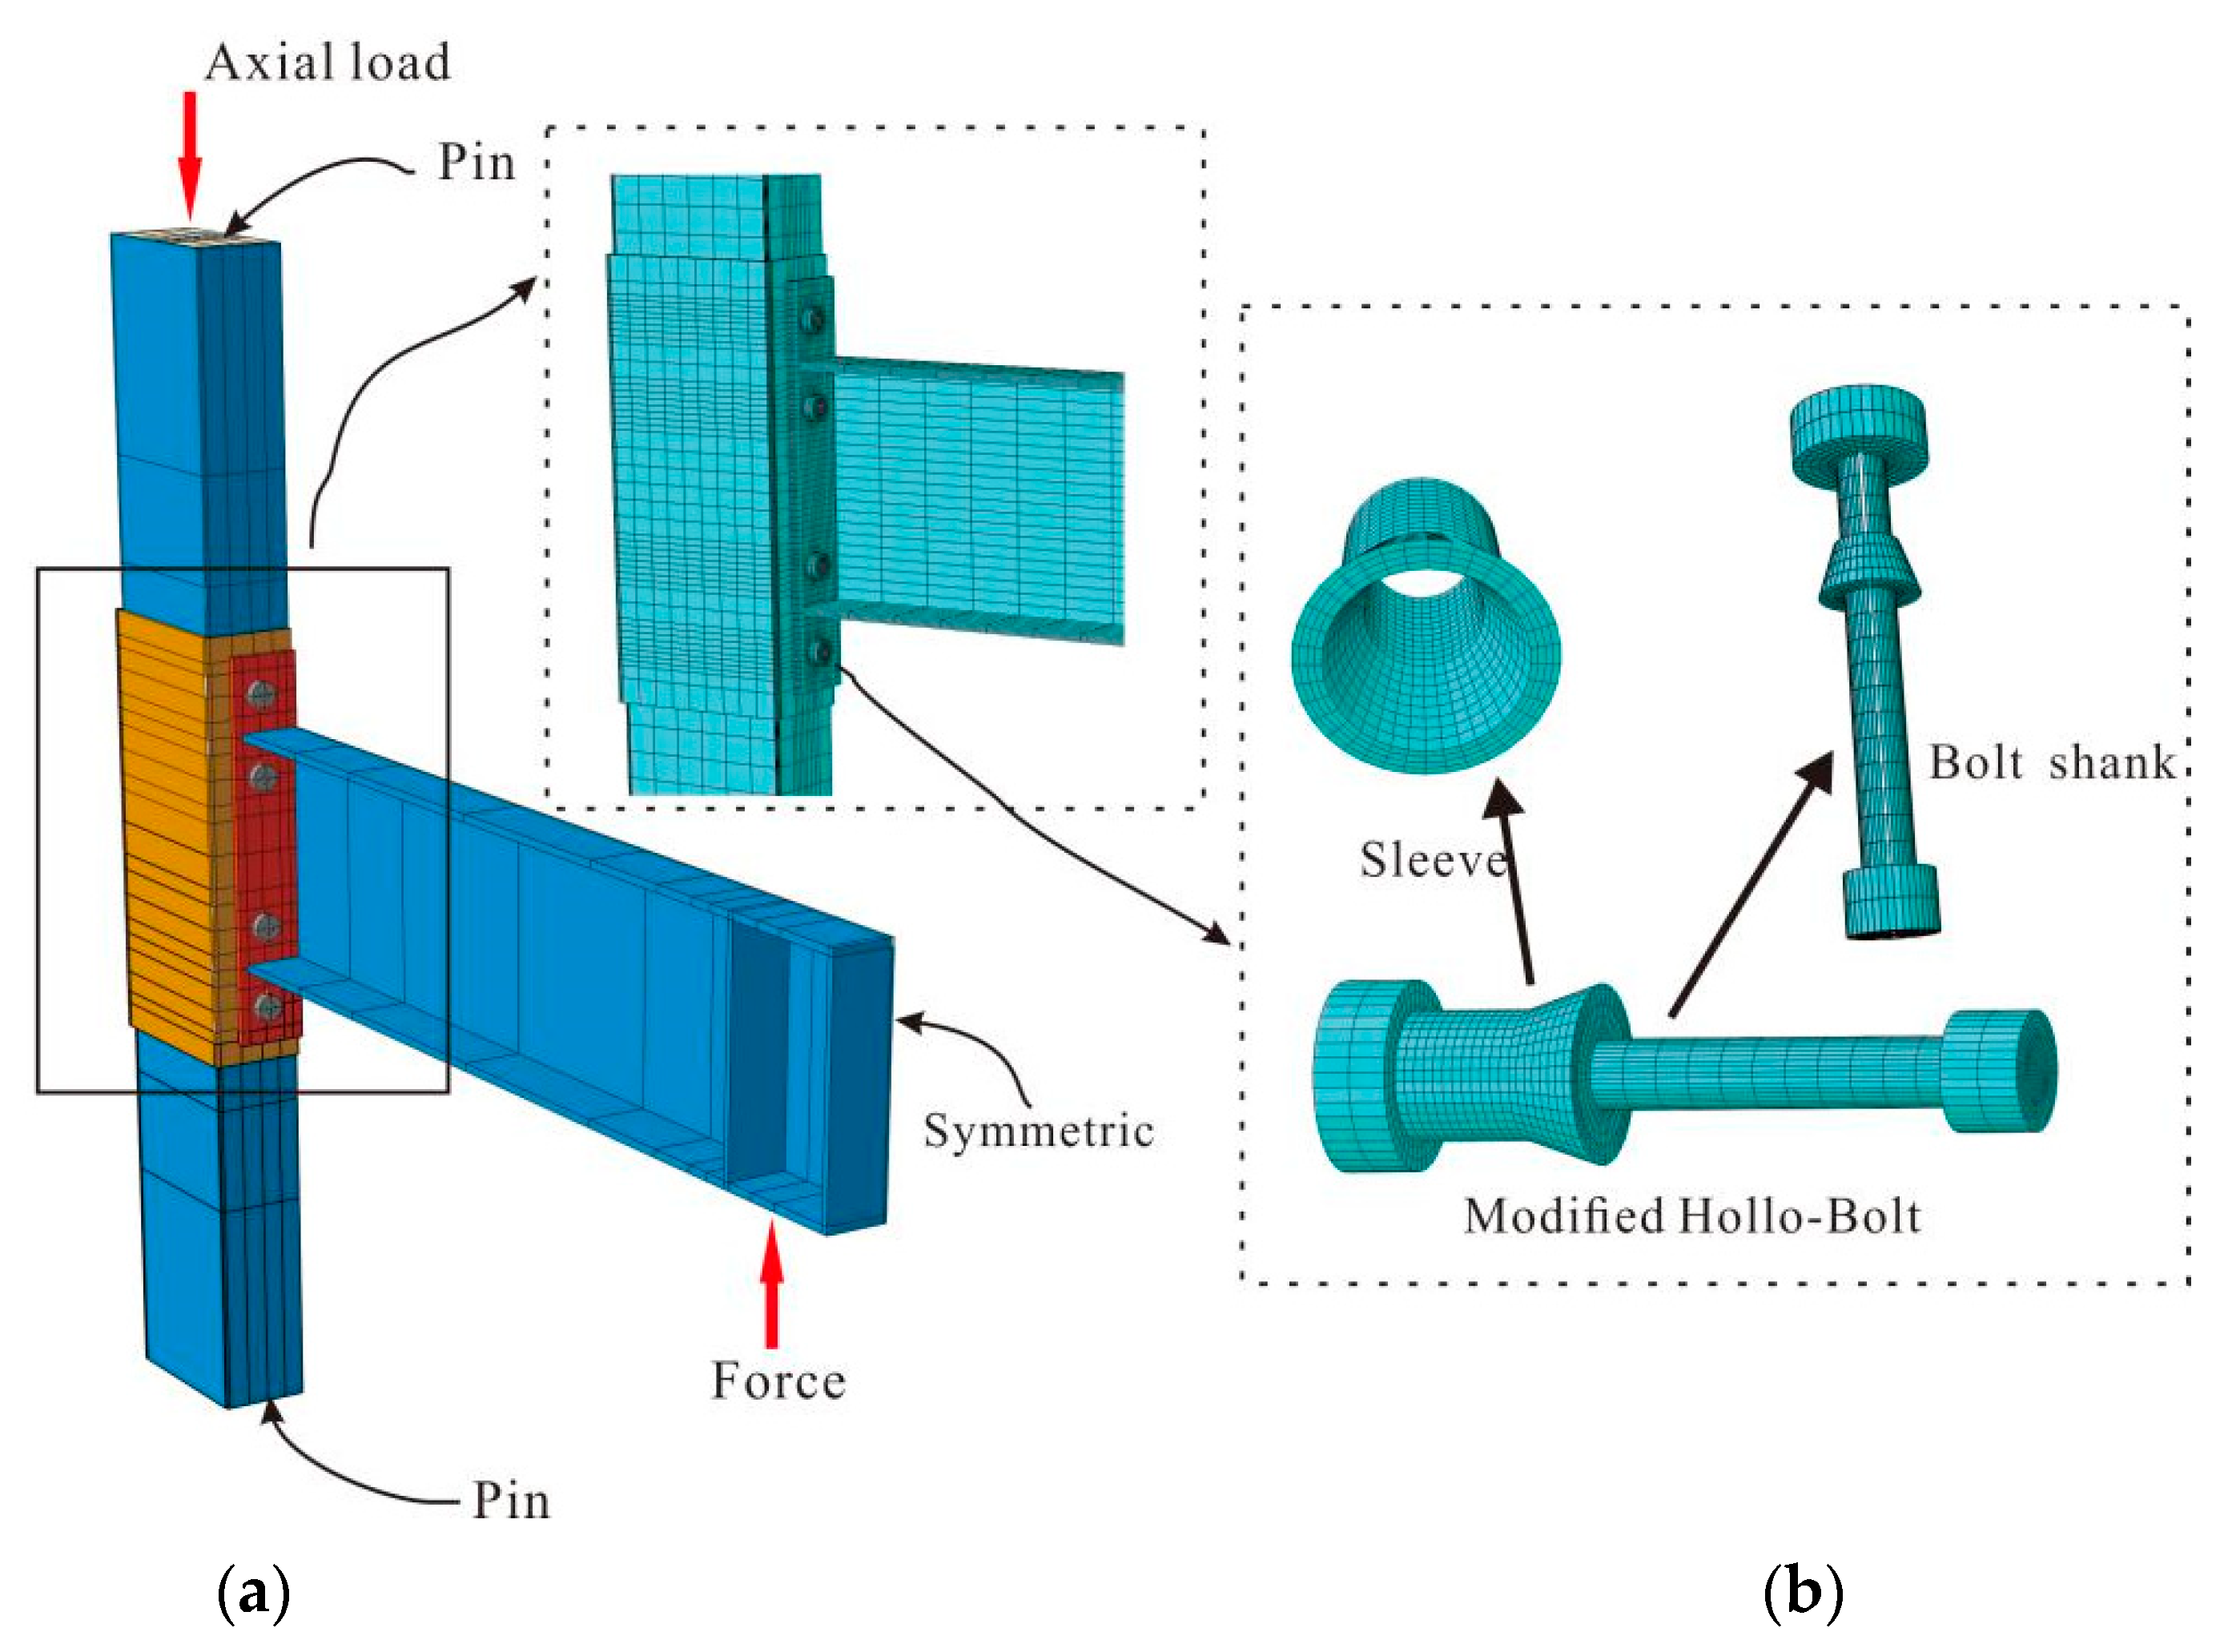
A three-dimensional finite element analysis (FEA) model was created using the ABAQUS/Standard module to represent the tested joint. Due to the symmetric conditions along the longitudinal plane, half of the connection was modeled to improve calculation efficiency. The material and geometric nonlinearities and complex contact interactions between the various elements were considered in the analysis. All parts were modeled using 8-node linear brick incompatible mode elements (C3D8R), which are a linear displacement interpolation solid (brick) based on reduced integration. The model was divided into seven parts: the end-plate, steel beam, steel tube wall, C-channel, concrete, bolt and sleeve. For model simplification, the bolt and nut were modeled as the same component, and the bolt heads and nuts were modeled as circular parts. The structured mesh control was adopted for all parts; the model assembly and mesh of the components are shown in Figure 23. The influence of the weld was ignored, and welding relationships between the steel components were achieved by tie constraints. The connections contain several different complex contact interfaces between the components, and surface-to-surface contact was employed in the FEA model to define those contacts, which consist of a contact pressure model in the normal direction and a Coulomb friction model in the tangential directions. The boundary conditions in the model were consistent with the actual boundary conditions of the specimens, and the symmetric boundary conditions were applied. As the test load was controlled through displacement, the load in the FEA was applied by establishing reference points coupled with the loading surface and applying a certain displacement value.
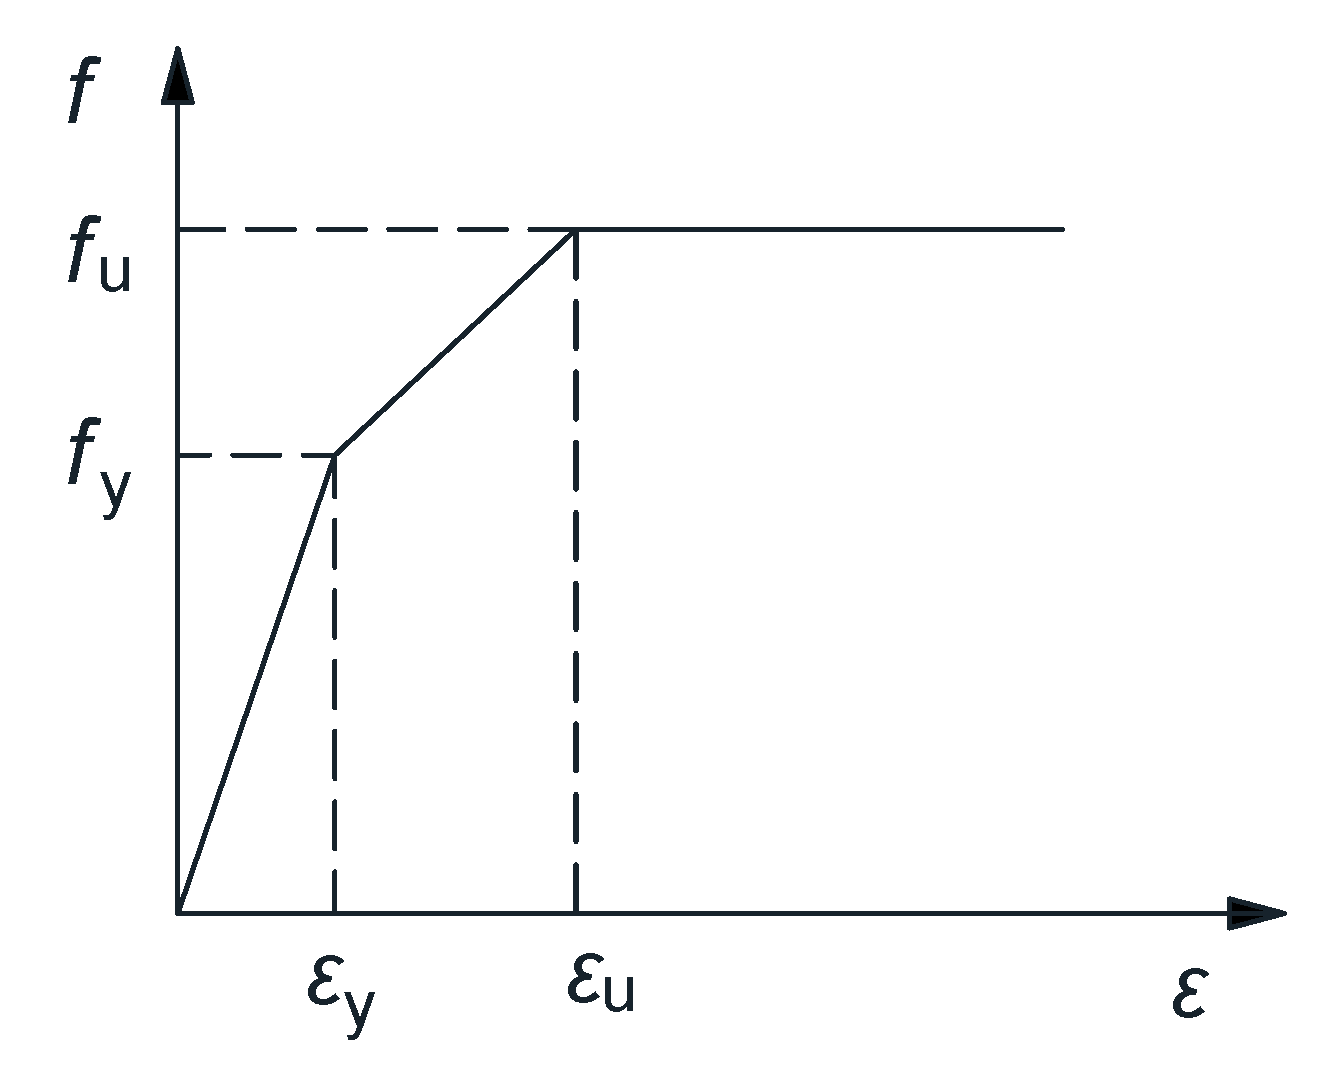
A simplified trilinear model proposed by Bahaari et al. [31] was proposed for the stress-strain relationship of the steel, as shown in Figure 24. The elastoplastic stress-strain relationship was based on the von Mises yield criteria and isotropic hardening rule. The damaged plasticity model was adopted for simulating the concrete properties in this study. The model allowed for the input of a multilinear uniaxial compression stress-strain curve and provided the general capability for the analysis of concrete under monotonic loading based on a damaged plasticity algorithm. This study adopted the uniaxial stress-strain relationship model proposed by Han et al. [32] for the core concrete in the ABAQUS software.

5.2. Finite Element Analysis and Test Result Comparison

5.2.1. Moment-Rotation Relationship

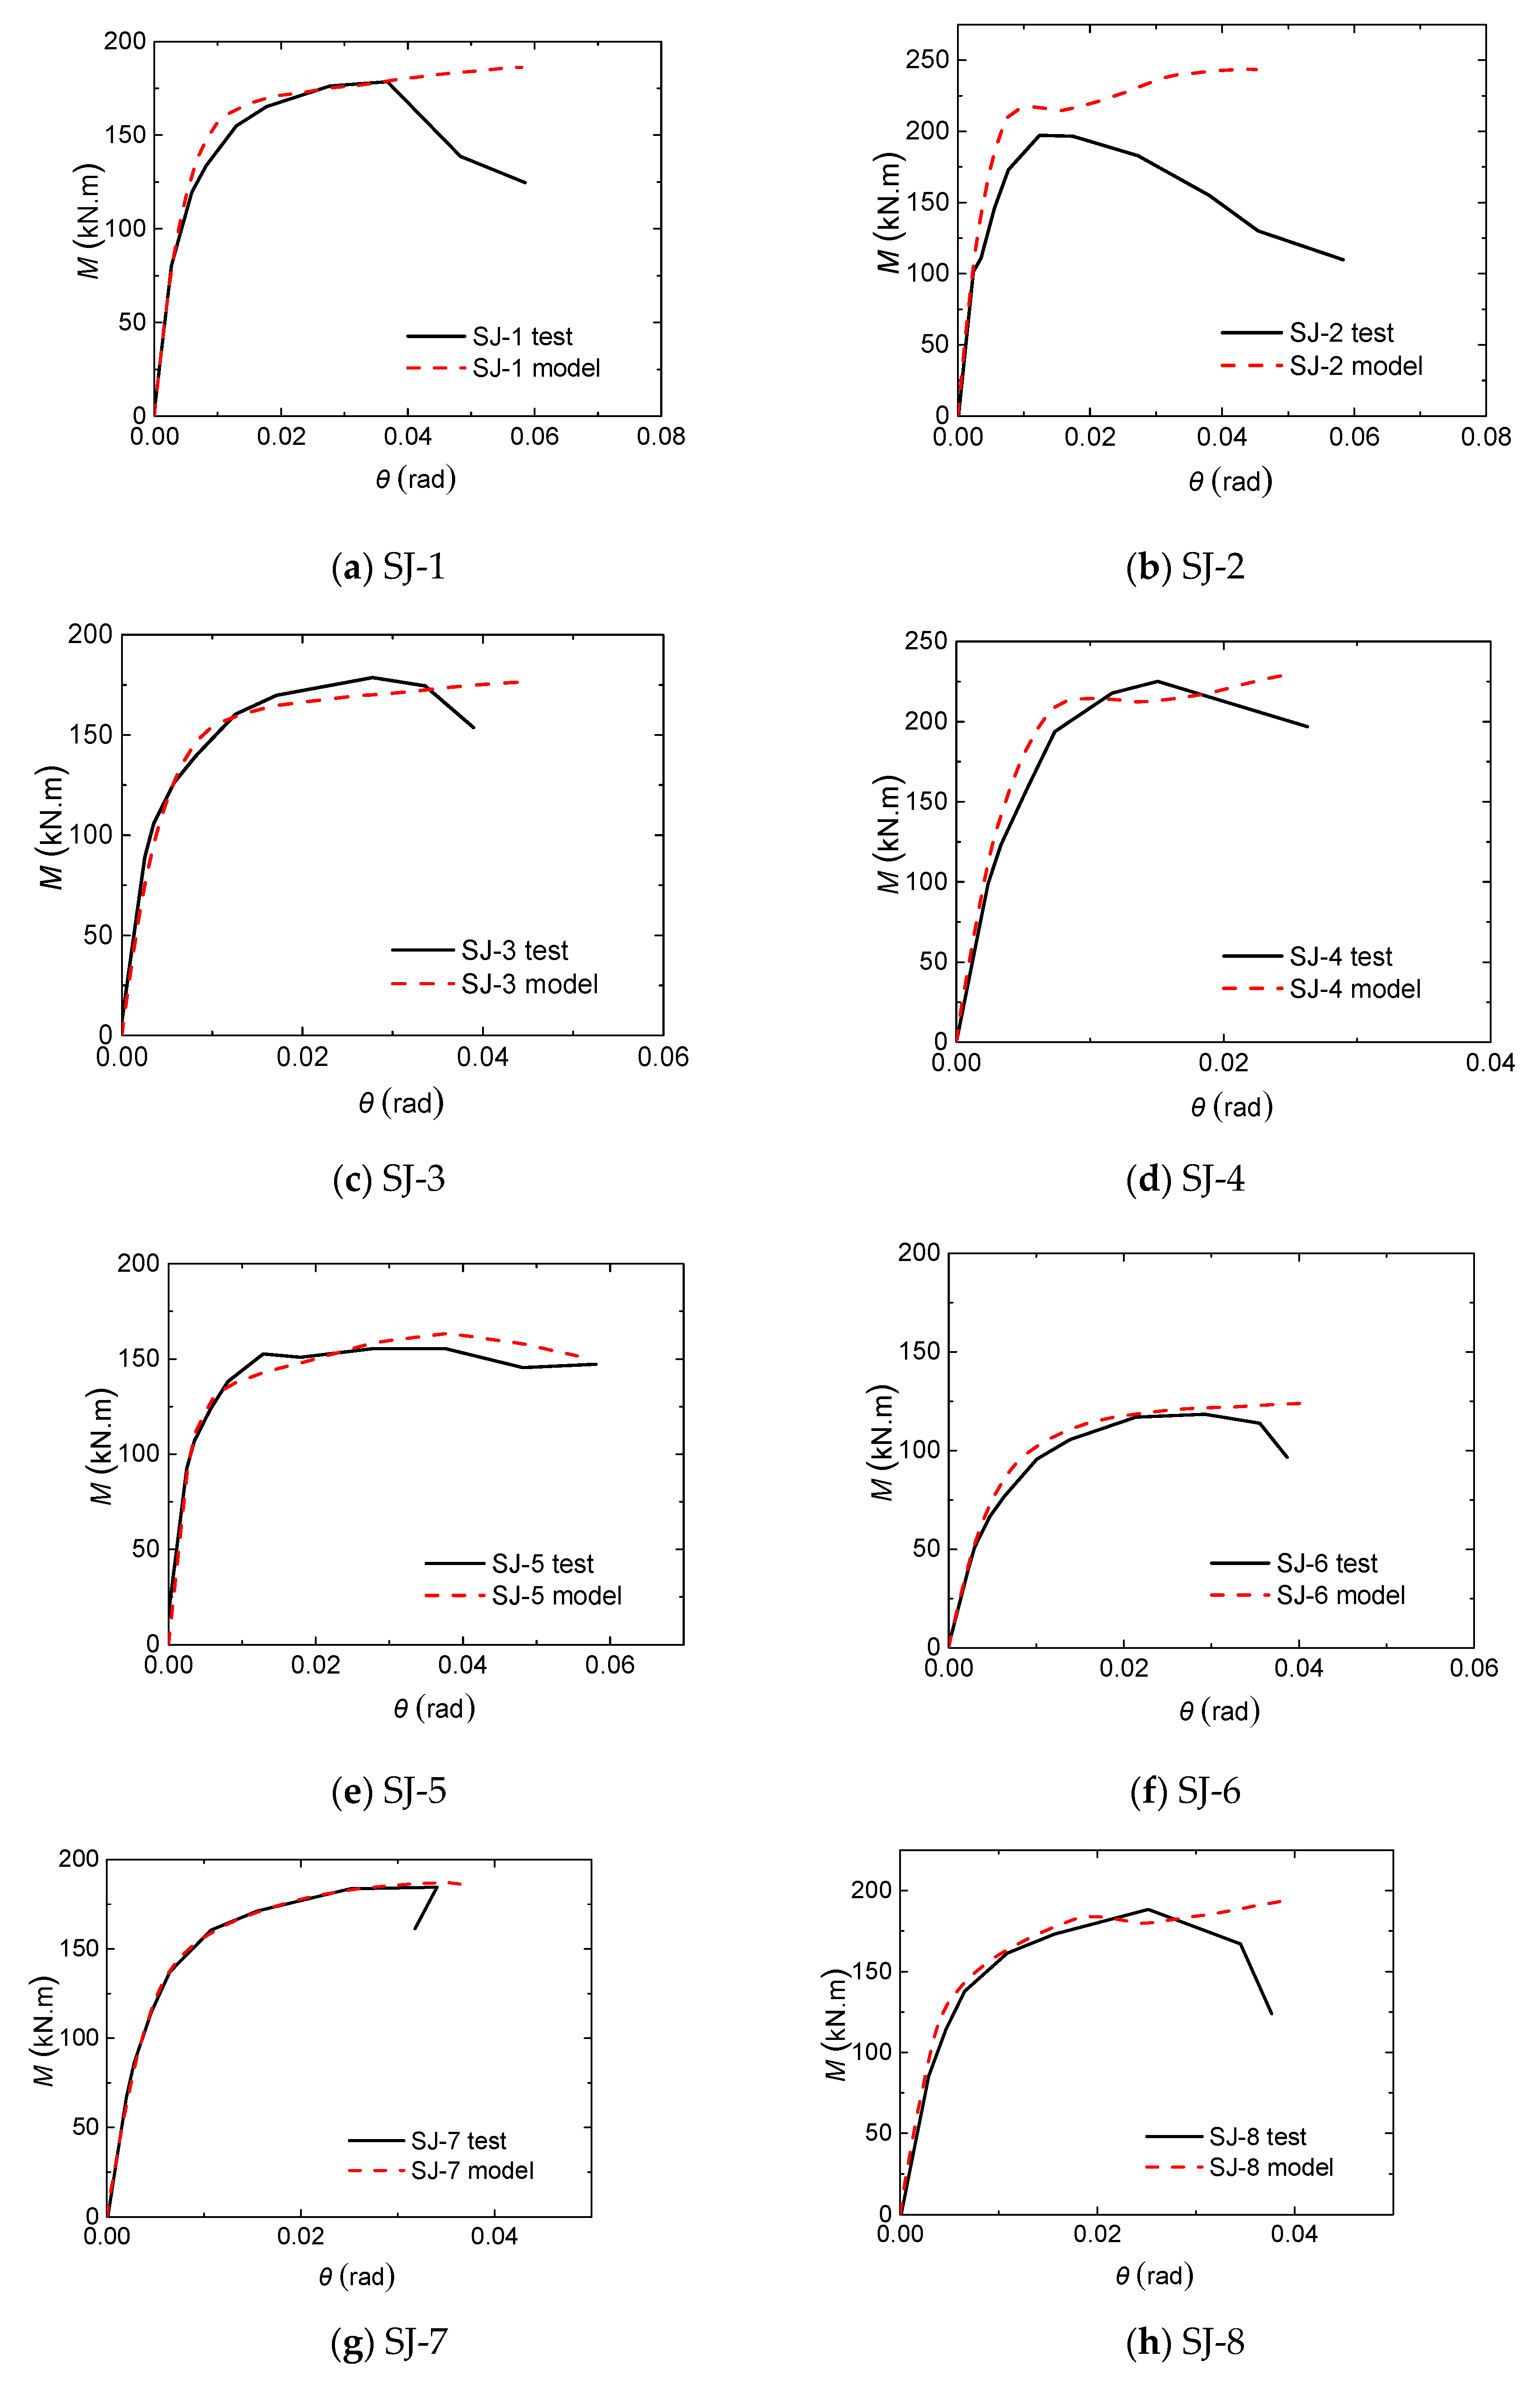
The FEA models were validated against the experimental results. Figure 25 shows the comparison between the moment-rotation curves predicted by the FEA models and the moment-rotation curves obtained from the tests. Except for SJ-2, which had few errors in the latter stage, the curves of the other specimens showed excellent agreement in the elastic range and good agreement in the plastic range. SJ-2 underwent the most severe concrete damage and bolt slippage, and the existing concrete model has difficulty fully and truly reflecting the concrete constitutive relationship under such complex stress states.

5.2.2. Failure Mode

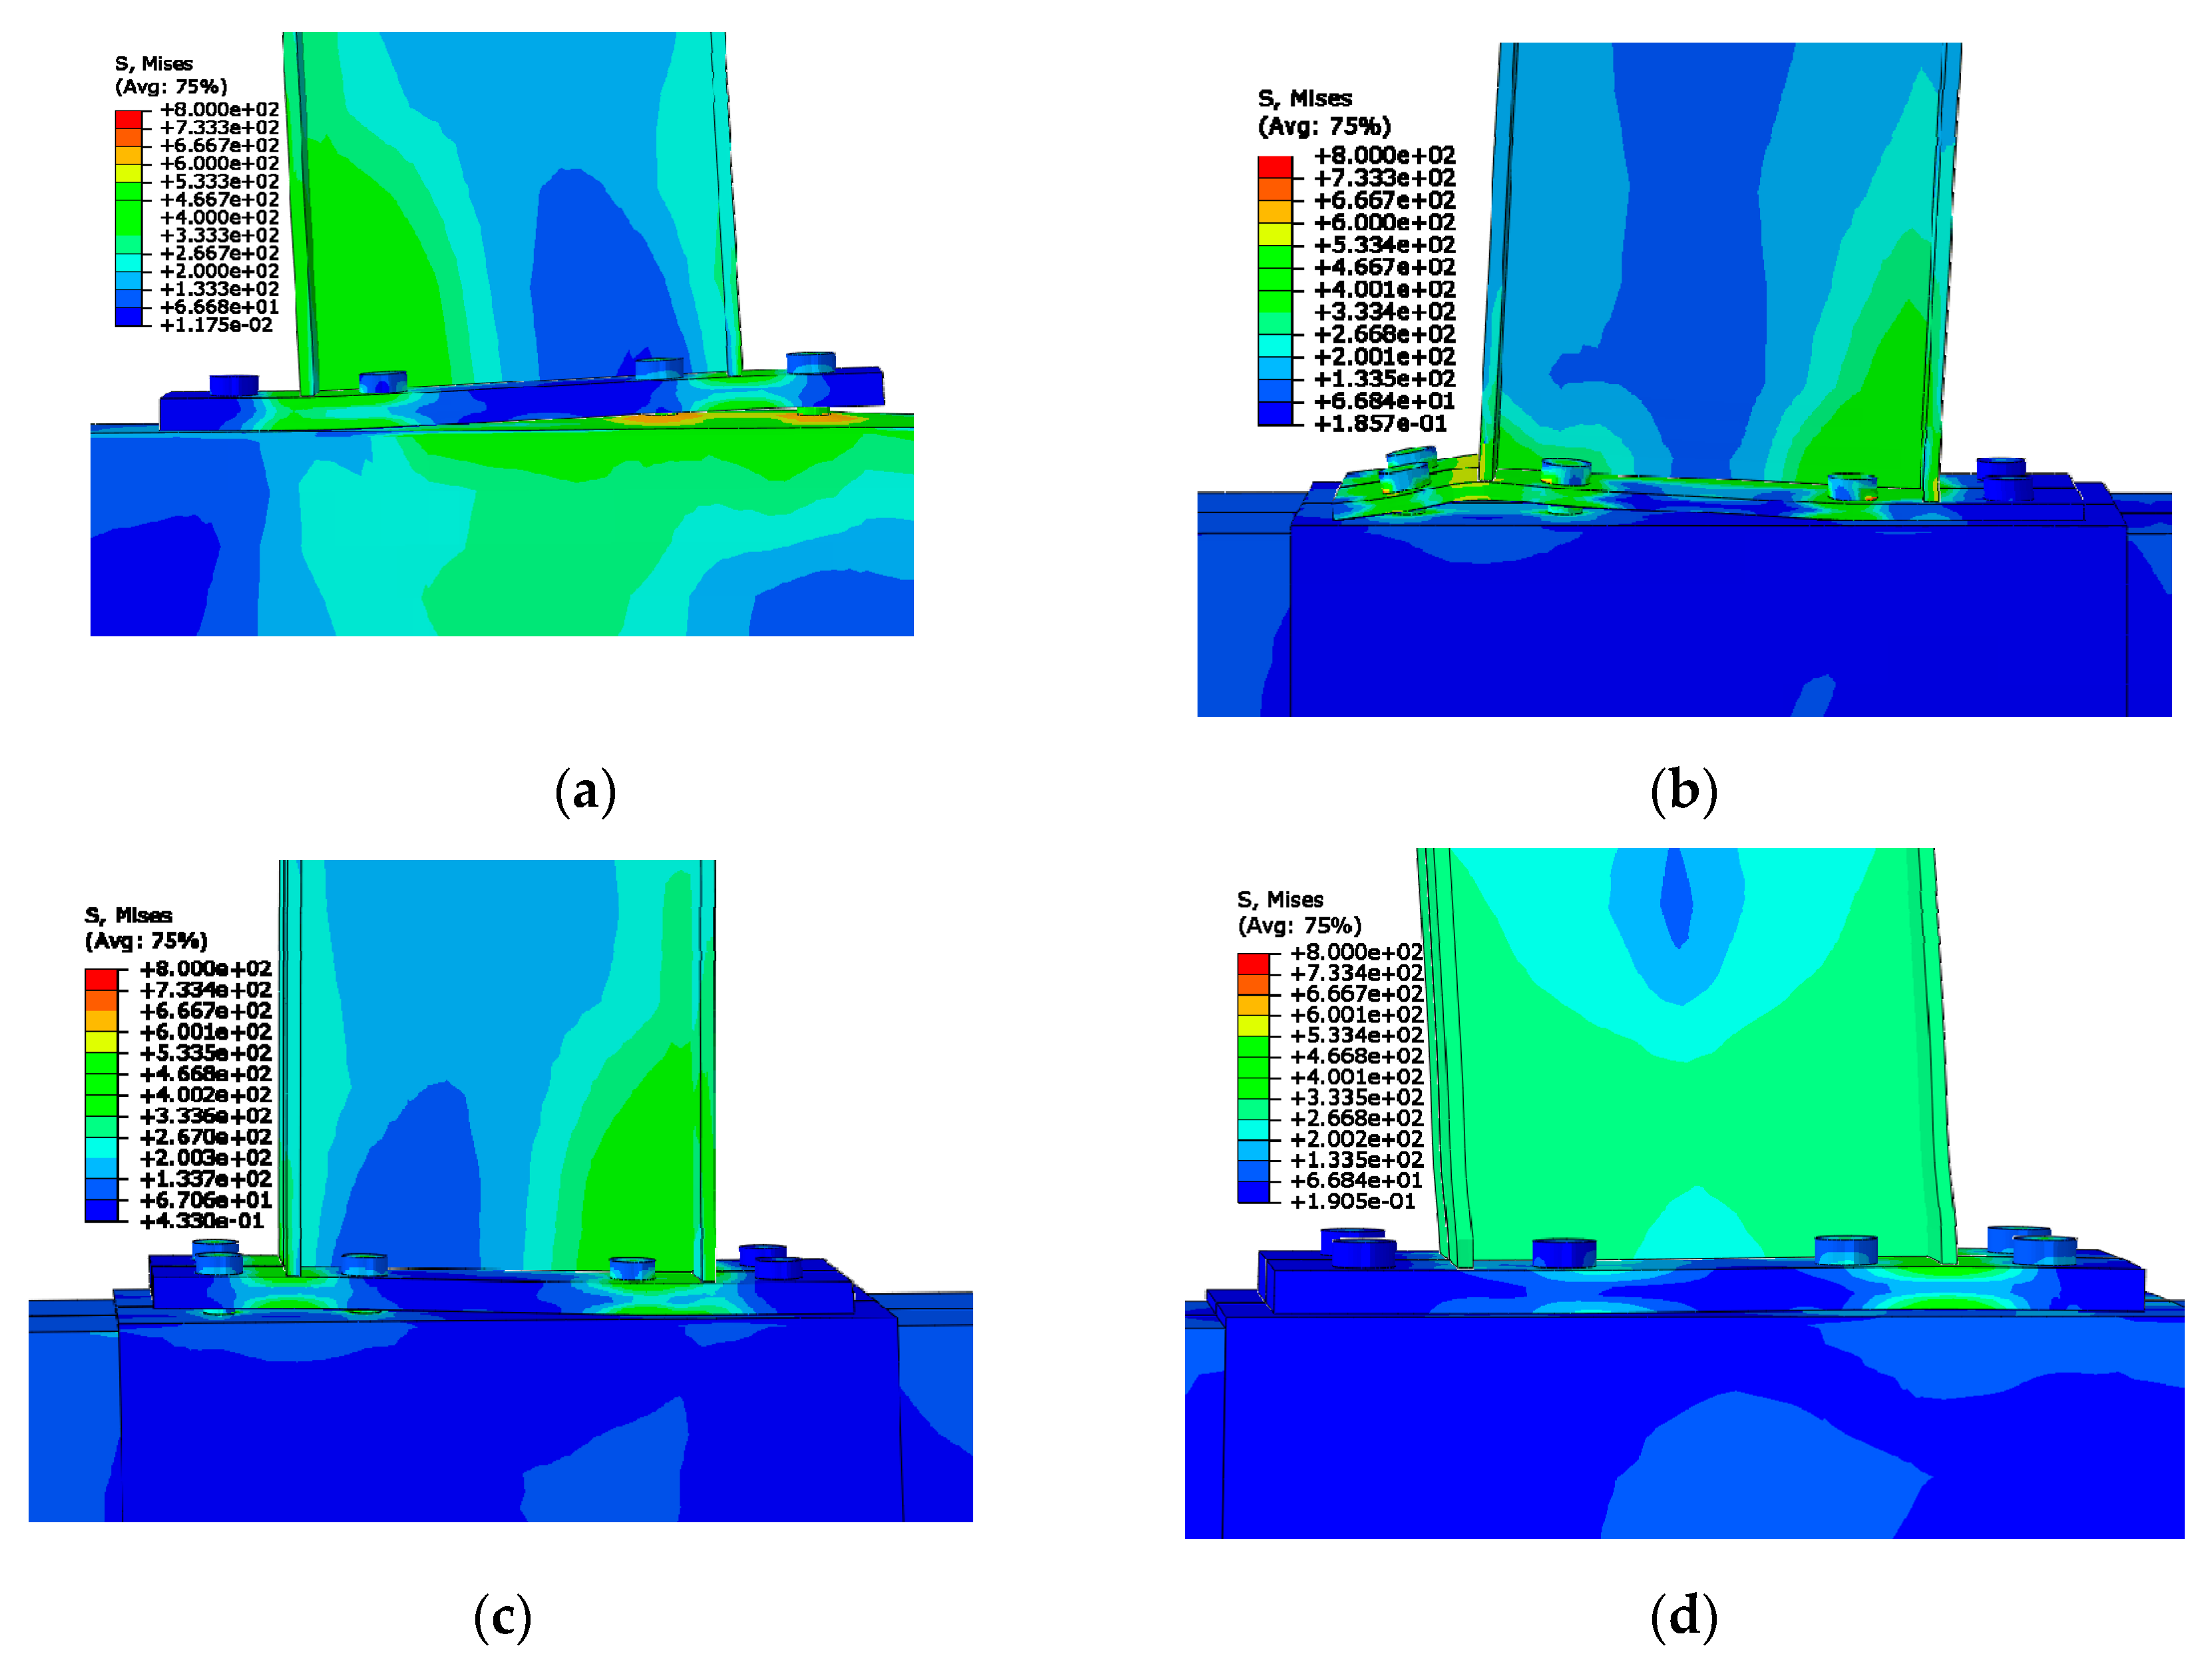
Figure 26 shows the general behavior of the specimens corresponding to the typical failure modes, which matched well with the observed failure modes in terms of overall deformation, yielding distribution and failure type. The weakest component deformation corresponding to the typical failure mode is illustrated in Figure 27, which shows that the end-plates, the tube face, the weak beam and the bolts in the FEA models and in the test underwent similar deformation evolutions. The FEA model predicted that the stress concentrations were observed around the bolt holes under high loads, which showed the yield-lines pattern with four-point loads, and they spread towards the corners of the steel tubes. High stresses were noted in the end-plate around the tensile flange of the beam. For the tensile blind bolts, part of the shank between the head and threaded cone had reached the ultimate stress, but most of the embedded shank and the anchor nut in the concrete remained in elasticity. The stresses in the beam compressive and tensile flanges exceeded the yield strength of steel, and the buckling deformation of the beam compressive flange was observed. Whereas the other strong steel beams were basically in elastic stage. Figure 26 and Figure 27 show that a generally good agreement was achieved between the simulated and experimental results.

5.3. Force Transfer Pattern

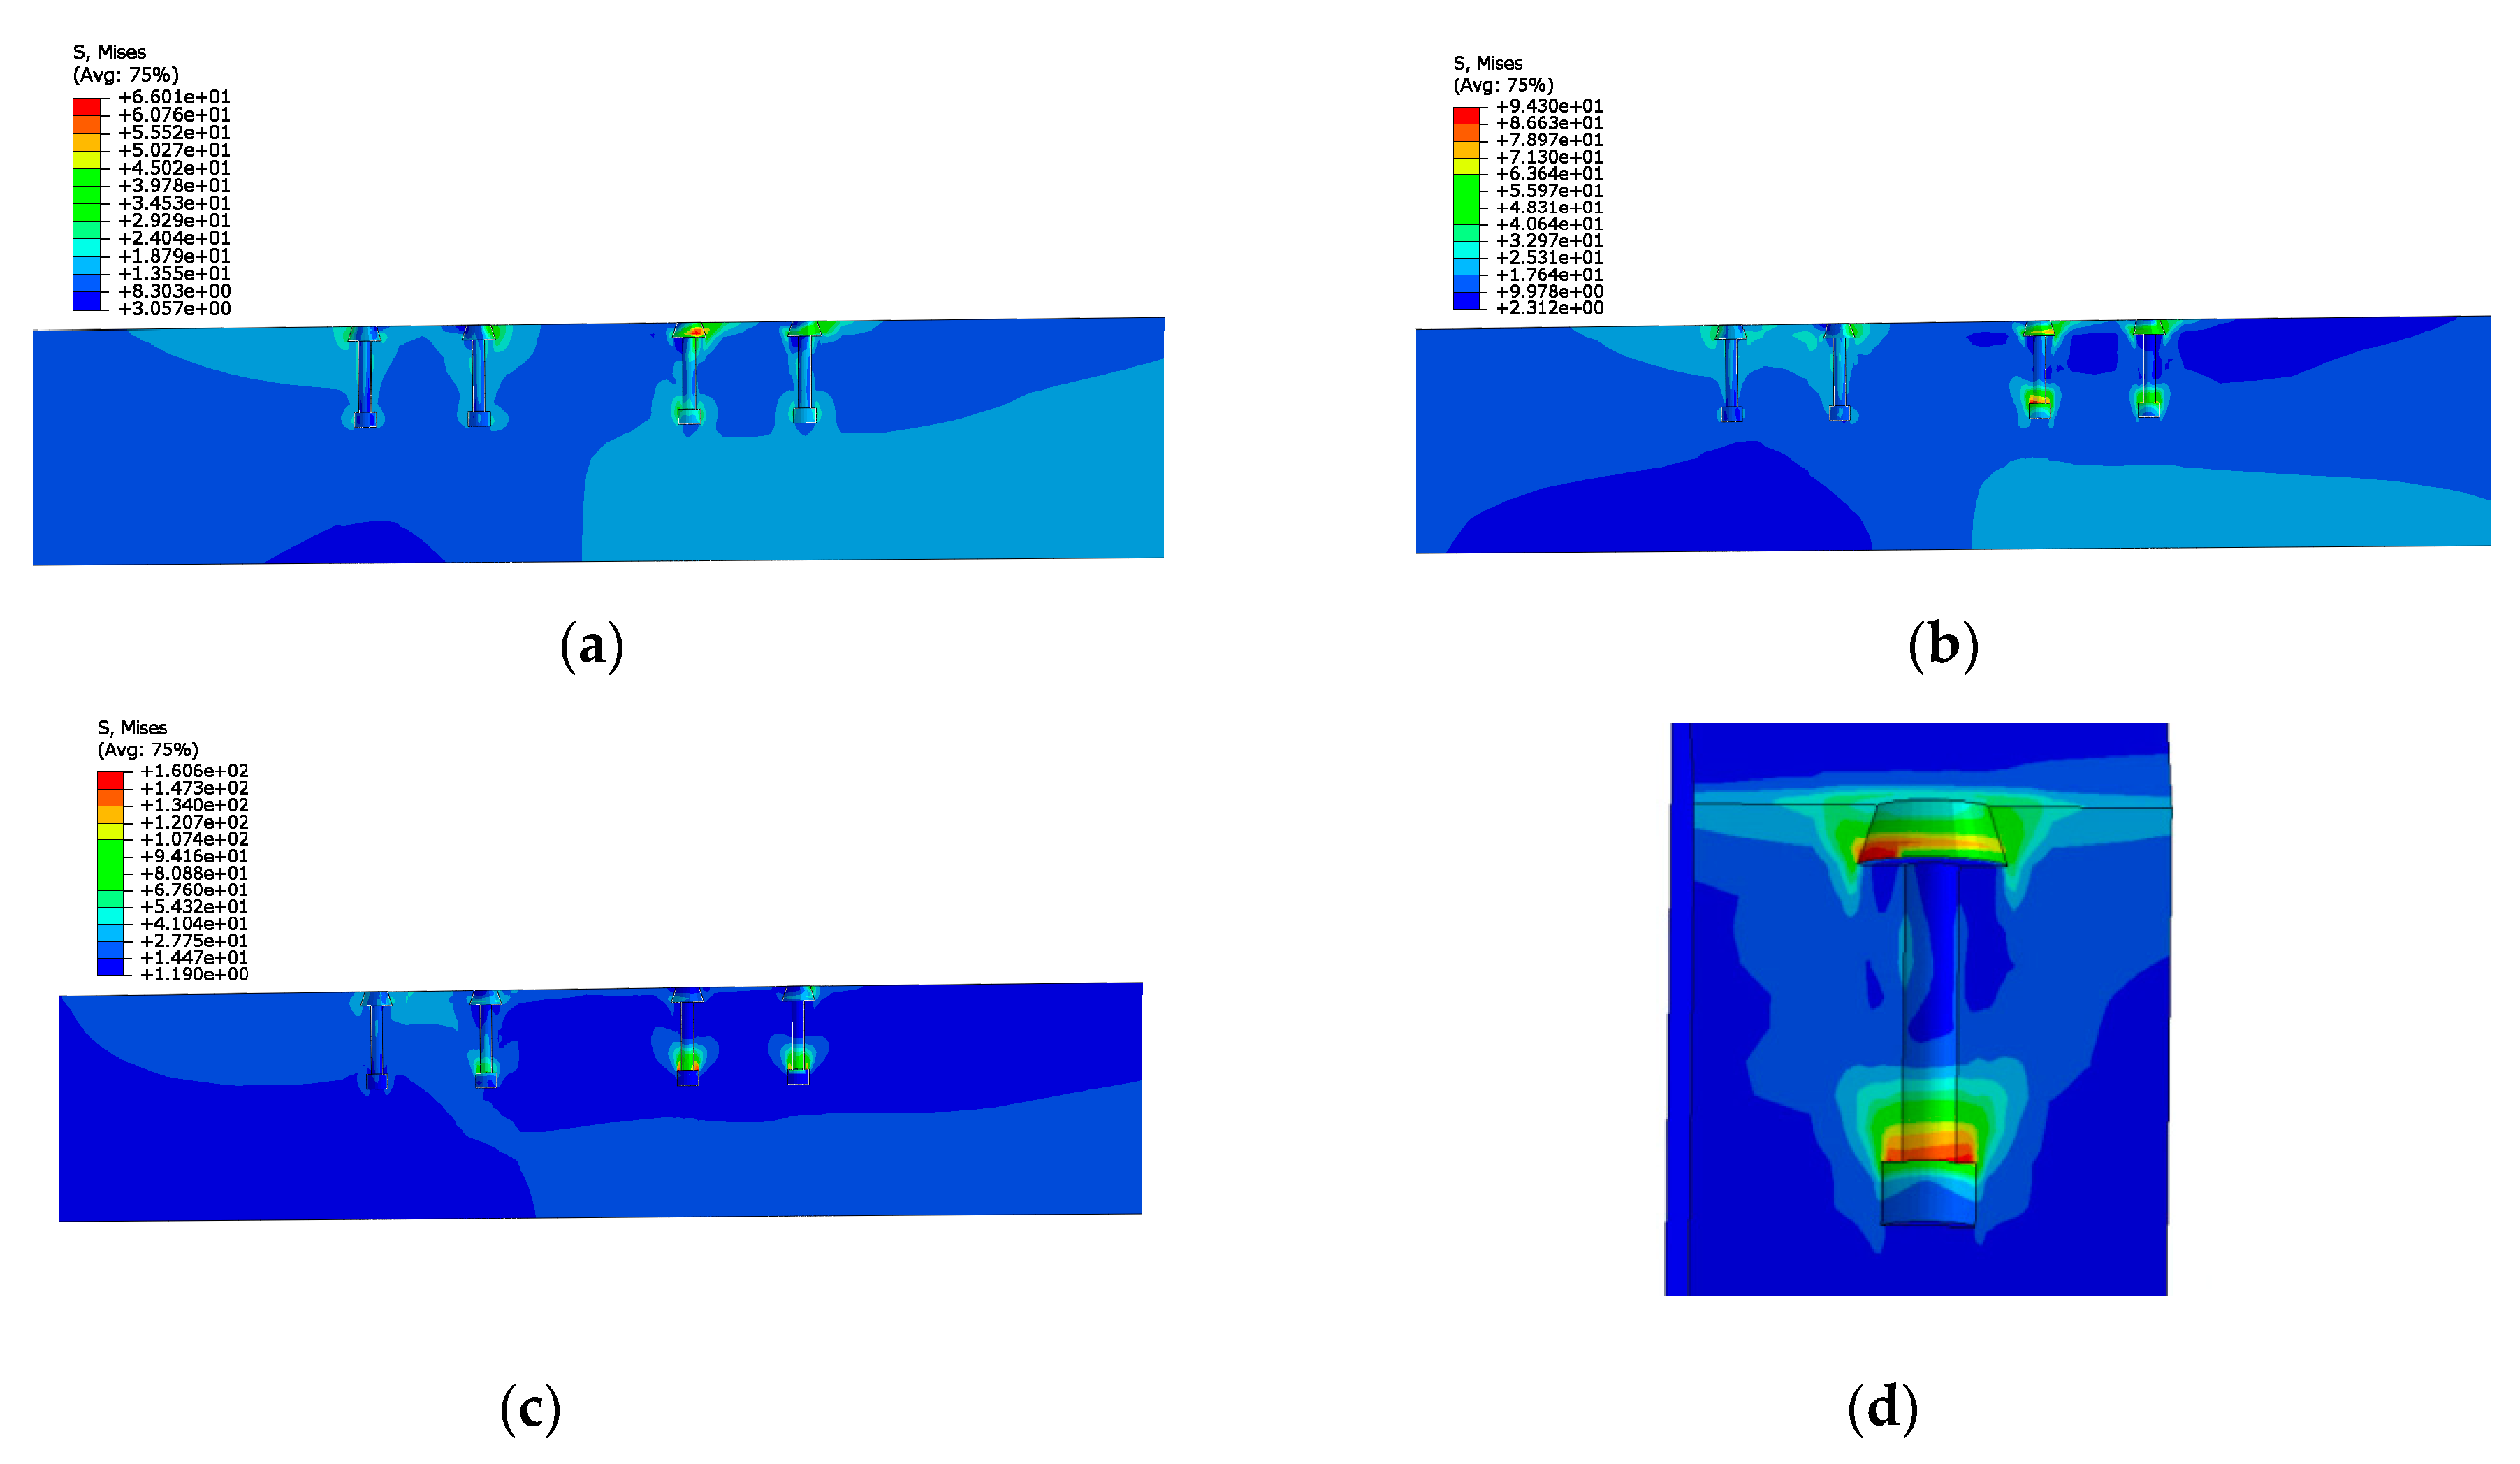
The load transmitted from the beam end is mainly transferred to the end-plate through the upper and lower flange of the beam. The end-plate is bent, and the end-plate continues to transfer the load to the bolt. For ordinary CFST column joints, the bolt directly transmits the load to the steel tube wall, resulting in obvious outward deformation of the steel tube wall. However, for anchored blind-bolted joints to the CFST column, due to the extended bolt shank into the concrete and the mechanical anchor at the end, the load transfer pattern is obviously different. Taking the FEA model of specimen SJ-3 as an example, the internal stress distributions in the concrete in the elastic stage, yield stage and ultimate stage are shown in Figure 28. For the anchored blind bolt in the tension zone, obvious stress concentrations occur around the expansion sleeve and around the anchor nut at the end, indicating that the tension is effectively transferred to the whole bolt shank until reaching the anchor nut. For the anchored blind bolt in the compression zone, due to the support of the CFST column, the stress concentration only appears around the expansion sleeve.
In the tensile zone, due to the anchoring effect of the blind bolt, the force transmission zone is approximately a cone with the anchor nut as the vertex, which transmits the load to the steel tube wall in the form of a circle. The cone angle is approximately 60°. The bolt force is mainly undertaken by the concrete in the cone zone and the upper steel tube wall. The circular stress area of the steel tube wall is much larger than that of the common joint without an anchored bolt, and the stress is more dispersed, which decreases the outward deformation of the steel tube wall. After defining the load transmission pattern and stress distribution in anchored blind-bolted joints to CFST columns, it is helpful to propose a calculation model for the stiffness and flexural resistance for such joints.

6. Conclusions

The following observations and conclusions can be drawn from the studies reported in this paper:
(1) This study adopted a new anchored blind-bolted moment connection to CFST columns, and the anchored blind bolts and a locally strengthened steel tubes were applied to effectively avoid the premature anchorage failure and CFST column damage. The anchored parts of the blind bolts in the concrete were not damaged, providing continuous and reliable effect on the performance of the connections throughout their entire cyclic loading. The steel tube wall and the C-channel can work well together when plug weld was adopted between them. The test observations the proposed joints can be fully utilize the bolt strength and significantly improves the joint performance, especially in terms of strength and strength degradation.
(2) Three typical failure modes were found in the experiment for the anchored blind-bolted extended end-plate joints, and the failure mode depended on the weakest component. When the steel tube was not locally strengthened by the C-channel, specimens failed in mode I. These specimens showed obvious strength degradation, but exhibited better rotational capacity, ductility, and energy dissipation capacity. However, those were realized by the crushing of concrete in the columns and the deformation of the steel tube walls. When the steel tube was locally strengthened by the C-channel, specimens failed in mode II and III. Specimens that failed in mode II exhibited higher stiffness and strength. The use of the thick end-plate resulted in premature brittle fracture of the bolt. Specimens that failed in mode III were typical strong column-weak beam joints, and exhibited the highest energy dissipation capacity, which satisfied the seismic requirement for intermediate moment frames.
(3) For such joints, the local reinforcement of C-channel and change in the anchorage method had a limited effect on the initial stiffness. Greater end-plate thickness and the use of stiffeners significantly increased the joint stiffness and decreased the rate of stiffness degradation. The use of stiffeners also significantly enhanced the ductility and energy dissipation by moving plastic hinge outward from the joints.
(4) The anchored blind-bolted extended end-plates joints to CFST columns can meet the requirements for rotational capacity in both Eurocode-8 and FEMA-350 standards. This type of joint exhibits good rotational capacity and ductility, meeting the seismic design requirements for structures. According to EC3 Part 1-8, the anchored blind-bolted extended end-plate joints to CFST columns with a strong beam are classified as semirigid and partial-strength joints, whereas those with a weak beam are in the range of semirigid and full-strength joints.
(5) The FEA models using ABAQUS/Standard was used to cross-validate the test results. The FEA models could simulate the joint behaviors with a proper accuracy, which demonstrated the reliability of the experimental results and improve the understanding of the connections. The stress distribution and force transfer pattern were investigated.

Author Contributions

Conceptualization: Y.W.; methodology, Y.W.; validation, P.W. and Z.W.; formal analysis, J.P.; investigation, Y.W.; resources, P.W.; data curation, Y.W.; writing—original draft preparation, Y.W.; writing—review and editing, Y.W. and P.W.; visualization, S.C. and J.Q.; supervision, Z.W.; project administration, Z.W.; funding acquisition, Z.W and J.P. All authors have read and agreed to the published version of the manuscript.

Funding

This study was supported by National Natural Science Foundation of China (Grant No. 51778241; 51638009; 51978279), the Fundamental Research Funds for the Central Universities (Grant No. 2019MS121; 2019PY20; 2019ZD47), Chinese Postdoctoral Foundation of China (Grant No. 2019M652898) and Young Innovative Talents Program in Universities and Colleges of Guangdong Province (Grant No. 2018KQNCX006).

Conflicts of Interest

The authors declare no conflicts of interest.

References

  1. Han, L.; Li, W.; Bjorhovde, R. Developments and advanced applications of concrete-filled steel tubular (CFST) structures: Members. J. Constr. Steel Res. 2014, 100, 211–228. [Google Scholar] [CrossRef]
  2. Varma, A.H.; Ricles, J.M.; Sause, R.; Lu, L.W. Seismic behavior and modeling of high-strength composite concrete-filled steel tube (CFT) beam-columns. J. Constr. Steel Res. 2002, 58, 725–758. [Google Scholar] [CrossRef]
  3. Lai, Z.; Varma, A.; Zhang, K. Noncompact and slender rectangular CFT members: Experimental database, analysis, and design. J. Constr. Steel Res. 2014, 101, 455–468. [Google Scholar] [CrossRef]
  4. Zhao, Y.; Xu, C. Research on Compression Behavior of Square Thin-Walled CFST Columns with Steel-Bar Stiffeners. Appl. Sci. 2018, 8, 1602. [Google Scholar]
  5. Wang, Z.; Tao, Z.; Li, D.; Han, L. Cyclic behaviour of novel blind bolted joints with different stiffening elements. Thin-Walled Struct. 2016, 101, 157–168. [Google Scholar] [CrossRef]
  6. Wang, J.; Han, L.; Uy, B. Behaviour of flush end plate joints to concrete-filled steel tubular columns. J. Constr. Steel Res. 2009, 65, 925–939. [Google Scholar] [CrossRef]
  7. Lee, J.; Goldsworthy, H.M.; Gad, E.F. Blind bolted moment connection to sides of hollow section columns. J. Constr. Steel Res. 2011, 67, 1900–1911. [Google Scholar] [CrossRef]
  8. Lee, J.; Goldsworthy, H.M.; Gad, E.F. Blind bolted moment connection to unfilled hollow section columns using extended T-stub with back face support. Eng. Struct. 2011, 33, 1710–1722. [Google Scholar] [CrossRef]
  9. Málaga-Chuquitaype, C.; Elghazouli, A.Y. Behaviour of combined channel/angle connections to tubular columns under monotonic and cyclic loading. Eng. Struct. 2010, 32, 1600–1616. [Google Scholar] [CrossRef] [Green Version]
  10. Gardner, A.; Goldsworthy, H. Moment-resisting connections for composite frames. In Mechanics of Structures and Materials Conference; CRC Press: Boca Raton, FL, USA, 1999; pp. 309–314. [Google Scholar]
  11. Gardner, A.P.; Goldsworthy, H.M. Experimental investigation of the stiffness of critical components in a moment-resisting composite connection. J. Constr. Steel Res. 2005, 61, 709–726. [Google Scholar] [CrossRef]
  12. Goldsworthy, H.M.; Gardner, A.P. Feasibility study for blind-bolted connections to concrete-filled circular steel tubular columns. Struct. Eng. Mech. 2006, 24, 463–478. [Google Scholar] [CrossRef]
  13. Goldsworthy, H.; Yao, H.; Gad, E. Experimental and Numerical Investigation of the Tensile Behavior of Blind-Bolted T-Stub Connections to Concrete-Filled Circular Columns. J. Struct. Eng. 2008, 134, 198–208. [Google Scholar]
  14. Wang, J.; Chen, X.; Shen, J. Performance of CFTST column to steel beam joints with blind bolts under cyclic loading. Thin-Walled Struct. 2012, 60, 69–84. [Google Scholar] [CrossRef]
  15. Wang, J.; Guo, S. Structural performance of blind bolted end plate joints to concrete-filled thin-walled steel tubular columns. Thin-Walled Struct. 2012, 60, 54–68. [Google Scholar] [CrossRef]
  16. Tizani, W.; Ridley, E. The Performance of a New Blind-Bolt for Moment-Resisting Connections; Taylor & Francis: Abingdon, UK, 2003. [Google Scholar]
  17. Pitrakkos, T.; Tizani, W. Experimental behaviour of a novel anchored blind-bolt in tension. Eng. Struct. 2013, 49, 905–919. [Google Scholar] [CrossRef]
  18. Agheshlui, H.; Goldsworthy, H.; Gad, E.; Fernando, S. Tensile behaviour of anchored blind bolts in concrete filled square hollow sections. Mater. Struct. 2016, 49, 1511–1525. [Google Scholar] [CrossRef]
  19. Agheshlui, H.; Goldsworthy, H.; Gad, E.; Yao, H. Tensile Behavior of Groups of Anchored Blind Bolts within Concrete-Filled Steel Square Hollow Sections. J. Struct. Eng. 2016, 142, 04015125. [Google Scholar] [CrossRef]
  20. Tizani, W.; Al-Mughairi, A.; Owen, J.S.; Pitrakkos, T. Rotational stiffness of a blind-bolted connection to concrete-filled tubes using modified Hollo-bolt. J. Constr. Steel Res. 2013, 80, 317–331. [Google Scholar] [CrossRef]
  21. Tizani, W.; Wang, Z.Y.; Hajirasouliha, I. Hysteretic performance of a new blind bolted connection to concrete filled columns under cyclic loading: An experimental investigation. Eng. Struct. 2013, 46, 535–546. [Google Scholar] [CrossRef]
  22. Technical Specification for Concrete Structures of Building; JGJ3-2010; China Architecture and Building Press: Beijing, China, 2011.
  23. Peter Clark, K.F.H.K. Protocol for Fabrication, Inspection, Testing, and Documentation of Beam-Column Connection Tests and Other Experimental Specimens; Rep. No. SAC/BD-97/02; SAC Joint Venture: Sacramento, CA, USA, 1997. [Google Scholar]
  24. He, Y.; Huang, P.; Guo, J.; Zhou, H.; Li, Y. Experimental study on seismic behavior of steel-reinforced concrete square column and steel beam joint with bolted end-plate. J. Build. Struct. 2012, 33, 116–125. [Google Scholar]
  25. Tao, Z.; Hassan, K.; Song, T.-Y.; Han, L.-H. Experimental study on blind bolted connections to concrete-filled stainless steel columns. J. Constr. Steel Res. 2017, 128, 825–838. [Google Scholar] [CrossRef]
  26. Eurocode 3: Design of Steel Structures-Part 1–8. In Design of Joints; EN 1993–1-8; European Committee for Standardization: Brussels, Belgium, 2005.
  27. Eurocode 8: Design of Structures for Earthquake Resistance-Part 1: General Rules, Seismic Actions; BS EN 1998-1:2004; British Standard Institute: London, UK, 2011.
  28. Recommended Seismic Design Criteria for New Steel Moment-Frame Buildings; FEMA-350; Federal Emergency Management Agency: Washington, DC, USA, 2000.
  29. Wang, J.; Zhang, L.; Spencer, B.F. Seismic response of extended end plate joints to concrete-filled steel tubular columns. Eng. Struct. 2013, 49, 876–892. [Google Scholar] [CrossRef]
  30. Seismic Provisions for Structural Steel Buildings; ANSI/AISC 341-10; American Institute of Steel Construction: Chicago, IL, USA, 2010.
  31. Bahaari, M.R.; Sherbourne, A.N. Behavior of eight-bolt large capacity endplate connections. Comput. Struct. 2000, 77, 315–325. [Google Scholar] [CrossRef]
  32. Han, L.H.; Yao, G.H.; Zhao, X.L. Tests and calculations for hollow structural steel (HSS) stub columns filled with self-consolidating concrete (SCC). J. Constr. Steel Res. 2005, 61, 1241–1269. [Google Scholar] [CrossRef]
Figure 1. Modified anchored Hollo-Bolt.
Applsci 10 00904 g001
Figure 2. Details of the joint specimens.
Applsci 10 00904 g002aApplsci 10 00904 g002b
Figure 3. Connection mode of the C-channel. (a) With plug welding and (b) Without plug welding.
Applsci 10 00904 g003
Figure 4. (a) A picture; (b) Schematic of the test setup.
Applsci 10 00904 g004
Figure 5. Loading protocol.
Applsci 10 00904 g005
Figure 6. Arrangement of LVDTs for specimens (units: mm). (a) SJ-1 through SJ-5; (b) SJ-6 through SJ-8.
Applsci 10 00904 g006
Figure 7. Failure mode I. (a) SJ-1; (b) SJ-2; (c) welding fracture in specimen SJ-1; (d) column wall in specimen SJ-1; (e) column wall in specimen SJ-2; (f) core concrete.
Applsci 10 00904 g007
Figure 8. Failure mode II (specimens with a weak end-plate). (a) SJ-3; (b) SJ-5; (c) SJ-6; (d) Welding fracture in specimen SJ-3; (e) Column wall in specimen SJ-3; (f) Column wall in specimen SJ-5.
Applsci 10 00904 g008aApplsci 10 00904 g008b
Figure 9. Failure mode II (specimens with a strong end-plate). (a) SJ-4; (b) SJ-8.
Applsci 10 00904 g009
Figure 10. Internal damage of failure mode II. (a) Bolt fracture; (b) Core concrete.
Applsci 10 00904 g010
Figure 11. Failure mode III. (a) SJ-7; (b) Column wall in specimen SJ-7.
Applsci 10 00904 g011
Figure 12. Failure pattern of the components. (a) Embedded extension of blind bolt; (b) Anchor nut; (c) Bolt holes in specimen SJ-3; (d) Bolt holes in specimen SJ-5.
Applsci 10 00904 g012
Figure 13. Moment (M) versus rotation (θ) hysteresis curves of the specimens.
Applsci 10 00904 g013
Figure 14. Comparison of the moment (M)-rotation (θ) envelope curves of the specimens; (a) Effect of steel tube thickness and end-plate thickness; (b) Effect of the local strengthening connection method and anchorage method; (c) Effect of the steel beam section, and (d) Effect of the stiffeners.
Applsci 10 00904 g014
Figure 15. Determination of the key parameters in the M-θ relationship of joints.
Applsci 10 00904 g015
Figure 16. Classification of the specimens. (a) Specimens SJ-1 through SJ-5; (b) Specimens SJ-6 through SJ-8.
Applsci 10 00904 g016
Figure 17. Comparison of the (a) Rotational capacity and (b) Ductility coefficient of the specimens.
Applsci 10 00904 g017
Figure 18. Strength degradation coefficients at the same drift level. (a) Specimens SJ-1 through SJ-5; (b) Specimens SJ-3, SJ-4, SJ-6 through SJ-8.
Applsci 10 00904 g018
Figure 19. Strength degradation coefficients of the entire loading process. (a) Specimens SJ-1 through SJ-5; (b) Specimens SJ-3, SJ-4, SJ-6 through SJ-8.
Applsci 10 00904 g019
Figure 20. Stiffness degradation coefficients: (a,c) Positive direction and (b,d) Negative direction.
Applsci 10 00904 g020
Figure 21. Definition of a hysteresis loop.
Applsci 10 00904 g021
Figure 22. Wtotal and ξe versus the drift ratio. (a,c) Specimens SJ-1 through SJ-5; (b,d) Specimens SJ-3, SJ-4, SJ-6 through SJ-8.
Applsci 10 00904 g022
Figure 23. Model assembly and mesh of the components. (a) Global mesh of the joints; (b) Mesh of the bolt and the sleeve.
Applsci 10 00904 g023
Figure 24. Trilinear model.
Applsci 10 00904 g024
Figure 25. Comparison of experimental and simulated moment-rotation curves. (a) SJ-1; (b) SJ-2; (c) SJ-3; (d) SJ-4; (e) SJ-5; (f) SJ-6; (g) SJ-7; (h) SJ-8.
Applsci 10 00904 g025
Figure 26. Predicted failure modes of the specimens. (a) Specimen SJ-2; (b) Specimen SJ-3; (c) Specimen SJ-4; (d) Specimen SJ-8.
Applsci 10 00904 g026
Figure 27. Predicted weakest component deformation. (a) Outward deformation of the column flange in specimen SJ-2; (b) Flexural deformation of the thick end-plate in specimen SJ-3; (c) Fractured bolt in specimen SJ-4 (bending and shearing fracture); (d) Local buckling of the steel beam in specimen SJ-6.
Applsci 10 00904 g027
Figure 28. Stress distribution in the concrete. (a) Elastic stage; (b)Yield stage; (c) Ultimate stage; (d) Details.
Applsci 10 00904 g028
Table 1. Details of the test specimens.
Specimen NumberColumn Section (mm)Column Length (mm)Beam Section (mm)End-Plate Thickness (mm)Local ReinforcementAnchorage MethodStiffener
SJ-1250 × 51736HN350 × 175 × 7 × 1112NoneNutNone
SJ-2250 × 51736HN350 × 175 × 7 × 1124NoneNutNone
SJ-3250 × 51736HN350 × 175 × 7 × 1112WithNutNone
SJ-4250 × 51736HN350 × 175 × 7 × 1124WithNutNone
SJ-5250 × 51736HN350 × 175 × 7 × 1112WithNoneNone
SJ-6250 × 51736HN300 × 150 × 6 × 912WithNutNone
SJ-7250 × 51736HN300 × 150 × 6 × 924WithNutNone
SJ-8250 × 51736HN300 × 150 × 6 × 912WithNutWith
Note: HN refers to narrow flange H-beam. 350 mm is the height of H-beam, and 175 mm is the width of H-beam. 7 mm and 11 mm are the thicknesses of the web and flange, respectively.
Table 2. Uniaxial tensile test results of the steel components.
Steel ComponentThickness (mm)Es (GPa)fy (MPa)fu (MPa)δ (%)
End-plate-2 25198.26408.5534.528.7
End-plate-112197.29399.2562.825.7
Steel tube5208.75477.1609.221.3
C-channel 7192.29395.2567.827.7
Beam flange-111202.13412.4591.718.6
Beam web-1 7202.35412.6593.724.83
Beam flange-29197.41269.7405.726.6
Beam web-26192.05254.1397.030.0
Table 3. Representative failure modes of the connections.
ComponentFailure Mode I
(Specimen SJ-1 and SJ-2)
Failure Mode II
(Specimen SJ-3 ~SJ-6, SJ-8)
Failure Mode III (Specimen SJ-7)
Anchored blind boltPartial pull-outBolt ruptureIntact
Tube wallBulging deformationSlight bulging at the bolt holesSlight bulging at the bolt holes
Concrete in the panelSeverely damagedLocal concrete crushLocal concrete crush
Steel beamNo significant plastic hinge of the steel beamNo significant plastic hinge of the steel beam except SJ-8Significant plastic hinge of the steel beam
Table 4. of the main results.
Specimen NumberMy (kN∙m)θy (mrad)Mmax (kN∙m)θmax (mrad)Mf (kN∙m)θf (mrad)μθKi (kN∙m/mrad)
SJ-1136.89 8.89 178.4836.79151.7144.535.0129.80
SJ-2166.037.10197.2612.35167.6733.144.6641.04
SJ-3136.17.56178.6527.79153.6638.965.1535.29
SJ-4194.637.53225.1115.08196.926.283.4942.59
SJ-5124.218.16155.4427.87147.2858.087.1137.30
SJ-692.379.40118.3934.82100.6346.44.9321.72
SJ-7146.128.13184.5634.04184.5634.044.1933.27
SJ-8145.655.83188.1924.51172.9535.766.1332.12
Table 5. Energy dissipation parameters of the specimens in the limit state.
Specimen NumberEeξeWtotal (kN∙m)
SJ-11.690.2757.50
SJ-21.770.2856.82
SJ-31.930.3136.93
SJ-41.410.2218.81
SJ-51.640.2642.10
SJ-61.060.1721.83
SJ-72.350.3746.63
SJ-82.330.3731.19