Article

Experimental Study of Stepped-Lap Scarf Joint Repair for Spar Cap Damage of Wind Turbine Blade in Service

Jiangsu Key Laboratory of Hi-Tech Research for Wind Turbine Design, Nanjing University of Aeronautics and Astronautics, Nanjing 210016, China
*
Author to whom correspondence should be addressed.
Appl. Sci. 2020, 10(3), 922; https://doi.org/10.3390/app10030922
Submission received: 17 December 2019 / Revised: 24 January 2020 / Accepted: 27 January 2020 / Published: 31 January 2020
(This article belongs to the Special Issue Wind Power Technologies)

Abstract

:
The objective of this paper was to design configuration parameters for a stepped-lap scarf joint repair, which can be used for spar cap damage of a wind turbine blade in service and to realize the post-repair monitoring. Two experimental studies were included. First, tensile test for the unidirectional tape specimens with a large aspect ratio repaired using a multiple stepped-lap scarf joint method was carried out. The results showed that the reinforcement layer could effectively improve the load-carrying capacity of the repaired zone. The stepped-lap joint surface was identified as the weak part of the spar cap repair, which should be monitored. Second, by embedding carbon nanotube buckypaper sensors on the stepped-lap joint surface of the repaired specimens, quasi-static tensile tests and fatigue tests were carried out. According to the resistance response of the sensors, the quasi-static tensile test confirmed the failure processes, namely the stiffness turning point, damage evolution, crack propagation, and fracture. The fatigue test could accurately identify the progressive failure, namely the initial damage, damage accumulation, initial cracking, and crack propagation to structural failure. The above tests provided an important configuration parameter basis for evaluating the spar cap repair scheme and presented a promising method for the health monitoring of a spar cap after repair.

1. Introduction

With a growing number of composite wind turbine blades now in service, blade maintenance is becoming a major issue [1]. As the service year increases, the hidden defects gradually show up [2,3]. Being affected by environmental corrosion, manufacturing defects, insufficient design, aging of materials, and overload [4,5], the hidden defects eventually appear as different failure modes [6] (such as fiber fracture, matrix failure, delamination, etc.) and damage types [7] (such as adhesive joint failure between skins, sandwich panel face/core debonding, gelcoat cracks, etc.). Through the process of assessing the extent of the damage, analyzing the damage stress state, designing a repair scheme, and timely maintenance, most of the structural damage of wind turbine blades in service (such as trailing edge cracking, leading edge corrosion, shell crack, etc.) can be effectively repaired [8]. However, when the damage occurs in the key load-carrying structures, such as the spar cap and root connection zone, the DNV GL (Det Norske Veritas Germanischer Lloyd) international certification standard for wind turbines clearly state it is necessary to construct a rational test model that can represent the real damage zone and preliminary repair scheme to evaluate the scheme before repair takes place [9]. Based on the model test results, the final repair scheme is developed. The spar cap is a pure unidirectional tape with a large aspect ratio structure. It is overlapped by a unidirectional cloth. The length is basically the same as the blade length, which is much larger than the width and thickness of the spar cap [10,11,12]. The thickness of the spar cap varies along the blade length; generally, the thickest zone (over almost 50 layers) is always from the maximum chord to 1/2 of the blade length, which is also the most important load-carrying zone of a spar cap. In this thick layer zone, it is easy to produce in-plane wrinkles and out-plane wrinkles during the blade manufacturing, which significantly reduces the local strength of the spar cap [13,14]. Under the alternating action of the ultimate load and fatigue load, the coupling response of delamination and buckling may easily occur in this zone [15,16,17,18,19,20]. Once the damage is macroscopic (Figure 1a), it may have already become very serious, and the repair area and the repair depth of the spar cap will be large (Figure 1b). Moreover, if the repair scheme is not rational and there is no effective health monitoring method after the repair, it will increase the operational risk. Under the conditions of strong wind speed and large changes in wind direction, it is easy to create new cracks near the repaired area (Figure 1c), which could cause serious accidents and economic losses (Figure 1d) [21]. Therefore, the damage of the spar cap (such as delamination or wrinkles) is very complicated and a difficult aspect of blade repair.
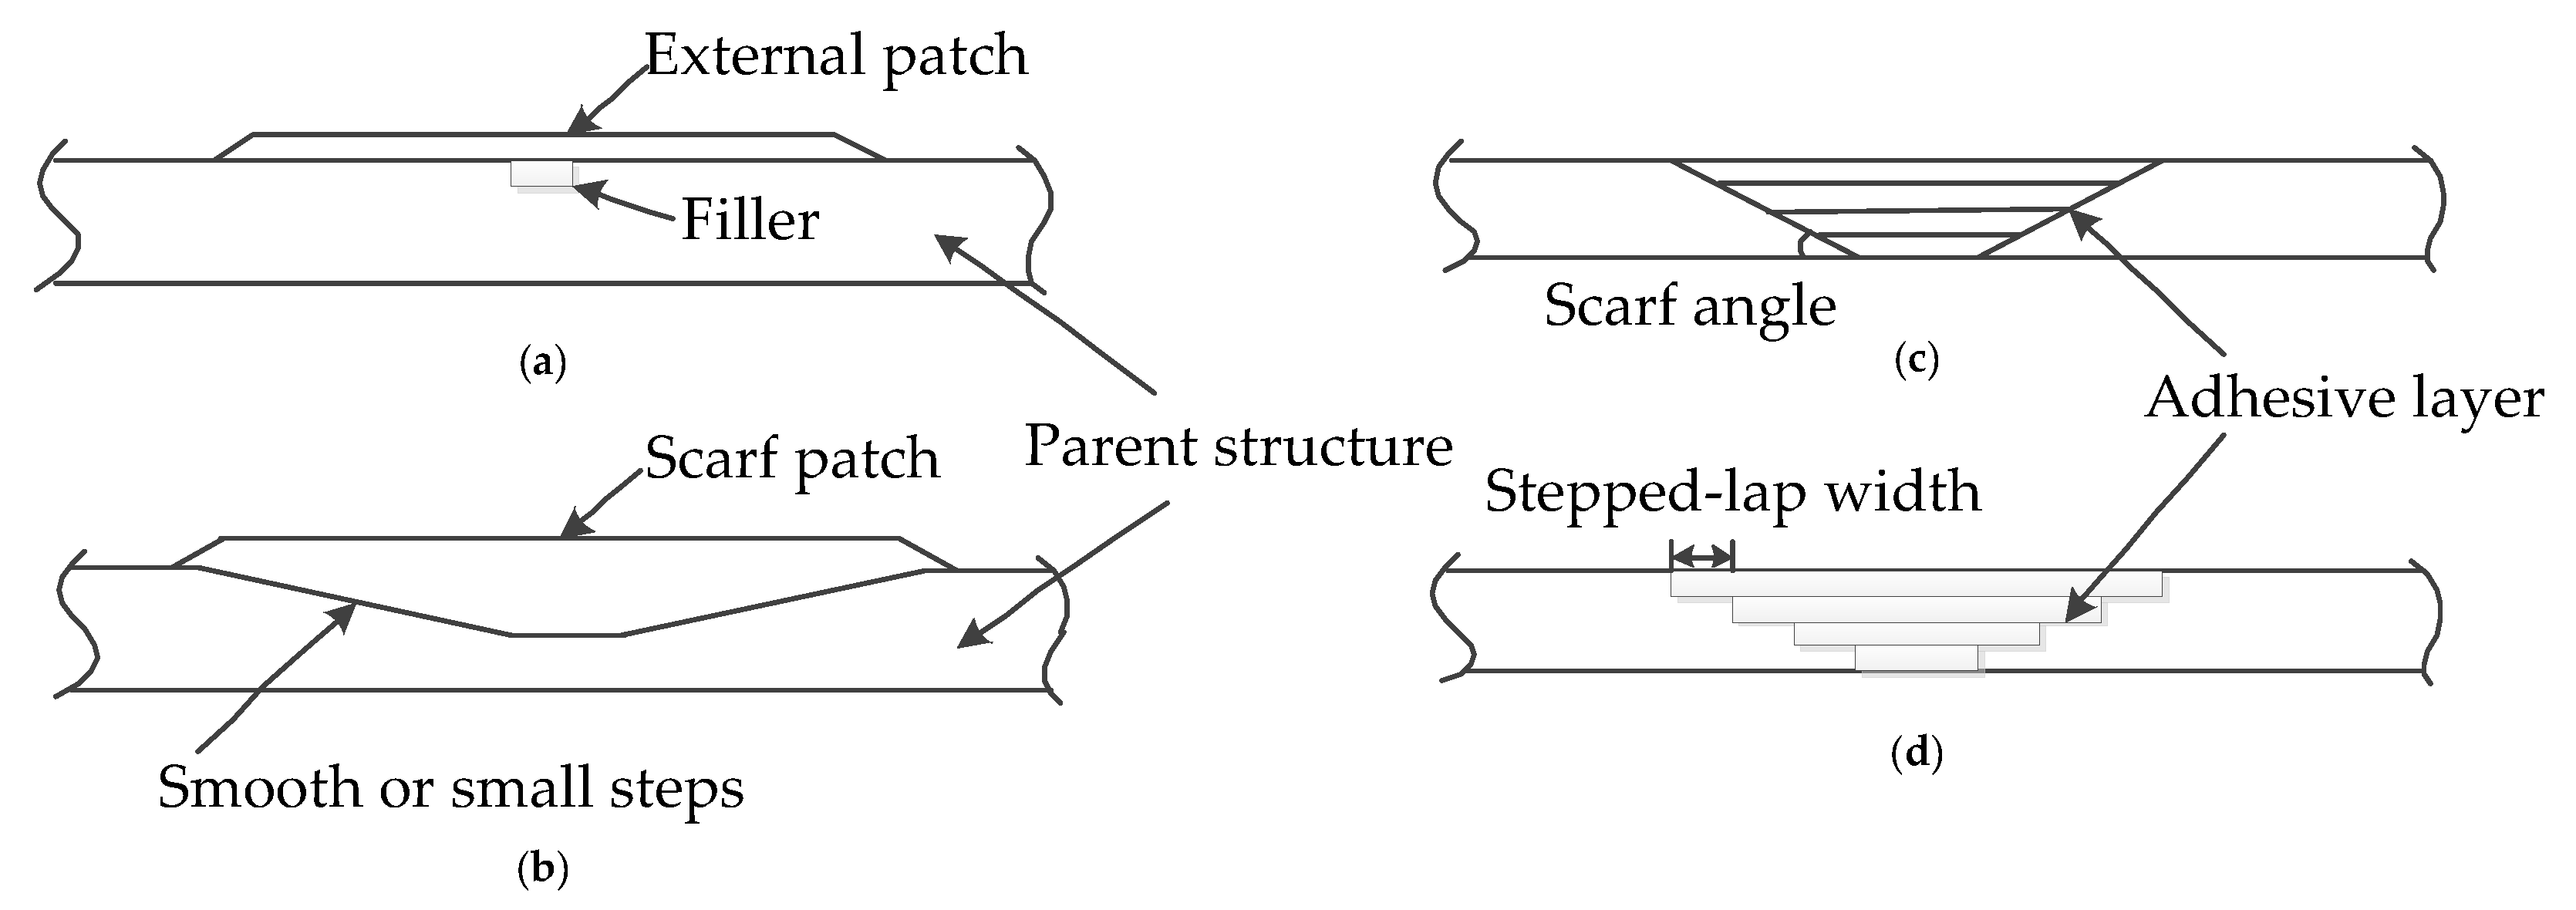
According to the parent structure and patch configuration, composite material repair methods mainly include the patch and scarf methods [22], as shown in Figure 2a,b. The patch method fixes the external patch by bonding or co-curing outside the damage to restore the serviceability of the structure [23]. This method is simple and convenient, which is mostly used for structures with a thin plate thickness. The scarf method is an adhesively bonded repair method that requires the removal of the defects or damage zone and replacing them with new materials. There is no eccentric load in the scarf method, and the peeling stress in the adhesive layer is small, so the repair efficiency is high and the application range is wide [24]. It has many advantages for repairing surfaces with a large curvature or aerodynamic shape requirements [25,26]. The scarf method is mainly divided into a tapered scarf and a stepped-lap scarf, as shown in Figure 2c,d. These two repair methods have completely different transmission paths and stress distributions due to the different configurations of the adhesive joint surface. The quality of the tapered scarf repair is strongly influenced by the selection of a rational scarf angle, the thickness of the adhesive layer, the shape of the patch, and the design of the reinforcement layer [27,28,29,30,31,32,33,34]. Meanwhile, the patch of the tapered scarf repair is usually in the form of prefabricated components according to the configuration parameters of the scarf shape. The patch is adhesively bonded with the parent structure. The thickness of the adhesive layer is very thin and there is a nearly uniform shear stress distribution, such that the repair quality is easily guaranteed. The adhesive layer of the stepped-lap scarf joint repair is mostly in a pure shear state, but the stress concentration degree is large at the adhesively bonded joint [35,36,37]. In order to alleviate the stress concentration, many scholars have focused their research on improving the load-carrying capacity of the stepped-lap joint surface and adhesively boned joint [38]. The USAF-onded stepped-lap computer code A4EI provides a purely elastic analysis method that can estimate the load-carrying capacity of a double-stepped-lap joint surface with a constant adhesive thickness [39]. Kimiaeifar presented a simple and novel approach for the assessment of the reliability and probability of failure for the adhesive layer of a stepped-lap joint repair, including the influence of variations in the geometrical, physical, strength parameters, and external loading over the joint [40]. An additional reinforcement layer in the repair zone can generate an additional load transmission path and reduce the local stress concentration near the adhesively bonded joint, which significantly improves the buckling characteristics and failure loads of the stepped-lap scarf joint repair [41]. The patch for a stepped-lap scarf repair needs to be laid layer by layer according to the stepped-lap width. The patch and the parent structure are post-cured. The spar cap of the blade is a unidirectional tape with a large aspect ratio, and the damage location, depth, and severity degree of the spar cap cannot be prejudged, such that it is impossible to use a prefabricated patch for repair. Therefore, the stepped-lap scarf joint repair method is more suitable for spar cap damage [42]. In order to ensure the repair quality, the stepped-lap width along the fiber orientation should be designed to be wide enough, where the stepped-lap width should be much larger than ply thickness.
In this study, a carbon nanotube buckypaper sensor was selected to monitor the health condition of the spar cap repaired zone. Carbon nanotube buckypaper is a porous material with a 3D conductive network formed by the interaction of carbon nanotubes [43]. The inside of the carbon nanotube buckypaper is a complex resistance network that acts as a resistance-type sensor on the macro level. The sensing network is complex and workers in this field have divided the resistance into two parts: one is the carbon nanotube structure itself, which gives intrinsic resistance, and the other is the contact resistance, which is formed by carbon nanotubes interacting with each other. In recent years, as a flexible sensor with good interface bonding and high sensitivity, carbon nanotube buckypaper sensors have become a research hotspot in the field of curing state and health monitoring of composite materials. Lu’s team embedded a carbon nanotube buckypaper sensor in the composite laminate during the vacuum-bagging process and found that the curing behavior of epoxy/glass composites can be effectively monitored by the relative resistance change of the sensor [44]. Xu focused on the strain monitoring and found that the circular carbon nanotube sensor exhibited the characteristics for multi-direction strain measurement [45]. Huo’s team prepared carbon nanotube buckypaper composites and characterized the self-sensing properties of bending deformations. The results showed that the resistance change rate of a carbon nanotube buckpaper sensor was consistent with that of a strain gauge [46]. The sensing mechanism of a carbon nanotube buckypaper sensor showed that the resistance increased with the increase of strain. Therefore, the circular carbon nanotube buckypaper sensor has the function of multi-direction strain monitoring, which can be used as an effective tool for composite-structure health monitoring. This sensor was selected in this study to qualitatively monitor the running status of the spar cap after repair, while numerical error analysis is not discussed.
Aiming at the spar cap damage of blade in service, the stepped-lap scarf joint repair was selected for this study, and the basic configuration and health monitoring tests were constructed. The basic configuration test was a tensile test. The large aspect ratio specimens with multiple configuration parameters of stepped-lap scarf unidirectional tape were selected for the test. The results confirmed the sensitivity parameters and failure mode of the spar cap stepped-lap scarf joint repair. According to the damaged weak zone confirmed by the configuration test, the health monitoring test for the spar cap stepped-lap scarf joint repair was constructed by embedding carbon nanotube buckypaper sensors. Under static and fatigue loads, the sensors successfully monitored the progressive damage and the crack propagation signal of the test specimens. Based on the above two tests, important configuration parameters were confirmed for the spar cap repair scheme. The results provide an important basis for the health monitoring of blades in service after repair.
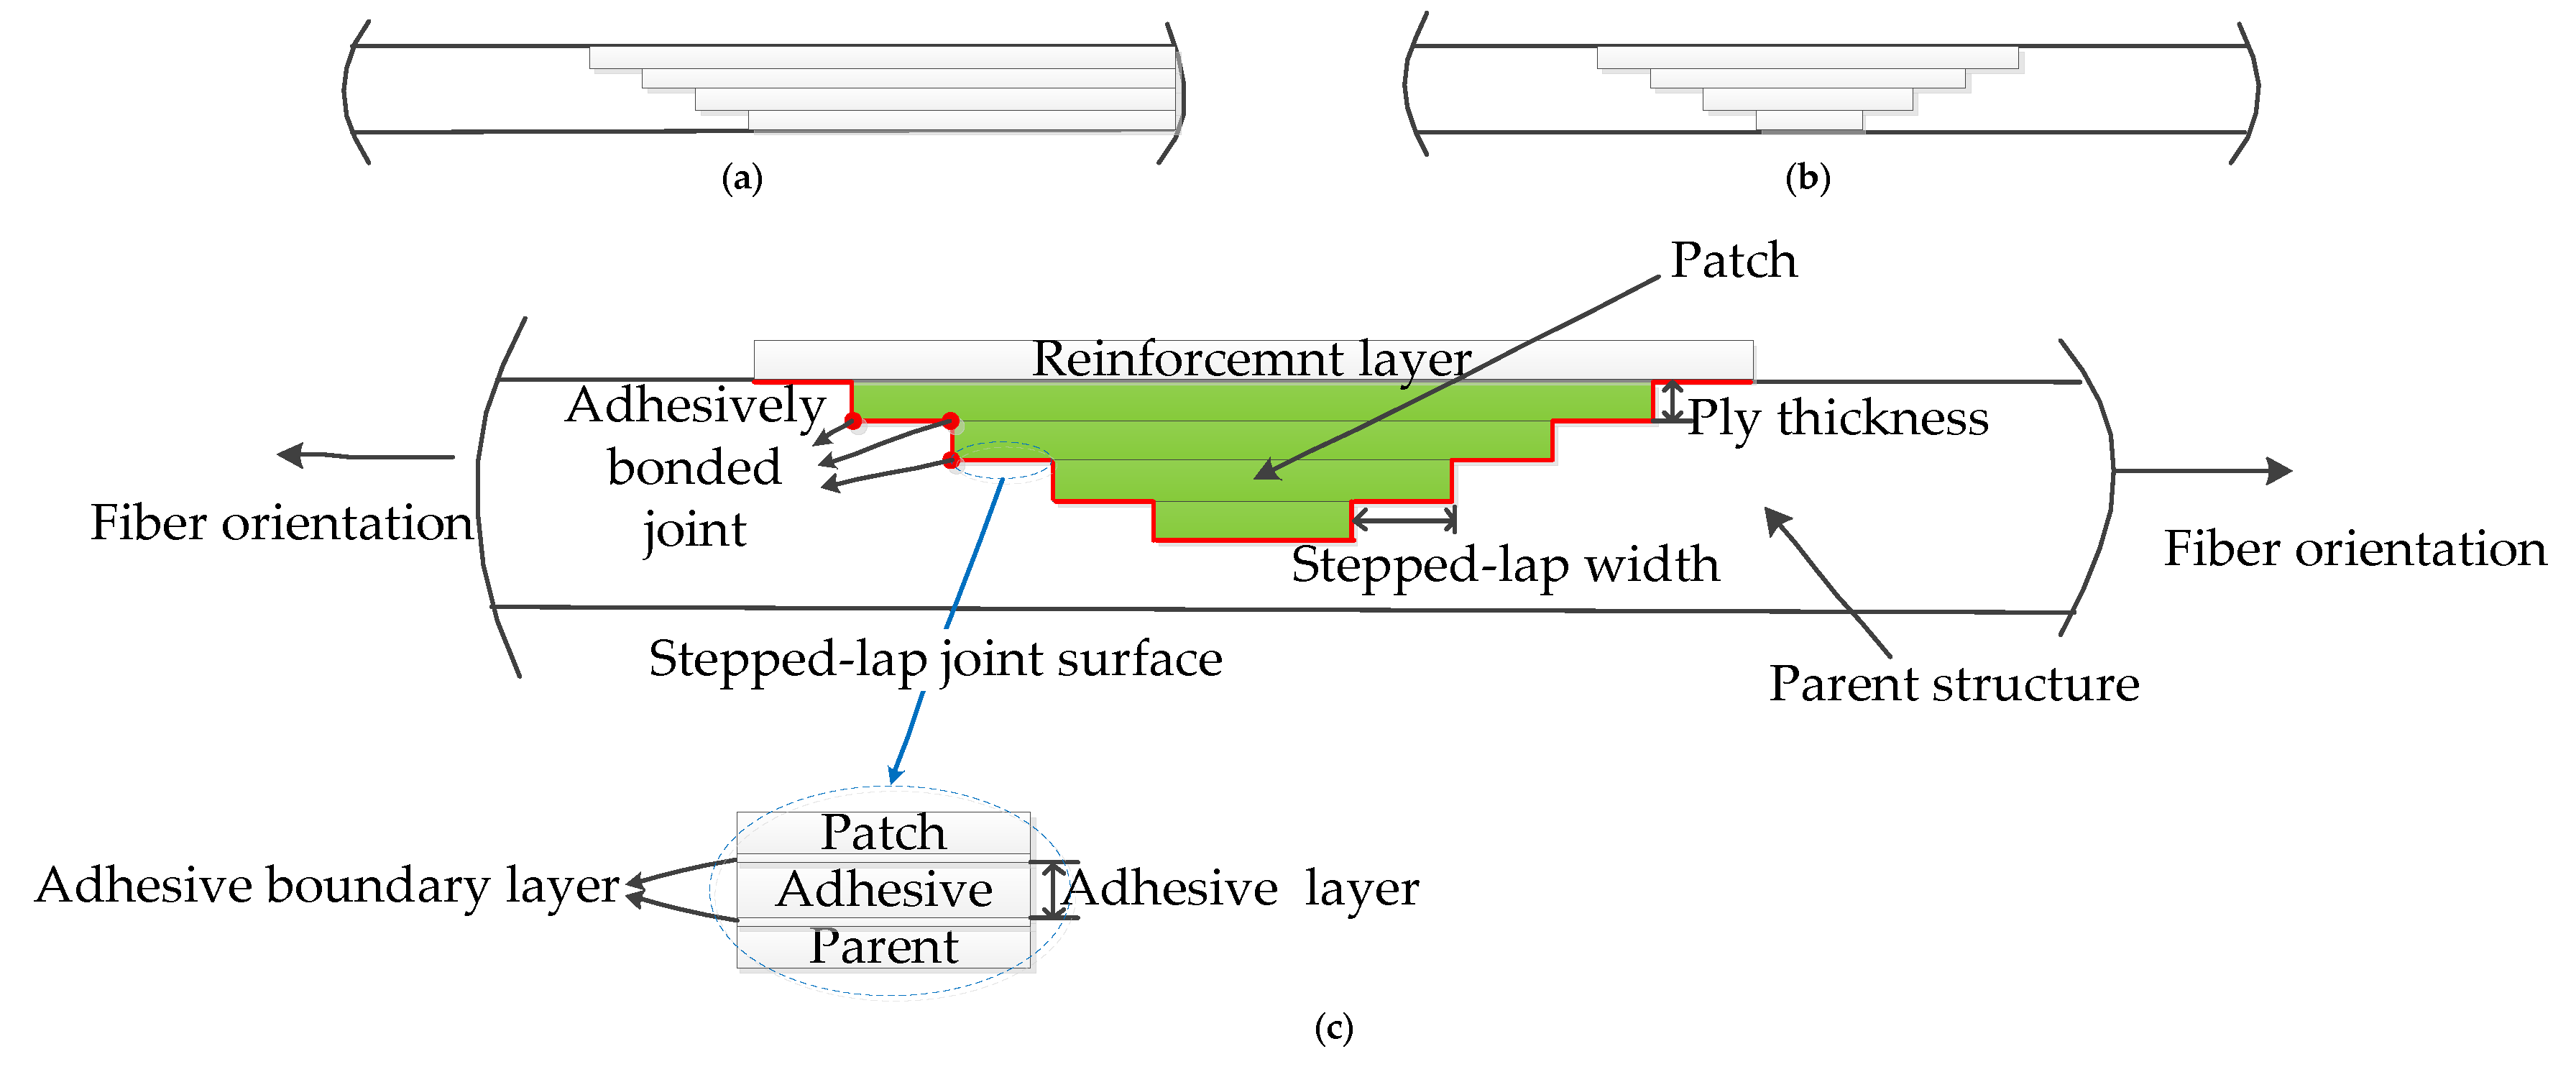
To explain the tests, the key terms of the repair methods mentioned in this paper are given graphically. The stepped-lap mode of the stepped-lap scarf joint repair is divided into a single stepped-lap (Figure 3a) and double stepped-lap (Figure 3b). A double stepped-lap scarf joint repair (Figure 3c) mainly includes the parent structure, the patch, and the stepped-lap joint surface. The parent structure is the original structure before the damage occurred. The patch is a composite material structure that adhesively bonds over the damaged area, utilizing a scarf of a stepped lap. The single layer thickness of the patch is the ply thickness. The connection surface of the parent structure and patch is a stepped-lap joint surface. A stepped-lap joint surface contains an adhesive layer and two adhesive boundary layers. One of the two layers is between the adhesive and the patch, the other layer is between the adhesive and the parent structure. Adhesively bonded joints are on the edge of the stepped-lap joint surface. Rational design of the stepped-lap width and reinforcement layer can relieve the stress concentration of the adhesively bonded joint.

2. Stepped-Lap Scarf Joint Repairing Method

The theoretical model shown in Figure 4 is a stepped-lap scarf joint repair with a large aspect ratio, where the thickness of the laminates along the y-direction is taken to be small compared with the length and width of the model in the x- and z-directions. The tangent angle between the tangential joint surface and the x-direction of the scarf joint model is defined as α . Figure 4 also shows a free body with stepped-lap width dx between the patch and parent structure; τ A and σ A are the shear stress and normal stress of the adhesive layer at the stepped-lap joint surface, respectively; and σ x 2 is the tensile stress in patch along the x-direction. Taking unit breadth of strip in the “z”-direction, we can resolve forces in the x- and y-directions to give:
d d x ( x σ x 2 tan α )   =   σ A tan α + τ A ,
and
σ A   =   τ A tan α .
We note that x σ x 2 tan α   =   P 2 (the end load per unit width in the patch). If we assume that this varies with the cross-sectional area of material:
P 2   =   P 0 x h tan α .
The shear stress at the stepped-lap joint surface can be characterized as:
τ A   =   P 0 h sin α cos α .
In order to obtain a more satisfactory solution, we must introduce strain–displacement and stress–strain equations. For the adhesive layer, Webber, J.P.H. [47] shows that the relative normal and tangential displacements across the adhesive thickness   h A are given by:
Δ u n   =   h A E A σ A     and   Δ u t   =   h A G A τ A ,
with the assumption that the adhesive layer acts separately as tension springs and a shear medium. The relative displacement component in the x-direction then becomes:
du x 2 dx     du x 1 dx   =   h A ( 1 G A   +   tan 2 α E A ) cos α d τ A dx .
Here, u x 1 is the displacement of the parent structure along the x-direction and is assumed to be uniform cross the thickness of the material in the y-direction. Thus, du x 1 dx represents the direct strain in the parent structure at x such that Equation (6) may be written as:
ε x 2     ε x 1   =   h A ( 1 G A   +   tan 2 α E A ) cos α d τ A dx .
Combining this with Equation (3) gives:
d 2 P 2 dx 2   =   1 c ( ε x 2     ε x 1 ) ,
where
c = h A cos α ( 1 + tan 2 α ) ( 1 G A + tan 2 α E A ) .
c is a constant that is dependent only on the scarf angle, the adhesive thickness, and its mechanical properties, which can be used to discuss the stresses in bonded joints and give an analysis for a stepped-lap scarf joint.

3. Tensile Test for the Unidirectional Tape Specimens with a Large Aspect Ratio Repaired Using Multiple Stepped-Lap Scarf Joint Method

3.1. Experimental Basis

The material of the specimen’s parent structure and patch was EUL1200 (0) ep-600e7 (CTG, Taishan, China). The matrix was HEXION epoxy resin LR235 (HEXION, Shanghai, China). The specimen followed a unidirectional 0° fiberglass direction including the test area and grip areas (Figure 5a). Multiple configuration parameters of the stepped-lap scarf joint repaired specimens were designed in the test area. The parent structure was formed using a vacuum infusion process. The patch was laid layer by layer using a stepped-lap joint method. The whole specimen was cured at 180 °C and 0.1 MPa conditions for 2 h (Figure 5b). Tensile tests of the stepped-lap scarf joint repaired specimens were carried out using a universal testing machine (GOTECH, Taiwan, China) with 200 kN load cell. All specimens were tested at room temperature with the crosshead speed held constant at 1 mm/min. The strength was taken as the maximum load recorded by the machine and computer.
Three groups were designed, including 64 effective test specimens with different configuration parameters. The length, width, stepped-lap mode, stepped-lap width, and number of stepped-lap joint surfaces and reinforcement layers are listed in Table 1. Note that the specimen numbers given in Table 1 are used throughout the paper.
The W1 test specimens had no reinforcement layer. Nine kinds of specimens were designed with different aspect ratios (length/width), stepped-lap modes (single or double), stepped-lap joint surface numbers, and stepped-lap widths. W1-J are two layers specimens and W1-K are three-layer specimens, which were taken from the spar cap of a LZ37.5 blade (CNBM, Lianyungang, China) in service. The blade had been running for more than eight years with no apparent damage. The stepped-lap width of the W2 specimens was 100 mm, and the stepped-lap joint surface number was one. For each specimen with different stepped-lap modes and aspect ratios, a reinforcement layer was added. The layers were laid in two ways, one way was a single layer on the top and the other way was a layer on both sides of the specimens. The reinforcement layer numbers of W3 specimens were different, while all the other configuration parameters were the same. All the above specimens were tested for the tensile test. According to the test results of the effective specimens, the influence of the parameters of the spar cap stepped-lap scarf joint on the repair strength was compared and analyzed.
In Table 1, “Length” is the length of the specimen, “Width” is the width of the specimen, “Stepped-Lap Mode” is single stepped lap or double stepped lap, “Stepped-Lap Width” is the width of the stepped-lap joint surface, “Number of Stepped-Lap Joint Surfaces” is the number of the stepped-lap joint surfaces, “Reinforcement Layer” is the laying method used for the reinforcement layer, and “Effective Sample Quantity” is the number of the effective specimens.

3.2. Results and Discussion

In this paper, the tensile test results of the unidirectional tape specimens with a large aspect ratio repaired using the stepped-lap scarf joint method were analyzed. The influence of different configurations (such as stepped-lap mode, number of stepped-lap joint surface, reinforcement layer, etc.) on the failure load and the failure mode of the specimens were verified. Table 2 shows the tensile test results, where the value given is the average value of each group of effective specimens. In Table 2, “Load per Width” is the value of the “Failure Load” divided by “Width,” and the “Load Loss Rate” is the deduction rate of the failure load caused by multiple configuration parameters.

3.2.1. The Influence Analysis Regarding the Stepped-Lap Mode and Stepped-Lap Joint Surface Number

  • The results of the three stepped-lap joint surfaces, two stepped-lap joint surfaces, and one stepped-lap joint surface experiments showed that the stepped-lap joint surface decreased the strength of the specimens. Whether using single stepped lap or double stepped lap, the load loss rates of the two and three stepped-lap joint surfaces were significantly larger than that of a one stepped-lap joint surface.
  • Comparing single stepped-lap and double stepped-lap specimens with multiple stepped-lap joint surfaces, the failure load and tensile strength of these were basically the same. The results above showed that the stepped-lap mode itself had little influence on the strength of the specimens.

3.2.2. Analysis on Strength Attenuation of the Spar Cap Specimens Taken from the LZ37.5 Blade in Service

  • Comparing W1-F with W1-J and W1-B with W1-K showed that as the service life increased, the blade’s spar cap in service for more than eight years had intensity attenuation.
  • In Figure 6, the stress–strain curves of the W1-K and W1-D specimens were basically identical before failure. It indicated that the load carried by the three-layer spar cap specimen repaired using a double stepped-lap scarf joint was basically consistent with the blade strength status of running for several years. The stress–strain curve of the W1-K specimen had an obvious nonlinear unloading section after failure, which was related to different degrees of stiffness attenuation after the specimen had been running for a certain number of years. It was indicated that there would be a serious performance degradation of the structural material after several years of operation.

3.2.3. Influence Analysis of the Reinforcement Layer

  • The load loss rate of the one stepped-lap joint surface specimen was the biggest (34%). The load per width of the stepped-lap scarf joint repaired specimen could be effectively increased by adding a reinforcement layer. For example, the failure load of the W2-C specimens with the addition of two reinforcement layers was more than 4 times higher than that of the single stepped-lap W1-G specimens, and the load per width of the specimens increased from 0.56 to 1.20 kN/mm.
  • By comparing the results of the reinforcement layer of one to three stepped-lap joint surfaces for single stepped-lap and double stepped-lap, it was determined that an N stepped-lap joint surfaces can be reinforced by N reinforcement layers, which could increase the failure load by 65% to 95% of the original value.

3.2.4. Failure Position and Failure Mode

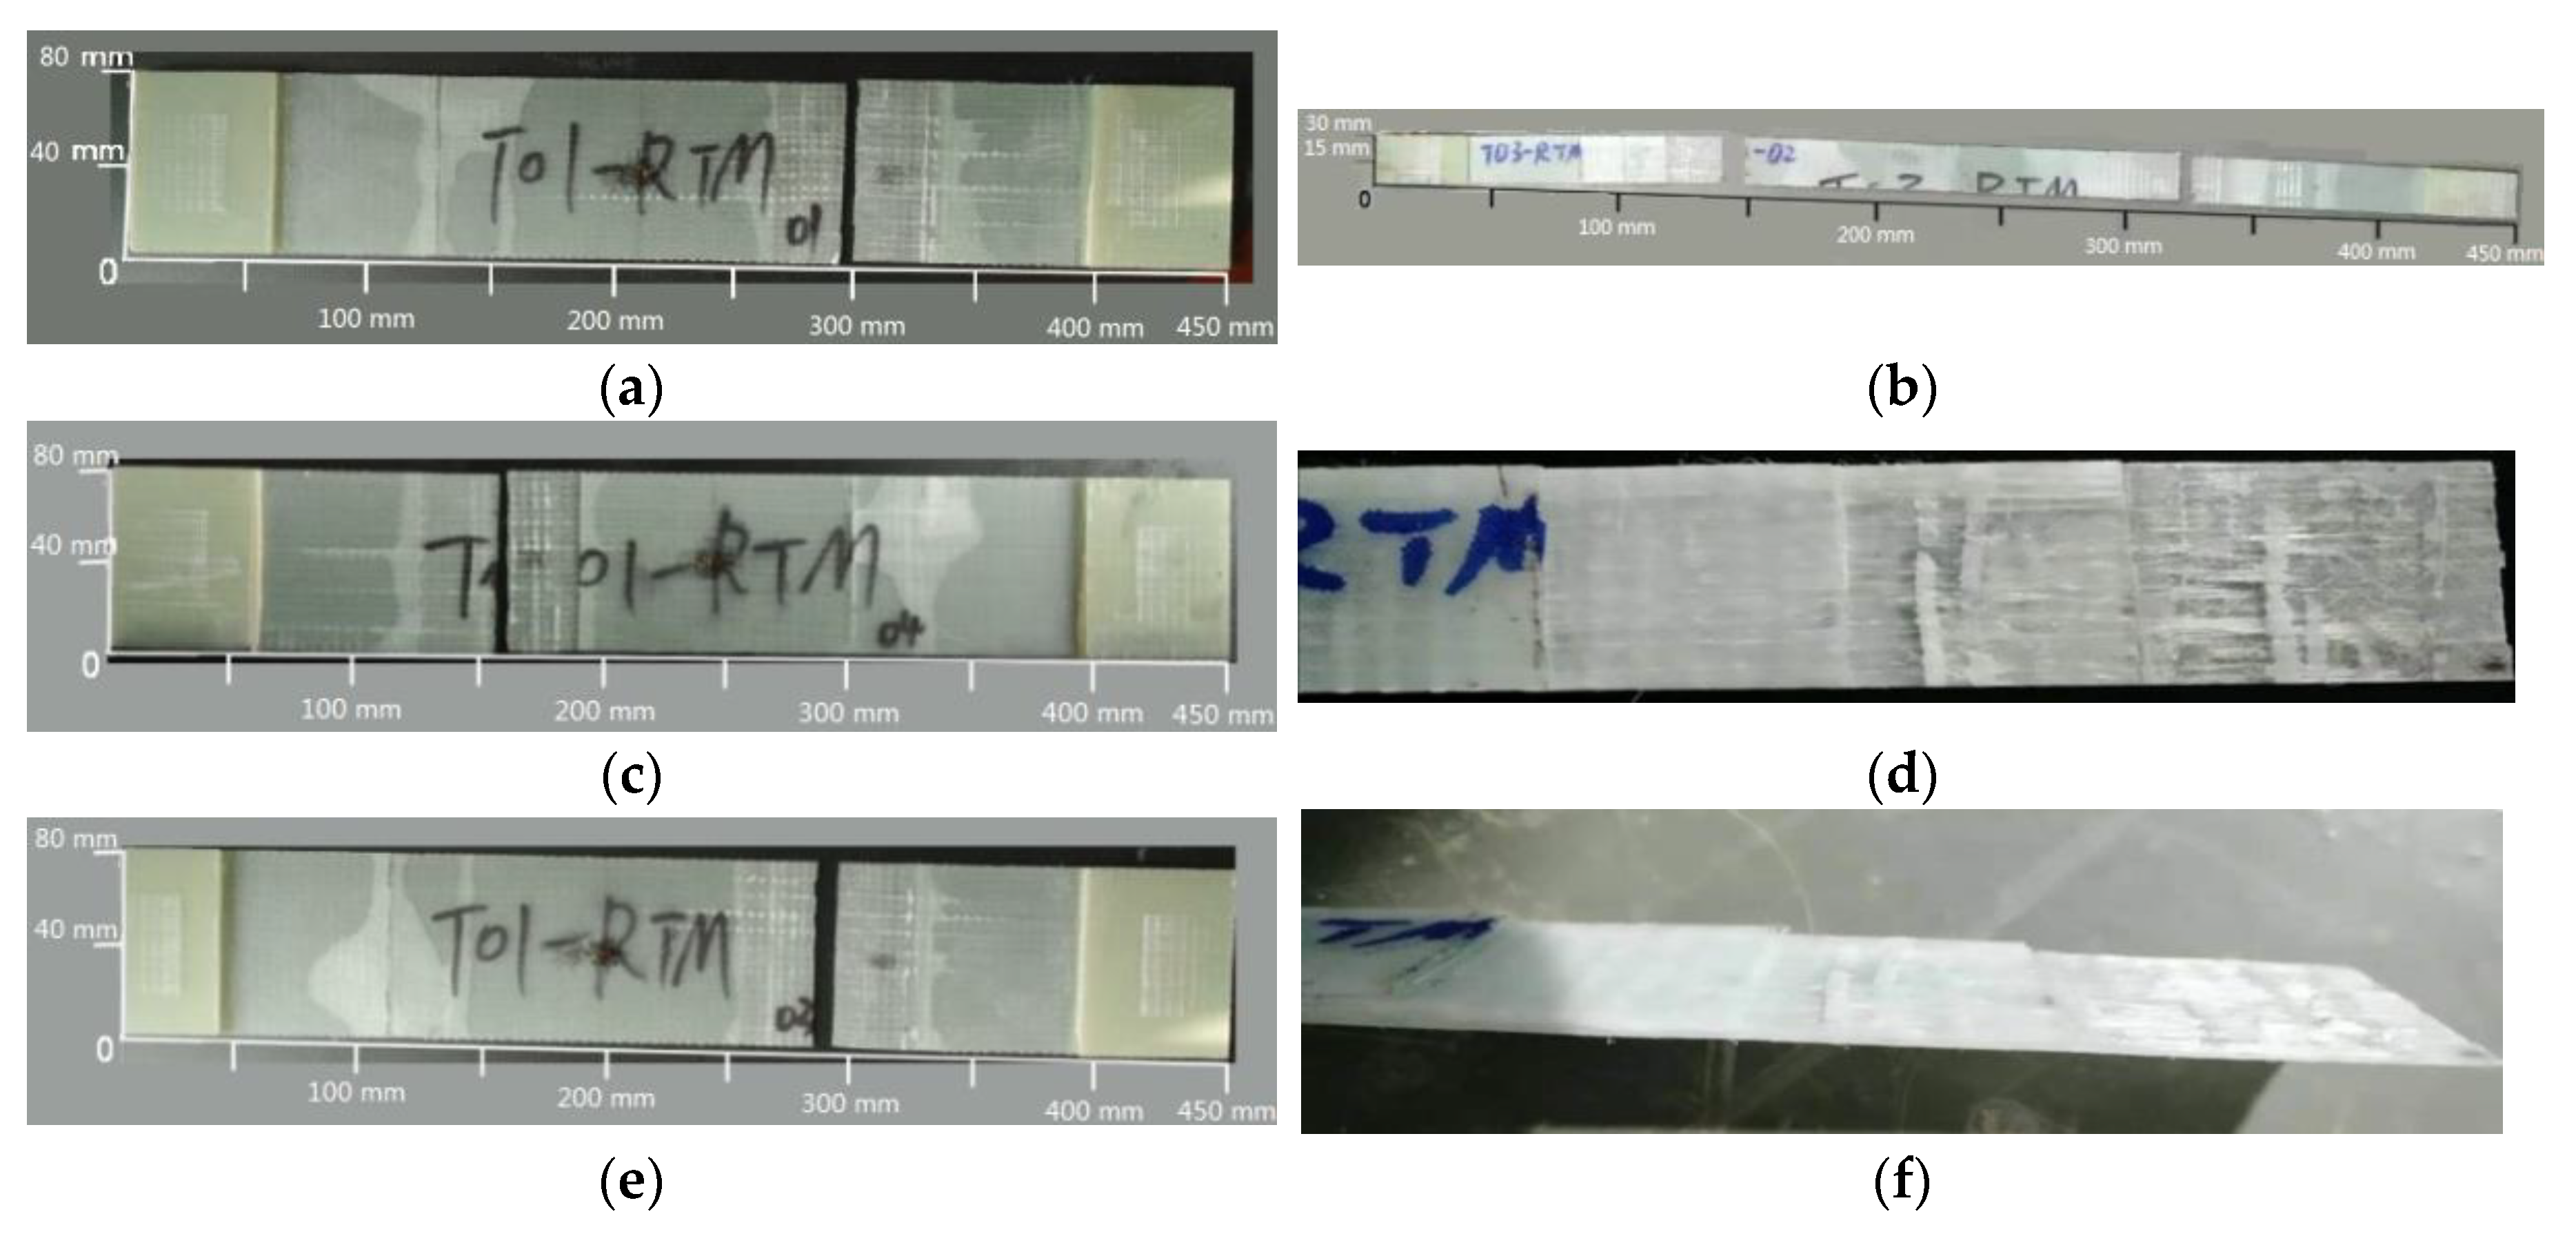
  • The failure specimens for the tensile test of the one stepped-lap joint surface and three stepped-lap joint surfaces are shown in Figure 7, where all specimens failed on the stepped-lap joint surface. The initial failure mode of the stepped-lap joint surface appeared as delamination. The final failure of the specimens was characterized by the coupling mode of the shear failure of the adhesive layer and the fiber fracture on the stepped-lap joint surface.
  • In Figure 8, the strain of the stepped-lap joint surface increased rapidly in the rising section, then fell rapidly, which indicated that a certain damage had occurred there, while no strain agitation occurred in the patch and parent structure. Therefore, the initial damage failure position of the specimen was located at the stepped-lap joint surface.

4. The Research on the Quasi-Static and Fatigue Test of the Stepped-Lap Scarf Joint Repaired Monitoring Using Carbon Nanotube Buckypaper Sensors

The tensile test research in Section 3 provided the appropriate stepped-lap mode and the number of stepped-lap joint surfaces and reinforcement layers for the spar cap damage repair, and confirmed that the coupling of the delamination of the adhesive layer and fiber fracture on the stepped-lap joint surface were the main failure mode. However, it could not detect the progressive damage and service safety of the weak zone after the spar cap repair. In this section, carbon nanotube buckypaper sensors were applied to monitor the resistance change rate in the weak zone to successfully monitor the progressive damage and the crack propagation signal, which provided an important basis for evaluating the operation states of the spar cap after the repair.

4.1. Test Materials

The materials of the specimen’s parent structure and patch are unidirectional prepreg G20000 (GW COMPOS, Weihai, China). The matrix is 7901DNK toughened modified epoxy resin, with a resin content of 32%. The parent structure was formed by vacuum infusion, three layers of unidirectional patch laminate and one layer of biaxial reinforcement layer were laid. Meanwhile, carbon nanotube buckypaper sensors were laid on the stepped-lap joint surface, and then curing by vacuum infusion.

4.2. Specimen Design and Preparation

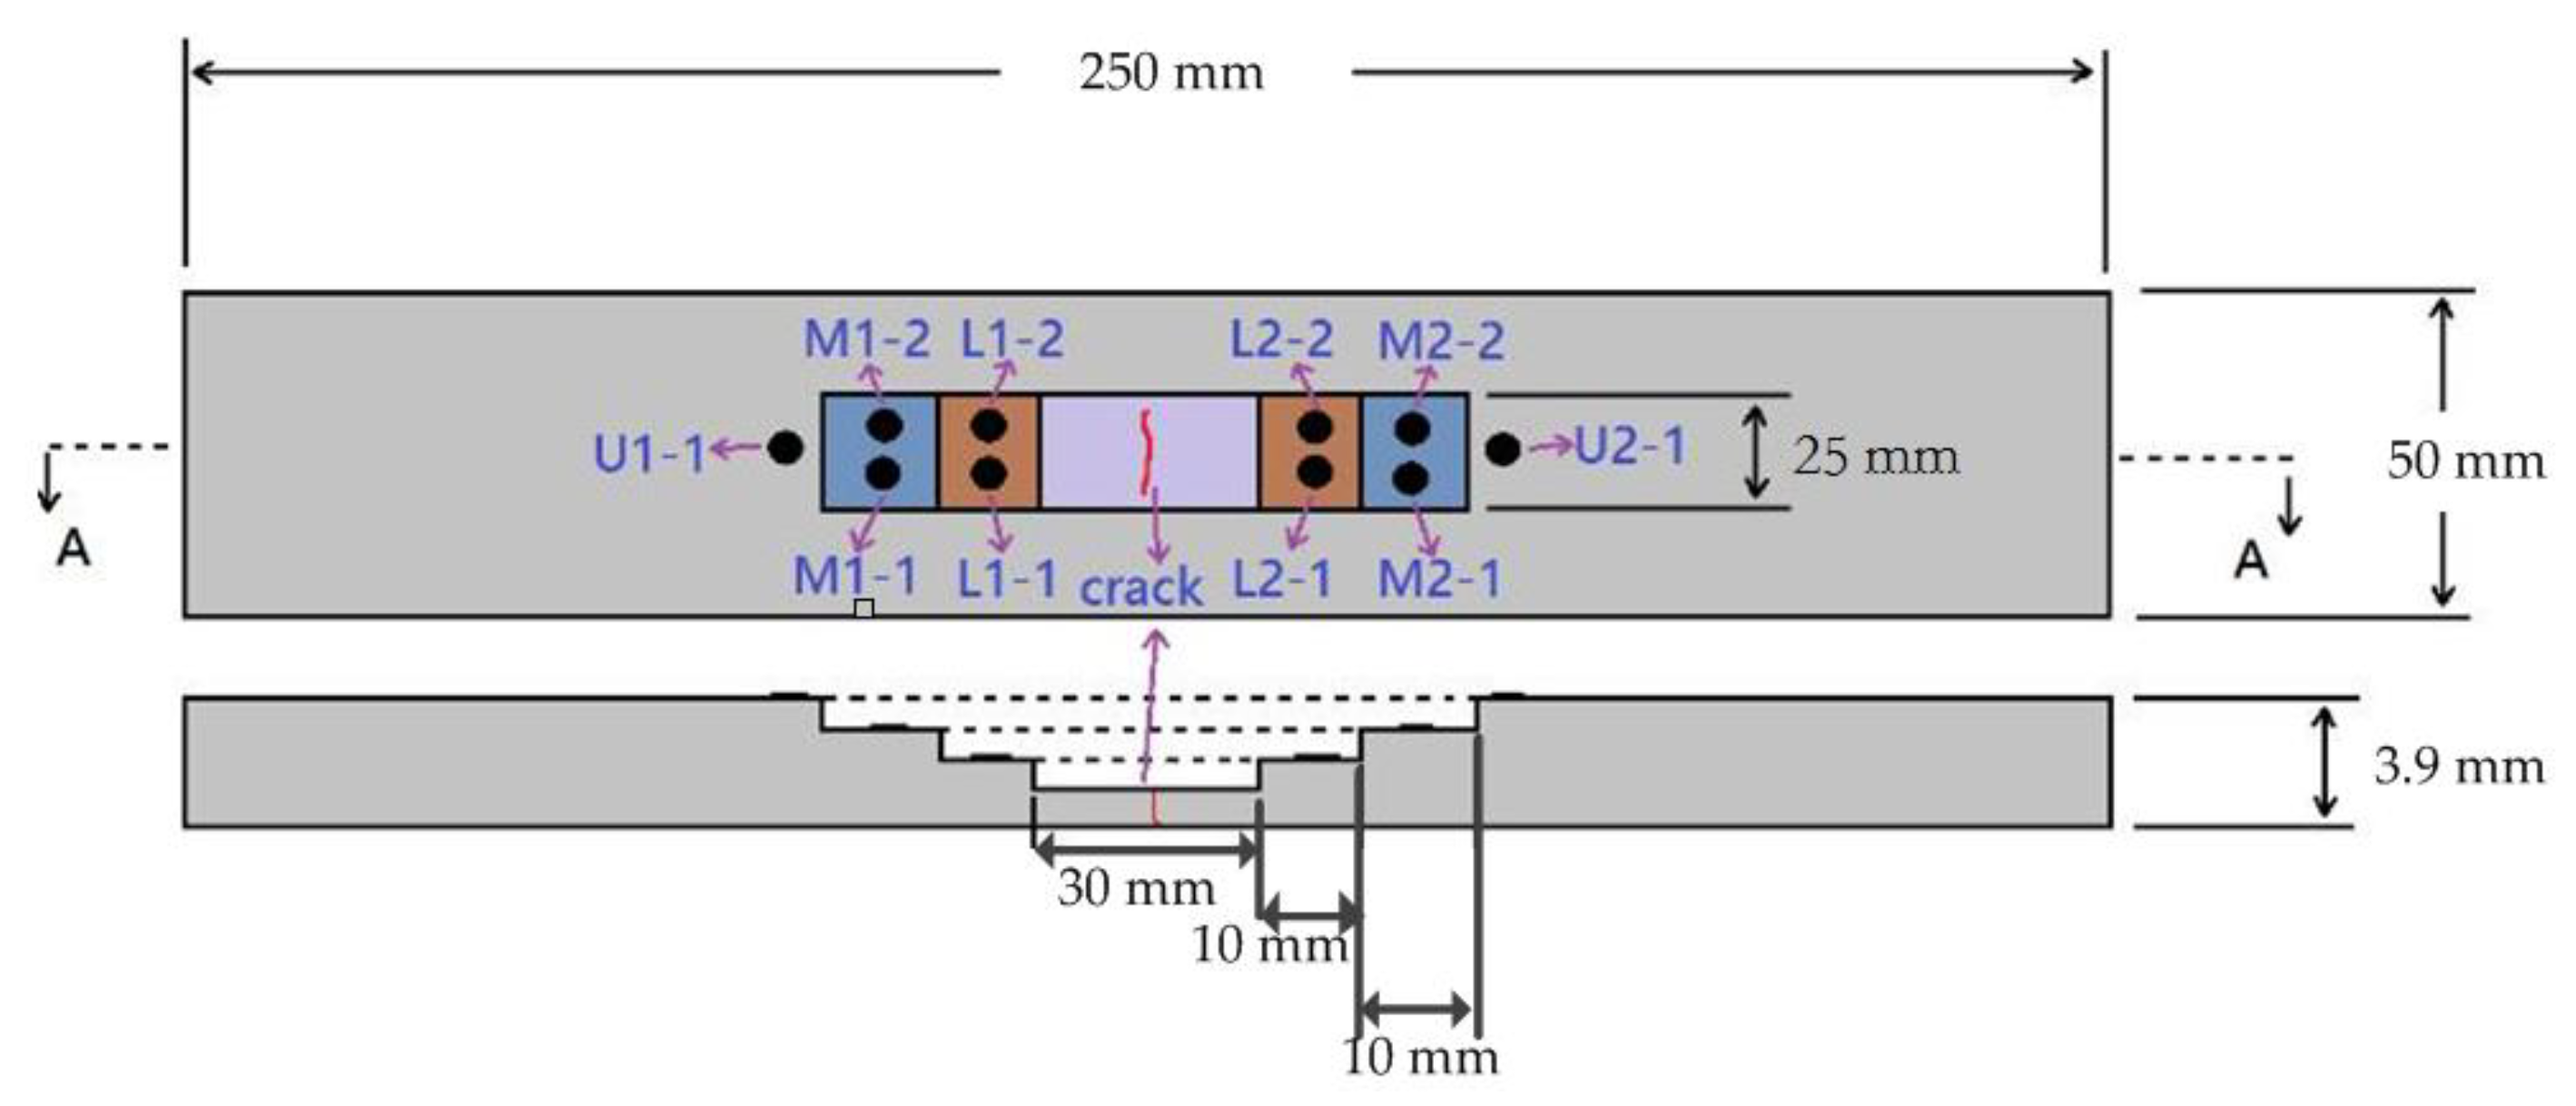
The length and width of the specimen were 250 mm and 50 mm. The dimensions of the three layers of the unidirectional patch were 25 × 70 mm, 25 × 50 mm, and 25 × 30 mm. The size of the reinforcement layer was 25 × 90 mm. The specimen size and the carbon nanotube buckypaper sensor positions are shown in Figure 9, where the circular carbon nanotube buckypaper sensors with a diameter of 8 mm were symmetrically arranged on the stepped-lap joint surface.
The parent structure was a 24-layer G20000 prepreg laminate structure (Figure 10a). When the parent structure was cured, the carbon nanotube buckypaper sensors (Figure 10b) and the patch were laid on the stepped-lap joint surfaces. Four sensors were arranged on the bottom stepped-lap joint surface, which were defined as L1-1, L1-2, L2-1, and L2-2. Four sensors were arranged on the middle stepped-lap joint surface, which were defined as M1-1, M1-2, M2-1, and M2-2. Two sensors were arranged on the joint surface between the reinforcement layer and the parent structure, which were defined as U1-1 and U2-1. After sealing and vacuuming, the specimens were put into an oven at 120 °C for curing (Figure 10c).

4.3. Load Test Design

The load test program was divided into a quasi-static tensile test and fatigue test. The quasi-static tensile test studied the response of the sensors during the failure process and obtained the failure strength of the specimen to confirm the load range of the fatigue test. The fatigue test studied progressive damage on the stepped-lap joint surface. In this test, tensile–tensile fatigue and tensile–compression fatigue were carried out. A dynamic strain gauge was used to monitor the fatigue cycle and strain amplitude, where all the carbon nanotube buckypaper sensors arranged on the stepped-lap joint surface and monitored the resistance in real time.
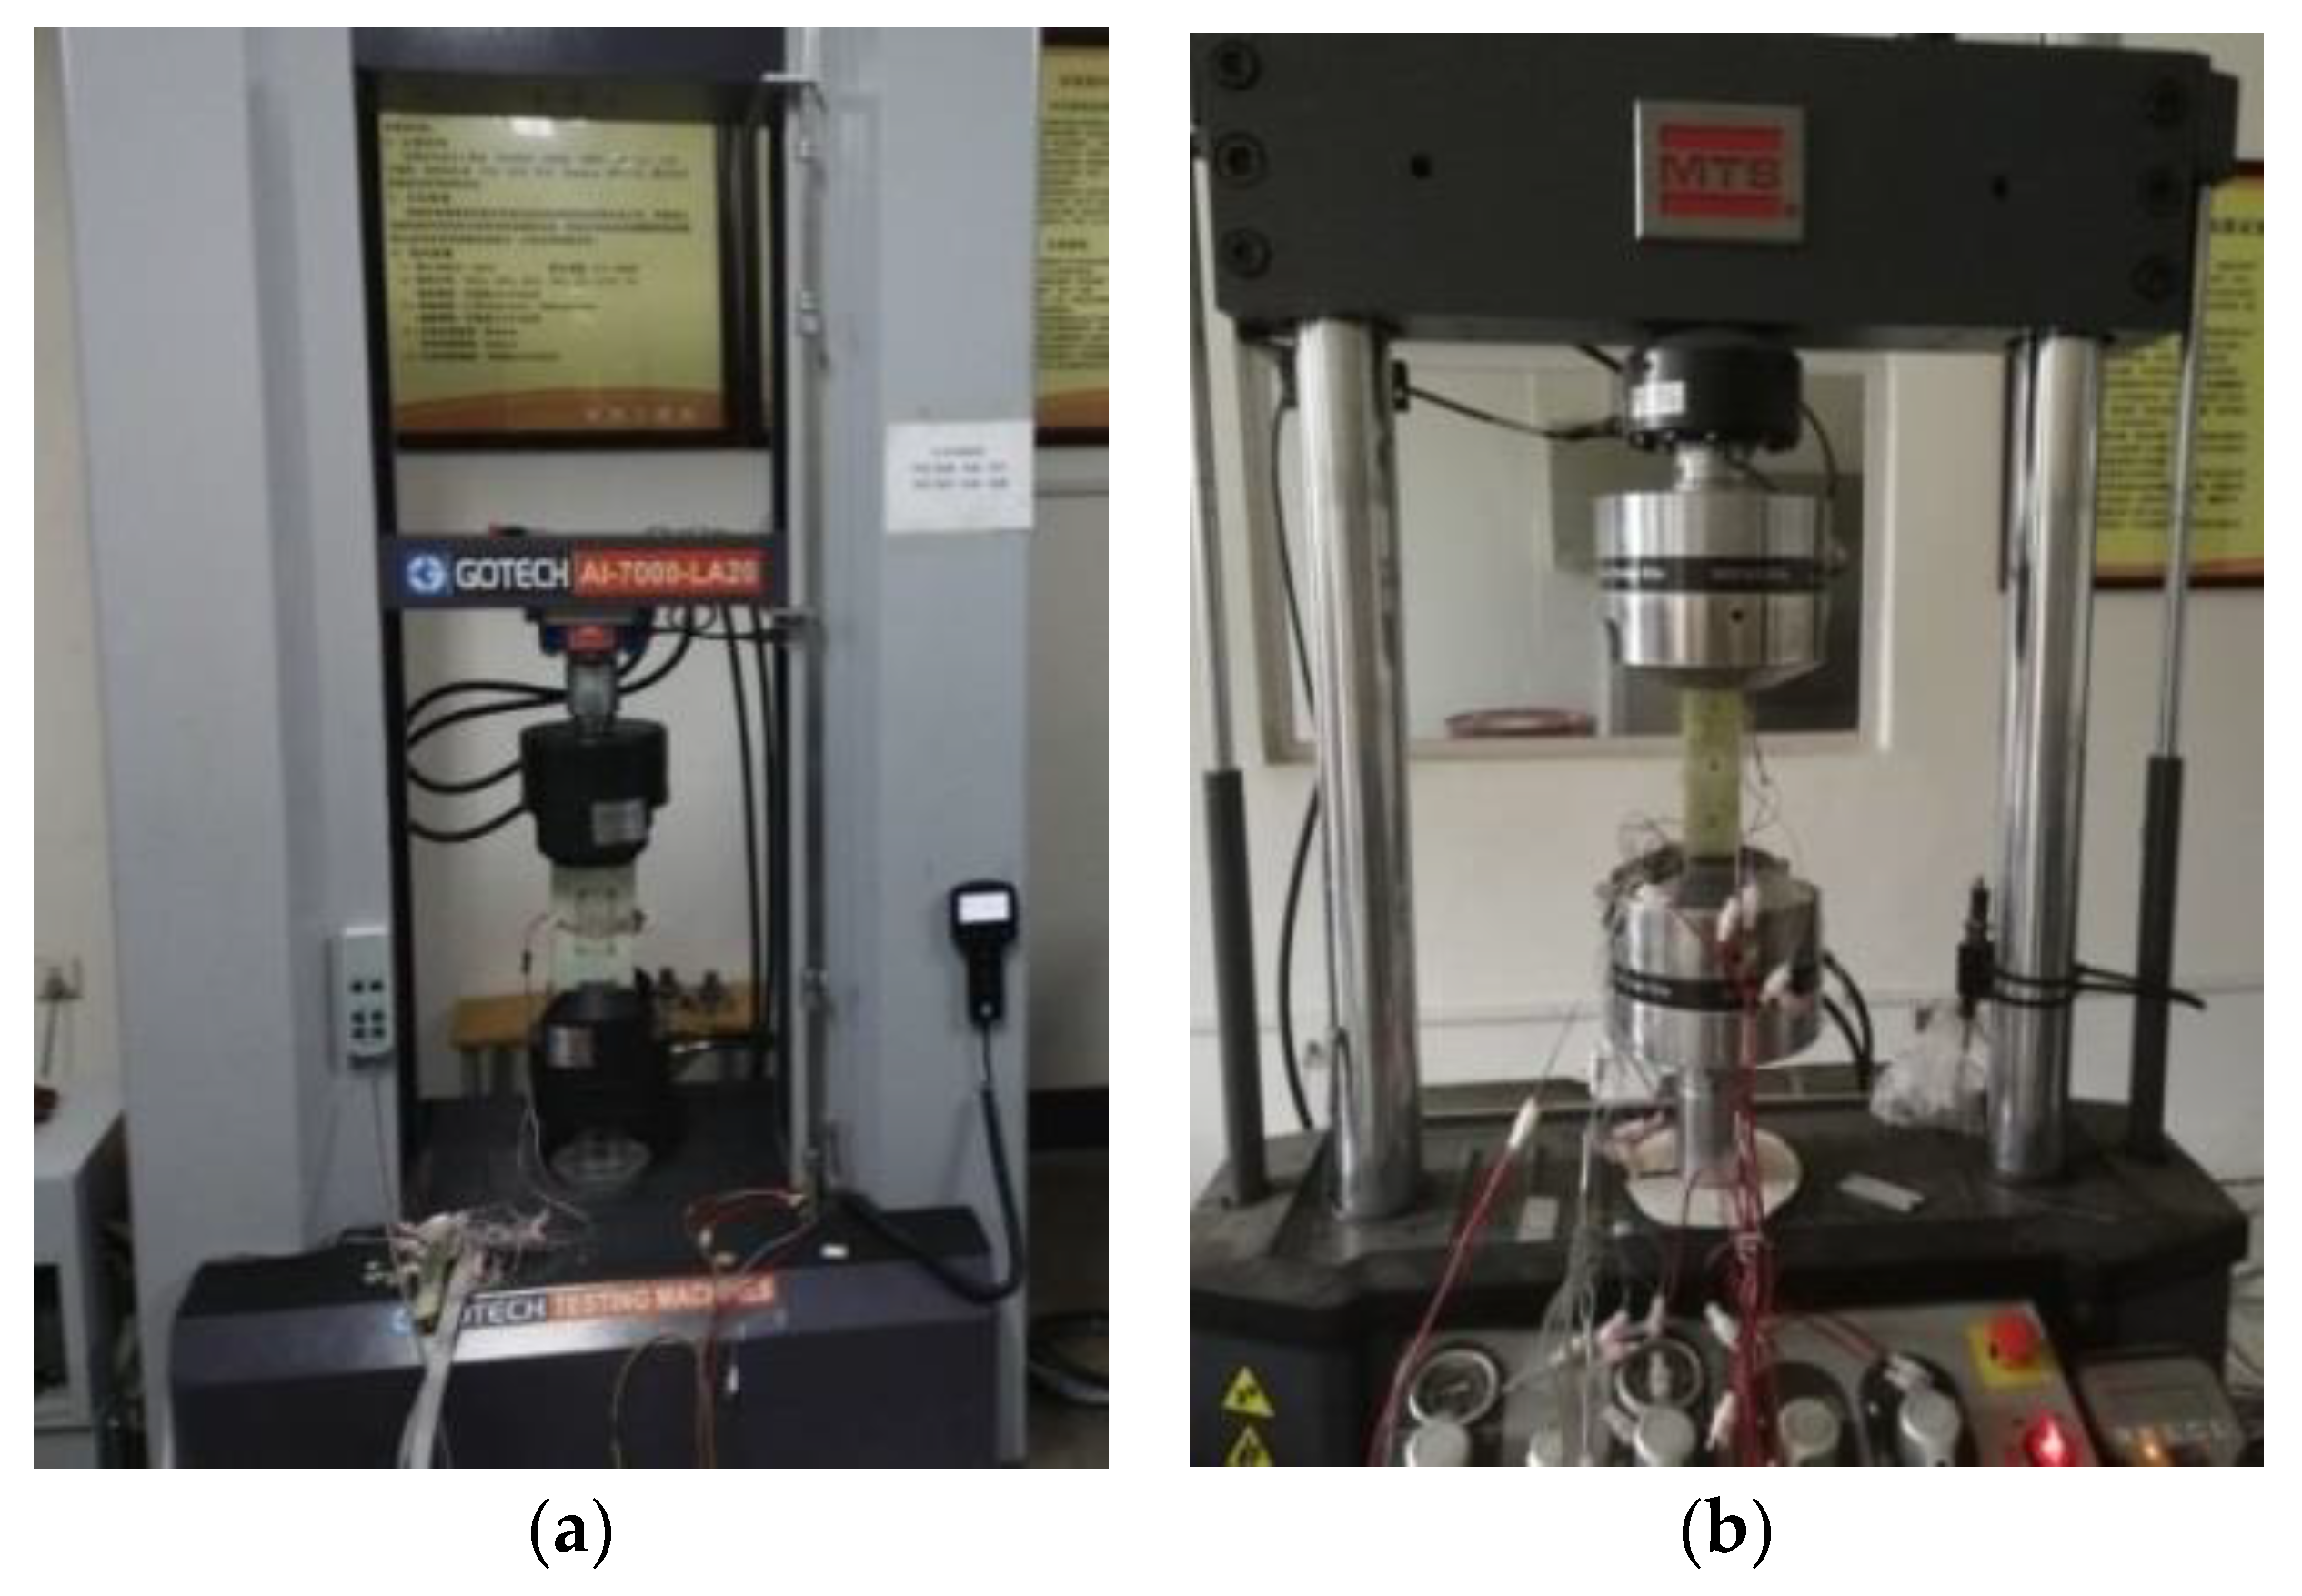
The quasi-static tensile test used a GOTECH AL-7000-LA20 (GOTECH, Taiwan, China) universal testing machine as shown in Figure 11a. The specimen was loaded to 5 kN at a rate of 0.5 mm/min and then unloaded to 0 kN, with each test repeated three times, at the same rate. Then, the specimens were loaded to 10 kN–55 kN with a load increment for 5 kN for each successive load step, where they were unloaded to 0 kN between each test. Each load step was repeated three times until failure. The curves of the loading and unloading under different maximum loads were fitted. The performance changes of the stepped-lap joint surface under different loads were evaluated via sensor response. A Fluke 2638A (FLUKE, Everfried, WA, USA) was used to collect the changes of the sensor resistance during the whole loading course.
The fatigue test used the MTS Landmark electro-hydraulic servo fatigue testing machine (MTS, Minneapolis, MN, USA), as shown in Figure 11b. During the experiment, the fatigue load was adjusted according to the response stability of the sensors. The segmentation load of the tensile–tensile fatigue test was as follows: 20,000 fatigue cycles were performed at 9–15 kN, 60,000 fatigue cycles at 10–20 kN, 30,000 fatigue cycles at 16–24 kN, 1000 fatigue cycles at 15–25 kN, 1000 fatigue cycles at 14–26 kN, and 13–27 kN fatigue cycles until failure. The load of the tension–compression fatigue test was −5 to 15 kN until failure.

4.4. Results and Discussion

4.4.1. Failure Process Analysis of the Quasi-Static Tensile Test

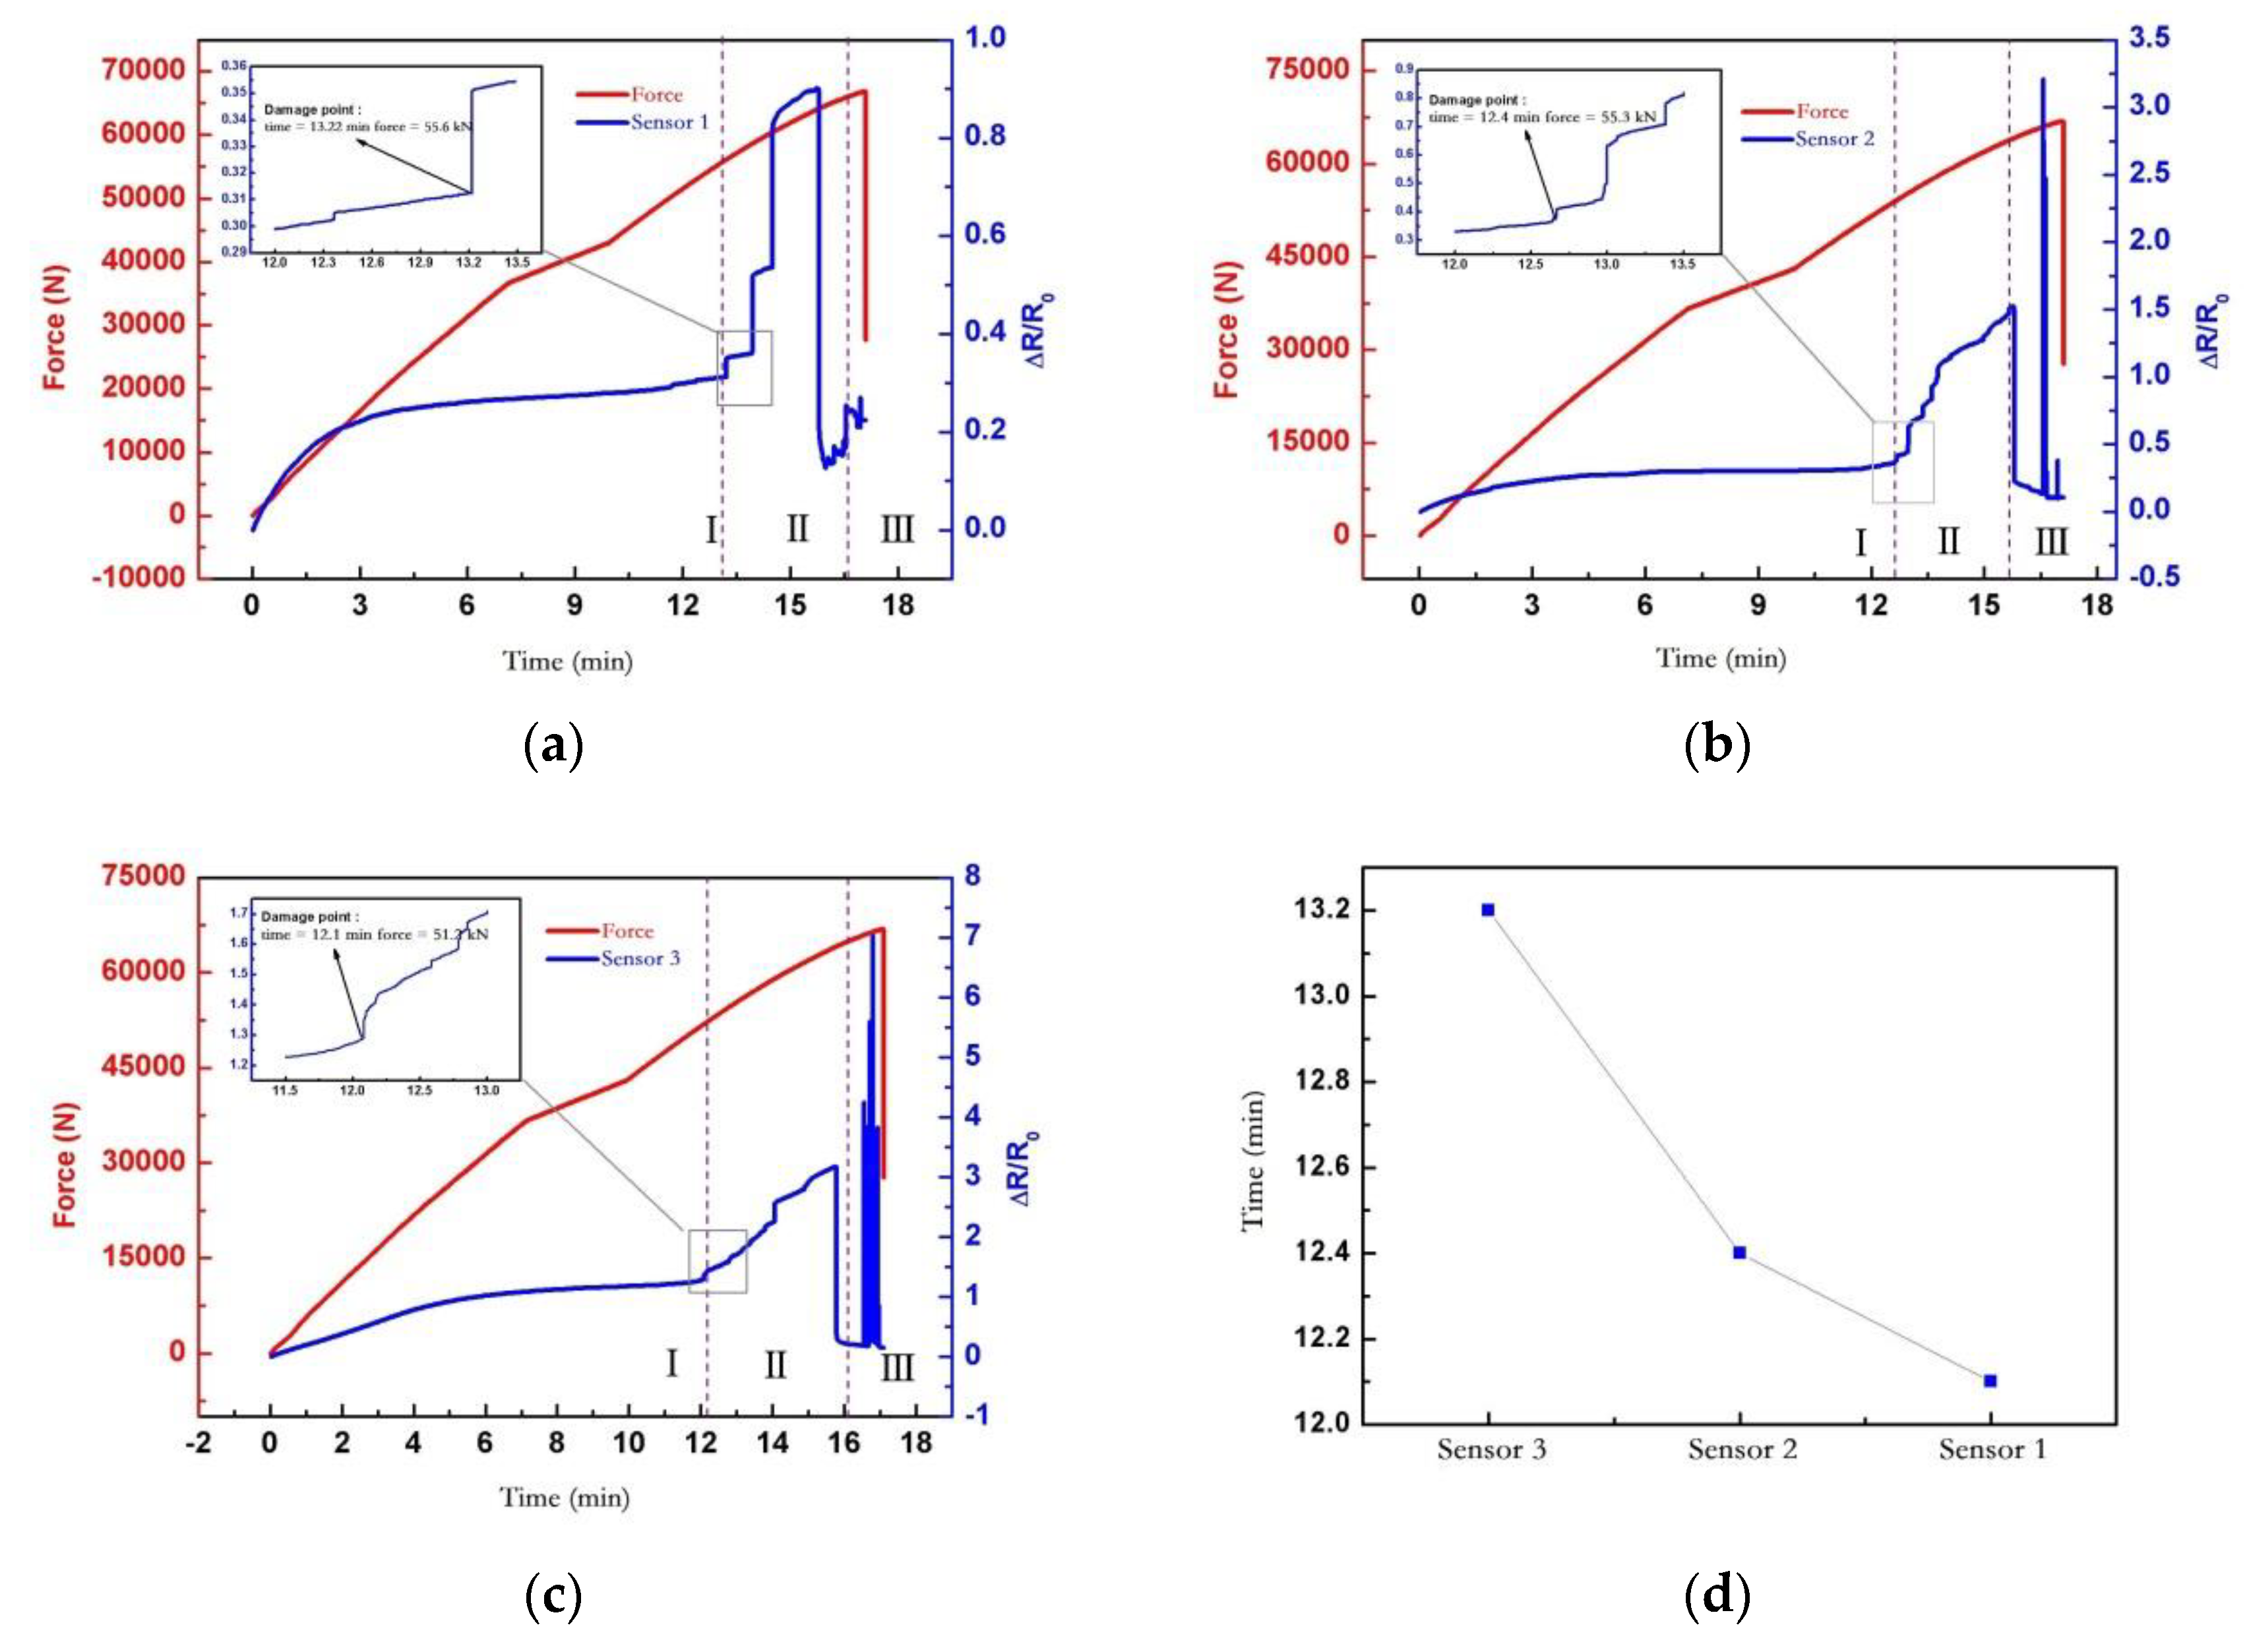
The load–time curve and resistance change rate–time curve of sensors 1–3 are shown in Figure 12a–c, respectively. Sensor 1 was at U1-1, which was on the top stepped-lap joint surface. Sensor 2 was at M1-1, which was on the middle stepped-lap joint surface. Sensor 3 was at L1-1, which was on the bottom stepped-lap joint surface. Figure 12d showed the damage time of the three sensors.
For the load–resistance response curve of each sensor in the quasi-static tensile test, four turning key points could be summarized to judge the failure process, which provided an important basis for monitoring the damage evolution on the stepped-lap joint surface with carbon nanotube buckypaper sensors.
  • When the displacement load was applied uniformly, the specimen was basically in a linear elastic state. When the applied load was about 38 kN, turning point A of the stiffness of the specimen appeared. Before point A, the response of the sensor changed with the elasticity. After point A, the resistance change of the sensor tended to be flat.
  • When the applied load reached about 55 kN, the sensor resistance surged at point B, which was the initial derivation stage of the specimen damage; the overall strength of the specimen was not affected yet, and there was almost no damage in the structure of the A–B state segment. When further increasing the load, the sensor resistance increased sharply after point B, and the damage inside the specimen structure began to accumulate.
  • As the load increased, the sensor resistance increased dramatically and dropped suddenly, where point C was the sensor resistance’s drop point, the load effect was about 63 kN, and the B–C state segment was the damage evolution inside the structure. When reaching point C, the internal structure of the specimen formed an initial crack, the stress was suddenly released, and the whole structure of the specimen had not reached the failure level. When further increasing the load, after point C, the resistance of the sensor dropped suddenly.
  • After a sudden steep drop in the sensor resistance, the resistance response became disordered and the sensor failed. The sensor’s failure preceded the complete failure of the specimen. After the sensor failed, the specimen was completely destroyed when the load only increased by 3 kN. Therefore, the failure of the sensor could be used as an early warning of the complete failure of the specimen. When the applied load reached 66.8 kN, the load suddenly dropped to point D, and the crack of the specimen rapidly propagated to structural failure.
  • The damage time of the three sensors on the stepped-lap joint surface differed by about 1 min when the whole specimen was uniformly loaded, which indicated that the model of a stepped-lap scarf joint unidirectional tape had a stable structural response on the stepped-lap joint surface.
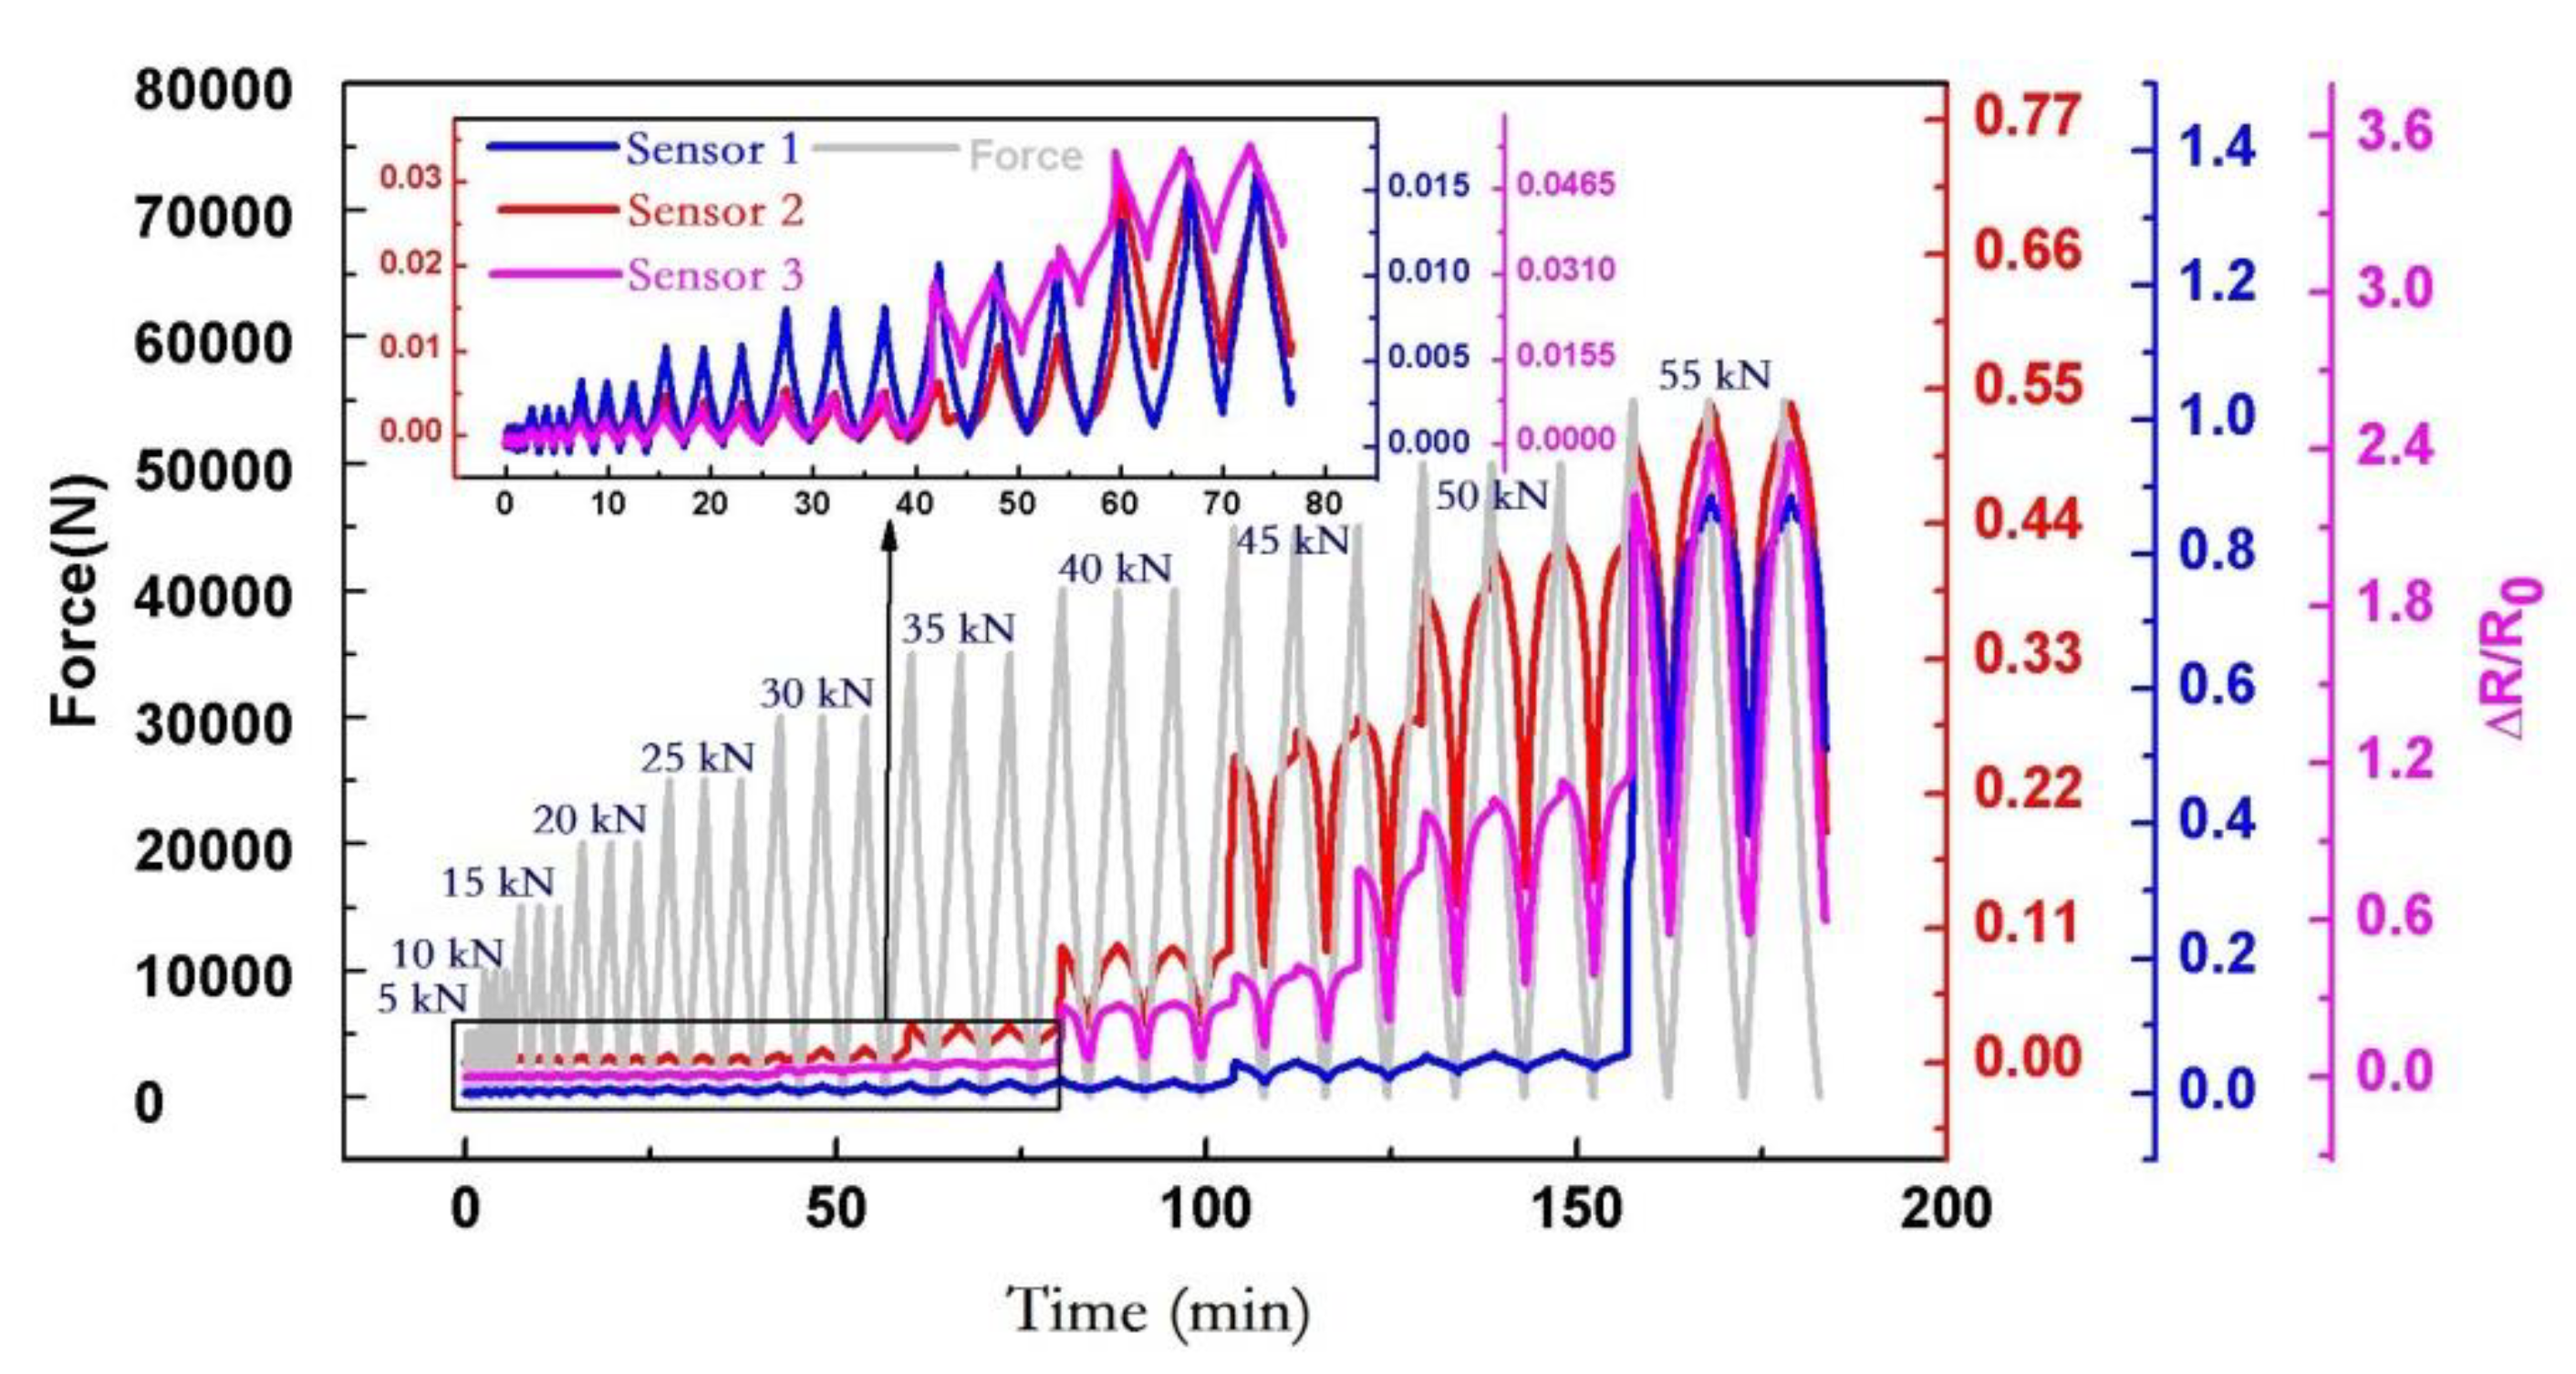
The load–time curve and resistance rate–time curve of the graded load-and-unload test were designed according to the test program, as shown in Figure 13. When the maximum load did not exceed 35 kN, the sensor resistance remained relatively stable and the specimen was in the linear elastic phase, such that the resistance could be restored to the initial resistance after unloading. When the load exceeded 40 kN, the sensor resistance had a large step and could not return to the original resistance. According to the analysis results of Section 4.4.1, when the load exceeded 55 kN, the damage and fracture of the specimen began to evolve, such that the maximum load of the fatigue test was 55 kN.

4.4.2. Failure Mode Analysis of the Quasi-Static Tensile Test

The final failure load of the specimen was 66.8 kN. Figure 14a shows the face of the specimen, where a 1–2 mm crack was observed in the black-framed local magnification. The damage type of the specimen was matrix damage. The fiber fracture and matrix damage occurred in the middle of the clamping position simultaneously. Figure 14b shows the back of the specimen, where the parent structure of the specimen had been completely torn, which appeared as matrix damage and delamination coupling damage. No obvious fiber fracture was observed. Figure 14c shows the side of the specimen. The upper part of the stepped-lap joint surface had completely delaminated, while the lower part had no obvious crack. Therefore, the damage of the parent structure was mainly caused by matrix damage and the stepped-lap joint surface delamination. The results of the failure position research of the large aspect ratio specimen in Section 3 were verified. The delamination failure on the stepped-lap joint surface was the main failure mode, and the patch itself presented a good load-carrying capacity.

4.4.3. Analysis of the Tensile-Tensile Fatigue Test

A total of 112,344 cycles of loading were completed in the tensile–tensile fatigue test. All 10 sensors arranged in this test survived, except U1-1.
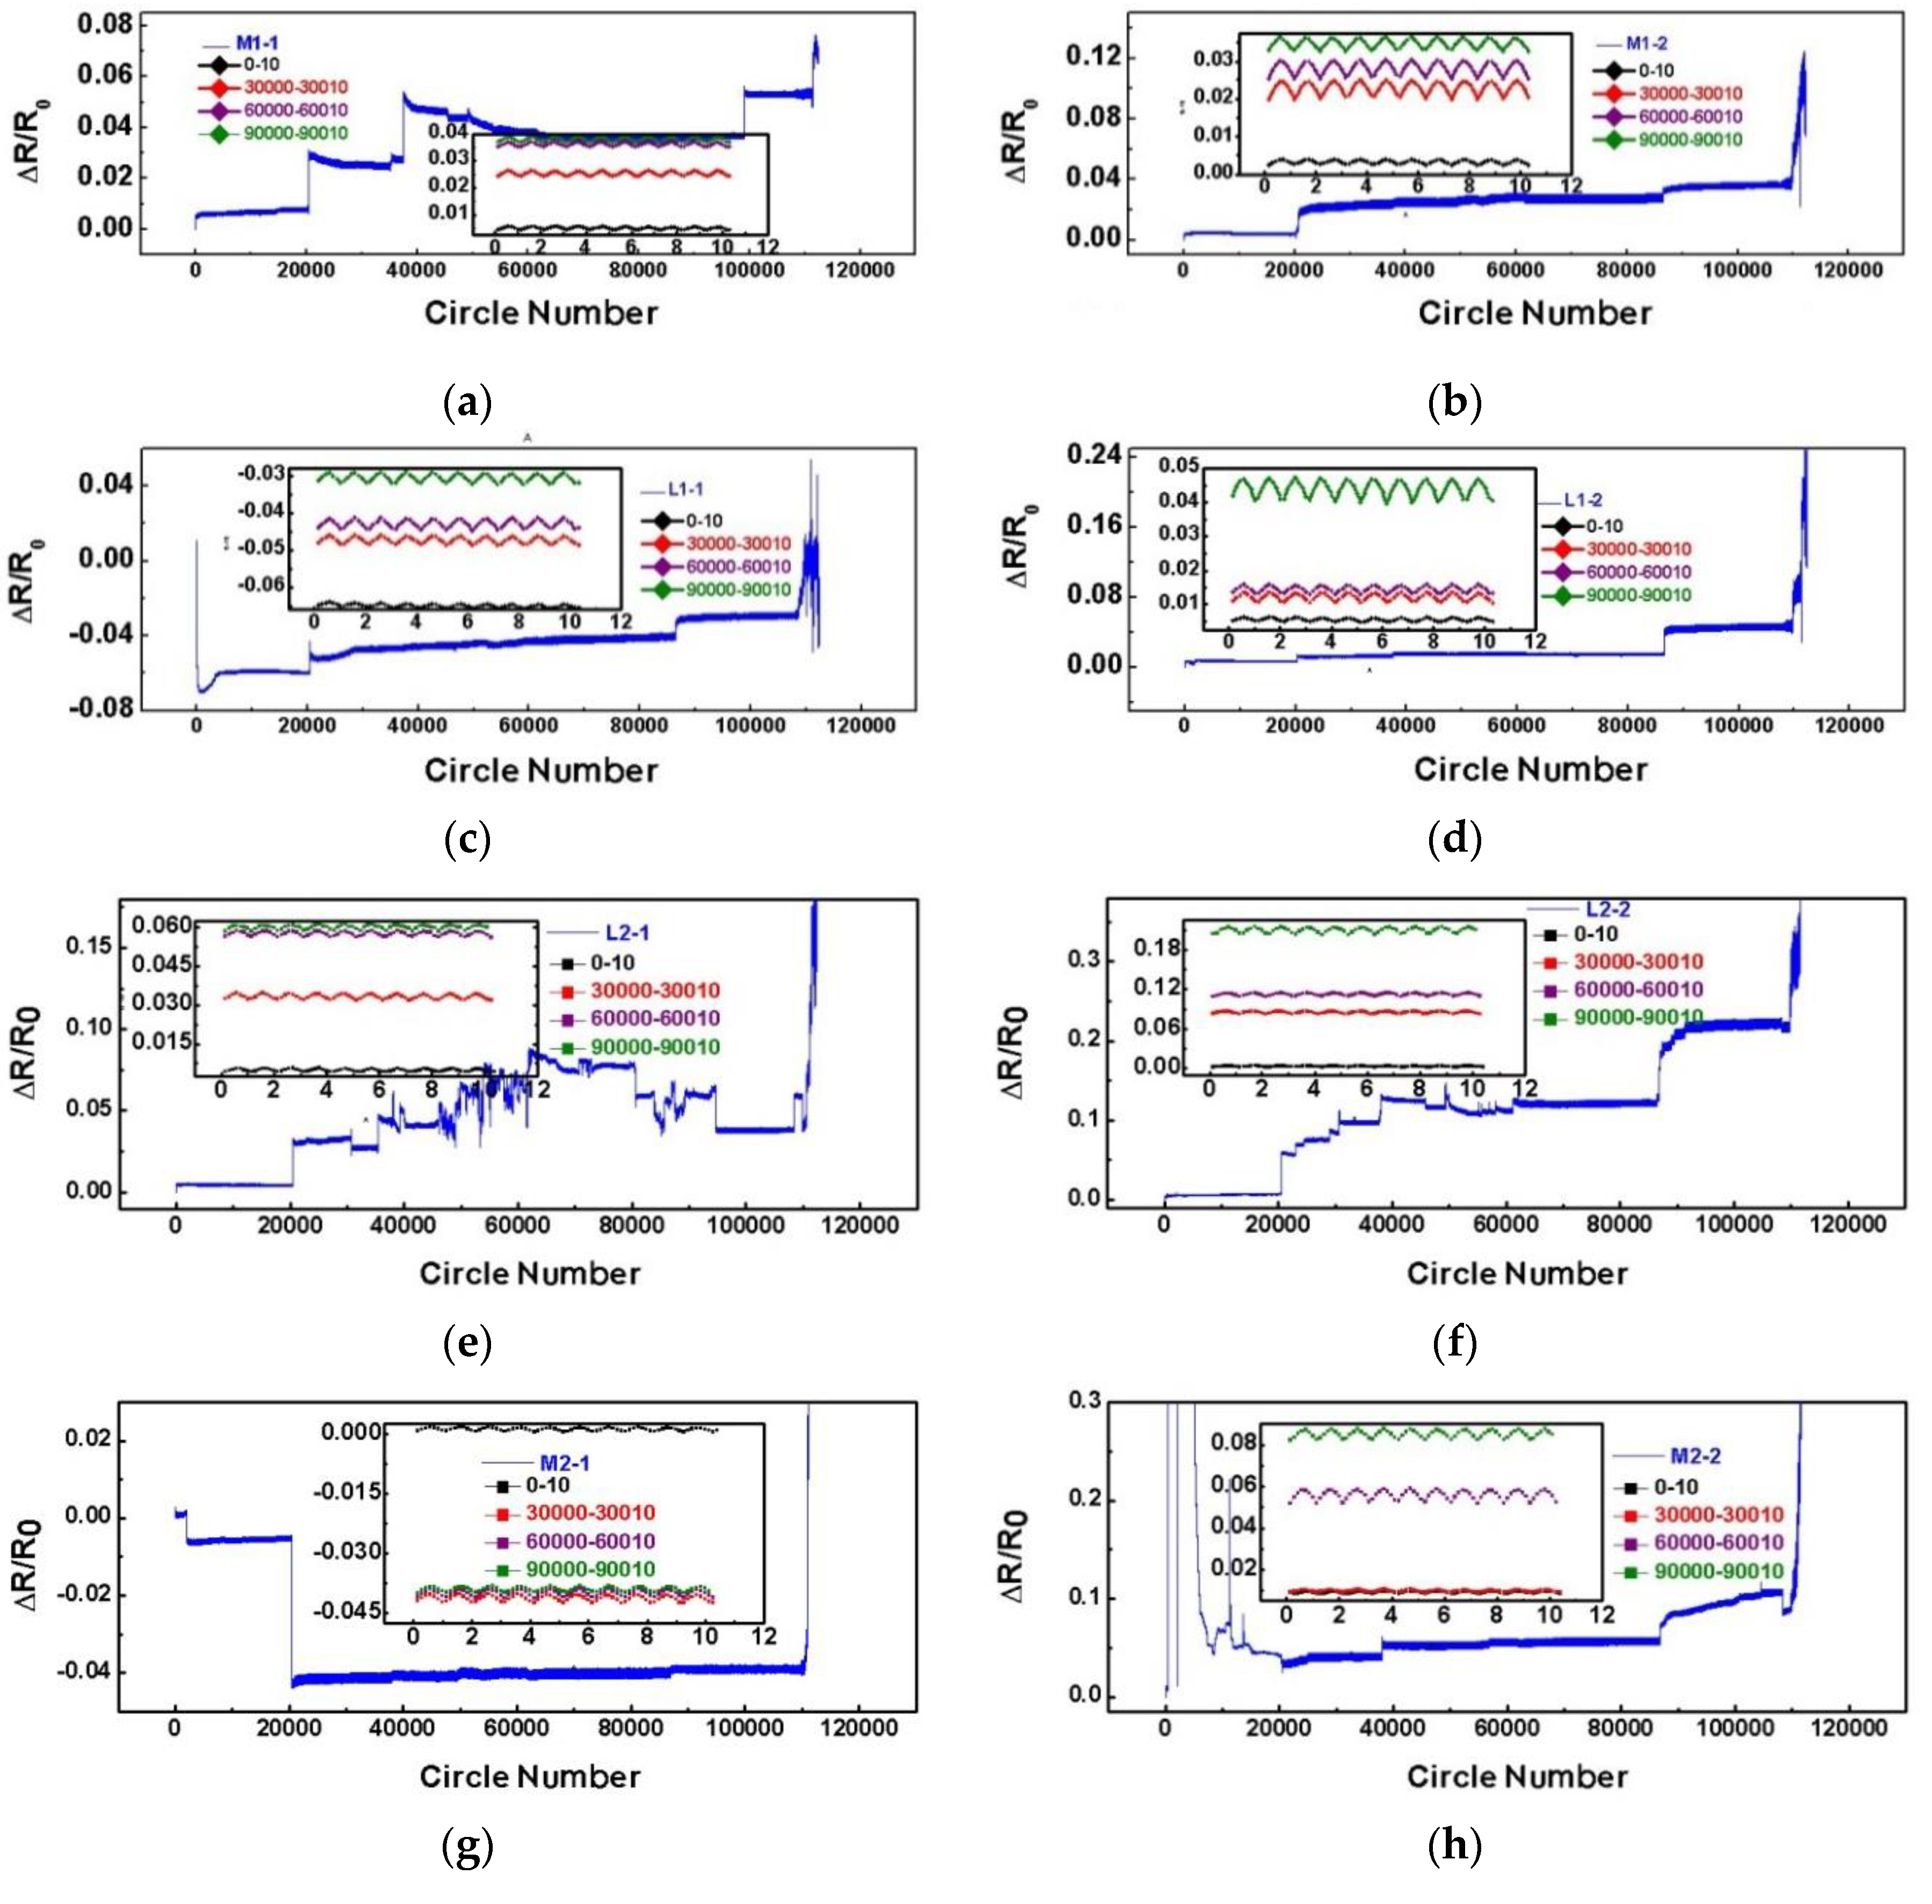
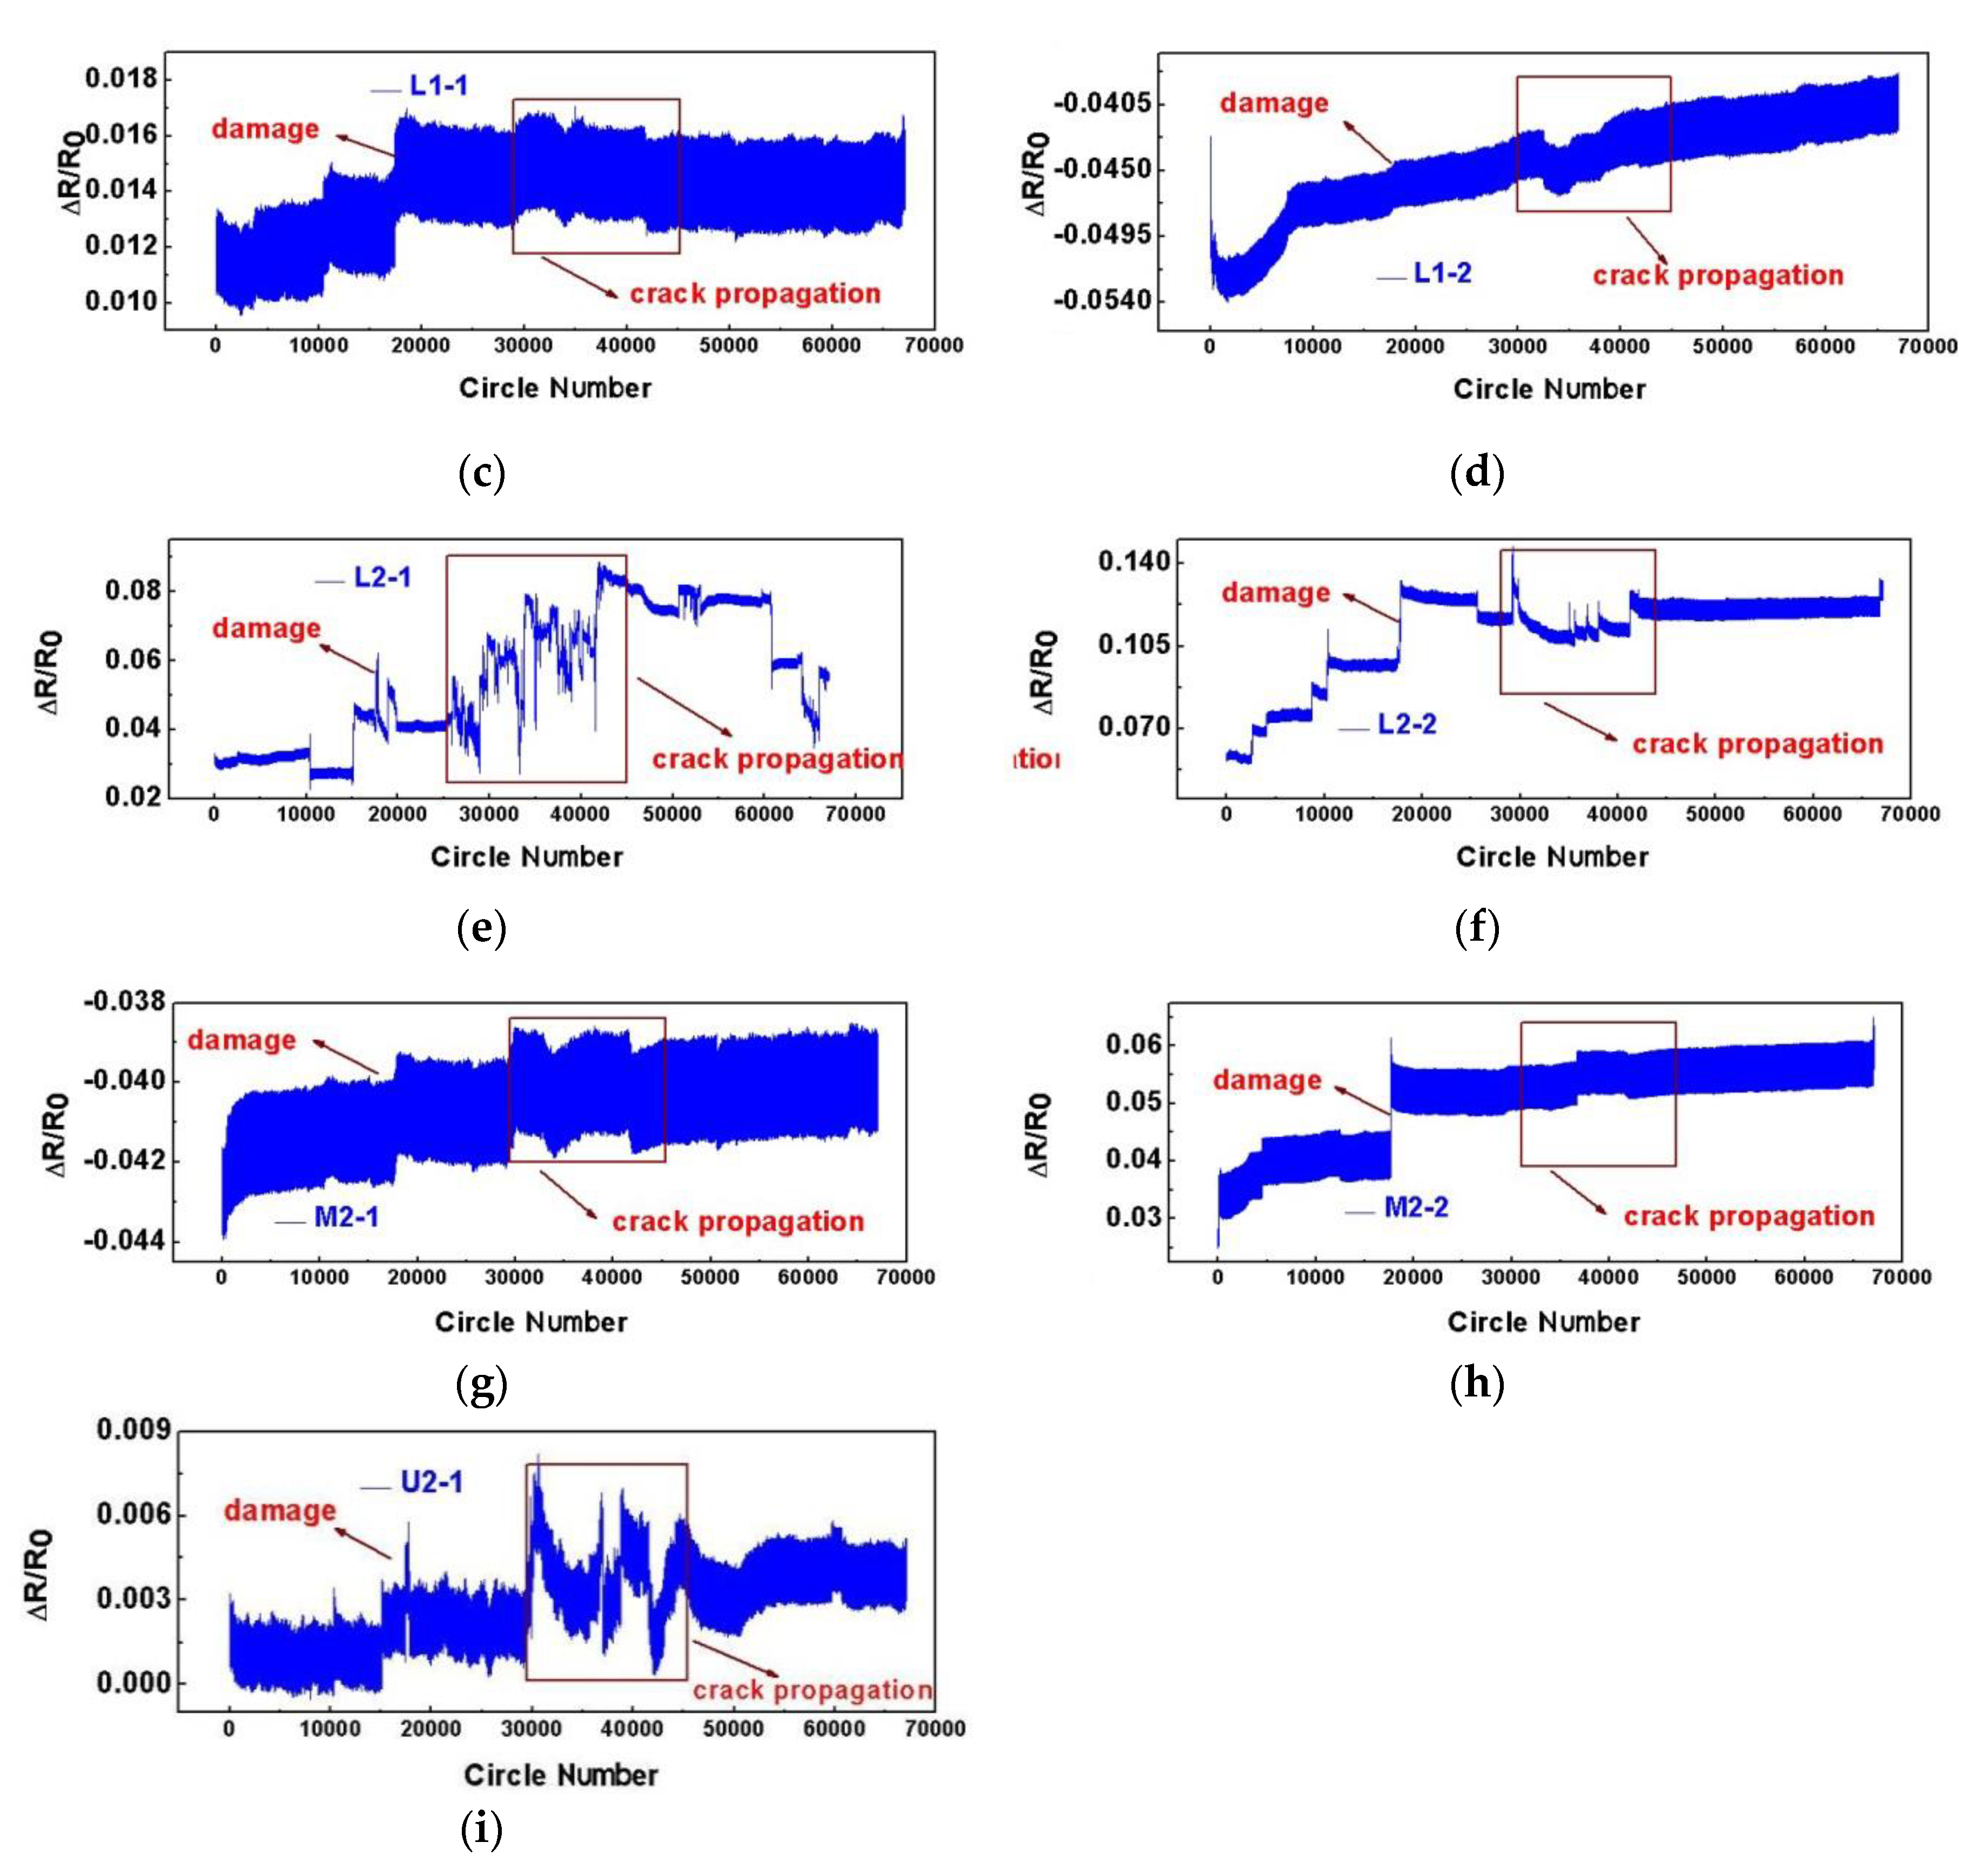
  • Figure 15 shows the response of the tensile–tensile fatigue test: with the increase of fatigue cycles, the resistance change rate of all sensors increased gradually. The damage of the whole specimen accumulated gradually during the fatigue test while the material properties of the whole structure were deteriorating. Figure 15 shows the tensile–tensile fatigue test of all effective sensors and the local magnification of the resistance change rates with cycles 0–10, 30,000–30,010, 60,000–60,010, and 90,000–90,010. The results showed that with the increase of the fatigue cycle, the resistance change rate of all sensors increased gradually. As can be seen from the local amplification diagram of each sensor, the resistance responses of the sensors arranged at different positions were completely different. With the increase of the cycle numbers, the increase rate of resistance change at different stages varied greatly. For example, the resistance of the M1-1 sensor changed rapidly for 0–60,000 cycles, while the resistance of L1-2 changed very gently. This indicated that the resistance response of the carbon nanotube buckypaper sensors was very sensitive to the damage changes around the stepped-lap joint surface. The sensors could accurately capture the damage severity degree at different stages.
  • During the whole fatigue cycle test, the response of the sensor could mainly represent four kinds of structural status of the specimen: the response of the sensor when the damage was derived, as shown in Figure 16a; the response of stiffness degradation when the damage was accumulated, as shown in Figure 16b,c; and the response of the initial crack and crack propagation, as shown in Figure 16d.
  • Figure 17 showed the response results of 60,000 fatigue tests with a 10–20 kN load. When the fatigue cycle of all the sensors reached about 18,000, the resistance response of all the sensors presented different degrees of steps. It indicated that the specimen suffered serious structural damage at this moment, which could affect the response of all the sensors on the specimen.
  • When the number of fatigue cycles of all sensors was at around 30,000–45,000 cycles, irregular fluctuations occurred, as shown in Figure 17. The crack was in the accelerated propagation during this time, and the L2-1 and L2-2 sensors fluctuated violently. This indicated that the crack was near the monitoring area of L2-1 and L2-2.
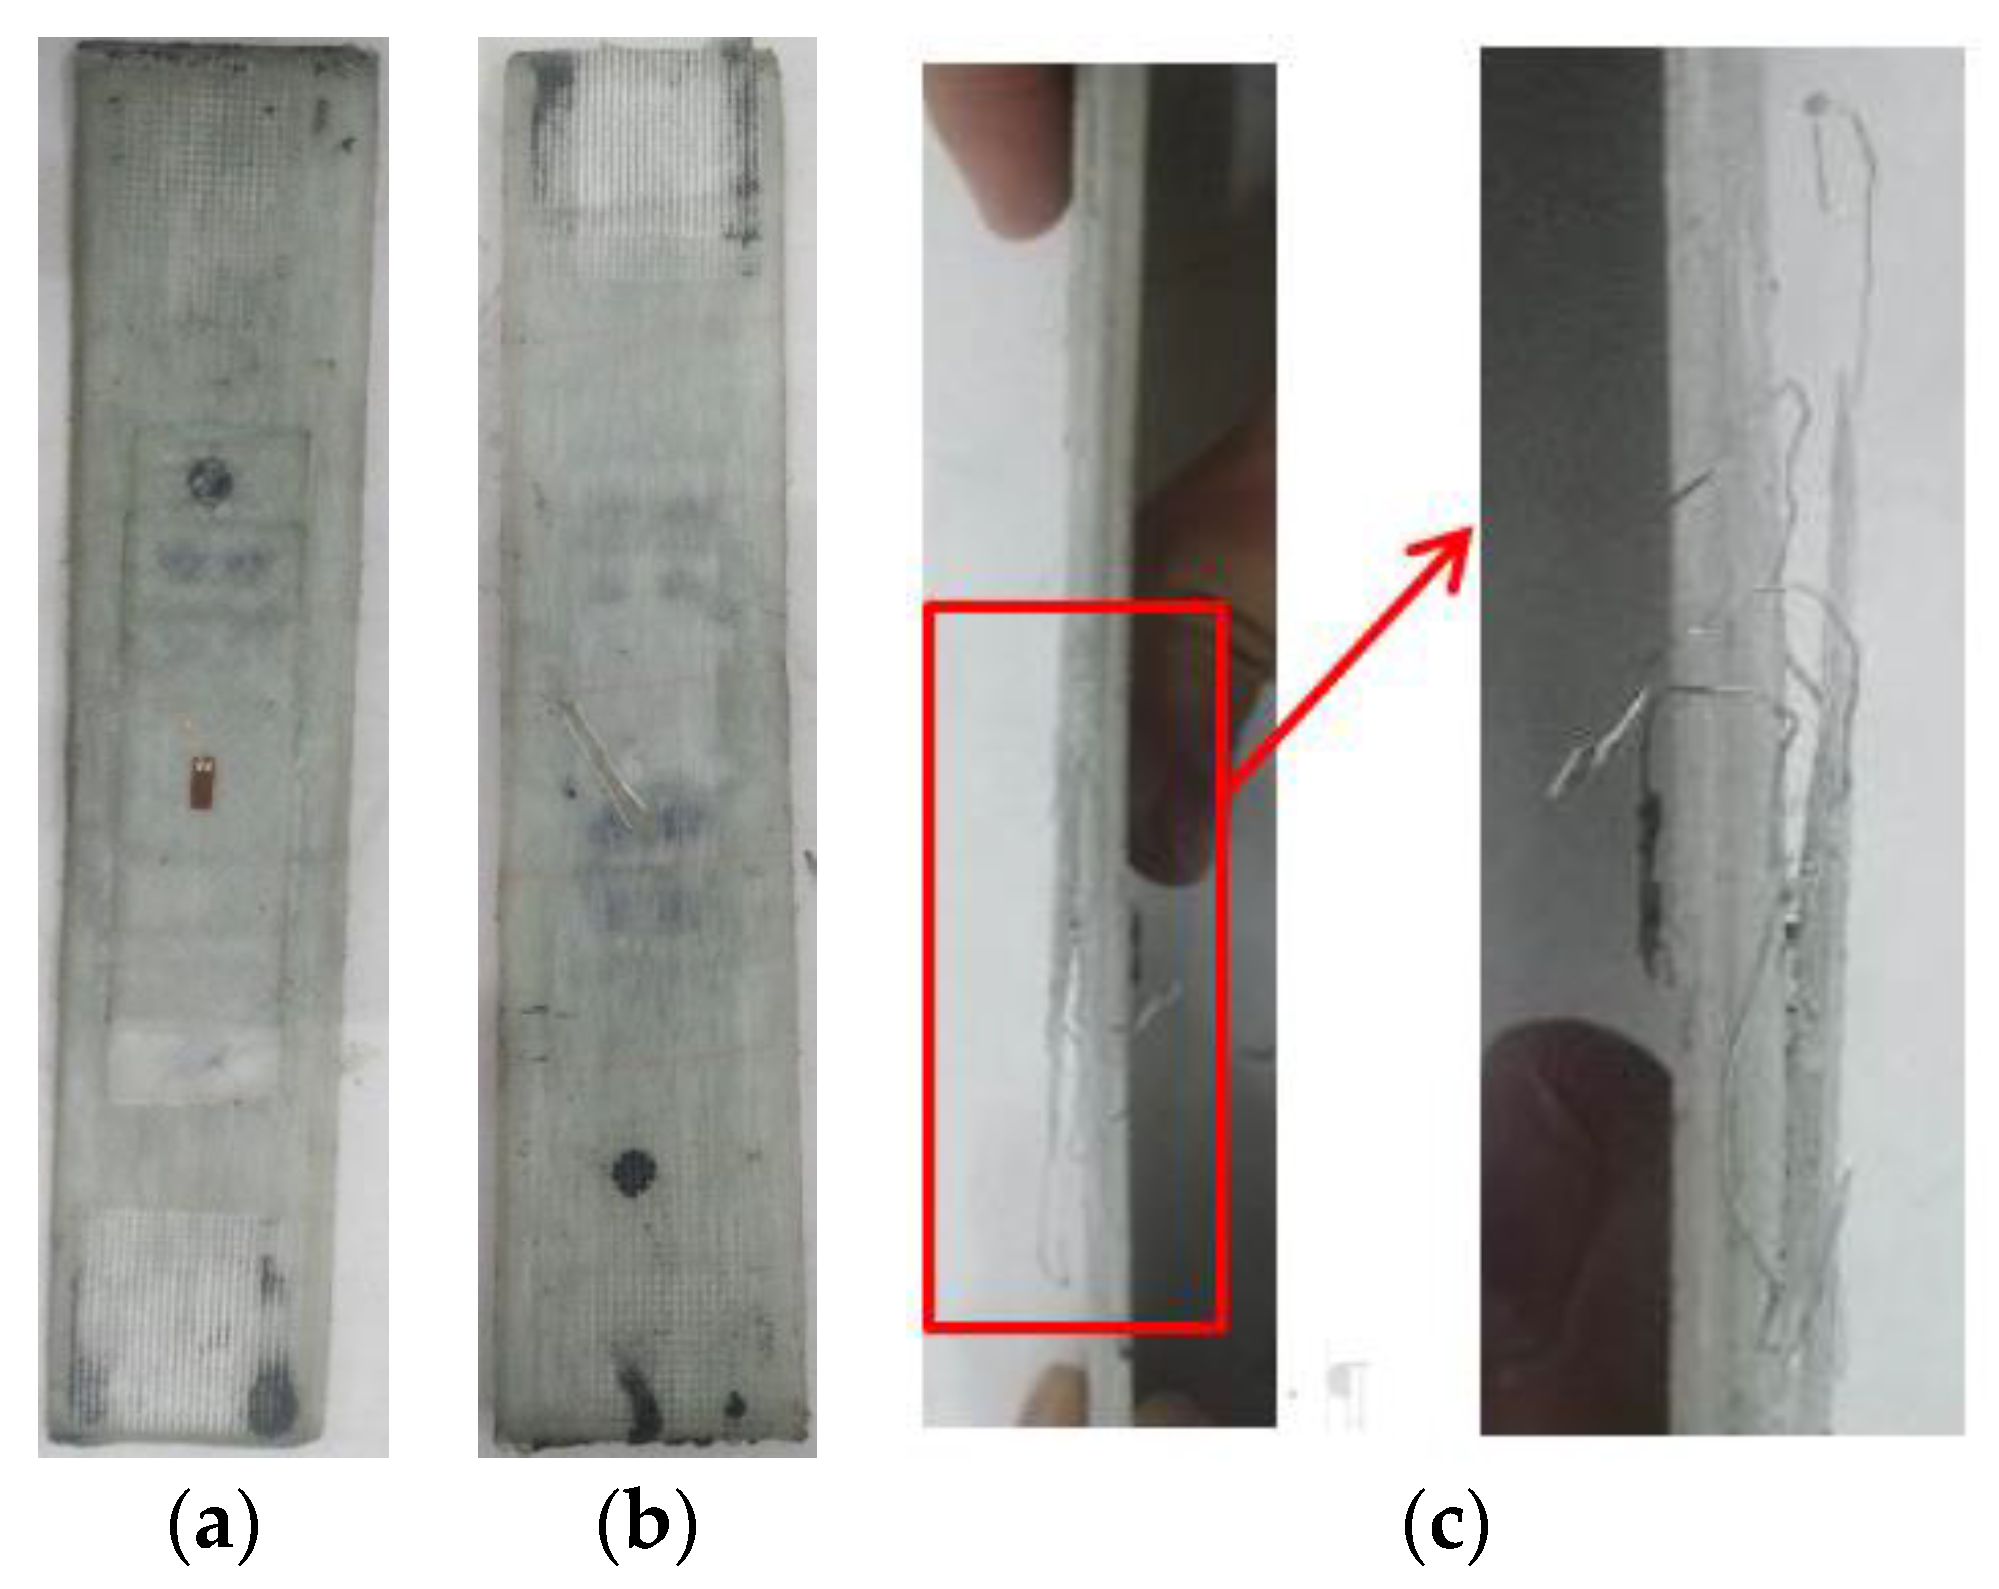
  • At each loading stage of the fatigue test, the change rate of the sensor residual resistance on the left side of the specimen was generally lower than that on the right side. Until fatigue failure, the change rate of the residual resistance of the sensor on the left reached 0.25 at most, while the sensor on the right failed completely. It could be inferred that the right sensor’s stepped-lap joint surface was completely delaminated. This was consistent with the development results after the failure of the fatigue specimen (Figure 18), which indicated that the carbon nanotube buckypaper sensor could accurately detect the progressive damage of the stepped-lap scarf joint repaired unidirectional tape specimen.

4.4.4. Analysis of the Tensile–Compressive Fatigue Test

The blade’s spar cap was subjected to alternating loads of tension and compression in the field. Therefore, the tensile and compressive fatigue load of −5 to 15 kN was conducted in this test. Under the tension–compression fatigue load, the test was carried out for less than 1800 cycles, and then the patch completely fell off, all the sensors failed, and resistance change rate tended to infinity. The response of the tension–compression fatigue is shown in Figure 19, where the local magnification of resistance change rates with the cycles 10–20, 600–610, 1200–1210, and 1720–1730 are shown as well. The resistance change rate of L2-2 and M2-2 both started to surge when at 900 cycles, but the resistance responses of L2-2 and M2-2 were different. As the number of cycles increased, the resistance change rate at different stages showed deviation. The response of the sensors on the stepped-lap joint surface fluctuated violently after 1200 cycles, which indicated that the buckling delamination damage rapidly accumulated and propagated. The sensors could successfully capture the damage.

5. Conclusions

According to the stepped-lap scarf joint repair for spar cap damage of a blade in service, two investigations were carried out in this study. The basic configuration test confirmed the sensitivity parameters of the spar cap stepped-lap scarf joint repair and the weak zone where damage was most likely to occur after the repair. The health monitoring test used carbon nanotube buckypaper sensors to monitor the failure of the stepped-lap joint surface. Under static and fatigue loads, the sensors could successfully capture the damage evolution and crack propagation signals. The experimental results provided an important parameter basis for evaluating the spar cap repair scheme and presented a promising method of health monitoring for spar cap after repair.
  • Three groups of test specimens with 64 different configuration parameters of stepped-lap scarf joint repair unidirectional tape were designed to carry out tensile tests. The results made clear the influence of the stepped-lap mode, stepped-lap joint surface number, and reinforcement layer on the failure load. The reinforcement layer could effectively improve the load-carrying capacity of the repair zone and it was confirmed that using N reinforcement layers to reinforce N stepped-lap joint surfaces could increase the failure load by 65–95% of the original value. This provided an important parameter basis of the repair scheme design for a spar cap with different damage degrees.
  • Under tension loading, the initial failure mode of the spar cap repaired using the stepped-lap scarf joint method was the delamination of the stepped-lap joint surface. The ultimate failure appeared as the shear failure of the adhesive layer on the stepped-lap joint surface and the coupling of the fiber fracture at the adhesively bonded joint. The stepped-lap joint surface was identified as the weak part of the spar cap repair and the healthy operation status of the surface should be monitored.
  • The quasi-static tensile test and fatigue test of the specimens that were repaired using the reinforcement layer of the double stepped-lap scarf joint method were carried out via embedding the carbon nanotube buckypaper sensors on the stepped-lap joint surface. The sensors successfully monitored the damage and crack propagation signals.
  • The quasi-static tensile test for health monitoring confirmed the failure processes: the stiffness turning point, damage evolution, crack propagation, and fracture. The results provided an important basis for monitoring the failure on the stepped-lap joint surface with carbon nanotube buckypaper sensors and verified that the shear failure of the adhesive layer on the stepped-lap joint surface was the main failure mode of the repaired structure.
  • The fatigue test of the health monitoring successfully captured the progressive failure: the initial damage, damage accumulation, initial crack, and crack propagation to structural failure. The resistance change rate of all sensors increased with the increase of the fatigue cycle. The carbon nanotube buckypaper sensors could accurately detect the progressive damage of the specimen repaired using a stepped-lap scarf joint method. The results provided an important basis for fault judgment when carbon nanotube buckypaper sensors were applied to the health monitoring of a spar cap after repair.
In this paper, the actual size of the spar cap with a large aspect ratio was considered in the basic configuration test, which provided important support for the numerical simulation analysis of the test model that followed. Although the health monitoring test is in the laboratory stage, this monitoring method can be applied to the spar cap repair of a blade in service in the field in the future, and a basis set of judgments for running a fault diagnosis on a blade can be formed as well.

Author Contributions

H.L. was responsible for the test design analysis and writing the paper, C.C. and L.W. checked the experimental results, and T.W. helped analyze the results. All authors have read and agreed to the published version of the manuscript.

Funding

This work was funded by the National Key R & D Program of China (grant no. 2019YFB1503701), National Nature Science Foundation of China (grant no. 51506089 and 51761165022), and the Priority Academic Program Development of Jiangsu Higher Education Institutions.

Conflicts of Interest

The authors declare no conflict of interest.

References

  1. Marsh, G. Meeting the challenge of wind turbine blade repair. Reinf. Plast. 2011, 4, 32–36. [Google Scholar] [CrossRef]
  2. Rajadurai, J.S.; Thanigaiyarasu, G. Structural analysis, failure prediction, and cost analysis of alternative material for composite turbine blades. Mech. Adv. Mater. Struct. 2009, 16, 467–487. [Google Scholar] [CrossRef]
  3. Jensen, F.M.; Puri, A.S.; Dear, J.P.; Branner, K.; Morris, A. Investigating the impact of non-linear geometrical effects on wind turbine blades-Part 1: Current status of design and test methods and future challenges in design optimization. Wind Eng. 2011, 14, 239–254. [Google Scholar] [CrossRef] [Green Version]
  4. Marin, J.C.; Barroso, A.; Paris, F.; Canas, J. Study of damage and repair of blades of a 300 kW wind turbine. Energy 2008, 33, 1068–1083. [Google Scholar] [CrossRef]
  5. Dai, J.C.; Yang, X.; Wen, L. Development of wind power industry in China: A comprehensive assessment. Renew. Sustain. Energy Rev. 2018, 97, 156–164. [Google Scholar] [CrossRef]
  6. Chawla, T.S.; Cavalli, M.N. Mechanical evaluation of repair resins for fiber-glass wind turbine blades. J. Compos. Mater. 2015, 49, 1115–1125. [Google Scholar] [CrossRef]
  7. Shohag, M.A.; Hamme, E.C.; Olawale, D.O.; Okoli, O. Damage mitigation techniques in wind turbine blades: A review. Wind Eng. 2017, 41, 185–210. [Google Scholar] [CrossRef]
  8. Lekou, D.J.; Vionis, P. Report on Repair Techniques for composite parts of Wind Turbine blades. Optimat Blades 2002, 1–15. [Google Scholar]
  9. STANDARD. DNV-GL-0376. Rotor blades for wind turbines. Available online: https://rules.dnvgl.com/docs/pdf/DNVGL/ST/2015-12/DNVGL-ST-0376.pdf (accessed on 1 December 2015).
  10. Chen, X.; Qin, Z.W.; Yang, K.; Zhao, X.L.; Xu, J.Z. Numerical analysis and experimental investigation of wind turbine blades with innovative features: Structural response and characteristics. Sci. China Technol. Sci. 2015, 58, 1–8. [Google Scholar] [CrossRef]
  11. Zhu, J.; Cai, X.; Pan, P.; Gu, R.G. Optimization design of spar cap layup for wind turbine blade. Front. Struct. Civ. Eng. 2012, 6, 53–56. [Google Scholar] [CrossRef]
  12. Liao, C.C.; Zhao, X.L.; Wang, J.L.; Shi, K.Z. Optimization design of the frequency based on wind turbine blade layers. J. Eng. Thermophys. 2011, 32, 1311–1314. [Google Scholar]
  13. Riddle, T.W.; Cairns, D.S.; Nelson, J.W. Characterization of Manufacturing Defects Common to Composite Wind Turbine Blades: Flaw Characterization. In Proceedings of the 52nd AIAA/ASME/ASCE/AHS/ASC Structures, Structural Dynamics and Materials Conference, Denver, CO, USA, 4–7 April 2011. [Google Scholar] [CrossRef]
  14. Nelson, J.W.; Cairns, D.S.; Riddle, T.W. Manufacturing Defects Common to Composite Wind Turbine Blades: Effects of Defects. In Proceedings of the 52nd AIAA/ASME/ASCE/AHS/ASC Structures, Structural Dynamics and Materials Conference, Denver, CO, USA, 4–7 April 2011. [Google Scholar] [CrossRef]
  15. Yang, J.S.; Peng, C.Y.; Xiao, J.Y.; Zeng, J.C. Structural investigation of composite wind turbine blade considering structural collapse in full-scale static tests. Compos. Struct. 2013, 97, 15–29. [Google Scholar] [CrossRef]
  16. Overgaard, L.C.T.; Lund, E. Structural collapse of a wind turbine blade. Part B Progressive interlaminar failure models. Composites Part A: Appl. Sci. Manuf. 2010, 41, 271–283. [Google Scholar] [CrossRef]
  17. Toft, H.S.; Branner, K.; Berring, P.; Sørensen, J.D. Defect distribution and reliability assessment of wind turbine blades. Eng. Struct. 2011, 33, 171–180. [Google Scholar] [CrossRef]
  18. Chen, X.; Zhao, W.; Zhao, X.L.; Xu, J.Z. Preliminary failure investigation of a 52.3 m glass/epoxy composite wind turbine blade. Eng. Fail. Anal. 2014, 44, 345–350. [Google Scholar] [CrossRef]
  19. Chou, J.S.; Chiu, C.K.; Huang, I.K.; Chi, K.N. Failure analysis of wind turbine blade under critical wind loads. Eng. Fail. Anal. 2013, 27, 99–118. [Google Scholar] [CrossRef]
  20. Katnam, K.B.; Comer, A.J.; Roy, D.; Da Silva, L.F.M.; Young, T.M. Composite Repair in Wind Turbine Blades: An Overview. J. Adhes. 2015, 91, 113–139. [Google Scholar] [CrossRef]
  21. Chen, X.; Xu, J.Z. Structural failure analysis of wind turbines impacted by super typhoon Usagi. Eng. Fail. Anal. 2016, 60, 391–404. [Google Scholar] [CrossRef]
  22. Halliwell, S. Repair of Fibre Rinforced Polymer Structures. National Composites Network Best Practice Guide; National Composites Network: Chesterfield, UK, 2006. [Google Scholar]
  23. Liu, W.X. The Method of Analysis for Vacuum-assisted Wet-layup Flush Repaired Composite Laminates. Ph.D. Thesis, Nanjing University of Aeronautics and Astronautics, Nanjing, China, 2013. [Google Scholar]
  24. Kong, J.Y.; Yan, D.X. Bond repair process for composites structure and influencing factor. Manuf. Maint. 2013, 443, 114–117. [Google Scholar]
  25. Wegman, R.F.; Tullos, T.R. Handbook of Adhesive Bonded Structural Repair; Noyes: Park Ridge, NJ, USA, 1992. [Google Scholar]
  26. Chen, S.S. Composite Structure Repair Guide; Aviation Industry Press: Beijing, China, 2001. [Google Scholar]
  27. Zhang, J.; Cheng, X.; Hu, R.; Bao, J. Tensile and Compressive Properties of Scarf-Repaired Composite Laminates. Polym. Mater. Sci. Eng. 2018, 34, 178–183. [Google Scholar]
  28. Masmanidis, I.T.; Philippidis, T.P. Modeling the progressive failure of scarf joint for wind turbine blade repair. J. Compos. Mater. 2018, 52, 2243–2254. [Google Scholar] [CrossRef]
  29. Campilho, R.D.S.G.; De Moura, M.F.S.F.; Pinto, A.M.G.; Morais, J.J.L.; Domingues, J.J.M.S. Modelling the tensile fracture behavior of CFRP scarf repairs. Compos. Part B: Eng. 2009, 40, 149–157. [Google Scholar] [CrossRef]
  30. Liao, L.J.; Huang, C.G.; Sawa, T. Effect of adhesive thickness adhesive type and scarf angle on the mechanical properties of scarf adhesive joint. Int. J. Solids Struct. 2013, 50, 4333–4340. [Google Scholar] [CrossRef] [Green Version]
  31. Goh, J.Y.; Georgiadis, S.; Orifici, A.C.; Wang, C.H. Effects of bondline flaws on the damage tolerance of composite scarf joints. Compos. Part A: Appl. Sci. Manuf. 2013, 55, 110–119. [Google Scholar] [CrossRef] [Green Version]
  32. Baig, Y.; Cheng, X.Q.; Hasham, H.J.; Abbas, M. Failure mechanisms of scarf-repaired composite laminates under tensile load. J. Braz. Soc. Mech. Sci. Eng. 2016, 38, 2069–2075. [Google Scholar] [CrossRef]
  33. Wang, S.; Xie, Z.; Li, X. Experimental study of composite laminate adhesively tapered-scarf repair. J. Harbin Inst. Technol. 2017, 49, 56–61. [Google Scholar]
  34. Feng, W.; Xu, F.; Yuan, J.L.; Zang, Y.Y.; Zhang, X.Y. Focusing on in-service repair to composite laminates of different thicknesses via scarf-repaired method. Compos. Struct. 2019, 207, 826–835. [Google Scholar] [CrossRef]
  35. Truong, V.H.; Yoo, J.S.; Kim, C.H.; Park, M.Y.; Choi, J.H.; Kweon, J.H. Failure load prediction of laminates repaired with a scarf-bonded patch using the damage zone method. Adv. Compos. Mater. 2017, 26, 115–133. [Google Scholar] [CrossRef]
  36. Ichikawa, K.I.; Shin, Y.; Sawa, T. A three-dimensional finite-element stress analysis and strength evaluation of stepped-lap adhesive joint subjected to static tensile loadings. Int. J. Adhes. Adhes. 2008, 28, 464–470. [Google Scholar] [CrossRef]
  37. Wu, C.; Chen, C.; Yan, W.Y. Comparison on damage tolerance of scarf and stepped-lap bonded composite joint under quasi-static loading. Compos. Part B: Eng. 2018, 155, 19–30. [Google Scholar] [CrossRef]
  38. Campilho, R.D.S.G.; De Moura, M.F.S.F.; Domingue, J.J.M.S. Stress and failure analyses of scarf repaired CFRP laminates using a cohesive damage mode. J. Adhes. Sci. Technol. 2007, 21, 855–870. [Google Scholar] [CrossRef]
  39. Jones, R.; Peng, D.; Michopoulos, J.G.; Phan, N.; Berto, F. On the analysis of bonded step lap joints. Theor. Appl. Fract. Mech. 2018, 97, 457–466. [Google Scholar] [CrossRef]
  40. Kimiaeifar, A.; Lund, E.; Thomsen, O.L.; Sørensen, J.D. Asymptotic Sampling for reliability analysis of adhesive bonded stepped lap composite joint. Eng. Struct. 2013, 49, 655–663. [Google Scholar] [CrossRef]
  41. Beylergil, B.; Aktas, A.; Cunedioglu, Y. Buckling and compressive failure of stepped-lap joint repaired with composite patch. J. Compos. Mater. 2012, 46, 3213–3230. [Google Scholar] [CrossRef]
  42. Mishnaevsky, L. Repair of wind turbine blades: Review of methods and related computational mechanics problems. Renew. Energy 2019, 140, 828–839. [Google Scholar] [CrossRef]
  43. Lu, S.W.; Zhao, C.X.; Zhang, L.; Chen, D. Real time monitoring of the curing degree and the manufacturing process of fiber reinforced composites with a carbon nanotube buckypaper sensor. RSC Adv. 2018, 39, 22078–22085. [Google Scholar] [CrossRef] [Green Version]
  44. Lu, S.W.; Chen, D.; Wang, X.Q.; Shao, J.Y.; Ma, K.M.; Zhang, L.; Araby, S.; Meng, Q.S. Real-time cure behaviour monitoring of polymer composites using a highly flexible and sensitive CNT buckypaper sensor. Compos. Sci. Technol. 2017, 152, 181–189. [Google Scholar] [CrossRef]
  45. Xu, T.; Qiu, Q.D.; Lu, S.W.; Ma, K.M.; Wang, X.Q. Multi-direction health monitoring with carbon nanotube film strain sensor. Int. J. Distrib. Sens. Netw. 2019, 15. [Google Scholar] [CrossRef] [Green Version]
  46. Huo, Q.S.; Jin, J.Q.; Lu, S.W.; Zhang, L.; Ma, K.M.; Wang, X.Q. Self-sensing properties of bending deformation of buckypaper composites. Mater. Res. Express 2019, 6. [Google Scholar] [CrossRef]
  47. Webber, J.P.H. Scarf Repair Joints in Carbon Fibre Reinforced Plastic Strips. J. Adhes. 1981, 12, 257–281. [Google Scholar] [CrossRef]
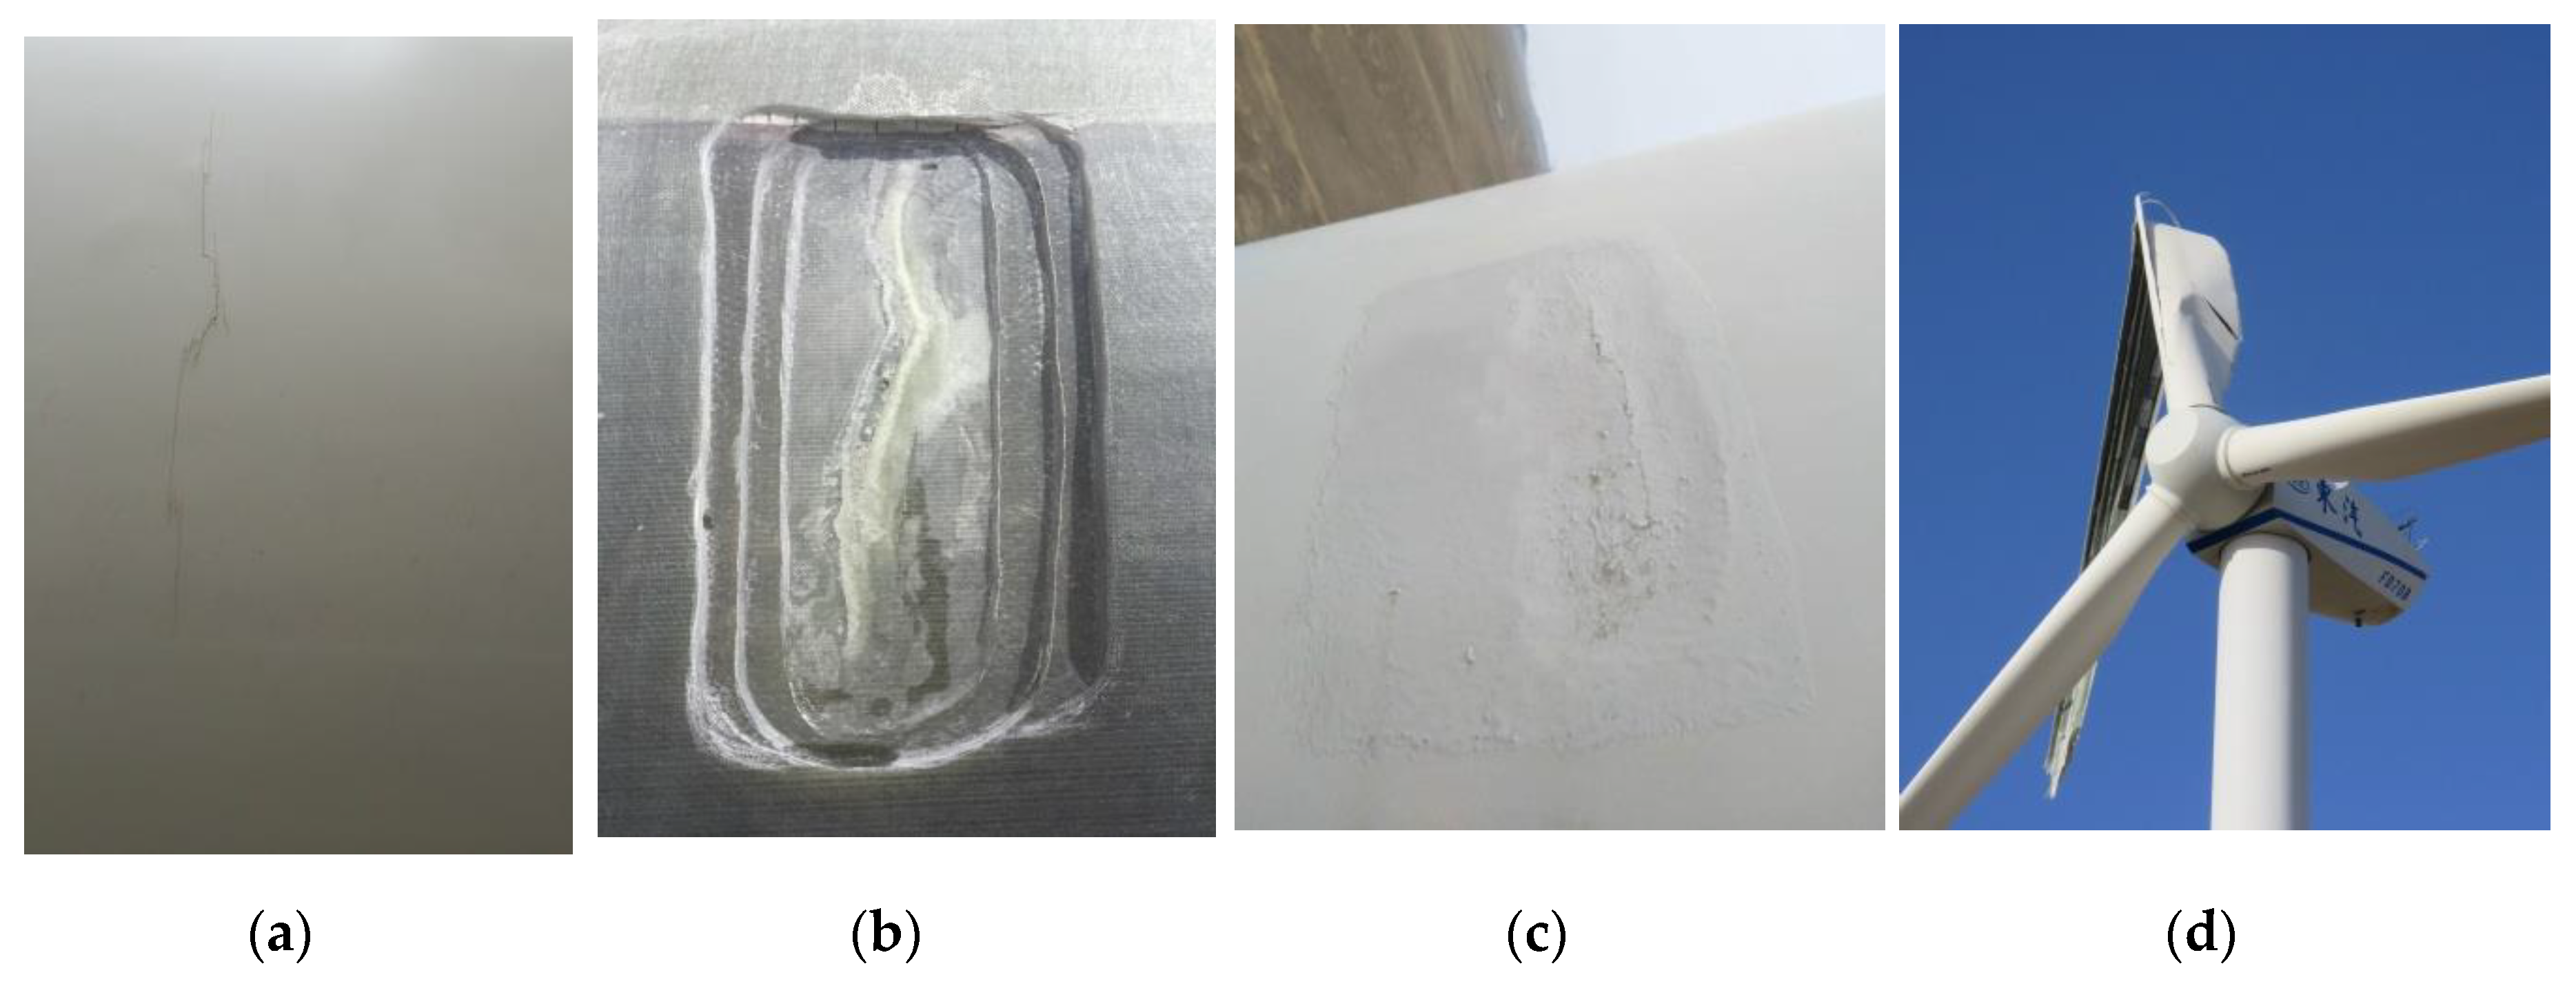
Figure 1. Spar cap damage of a blade in service: (a) crack in the spar cap zone, (b) serious damage, (c) new crack after repair, and (d) blade fracture.
Applsci 10 00922 g001
Figure 2. Repair method: (a) patch repair, (b) scarf repair, (c) tapered scarf repair, and (d) stepped-lap scarf repair.
Applsci 10 00922 g002
Figure 3. Stepped-lap scarf joint repair: (a) single stepped lap, (b) double stepped lap, and (c) description of a double stepped-lap scarf joint repair.
Applsci 10 00922 g003
Figure 4. Stepped-lap scarf joint repair theoretical model.
Applsci 10 00922 g004
Figure 5. Test specimens design and cured: (a) the configuration of the stepped-lap scarf joint repaired specimens, and (b) test samples.
Applsci 10 00922 g005
Figure 6. Tensile stress–strain curves of the W1-K and W1-D specimens.
Applsci 10 00922 g006
Figure 7. The failure position and failure mode: (a) tensile failure damage of one stepped-lap joint surface of effective sample 1, (b) tensile failure damage of three stepped-lap joint surface sample, (c) tensile failure damage of one stepped-lap joint surface of effective sample 2, (d) the top view of the stepped-lap joint surface, (e) tensile failure damage of one stepped-lap joint surface of effective sample 3, and (f) the side view of the stepped-lap joint surface.
Applsci 10 00922 g007
Figure 8. Displacement–strain curve of the parent structure, stepped-lap joint surface, and patch.
Applsci 10 00922 g008
Figure 9. Specimen size and sensor arrangement.
Applsci 10 00922 g009
Figure 10. Specimen preparation process: (a) parent structure, (b) carbon nanotube buckypaper sensor locations, and (c) curing.
Applsci 10 00922 g010
Figure 11. Mechanical test equipment:(a) universal testing machine GOTECH AL-7000-LA20 and (b) electro-hydraulic servo fatigue testing machine MTS Landmark.
Applsci 10 00922 g011
Figure 12. Response of the sensors on each stepped-lap joint surface of the quasi-static tensile test: (a) sensor 1 resistance response (∆R is change in resistance for time increments, R0 is original resistance and ∆R/R0 is resistance change rate), (b) sensor 2 resistance response, (c) sensor 3 resistance response, and (d) three sensors’ damage time.
Applsci 10 00922 g012
Figure 13. Data distribution of the load-and-unload test.
Applsci 10 00922 g013
Figure 14. Failure specimen of the quasi-static tensile test: (a) face, (b) back, and (c) side.
Applsci 10 00922 g014
Figure 15. Response of the effective sensors of the tensile-tensile fatigue test: (a) resistance response of sensor M1-1, (b) resistance response of sensor M1-2, (c) resistance response of sensor L1-1, (d) resistance response of sensor L1-2, (e) resistance response of sensor L2-1, (f) resistance response of sensor L2-2, (g) resistance response of sensor M2-1, (h) resistance response of sensor M2-2, and (i) resistance response of sensor U2-1.
Applsci 10 00922 g015aApplsci 10 00922 g015b
Figure 16. Damage process of the fatigue test: (a) initial damage, (b,c) damage accumulation, and (d) crack propagation.
Applsci 10 00922 g016
Figure 17. Response of the 60,000 fatigue cycles of all effective sensors with loads at 10–20 kN: (a) resistance response of sensor M1-1, (b) resistance response of sensor M1-2, (c) resistance response of sensor L1-1, (d) resistance response of sensor L1-2, (e) resistance response of sensor L2-1, (f) resistance response of sensor L2-2, (g) resistance response of sensor M2-1, (h) resistance response of sensor M2-2, and (i) resistance response of sensor U2-1.
Applsci 10 00922 g017aApplsci 10 00922 g017b
Figure 18. Specimen development of tensile–tensile fatigue failure: (a) face, (b) back, and (c) side.
Applsci 10 00922 g018
Figure 19. Responses of tension–compression fatigue: (a) resistance response of sensor L2-2 and (b) resistance response of sensor M2-2.
Applsci 10 00922 g019
Table 1. The designed configuration parameters of the test specimens.
Specimen NumberLength
(mm)
Width
(mm)
Stepped-Lap ModeStepped-Lap Width
(mm)
Number of Stepped-Lap Joint SurfacesReinforcement LayerEffective Sample Quantity
W1-A60050Double803None4
W1-B60050NoneNoneNoneNone4
W1-C60050Single803None3
W1-D52050Double1002None4
W1-E52050Single1002None4
W1-F52050NoneNoneNoneNone2
W1-G32025Single1001None4
W1-H32025NoneNoneNoneNone3
W1-I32025Double1001None3
W1-J30025NoneNoneNoneNone3
W1-K30025NoneNoneNoneNone3
W2-A42050Single1001One side, one layer reinforced4
W2-B42050Single1001One layer reinforced for each side4
W2-C60050Single1001One side, two layers reinforced4
W2-D52050Double1001One side, two layers reinforced3
W2-F62050Double1001One side, two layers reinforced4
W3-A62050Single1002One layer, reinforced for each side4
W3-B62050Single1002One layer reinforced on one side, and two layers on the other side4
Table 2. The tensile test results of the three groups of specimens.
Serial NumberWidth
(mm)
Thickness
(mm)
Tensile Strength
(MPa)
Tensile Strain
(%)
Failure Load
(kN)
Load per
Width
(kN/mm)
Load
Loss Rate
(%)
W1-A48.13.2465.41.571.61.49 26
W1-B48.13.0553.81.677.12.02 -
W1-C48.63.1491.01.673.81.52 25
W1-D49.22.1506.51.553.01.08 27
W1-E48.12.4466.51.454.71.14 23
W1-F48.71.6780.81.961.41.48 -
W1-G23.91.5364.40.813.30.56 31
W1-H24.80.81013.81.220.10.81 -
W1-I23.61.7318.60.912.60.54 34
W1-J23.55.5528.91.367.82.88 -
W1-K23.26.1469.51.466.22.85 -
W2-A49.92.6370.21.347.40.95-
W2-B48.63.7299.21.253.91.10-
W2-C48.43.5347.81.758.11.20 -
W2-D48.32.5420.30.351.21.06 -
W2-F49.93.2317.82.050.51.01 -
W3-A48.35.2363.80.290.61.88 -
W3-B49.44.3445.00.395.1 -