Abstract
Thermal energy storage (TES) systems are key components for concentrated solar power plants to improve their dispatchability and for shifting the energy production efficiently to high revenue periods. The commercial state of the art is the molten salt two tank storage technology. However, this TES confronts some issues like freezing and decomposition, which require continued technical attention. Furthermore, the molten salt itself is very expensive compared to other storage materials. A TES option that possesses a high cost reduction potential and the ability to increase the whole power plant efficiency is the regenerator-type energy storage. Here, a packed bed inventory of waste metallurgical slag from electric arc furnace (EAF) can achieve further cost reduction. Despite previous studies regarding the use of steelmaking slag as an inventory material for thermal energy storages, there are still basic questions to be answered. This work presents experimental thermal performance and thermo-structural stability studies of slag-based TES, obtained during the European project REslag. The EAF slag and different insulation options were tested for their thermomechanical strength in a uniaxial compression test rig. The thermal cyclic behavior was investigated in a pilot TES plant with temperatures up to 700 °C. The experimental results confirm the suitability of steelmaking slag as thermal energy storage inventory material. Furthermore, a comparison of experimental and simulation model results shows an agreement of over 90%.
1. Introduction
A concentrated solar power (CSP) tower converts the sun’s light energy into heat and electricity. Sun tracing mirrors are used to focus the sunlight onto a receiver located on the top of a tower. There, the solar energy is used to heat up a heat transfer fluid (HTF). This fluid serves to generate high-temperature steam in a steam boiler, to drive a turbine which is connected to an electrical power generator.
The power generation is related to the availability of the sun. To increase the independence of CSP systems, thermal energy storage (TES) systems are used. Those systems are able to mitigate short load fluctuations during transient weather conditions, can shift the generation period to peak hours of demand and can extend the energy supply when the sun is not available. Different suitable TES technologies exist. The most common technology is the sensible heat storage. One representative is the two-tank molten salt thermal energy storage, which is extensively deployed and currently the state of the art [1].
The storage medium—molten salt—itself comprises commonly of sodium nitrate and potassium nitrate. Due to its specific properties, the operating temperature range is limited. Freezing and decomposition of the salt must be prevented. For the commonly used “solar salt”, this means that its temperature must not fall below the melting point of 220 °C and must not exceed the maximum temperature of about 585 °C. Extensive research has been carried out and is still ongoing to lower the minimum temperature limit and increase the upper temperature limit. This is due to the fact that higher operating temperatures increase the overall solar-to-electricity efficiency, and lower melting points will reduce the additional heating power. In addition, the TES volume and levelized cost of electricity could be reduced [2,3].
One promising TES option without the mentioned drawbacks is the regenerator type TES system with a solid inventory and air as HTF. Its prospects are the potential for higher efficiency and lower costs due to the free available, non-toxic heat transfer fluid (air) and the single-tank setup [4,5]. However, this system results, due to the thermal properties of air, lower volumetric heat capacity and thermal conductivity compared to molten salt, in higher pressure drops and a larger storage tank size [6,7]. Despite those drawbacks, the regenerator type storage is especially suitable for solar receivers with gaseous working fluids.
Many studies on TES for CSP with air as HTF are already available from literature [2,7,8,9,10,11]. However, most of the research work in this area is on the development of numerical models and only a few focus on experimental investigations and pilot plants [6,12,13,14]. Due to the high operating temperatures of up to 1300 °C, one key point of many research projects is the inventory material of regenerator-type storages. Commonly used materials are bricks or packed beds of particles made of oxide ceramic [15]. To reduce the inventory costs, recent works have focused on the investigation of new inventory materials like low-temperature fired clay bricks and magmatic natural stones [16,17,18,19]. Due to its classification as waste, slag from electric arc furnace (EAF) has a high potential for further cost reduction. The thermo-chemical stability and thermo-physical properties of EAF slag were investigated by Calvet et al. [20]. The European project REslag investigates the use of a slag pebble inventory in regenerator-based TES systems further [21]. Within this project, Krüger et al. [22,23] already presented the basic work of lead design identification and the investigation of material and thermomechanical aspects. First performance studies as well as experimental results are given by Haunstetter et al. in [24].
However, there are still open questions regarding the thermal performance and thermo-structural stability of the slag pebble inventory under cyclic temperature load. This is due to the fact, that the inventory undergoes thermal expansion and shrinkage during thermal charging and discharging. This causes increased forces within the inventory and can lead to structural failure. Therefore, to investigate the slag behavior further, the present article deals with experimental thermal performance and thermo-structural stability studies of slag as an inventory material for TES using air as HTF. Therefore, a thermal simulation model is set up and validated with experimental results. Furthermore, thermomechanical and thermal investigations of the slag and TES insulation are performed by using a uniaxial compression test rig and a pilot TES plant.
2. Slag Based TES Design
For a better impression, Figure 1 shows a schematic flow sheet of a CSP plant with slag as TES inventory material. The TES design consideration, the comparative assessment and the lead design selection are described in detail by Krüger et al. [22]. The CSP plant target specifications and lead concept specifications are already introduced in [24]. Therefore, subsequently only a short overview of the lead design selection process is given, and the TES properties required for the investigations presented here are listed.
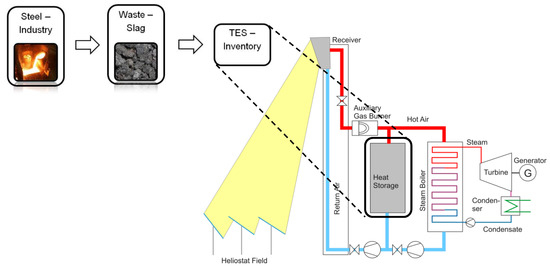
Figure 1.
Flow sheet of a concentrated solar power (CSP) plant with a thermal energy storage based on slag inventory [22].
The entire design process includes the development of various possible TES designs, their calculation and evaluation using established management tools. The considered designs differ in the arrangement of the container, which is either axial standing or horizontal lying. Another distinguishing feature is the flow direction, which is divided into axial, radial or meander-shaped. Further information, especially the pros and cons of each arrangement is given in [22]. Krüger et al. [22] set up simplified continuous solid phase models, based on the Λ-Π method to obtain an initial estimation of the thermal design and heat storage dimensions. The basics of the method are described in [25,26]. CSP plant specifications used as boundary conditions for the TES design consideration and the slag material properties are given in Table 1.

Table 1.
Operation specifications for a 150 MWel CSP plant (a) and used slag parameter (b) [27].
Krüger et al. [22] applied management tools normally used in production development in order to identify a lead concept. This includes an aptitude and risk analysis based on the quality function deployment (QFD) method. For the aptitude analysis, criteria for technical and economical demands were collected. Each concept was evaluated according the criteria, which resulted in individual aptitude values. Various possible risks were identified for the risk analysis and assessed in terms of potential damage. A risk value was calculated for each TES design after considering a probability of occurrence of the respective damaging event. Both values led in an aptitude to risk ratio. The best ratio was shown by the vertical storage design with axial flow direction. This TES design is depicted in Figure 2. It was taken as the lead concept and is investigated in detail in further research. The step-by-step implementation of the method as well as detailed results for the individual TES designs are given in [22].
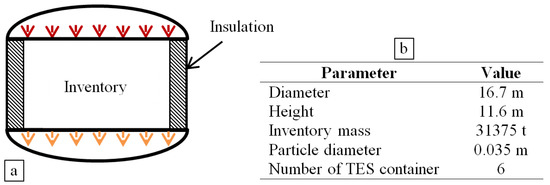
Figure 2.
Sketch of the lead concept (a) and its specifications (b) [27].
3. Methodology: Thermal Performance Analysis
Important design parameters of TES are the dynamic behavior and thermal losses. To investigate the slag-based TES in those areas, a simulation model is set up. The basis is set by a continuous solid phase model published by Ismail [26] and the following simplifications. Firstly, the solid is considered as a continuous porous medium and not as a medium composed of independent particles. Secondly, the heat transfer in the bed takes place by conduction. The radial heat exchange is neglected. Both phases are modeled separately. The applied energy equations for the fluid phase (Equation (1)) and solid (Equation (2)) side can be written as:
Both equations are structured in the same way. For example, in Equation (1), the sum of rate of change of enthalpy and the net enthalpy of the fluid flow is given by the term on the left side, where ε is the porosity, ρ is the density, cP is the specific heat and v the velocity. The axial heat conduction is calculated with the first term on the right-hand side, where kfx is the effective thermal conductivity of the fluid. The subsequent term represents the heat exchange by convection between the particles and the fluid. The heat transfer coefficient hsf in the convection term is determined according to Gnielinskis correlation for a bed of particles (Equation (3)) [28]. A correction factor fa (Equation (4)) is required, by which the Nußelt number for one particle is multiplied. The reason for this is that the heat transfer coefficient is higher in case of a packed bed than in case of a single particle. With Equations (5) to (7) the Nußelt number of a single particle can be determined.
Two types of thermal losses are taken into account. On the one hand, the heat loss from the storage wall to the external environment, which is calculated with the last term in Equation (1). On the other hand, the radiation losses in the cold and hot distributor section of the TES tank are considered by implementing Equation (8) into the thermal model. ε* is the degree of emission and σ the Stefan Bolzman constant.
The lead concept was already examined in detail by Haunstetter et al. in [24]. The results obtained indicated the applicability of steelmaking slag as a TES inventory material. To confirm these outcomes, a model validation and experimental investigations is performed subsequently.
4. Experimental Investigation
Two test benches are being prepared for the thermal and thermomechanical investigation of slag and various insulation options. The thermal behavior is investigated in a TES pilot plant. The thermomechanical examinations were carried out at a uniaxial compression test rig.
4.1. Investigated Materials: Slag
Two different types of slag are investigated. On the one hand, slag as received with a mean particle size of 3.5 cm and, on the other hand, oval shaped sintered slag pebbles with dimensions of 3.7 × 2.7 × 1.8 cm (Figure 3). The manufacturing process of the sintered slag pellets is divided into six steps:
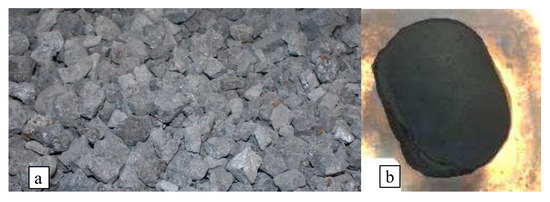
Figure 3.
Slag as received (a) and sintered slag pebble (b).
- Rough crushing of the EAF slag to particles sizes <6 mm;
- Drying of the pre-crushed slag down to <0.5% moisture content at 200 °C;
- Fine milling to a final size of around 50 µm;
- Mixing of the fine material with binders and water;
- Pressing the pellets with 180 bar pressure by using a roll press;
- Sintering of the pellets at 1295 °C.
The reason for preferring sintered slag to slag as received as inventory is its inert characteristic under high temperatures. The pellets are sintered at nearly 1300 °C, so that the use in cyclic operation up to 700 °C will probably not result in significant high-temperature corrosion rates or other high-temperature effects. In addition, the particle-particle stresses within the packed bed are reduced by uniform and edgeless pellets. Moreover, the packed bed is more homogeneous. The reason why slag as received is examined next to the preferred sintered slag, is on the one hand, to have a fallback option if production of the sintered slag will fail and, on the other hand, to investigate a particularly cost-effective option.
4.2. Investigated Materials: Insulation
Three different insulation options are thermomechanically investigated. In all options, perlite bricks (product name “MOLER 45/90D”) were used to build the base layer. Those bricks consists mainly of SiO2 and Al2O3, can resist temperatures of up to 1140 °C and show a thermal conductivity of 0.14 W (m K)−1 at 600 °C. The second, inner layer is built of different materials and shall protect the base layer from mechanical damages; all considered options and their thicknesses are listed below:
- Perlite brick (Moler, 64 mm).
- Perlite brick (Moler, 64 mm) + steel liner (1.4301, 1 mm).
- Perlite brick (Moler, 64 mm) + super-duty firebrick ULTRA B, 30 mm).
4.3. TES Pilot Plant Set Up
The high-temperature TES test facility HOTREG at the German Aerospace Center in Stuttgart was prepared to investigate slag as a TES inventory (Figure 4). The test facility is based on the regenerator principle with a solid inventory and air or flue gas as a heat transfer fluid. The main structural components are:
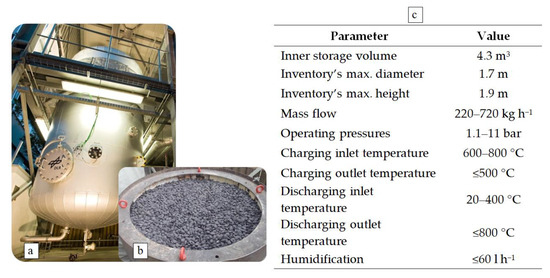
Figure 4.
High-temperature thermal energy storage (TES) test facility HOTREG (a); test setup for slag-based TES (b) and basic specifications of HOTREG (c) [27].
- Air compressor;
- Compressed air heater;
- Regenerative storage tank;
- Cooling circuit;
- Central control unit.
The air compressor is a speed-controlled screw compressor with a rated motor power of 90 kW. It provides continuous air flows between 220 kg h−1 and 720 kg h−1 at pressures between 1.1 bar and 11 bar at the compressed air heater inlet. The compressed air heater is an indirectly heated, double-flue heater in cylindrical, horizontal design with helical-shaped single line plain tube heat exchanger surfaces, separated for “charging”- and “discharging”-mode. The central part is the regenerative storage tank, which is shown in Figure 4a. It consists of a pressure vessel with inner insulation and water cooling at the outside (double shell). For experiments, the inner storage tank can be changed to test different designs of TES. The main technical details of the pilot plant are listed in Figure 4 [24].
For the test campaign, the inner storage tank is equipped with an inner insulation and filled with 4.85 tons of slag pellets, see Figure 4b. A total of 35 “Type K” thermocouples (TC) are used to measure the temperature in the storage tank. Seven levels are distributed over the storage height, as shown in Figure 5. Levels 1 and 7 are close to the inventory, and Levels 2 to 6 are located within the slag packed bed. For inventory temperature recording, each level is equipped with five TCs, with the exception of Levels 3 and 5, where four additional thermocouples are placed in the insulation. The TCs of each level are arranged in a circle with a diameter of 1000 mm. For the evaluation, the mean level temperature values are used. The TCs have a specified accuracy of 1.5 K [24].
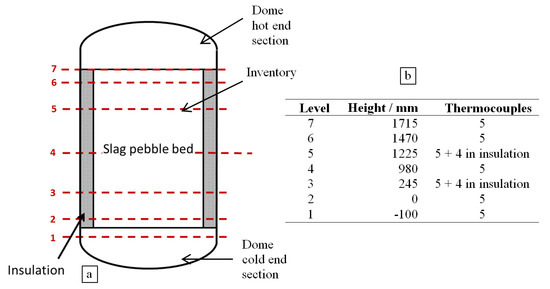
Figure 5.
Schematic drawing of the thermal energy storage (a) with different levels of thermocouple placement (b) [27].
The TES test facility is used for different cyclic experiments, which differ while charging and discharging in duration as well as in mass flow. These parameters are determined by adapting the full-scale design to the pilot scale [24]. All test parameters are listed in Table 2.
Table 2.
Test parameter [27].
4.4. Uniaxial Compression Tests
During thermal charging and discharging of the TES system, the inventory and insulation undergo thermal expansion and shrinkage. This effect has two major consequences. Firstly, the risk of individual particles being damaged increases due to the increasing contact forces between the pebbles. Secondly, the pressure exerted on the surrounding container insulation walls increases, which must be taken into account during container and insulation design.
Thermomechanical experiments are carried out to determine possible damage in cyclic TES operation. They are based on so-called uniaxial compression tests (UCT’s) [29]. The used test rig and its specifications are illustrated in Figure 6. The test rig is custom-built and essentially consists of two parts. The basic structure is a hydraulic press which supplies the samples with a specific, axial load. Loads up to 160 t can be supplied. The second element is a cylindrical, insulated and heatable stainless-steel container located under the piston and measures 0.5 m in diameter as well as 0.5 m in height. The packed bed to be investigated is placed within the container. The slag pebbles can also be heated up to 600 °C. The piston load and axial change in bed height are measured with the internal measuring system of the press [29].
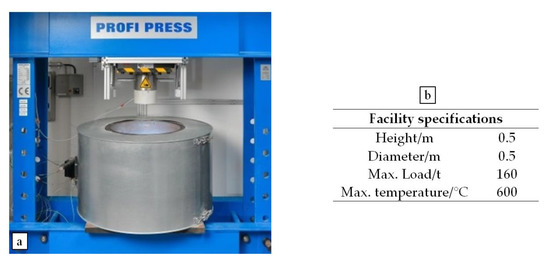
Figure 6.
Uniaxial compression test rig (a) and its specifications (b).
The experimental methods for the investigation of the inventory and the isolation options are almost identical. The only difference is the filling. For the inventory tests, slag is filled into the container up to the top edge, while for the insulation tests the insulation bricks are placed on the bottom of the container and a slag layer of approx. 10 cm is put on top. This is done to obtain an accurate representation of the TES slag to insulation penetration. On top of the filled container, a cover is placed to distribute the piston load over the entire packed bed. Cyclic compression tests with a load starting from 20 kN increasing to 140 kN are carried out. Between these two load points, 500 cycles are performed, which represents about two years of TES operation in a CSP plant. The reason for the short test time compared to the real operating time is, on the one hand, that the highest particle damages occur after a few cycles. This is due to pre-damage, production-related damage and micro-cracks in the particles. On the other hand, the investigation time is limited. Figure 7 illustrates the load force acting on the slag packed bed over (here only for 100 cycles).
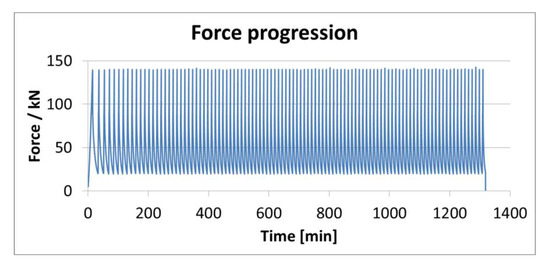
Figure 7.
Diagram of UCT’s cyclic load over time for 100 cycles.
The starting load of 20 kN represents the static, non-thermal load at the bottom of the 12 m high full-scale heat storage. This was calculated using the Janssen equation for silo stress calculation (Equation (9)) and the boundary conditions of the full-scale TES system given in Figure 2.
ρb is the effective packed bed density and corresponds to the product of the packing factor and the slag density. The parameters A and Uc are the circular area and the circumference of the backed bed. σv represents the vertical pressure. The highest load of 140 kN represents the “worst-case” thermomechanical load of the full-scale TES converted to the test containers top area. Worst case is meant here, a section located at the bottom of the storage with the highest static pressure, exposed to the highest temperature change and thus the highest thermal expansion. Therefore, in the rest of the storage lower thermomechanical loads are present.
5. Results
5.1. TES Pilot Plant
Figure 8, Figure 9 and Figure 10 illustrate the air temperature curves of the hot and cold end TES-section. Each figure shows the hot end temperature in red and the cold end temperature in blue. The mass flow of the pilot tests during thermal cycling is depicted in black. The experimental results are given in solid lines. In addition, the results obtained from the simulation model are plotted with dashed lines. In all experiments, the initial bed temperature is 120 °C, followed by cyclic charging and discharging with the parameters given in Table 2. Constant discharging mass flows are used, while the charging mass flows behaved like a sine curve. Reason for this is the course of the sun, which also follows a sine curve. That is why the average mass flows are given in Table 2. Hereafter, the results of the design point (21 March) and summer and winter behavior tests are presented. Each is directly compared with the simulation results.
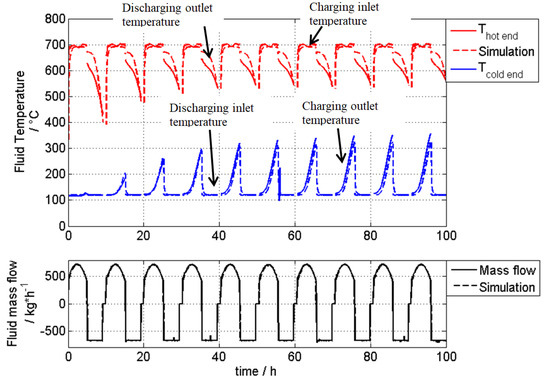
Figure 8.
21 March: Fluid temperature at TES cold end (blue) and hot end (red), mass flow while charging and discharging (black); solid lines represent the experimental results and dashed lines show the simulation model results.
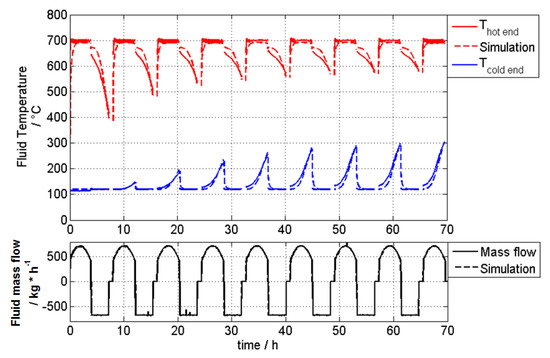
Figure 9.
21 December: Fluid temperature at TES cold end (blue) and hot end (red), mass flow while charging and discharging (black); solid lines represent the experimental results and dashed lines show the simulation model results.
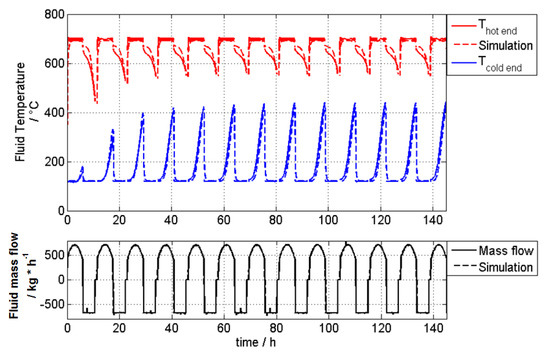
Figure 10.
21 June: Fluid temperature at TES cold end (blue) and hot end (red), mass flow while charging and discharging (black); solid lines represent the experimental results and dashed lines show the simulation model results.
5.1.1. 21 March Results
Figure 8 shows the measured temperatures over time for the conditions of 21 March. Cyclic charging and discharging leads to steady state storage operation after six cycles. This is clearly shown by the fluctuations of the discharge outlet temperature, which after six cycles have approached a settled course. A difference of approx. 50 °C between charging inlet and discharging outlet temperature (red curves) can be seen. This results from higher thermal losses caused by the small prototype scale of the TES. The radiation losses at the hot end dome dominate here above all.
Comparing the experimental results (solid lines) with the results of the simulation (dashed lines) a good agreement can be stated. A maximum deviation of 10 °C is visible at the outlet temperature during charging process (blue). The time course of the discharging outlet temperature has a maximum deviation of 60 °C, which corresponds to an accuracy of over 90%. The deviation results from the small prototype scale of the test facility and thus from the higher influence of boundary effects such as plant-specific radiation losses, which are not yet integrated in the simulation model.
5.1.2. 21 December (Winter) Results
Figure 9 illustrates the measured temperatures over time under the conditions of 21 December the. Cyclic charging and discharging leads to a storage operation in cyclic steady state after eight cycles. This can be clearly seen from the variations of the discharging outlet temperature, having approximated to a settled course after eight cycles. The charging outlet temperature is lower compared to the one of the design point. Here a maximum charging outlet temperature of 300 °C is reached. This is caused by the shorter sunshine duration and the associated shorter charging time of the TES.
Comparing the experimental results (solid lines) with the results gained by simulation (dashed lines), a good agreement can be stated. Here, too, maximum deviations of less than 10% can be achieved.
5.1.3. 21 June (Summer) Results
Figure 10 shows the measured temperatures over time for the 21 June conditions. After six cycles, steady state operation could be reached. The charging outlet temperature is considerably higher compared to design point and winter conditions. Here a maximum charging outlet temperature of 430 °C is reached. This is caused by the longer sunshine duration and thus by the longer charging time of the TES.
Comparing the experimental results (solid lines) with the results gained by simulation (dashed lines) good accordance can be stated. The maximum deviations of below 10% are located at the discharging outlet temperature.
5.1.4. Downtime Behavior
The temperature behavior of the slag inventory with regard to different downtimes is also investigated. Therefore, the TES is switched to downtime mode after the charging cycle. Figure 11 shows the inventory temperature profile over the storage height. Three different cases are considered: no downtime, one day and two days of downtime. A comparison of the various experimental results (solid lines) reveals high thermal losses. After the first day, the energy loss is 22%, which increases to 35% after two days. This results from the small pilot scale and the associated high surface-to-volume ratio. The higher losses at the storage ends (0 m and 1.7 m) result from radiation losses at the distributor. Comparing the simulation (dashed lines) results with the experimental ones a good agreement can be stated. The maximum deviation here is 10%.
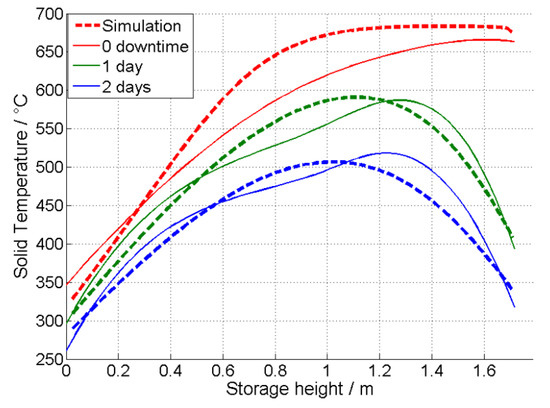
Figure 11.
Downtime behavior of the fully charged experimental, 21 March conditions.
To sum up the experimental results with the test facility HOTREG show a good thermal performance and indicate the suitability of slags as an inventory material for solid media TES. In addition, a good agreement between simulation and experiment is achieved with a maximum deviation of 10%. Deviations can result from the small prototype scale of the test facility, which results in a higher surface-to-volume ratio compared to a full-scale plant. This results in a higher influence of boundary conditions as well as radiation losses, which may not yet exactly be integrated into the simulation model.
5.2. Uniaxial Compression Tests (UTC)
The sintered slag pellets, slag as received and different insulation options are examined in the uniaxial compression test rig. This is done to investigate the thermomechanical stability of the inventory and insulation options.
5.2.1. Slag as Received
Figure 12 shows the removal of the slag as received after the UTC procedure, described in Section 4.4, has been carried out. Almost no change in particle sizes is observed. In addition, no dust or small particles are visible at the bottom of the container. This indicates that slag as received is thermomechanically suitable for use as inventory material for full-scale TES systems for CSP with air as HTF.
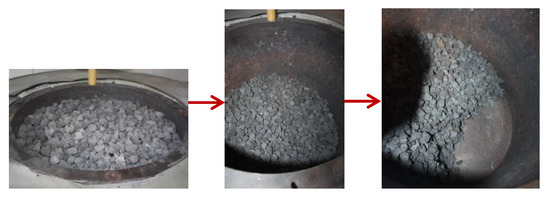
Figure 12.
Uniaxial Compression Tests (UTC) results of slag as received.
5.2.2. Sintered Slag Pebbles
Figure 13 shows the removal of the sintered slag pebbles after UCT. Most of the pebbles are not affected by the cyclic compression tests. A small amount of about 10 wt. % is damaged. This damage can be seen in cracks and spalling. It should be mentioned here again, that these are worst case experiments, which only represent the small storage section in which the highest loads occur. Therefore, the amount of damaged pebbles in the whole full-scale plant is below 1%. However, there is still a need for improvement of the pebble sintering process.
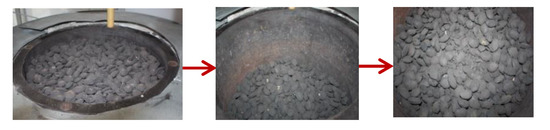
Figure 13.
UCT results of sintered slag pebbles.
5.2.3. Insulation—Perlite Brick
Figure 14 illustrates the step-by-step procedure and the results of the perlite brick insulation test. Four bricks are placed on the bottom of the test rig container. These are then covered with 10 cm of slag as received. On the top of the slag bed, a cover is placed to distribute the applied force (not shown in the picture). After 500 cycles the slag is removed, and a visual inspection of the insulation bricks is done. Significant damage can be observed, and the functionality of the insulation is negatively affected. Thus, the perlite brick insulation cannot be used alone, a protection layer is required.
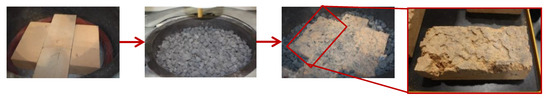
Figure 14.
UCT of perlite brick insulation.
5.2.4. Insulation—Perlite Brick Protected by Steel Liner
In a second step, the insulation bricks are protected by a 1 mm steel plate. In Figure 15 results can be seen. Lower damages can be observed. The steel liner itself shows minor dents of 1 mm depth and the perlite brick insulation got more fragile but keeps its shape and functionality.
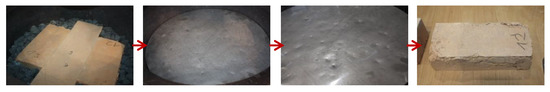
Figure 15.
UCT of perlite brick insulation protected with steel liner.
5.2.5. Insulation—Perlite Brick Protected by Super-Duty Firebricks
In a third test, super-duty fireclay is used as a protection layer. It is an Al2O3 (30% to 35%) ceramic insulation with a small Fe2O3 percentage <3%. Its temperature resistance is up to 1370 °C and the thermal conductivity at 800 °C is 1.25 W (m·K)−1. Super-duty fireclay bricks are placed on top of four perlite bricks to operate as a protection and first insulation layer (compare Figure 16). Afterwards, they are covered with a slag as received bed. After the UCT no significant damage is observed, except for small cracks in the super-duty firebricks. These do not result in rupture, and the functionality of both insulation layers is still given. As a result, super-duty firebricks are recommended as a protection layer for the perlite brick insulation.
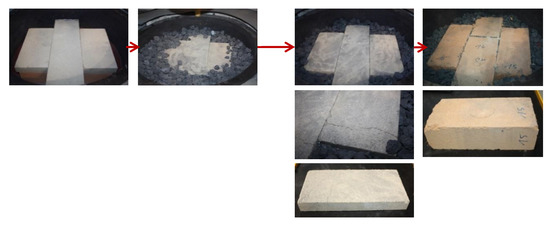
Figure 16.
UCT of perlite brick insulation protected with super-duty firebricks.
6. Summary and Conclusions
The use of metallurgical slags from EAF as inventory material for thermal energy storage (TES) has not yet been thoroughly investigated. Since the thermo-physical properties of the slags under consideration are very similar to those of conventional refractory materials and ceramics, this material offers the economic advantage of being a very cost-effective alternative to conventional inventory materials for solid media TES. However, for a successful market introduction of this technology, efficient and up-scalable solutions for the TES are a prerequisite.
In this work, thermal performance and thermo-structural stability of slag-based TES are evaluated. For this purpose, two different test rigs are used. The thermo-structural stability is investigated with a uniaxial compression test rig, while the thermal performance is tested by using the high-temperature test facility HOTREG located at the German Aerospace Center in Stuttgart. In addition, a TES simulation model was set up and validated to calculate the thermal performance of scale up and full-scale TES plants.
Results of the test campaign with the pilot TES plant confirm the thermal suitability of EAF slag as an inventory material for concentrated solar power tower plants. By comparing the experimental thermal results with the simulation results, a good agreement can be seen. A maximum deviation of 10% could be achieved. The detected deviations are a result of simplified model assumptions. Additionally, the prototype scale of the test rig leads to higher impact of losses, which results from the higher surface-to-volume ratio of the pilot compared to the full-scale plant. The relatively high losses of the prototype can also be seen in the downtime behavior, where an energy loss of 35% after two days occurs. The thermo-mechanical tests with the slag and different insulation options confirm, on the one hand, the suitability of raw EAF slag as an inventory material for a full-scale TES plant. However, after the UCT’s, the sintered slag pebbles show damages of around 10 wt. %. This results in improvement needs regarding the manufacturing process of the pebbles. On the other hand, the uniaxial compression tests indicate that a protection layer is required for the perlite brick insulation. By investigating three different protection options, a promising one could be identified. The best option here is to use super-duty firebricks as a protection layer in front of the perlite brick insulation.
In summary, it can be stated that CSP plants can benefit from slag-based TES. However, there are still some uncertainties that need further investigation such as the long-term stability and dust generation of the slag as well as the exact thermomechanical behavior.
Author Contributions
The paper was written by J.H. under the guidance of M.K. and S.Z. The experimental investigation of the slag and the insulation options was carried out by M.K. and J.H. The simulation model was set up by J.H. All authors have read and agreed to the published version of the manuscript.
Funding
This project has received funding from the European Union’s Horizon 2020 Research and Innovation Programme under grant agreement No. 642067.
Conflicts of Interest
The authors declare no conflict of interest. The funders had no role in the design of the study; in the collection, analyses or interpretation of data; in the writing of the manuscript or in the decision to publish the results.
Nomenclature
| A | area, m2 |
| aP | superficial particle area per unit bed volume, m−1 |
| aw | superficial area of storage unit per unit volume of the bed, m−1 |
| cP | specific heat, J kg−1 K−1 |
| dP | particle diameter, m |
| h | heat transfer coefficient, W m−2 K−1 |
| k | thermal conductivity, W m−1 K−1 |
| l | storage length, m |
| T0 | initial temperature of the bed or ambient temperature, K |
| temperature of the fluid phase, K | |
| U | circumference, m |
| Uw | overall heat transfer coefficient, W m−2 K−1 |
| w | void fraction velocity, m s−1 |
| x | axial coordinate |
| Greek Symbols | |
| ε | void fraction |
| ε* | degree of emission |
| η | dynamic viscosity, Pa s |
| θ | temperature of the solid phase, K |
| ρ | density, kg m−3 |
| σv | vertical pressure, Pa |
| σ | Bolzmann constant, 5.67*10−8 W m−2 K−1 |
References
- Kumar, A.; Shukla, S.K. A review on thermal energy storage unit for solar thermal power plant application. Energy Procedia 2015, 74, 462–469. [Google Scholar] [CrossRef]
- Liu, M.; Tay, S.; Bell, S.; Belusko, M.; Jacob, R.; Will, G.; Saman, W.; Bruno, F. Review on concentrating solar power plants and new developments in high temperature thermal energy storage technologies. Renew. Sustain. Energy Rev. 2016, 53, 1411–1432. [Google Scholar] [CrossRef]
- Medrano, M.; Gil, A.; Martorell, I.; Potau, X.; Cabeza, L. State of the art on high-temperature thermal energy storage for power generation. Part 2-Case Study. Renew. Sustain. Energy Rev. 2010, 14, 56–72. [Google Scholar] [CrossRef]
- Pitz-Paal, R. Solar Energy—Concentrating Solar Power. Future Energy 2014, 405–431. [Google Scholar] [CrossRef]
- European Association for Storage of Energy (EASE); European Energy Research Alliance (EERA). European Energy Storage Technology Development Roadmap—2017 Update; EASE: Brussels, Belgium; EERA: Brussels, Belgium, 2017. [Google Scholar]
- Haeger, M.; Keller, L.; Monterreal, R.; Valverde, A. Phoebus Technology Program Solar Air Receiver (TSA): Operational Experiences with the Experimental Set-Up of a 2.5 MWth Volumetric Air Receiver (TSA) at the Plataforma Solar de Almería (PSA). In Proceedings of the International Solar Energy Conference, San Francisco, CA, USA, 27–30 March 1994. [Google Scholar]
- Fricker, H.W. Regenerative thermal storage in atmospheric air system solar power plants. Energy 2014, 29, 871–881. [Google Scholar] [CrossRef]
- Cinocca, A.; Cipollone, R.; Carapellucci, R.; Iampiere, V.; Rivo, M. CSP-PT gas plant using air as Heat Transfer Fluid with a packed-bed storage section. Energy Procedia 2018, 148, 852–859. [Google Scholar] [CrossRef]
- Hänchen, M.; Brückner, S.; Steinfeld, A. High-temperature thermal storage using a packed bed of rocks—Heat transfer analysis and experimental validation. Appl. Therm. Eng. 2011, 31, 1798–1806. [Google Scholar] [CrossRef]
- Rovense, F.; Reyes-Belmonte, M.A.; González-Aguilar, J.; Amelio, M.; Bova, S.; Romero, M. Flexible electricity dispatch for CSP plant using un-fired closed air Brayton cycle with particles based thermal energy storage system. Energy 2019, 173, 971–984. [Google Scholar] [CrossRef]
- Andreozzi, A.; Buonomo, B.; Manca, O.; Tamburrino, S. Thermal energy storages analysis for high temperature in air solar systems. Appl. Therm. Eng. 2014, 71, 130–141. [Google Scholar] [CrossRef]
- Zunft, S.; Hänel, M.; Krüger, M.; Dreißigacker, V.; Göhring, F.; Wahl, E. Jülich Solar Power Tower—Experimental Evaluation of the Storage Subsystem and Performance Calculation. J. Solar Energy Eng. 2011, 133, 1019–1023. [Google Scholar] [CrossRef]
- Zunft, S.; Hänel, M.; Krüger, M.; Dreißigacker, V. A design study for regenerator-type heat storage in solar tower plants—Results and conclusions of the HOTSPOT project. Energy Procedia 2014, 49, 1088–1096. [Google Scholar] [CrossRef]
- Koll, G.; Schwarzbözl, P.; Hennecke, K.; Hartz, T.; Schmitz, M.; Hoffschmidt, B. The solar Tower Jülich—A Research and Demonstration Plant for Central Receiver Systems. In Proceedings of the 15th SolarPaces Conference 2009, Berlin, Germany, 15–18 September 2009. [Google Scholar]
- Laing, D.; Zunft, S. Using concrete and other solid storage media in thermal energy storage (TES) systems. Adv. Therm. Energy Storage Syst. Methods Appl. 2015, 65–86. [Google Scholar] [CrossRef]
- Stahl, K.; Moser, P.; Marquardt, R.; Siebert, M.; Kesser, S.; Maier, F.; Krüger, M.; Zunft, S.; Dreißigacker, V.; Hahn, J. Flexibilisierung von Gas.-und Dampfturbinenkraftwerken durch den Einsatz von Hochtemperatur-Wärmespeichern (FleGs): F&E Vorhaben zur Vorbereitung von Hochtemperatur-Wärmespeichern und deren Integration in den Gas.-und Dampfturbinenprozess; RWE Power AG: Essen, Germany, 2013. [Google Scholar]
- Stahl, K.; Zunft, S.; Kessler, S.; Siebert, M. Flexibilisierung von GuD-Kraftwerken durch den Einsatz von Hochtemperatur-Wärmespeichern. In Proceedings of the VDI-Konferenz “GuD-Kraftwerke im dynamischen Netzbetrieb”, Köln, Germany, 29–30 November 2011. [Google Scholar]
- Zunft, S.; Freund, S. Large-Scale Electricity Storage with Adiabatic CAES—The ADELE-ING project. In Proceedings of the Energy Storage Global Conference, Paris, France, 19–21 November 2014. [Google Scholar]
- Zunft, S.; Krüger, M.; Dreißigacker, V.; Belik, S.; Hahn, J.; Knödler, P. ADELE-ING: Engineering-Vorhaben für die Errichtung der Ersten Demonstrationsanlage zur Adiabaten Druckluftspeichertechnik; Züblin AG: Stuttgart, Germany, 2017. [Google Scholar]
- Calvet, N.; Dejean, G.; Unamunzaga, L.; Py, X. Waste from Metallurgic Industry: A Sustainable High-Temperature Thermal Energy Storage Material for Concentrated Solar Power. In Proceedings of the ASME 2013 7th International Conference on Energy Sustainability, No. ES2013-18333, Minneapolis, MN, USA, 14–19 July 2013. [Google Scholar] [CrossRef]
- RESLAG. Available online: http://www.reslag.eu (accessed on 11 September 2018).
- Krüger, M.; Haunstetter, J.; Knödler, P.; Zunft, S. Slag as an Inventory Material for Heat Storage in a Concentrated Solar Tower Power Plant: Design Studies and Systematic Comparative Assessment. Appl. Sci. 2019, 9, 1833. [Google Scholar] [CrossRef]
- Krüger, M.; Haunstetter, J.; Knödler, P.; Zunft, S. Slag as Inventory Material for a Thermal Energy Storage (TES): Material investigation and thermos-mechanical consideration. Energy Procedia 2018, 155, 454–463. [Google Scholar] [CrossRef]
- Haunstetter, J.; Krüger, M.; Zunft, S. Slag as an inventory material for heat storage in a concentrated solar tower power plant: Experimental studies on design and performance of the thermal energy storage. AIP Conf. Proc. 2019, 2126, 200022. [Google Scholar]
- Dreißigacker, V.; Müller-Steinhagen, H.; Zunft, S. Thermomechanical analysis of packed beds for large-scale storage of high temperature heat. Heat Mass Transf. 2010, 46, 1199–1207. [Google Scholar] [CrossRef]
- Ismail, K.; Stuginsky, R. A parametric study on possible fixed bed models for PCM and sensible heat storage. Appl. Therm. Eng. 1999, 19, 757–788. [Google Scholar] [CrossRef]
- Haunstetter, J.; Krüger, M.; Zunft, S. Slag as an inventory material for heat storage in a concentrated solar tower power plant: Experimental studies on design and performance of the thermal energy storage. AIP Conf. Proc. 2019, 2126, 200022, with permission of AIP Publishing. [Google Scholar]
- Gnielinski, V. Equations for the calculation of heat and mass transfer during flow through stationary spherical packings at moderate and high Peclet numbers. Int. Chem. Eng. 1981, 21, 378–383. [Google Scholar]
- Knödler, P. Thermo-mechanical investigations of packed beds for high temperature heat storage: Uniaxial compression test experiments and particle discrete simulations. Appl. Sci. 2019, 9, 1600. [Google Scholar] [CrossRef]


© 2020 by the authors. Licensee MDPI, Basel, Switzerland. This article is an open access article distributed under the terms and conditions of the Creative Commons Attribution (CC BY) license (http://creativecommons.org/licenses/by/4.0/).