Article

Vibration Feature Analysis for Gas-Insulated Switchgear Mechanical Fault Detection under Varying Current

1
School of Automation Science and Electrical Engineering, Beihang University, Beijing 100191, China
2
China Electric Power Research Institute, Beijing 100192, China
*
Author to whom correspondence should be addressed.
Appl. Sci. 2020, 10(3), 944; https://doi.org/10.3390/app10030944
Submission received: 6 January 2020 / Revised: 28 January 2020 / Accepted: 30 January 2020 / Published: 1 February 2020
(This article belongs to the Special Issue Vibration-Based Structural Health Monitoring)

Abstract

:
As a key component to ensure the safe operation of the power grid, mechanical defect diagnosis technology of gas-insulated switchgear (GIS) during operation is often neglected. At present, GIS mechanical fault detection based on vibration information has not been developed. The main reason is that the excitation current is considerable but uncontrollable in the actual operation of GIS. It is difficult to eliminate the influence of excitation on the vibration amplitude and form an effective vibration feature description technology. Therefore, this paper proposes a unified feature-extraction method for GIS vibration information that reduces the influence of current amplitude for mechanical fault diagnosis. Starting from the GIS mechanical analysis, the periodicity of vibration excitation and the influence of amplitude are discussed. Then, combined with the non-linear characteristics of GIS systems and non-linear vibration theory, the multiplier frequency energy ratio (MFER) is designed to extract vibration-unified features of GIS for diagnosing the mechanical fault under different current levels. The diagnosis results of the experimental data with different feature-extraction methods show the applicability and superiority of the proposed method in the GIS’s mechanical fault-detection field based on vibration information.

1. Introduction

Effective detection technology focusing on the operating state of high-voltage electrical equipment is an important means to maintain the safe operation of the power grid [1]. As a key control and protection device, gas-insulated switchgear (GIS) plays an important role in high-voltage electrical equipment [2]. With the development of artificial intelligence technology, intelligent mechanical fault-detection methods have been successfully applied to various kinds of mechanical equipment [3,4,5], such as gear boxes and wind turbines among others. At the same time, related technical methods have been extended to the field of high-voltage circuit-breaker state detection, and have achieved phased results [6,7,8]. Therefore, we believe the establishment of intelligent, information-based, automated GIS mechanical defect-detection systems will become an inevitable trend in the development of high-voltage switchgear.
At present, in the field of GIS state detection, experts from various countries are devoted to the study of characterization, detection methods, and prevention techniques of partial discharges in GIS. A real-time measurement system for partial discharge defect strength based on phase decomposition was developed by using an ultra-high frequency sensor [9]. A partial discharge sensor diagnosis method based on a silicon photomultiplier (SiPM) was proposed [10]; it promotes the partial discharge process of optical detection from laboratory simulations to practical applications. Literature [11] analyzes the spectral characteristics of vibration at different discharge levels, and proposes a partial discharge defect-detection technology based on vibration information. Based on effective measurement, some scholars have carried out in-depth research on feature-extraction technology of discharge information [12,13,14]. As in the literature [12,13], the short-time Fourier transformation method is used to describe the local time-frequency characteristics of discharge. Based on discrete wavelet transformation, [14] eliminated the capacitive component interference in a phase-resolved partial discharge (PRPD) signal of a GIS isolator, and improved the sensitivity of GIS partial discharge integration. In [15], by introducing the membership weight function and the k-means clustering method, the difference between the noise signal and the discharge fault are well recognized. Additionally, the GIS partial discharge fault is accurately detected. The works [16,17] adopt a fuzzy decision tree and the neural network model realizes the diagnosis of GIS partial discharge faults and obtains good diagnostic accuracy. As the number of neural network training layers increases and the error back-propagation optimization method improves, the application of deep-learning diagnostic methods that do not depend on the artificial prior feature-extraction process is widely expected. The literature in [18,19] respectively uses a recurrent neural network (RNN) and the stacked self-encoder model to realize self-learning characteristics of the partial discharge process and the intelligent identification of fault types.
It can be seen from the above literature that GIS partial discharge detection has achieved fruitful results. However, there are few studies on GIS mechanical fault detection. Literature [20] combined with the finite element simulation software ANSYS, analyzed the electromagnetic characteristics of GIS transients, and provided the theoretical basis of GIS mechanical defect-detection technology based on vibration information. Then [21] proposed the GIS mechanical fault feature-extraction method based on voiceprints. A GIS mechanical state detection method was proposed in [22] based on vibration information, and formed an analysis system for abnormal vibration. Literature [23,24] based on GIS vibration information, respectively, using the fuzzy C means algorithm and the K-L divergence theory together implements the mechanical fault-detection process. However, compared with another important high-voltage switchgear, high-voltage circuit breaker mechanical defect diagnosis technology is becoming increasingly mature [25,26,27,28], the detection technology of a GIS operation state is still limited to partial discharge fault analysis, and the development of mechanical fault-detection technology is slow. At the same time, related methods in the literature do not consider the influence of different current excitations on the detection system, which has certain limitations.
Although the current value can be measured by the CT (current transformer) during the operation of the GIS, in the training process of the diagnostic model, since the data sample cannot cover all the current levels under multiple faults, it is difficult to establish an effective diagnostic model at the full current level. There is an urgent need to propose an intelligent diagnostic method for GIS mechanical defects that eliminates the effects of current. The proposed paper presents a unified vibration feature-extraction method suitable for GIS under different energizing currents applied to a GIS mechanical fault-detection system, which reduces the sensitivity of the detection system to the amplitude of excitation current. This paper analyzes the motivated GIS vibration amplitude–frequency characteristics and non-linear vibration characteristics, combined with Fourier transformation and the non-linear vibration theory, and puts forward the vibration spectrum feature selection standard of GIS and extraction technology for the fault diagnosis process. By comparing the different feature set, current sample, and the type of fault diagnosis results the superiority of the proposed method is demonstrated. The main contributions of this paper can be summarized as follows:
(1) The GIS vibration information is characterized by a forced response process of 100 Hz electrodynamics on the non-linear system. The GIS vibration spectrum features are expressed at the multiplier frequency of the 100 Hz excitation, that is, the selection criteria of the GIS vibration spectrum features are proposed.
(2) The influence of different excitation (current) amplitude on vibration spectrum characteristics and the diagnosis model are analyzed. The GIS vibration information depiction method based on multiplier frequency energy ratio (MFER) is proposed, which effectively reduces the influence of excitation amplitude, improves the difference between different faults, and significantly enhances the practicality of GIS mechanical defect technology based on vibration information.
(3) The GIS mechanical defect diagnosis and analysis system based on vibration information are proposed, and the test performance of the system is verified by a large number of tests, which promote the development and application of GIS mechanical state detection technology.
The rest of the paper is organized as follows: Section 2 introduces the GIS vibration information acquisition system, experimental data acquisition, and natural frequency analysis of different operation states. Then, the feature-extraction technology of vibration information will be discussed in Section 3, mainly focusing on the force analysis of three-phase common box GIS, the spectral characteristics of vibration information, and the influence of the current amplitude on feature extraction. A unified feature set for improving the applicability of GIS mechanical fault diagnosis model is also designed. In Section 4, experimental data based on different current levels comparing and analyzing the results of the proposed method, highlighting the advantages of this method and effectively improving the accuracy of fault diagnosis. Finally, Section 5 concludes the paper with discussion of future work.

2. Mechanical Analysis and Experimental Setup of Gas-Insulated Switchgear (GIS)

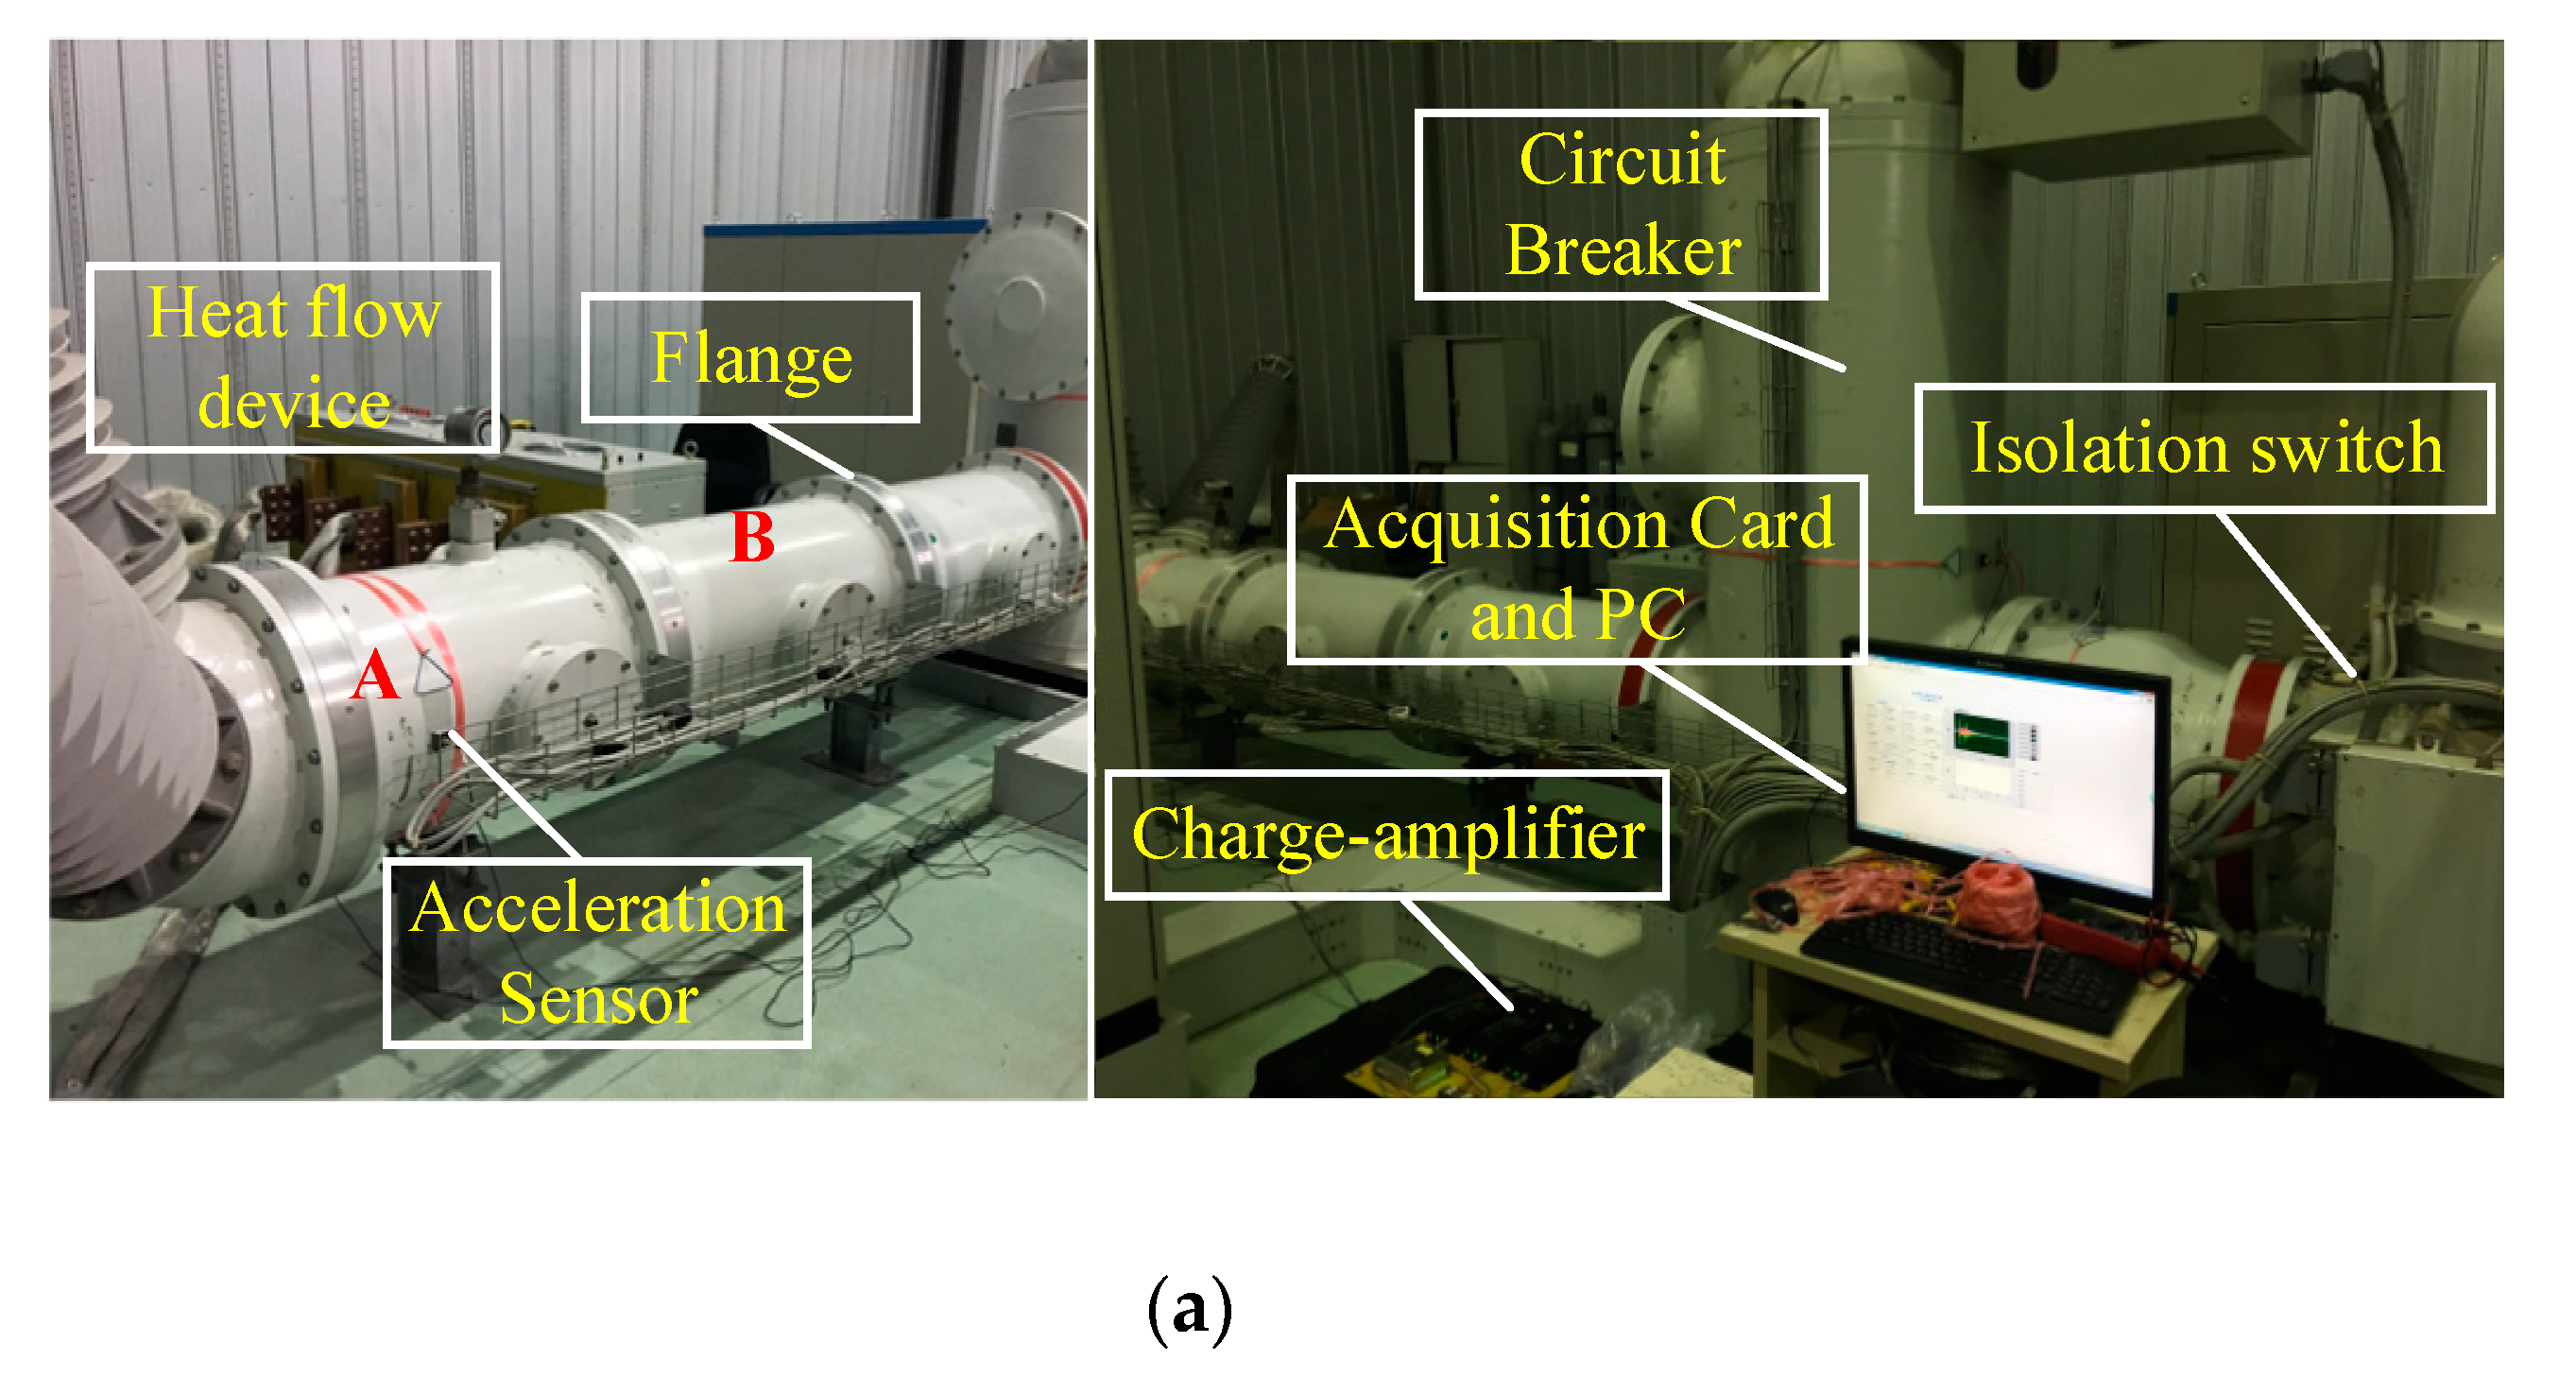
In this paper, we study the GIS mechanical fault-diagnosis technology based on vibration information. The experiment uses a 110 kV three-phase common box GIS true test platform, a vibration signal acquisition system consisting of an acceleration sensor YD-81D, a charge-amplifier DHF-7-3, and a data acquisition card EM9118B. The acquisition system has a measuring range of ±0.5 g (g = 9.8 m/s2), sensitivity of 10 V/g, natural frequency of 40 kHz, and frequency response of 10 kHz. The sampling rate is 10 kHz and the sampling period is 1 s, with the experimental measurement platform shown in Figure 1a. Figure 1b shows the fault simulation involved in this paper and experimental data recording results are shown in Table 1. GIS vibration data were measured under three current levels (500, 1000, 1500 A) and three classes (normal case, isolation switch fault, looseness of flange screw). In a current level, a class included 200 data samples. Therefore, the sample sizes of all data are 1800 (200 × 3 × 3).
(1) Simulating the GIS isolation switch fault according to the dynamic loop resistance measurement method. Under normal conditions, the GIS dynamic loop resistance is 401 μΩ. Dynamic loop resistance is measured by continuously adjusting the position of the isolating switch to reach at 828 μΩ in order to simulate isolation switch failure.
(2) The loosening of some bolts of the GIS connecting flange to simulate GIS flange failure.
The vibration data under different working conditions were measured 200 times in the case of the GIS power supply at 500 A/1000 A/1500 A current excitations which formed the data set of the research process in this paper.
Using the hammer method to measure the vibration information of the GIS system, we analyzed the natural frequency characteristics of the system, tapping the point B in Figure 1a, and measured the time domain map and the Fourier spectrum of the vibration signal at point A, as shown in Figure 2.
It can be seen from Figure 2 that under the impact excitation, the GIS vibration of test point A is horn-shaped decay over time, and the system is characterized by a damping system. At the same time, the Fourier spectrum of the signal shows that the natural frequency of the system is mainly concentrated within 1–1.8 kHz; it presents an excitation mode with multiple frequency points.

3. Feature Analysis of Vibration Information in GIS

In the research of GIS mechanical defect-diagnosis technology based on vibration information, the feature-extraction technology of information is an important factor that directly determines the diagnostic accuracy. First, the mechanical properties of GIS are discussed in Section 3.1 from the perspective of analyzing the characteristics of vibration excitation, the characteristic difference descriptions of different faults are constructed. Then, in Section 3.2, the changes of the same fault spectrum characteristics and different faults under different current levels are analyzed. The influence of the difference in characteristics is designed to be applied to the unified feature description of GIS vibration information at different current levels for subsequent diagnostic model design.

3.1. Vibration Information Analysis

In the three-phase common box GIS, it is assumed that the three phases A, B, and C are arranged in an equilateral triangle, and the top view and the cross-sectional view are as shown in Figure 3. The wire distance is a, the length is l, and the three-phase current is symmetrical power frequency, f = 50 Hz. There are currents in the A, B, and C three-phase conductors, and interactive electromotive forces are bound to occur. Assuming iA = Im sin(2πft), iB = Im sin(2πft − 2π/3) and iC = Im sin(2πft − 4π/3), FAB and FAC are the electromotive forces generated by A-phase conductor under the action of B-phase current and C-phase current, respectively. FABx and FABy are the components of FAB on x and y-axis, respectively. FACx and FACy are the components of FAC on x and y-axis respectively. The sum of FABx and FACx and the sum of FABy and FACy are FAx and FAy, respectively. The resultant force of FAx and FAy is the total electric power FA of A-phase conductor. Thus, the electric power of the A-phase conductor is calculated as follows:
F A x = F A B x + F A C x             = μ 0 l 2 π a I m 2 ( sin ( 2 π f t ) sin ( 2 π f t 2 π / 3 ) sin ( 2 π f t ) sin ( 2 π f t 4 π / 3 ) ) sin ( π / 6 ) = K sin ( 4 π f t )
F A y = F A B y + F A C y             = μ 0 l 2 π a I m 2 ( sin ( 2 π f t ) sin ( 2 π f t 2 π / 3 ) + sin ( 2 π f t ) sin ( 2 π f t 4 π / 3 ) ) cos ( π / 6 ) = K ( 1 cos ( 4 π f t ) )
{ F A = F A x 2 + F A y 2 α α = arctan ( F A y / F A x )
{ | F A | = 3 2 | K sin ( 2 π f t ) | α = π ( 2 f ) t ± k π , k = 0 , 1 , 2 ,
where μ0 is vacuum permeability and K = (− 3 μ0 I2ml)/(8πa). It can be seen from (4) that the frequency of the amplitude change of the A-phase conductor is 2f (the period of the absolute value of the sine function is twice the original function), and the frequency of the angle change is also 2f (the tangent function period is π). Therefore, the frequency of the A-phase conductor electric power is 100 Hz, and the electric power of the B and C phases are also 100 Hz [20].
Combined with Figure 3 and the electrodynamic analysis of the three-phase conductor, it can be seen that the excitation of the GIS shell vibration is derived from the frequency 100 Hz electrodynamic action, that is, the GIS vibration information is expressed as an output response under 100 Hz forced vibration. Based on the periodicity of the vibration signal, the spectral description based on Fourier transformation becomes an effective means of GIS vibration feature extraction. According to the principle of Fourier transformation, the time domain and frequency domain information of three operating conditions are compared under the 1000 A current as shown in Figure 4.
It can be concluded that:
(1) In addition to the excitation spectrum of 100 Hz, the GIS vibration signal also has stability information of other frequency points. Under the premise that the GIS system is a damping system, the vibration response characteristics indicate that the GIS system is not a linear damping system.
(2) According to the principle of non-linear vibration [29,30], under the action of simple harmonic vibration the frequency response of the nonlinear system contains a super-harmonic signal of integer multiples of the excitation frequency and a sub-harmonic signal of integers. It can be seen clearly from Figure 4 that the frequency of the vibration signal is an octave and sub-frequency of 100 Hz, which is in line with the principle of nonlinear vibration.
(3) In addition to the excitation frequency of 100 Hz, most energy vibration signals focus on the natural frequency of GIS system within 1–1.8 kHz.
(4) The amplitude of vibration information of different faults is significantly different at specific frequency points, according to the multiplier frequency spectrum of 100 Hz and energy distribution law to compose the feature space description of GIS fault diagnosis.

3.2. Uniform Feature-Extraction Analysis

During the actual test diagnosis, the GIS current is known but not controllable. In other words, the characterization differences between different faults need to consider the effects of different current amplitudes. It can be seen from Equation (4) that different current amplitudes will cause the amplitude of the excitation source to change, which will also affect the vibration response. In order to analyze the influence of the current amplitude, under normal circumstances, the spectrum distribution of the GIS at 500 A, 1000 A, and 1500 A is shown in Figure 5.
In Figure 5, some conclusions can be described as follows:
(1) Under different current amplitudes, the amplitudes of the same frequency point of the same working condition are different. For example, the diagnostic accuracy is deteriorated only by the amplitude.
(2) The energy at different currents is concentrated at 0.1 kHz and 0.7–1.2 kHz, and the trend of spectrum amplitude is similar, only the magnitude of the amplitude is different.
(3) A GIS fault may cause the system natural frequency change, and 0.1 kHz is the excitation frequency, which is directly affected by the current (excitation) amplitude and does not characterize the inherent properties of the system. Removing the vibration information near the 0.1 kHz part can further improve the GIS fault diagnosis result.
According to the analysis result of Figure 5, the characteristic family of the three-phase common box GIS vibration information is designed, as shown in Table 2, wherein feature family 4 is the method proposed here.
Where i denotes the frequency of the i-th hundred Hertz and Gi represents the amplitude of the i-th hundred Hertz. The element Hi in the feature sets 3 and 4 represents the ratio of the energy of the i-th hundred Hertz to the sum of the energy of the partial frequency points, and the specific formula is as shown in (5).
H i = G i i = i 0 N G i
In this paper, the variable N = 12, i0 = 1 in feature set 3, and i0 =7 in feature set 4. Feature set 4 is based on feature set 3, removing signal of vibration excitation frequency of 100 Hz and the 200~600 Hz signal which has low vibration amplitude and is susceptible to noise interference. Defining the feature analysis process of the feature set 4 is the MFER feature-extraction method by forming the description of the vibration feature set proposed in this paper.
In order to more vividly illustrate the advantages and disadvantages of different feature families, note the comparison of the feature spatial distribution of the measured samples under different faults and current levels, as shown in Figure 6. Here, only the common parts of the four feature families are compared, that is, the six feature dimensions in the interval of 0.7–1.2 kHz.
It can be seen from the distribution of category 2 in Figure 6a that the samples of class 2 are divided into three categories, in which II-A represents the samples at 1500 A current level, II-B and II-C represent the sample at 1000 A and 500 A current levels, respectively. The distribution of measured samples in feature set 1 and 2 has significant relationship with different currents level. Although the difference between different faults is more obvious, the diagnostic model constructed by different current data will have a huge difference in the feature space. In Figure 6b,c, the sample distribution of the same fault under different currents is concentrated, i.e., the vibration information description under different current amplitudes has high consistency. The diagnostic model based on this feature set has low sensitivity to current amplitude, which is suitable for field test applications. Further comparison of the graphs (b) and (c) shows that under the feature space of [0.9 kHz, 1.0 kHz, 1.1 kHz, 1.2 kHz], the difference between the different faults shown in feature set 4 are more significant, and the diagnostic results may be more accurate.

4. Diagnosis Result and Discussion

This section synthesizes the above analysis results and verifies the GIS mechanical fault-detection method proposed in this paper in a MATLAB (9.0.0.341360 (R2016a), Mathworks, Natick, Massachusetts, America, 2016) environment. As described in Table 1 of Part 2, the data collected are respectively 200 sets of vibration data of three current levels under the three working conditions of GIS; combined with the description of GIS vibration information by different feature families described in the third part, the traditional SoftMax classifier [31,32] performs fault-type identification. The specific diagnostic test procedure will be described in Section 4.1 and further diagnostic results analysis will be carried out in Section 4.2.

4.1. Diagnosis Method and Test Explanation

This paper is mainly devoted to solving the unified feature-extraction method of GIS vibration information under different current levels, and is used in GIS mechanical fault diagnosis. Therefore, the experimental data under 500 A, 1000 A, and 1500 A are divided into two parts, namely, An and Bm. An is randomly divided into 10 parts, and nine of them are used to train the GIS mechanical fault diagnosis model, called the training set. The remaining one is used to evaluate the performance of the diagnostic model, called the inner test set and the set Bm composed of the data of the other current levels is used to analyze the uniformity of the diagnostic model, which is called the external test set. The specific diagnostic test process is shown in Figure 7. In this paper, six independent test experiments were designed using three current levels. The model training set, inner test set and external test set of each experiment are shown in Table 3.

4.2. Diagnosis Result

In the case of Test 1, the confusion matrix results of the inner test set and the external test set of the feature family extracted from the four GIS vibration information are compared, as shown in Figure 8, wherein the horizontal axis represents the real category number and the vertical axis represents the predicted category number. It can be seen from Figure 8a that the internal test set of the four feature families has good diagnostic results, and the diagnostic accuracy is above 88%. The feature-extraction method based on the MFER (characteristic groups 3 and 4) is obviously superior to the method of extracting amplitude of the vibration spectrum (features 1 and 2). In the diagnosis results of the external test set in Figure 8b, the diagnostic accuracy of feature sets 1–4 are 62.92%, 40.12%, 65.58%, and 81.42%, respectively, and the diagnostic accuracy of Class 1 is 89.25%, 98.25%, 100%, and 49%. Class 2 has a diagnostic accuracy of 0%, 9.25%, 45.75%, and 95.25%. Class 3 has a diagnostic accuracy of 99.5%, 13.75%, 50%, and 100%. It can be seen from the results of Figure 8b that the feature-extraction method based on the octave energy ratio (feature sets 3 and 4) can effectively reduce the influence of different current levels compared to the conventional feature description method based on the GIS vibration spectrum amplitude, and improve the applicability of the diagnostic model. At the same time, the MFER method (feature set 4) proposed in this paper to remove the influence of excitation frequency can further improve the diagnostic performance, and the diagnostic accuracy for each category is more balanced, reducing the possibility of over-fitting.
In order to further compare the performance of the proposed method, the diagnostic results of Tests 1–6 were analyzed. In each test, the set An is randomly divided into 10 equal parts, each of which is used as an inner test set, and the union of the remaining 9 subsets is used as a training diagnostic model, so there are 10 diagnostic model in each test. Therefore, the diagnostic model rating indicator for each test is characterized by the mean and standard deviation of 10 results, as shown in Figure 9 and Table 4 and Table 5.
As can be seen from Figure 9, and Table 4 and Table 5:
(1) In the inner test set of Test 1~5, the average accuracy of feature set 4 in this paper is greater than other feature sets, and the standard deviation is much smaller than other feature sets. These show the method presented in this paper is more stable and reliable, and the diagnostic model designed by this method is more accurate.
(2) Although the test results in Test 6 are slightly inferior to feature set 3, it can be seen that the external test result of feature set 4 is superior to other feature sets from Figure 9b, which shows that the elimination of the influence of the current method on the current level is more obvious. The GIS mechanical fault diagnosis model established under different current levels is more effective; the average accuracy and standard deviation of the test results outside tests 1–5 can further verify this conclusion.
In order to eliminate the influence of the single-pass group training test set, the above experimental process was performed 10 times independently. Each time a random grouping order was disrupted, and the mean and standard deviation of the average accuracy of the inner test set and the external test set in 10 independent experiments were calculated to evaluate the applicability of the method herein. The results obtained are shown in Figure 10 and Table 6 and Table 7.
Figure 10, Table 6 and Table 7 graphically represent that the results of the inner test set and the external test set obtained from 10 independent experiments are consistent with the results of the single experiment of Figure 9. In the inner test set, the diagnostic results based on the feature set 3 and 4 of the MFER are significantly better than the traditional spectral amplitude method. In the comparison results of the external test set, it can also be seen that the feature set 4 of the octave energy ratio method based on the removal of the excitation effect can better describe the characteristic difference of the GIS mechanical fault under different current levels and can form a more widely applicable diagnostic model.

5. Conclusions

For the safe and stable operation of the power grid, it is very important to establish a mechanical state evaluation system for GIS equipment. Therefore, this paper proposes a unified vibration feature-extraction technology to establish a GIS mechanical fault-detection system suitable for different current levels. The three-phase GIS electrodynamic frequency is 100 Hz. Under the action of the GIS non-linear system, the vibration response spectrum shows the frequency multiplier characteristic of 100 Hz. Based on vibration signal mode, a GIS vibration feature description scheme of MFER is presented for reducing the influence of the different current amplitudes on the vibration information. Finally, based on the SoftMax diagnostic algorithm, the training models and test results of different current combinations are compared under different vibration characteristic descriptions. The experimental results show that the GIS mechanical defect diagnosis method designed in this paper has higher diagnostic accuracy. The proposed feature-extraction technology based on MFER can effectively improve the applicability of the diagnostic model and promote the development of state-detection technology for GIS equipment. Future research is suggested, as follows. First, more types of mechanical fault should be considered. Second, the proposed approach should be implemented to another type of electrical equipment, such as a transformer or motor.

Author Contributions

Y.F. designed the research method, contributed to the experimental section and wrote the draft. J.W. gave a detailed revision and provided important guidance. All authors have read and approved the final manuscript.

Funding

This paper is financially supported by the National Natural Science Foundation of China (No. 51677002and No. 51977002).

Conflicts of Interest

The authors declare no conflict of interest.

References

  1. Haddad, A.; Warne, D.F. Advances in High Voltage Engineering; IET Digital Library: London, UK, 2004. [Google Scholar]
  2. Ryan, H.M. High Voltage Engineering and Testing; The Institution of Electrical Engineers: London, UK, 2001. [Google Scholar]
  3. Zhao, M.H.; Kang, M.; Tang, B.P.; Pecht, M. Deep Residual Networks With Dynamically Weighted Wavelet Coefficients for Fault Diagnosis of Planetary Gearboxes. IEEE Trans. Ind. Electron. 2018, 65, 4290–4300. [Google Scholar] [CrossRef]
  4. Prieto, M.D.; Cirrincione, G.; Espinosa, A.G.; Ortega, J.A.; Henao, H. Bearing Fault Detection by a Novel Condition-Monitoring Scheme Based on Statistical-Time Features and Neural Networks. IEEE Trans. Ind. Electron. 2013, 60, 3398–3407. [Google Scholar] [CrossRef]
  5. Wang, Y.; Xu, G.; Lin, L.; Jiang, K. Detection of weak transient signals based on wavelet packet transform and manifold learning for rolling element bearing fault diagnosis. Mech. Syst. Signal Process. 2015, 54–55, 259–276. [Google Scholar] [CrossRef]
  6. Ma, S.L.; Chen, M.X.; Wu, J.W.; Wang, Y.H.; Jia, B.W.; Jiang, Y. Intelligent Fault Diagnosis of HVCB with Feature Space Optimization-Based Random Forest. Sensors 2018, 18., 1221. [Google Scholar] [CrossRef] [PubMed] [Green Version]
  7. Ni, J.; Zhang, C.; Yang, S.X. An Adaptive Approach Based on KPCA and SVM for Real-Time Fault Diagnosis of HVCBs. IEEE Trans. Power Deliv. 2011, 26, 1960–1971. [Google Scholar] [CrossRef]
  8. Huang, N.; Chen, H.; Cai, G.; Fang, L.; Wang, Y. Mechanical Fault Diagnosis of High Voltage Circuit Breakers Based on Variational Mode Decomposition and Multi-Layer Classifier. Sensors 2016, 16, 1887. [Google Scholar] [CrossRef] [Green Version]
  9. Wang, G.; Kil, G.S. Measurement and Analysis of Partial Discharge using an Ultra-High Frequency Sensor for Gas Insulated Structures. Metrol. Meas. Syst. 2017, 24, 515–524. [Google Scholar] [CrossRef]
  10. Ren, M.; Zhou, J.R.; Yang, S.J.; Zhuang, T.X.; Dong, M.; Albarracín, R. Optical Partial Discharge Diagnosis in SF6 gas-Insulated System with SiPM-based Sensor Array. IEEE Sens. J. 2018, 18, 5532–5540. [Google Scholar] [CrossRef]
  11. Liu, B.; Ma, H.; Ju, P. Partial discharge diagnosis by simultaneous observation of discharge pulses and vibration signal. IEEE Trans. Dielectr. Electr. Insul. 2017, 24, 288–295. [Google Scholar] [CrossRef]
  12. Dong, Y.-L.; Tang, J.; Zeng, F.-P.; Liu, M. Features Extraction and Mechanism Analysis of Partial Discharge Development under Protrusion Defect. J. Electr. Eng. Technol. 2015, 10, 344–354. [Google Scholar] [CrossRef] [Green Version]
  13. Li, X.; Wang, X.; Xie, D.; Wang, X.; Yang, A.; Rong, M. Time–frequency analysis of PD-induced UHF signal in GIS and feature extraction using invariant moments. IET Sci. Meas. Technol. 2018, 12, 169–175. [Google Scholar] [CrossRef]
  14. Wang, G.M.; Kil, G.-S.; Ji, H.-K.; Lee, J.-H. Disturbance Elimination for Partial Discharge Detection in the Spacer of Gas-Insulated Switchgears. Energies 2017, 10, 1762. [Google Scholar] [CrossRef] [Green Version]
  15. Lin, Y.H. Using k-means clustering and parameter weighting for partial-discharge noise suppression. IEEE Trans. Power Deliv. 2011, 26, 2380–2390. [Google Scholar] [CrossRef]
  16. Abdel-Galil, T.K.; Sharkawy, R.M.; Salama, M.M.; Bartnikas, R. Partial discharge pattern classification using the fuzzy decision tree approach. IEEE Trans. Instrum. Meas. 2005, 54, 2258–2263. [Google Scholar] [CrossRef]
  17. Chang, C.S.; Jin, J.; Chang, C.; Hoshino, T.; Hanai, M.; Kobayashi, N. Separation of Corona Using Wavelet Packet Transform and Neural Network for Detection of Partial Discharge in Gas-Insulated Substations. IEEE Trans. Power Deliv. 2005, 20, 1363–1369. [Google Scholar] [CrossRef]
  18. Nguyen, M.-T.; Nguyen, V.-H.; Yun, S.-J.; Kim, Y.-H. Recurrent Neural Network for Partial Discharge Diagnosis in Gas-Insulated Switchgear. Energies 2018, 11, 1202. [Google Scholar] [CrossRef] [Green Version]
  19. Tang, J.; Jin, M.; Zeng, F.P.; Zhang, X.X.; Huang, R. Assessment of Partial Discharge Severity in Gas-insulated Switchgear with a Stacked Sparse Auto-encoder. IET Sci. Meas. Technol. 2017, 11, 423–430. [Google Scholar] [CrossRef]
  20. Yang, J.G.; Liu, Y.; Hu, D.G.; Wu, B.; Che, B.; Li, J.H. Transient electromagnetic force analysis of GIS bus based on FEM. In Proceedings of the International Conference on Condition Monitoring and Diagnosis, Xi’an, China, 25–28 September 2016. [Google Scholar]
  21. Shang, Y.; Liu, Q.; Niu, B.; Zhang, M.H.; Qi, W.D.; Wu, J.F. Mechanical fault diagnosis system based on acoustic feature analysis in gas insulated switchgear. In Proceedings of the 1st International Conference on Electrical Materials and Power Equipment, Xi’an, China, 14–17 May 2017. [Google Scholar]
  22. Sun, Q.; Cao, T.; Hou, Y.; Zhao, T. Detection and Analysis Based on the Abnormal Mechanical Vibration Signal of GIS. In Proceedings of the Fifth International Conference on Instrumentation and Measurement, Computer, Communication and Control, Qinhuangdao, China, 18–20 September 2015. [Google Scholar]
  23. Shen, X.; Lin, Z.; Peng, G.; Tang, S.; Zhang, Y. Research on mechanical fault diagnosis of Ultra high voltage GIS based on the combination of neighbor algorithm and FCM. In Proceedings of the 2016 IEEE PES Asia-Pecific Power and Energy Engineering Conference, Xi’an, China, 25–28 October 2016. [Google Scholar]
  24. Hou, Y.; Zhao, T.; Zheng, H.; Zou, L. Discriminant approach to the GIS mechanical fault diagnosis based on the K-L divergence of vibration signals. In Proceedings of the 2016 IEEE International Conference on High Voltage Engineering and Application, Chengdu, China, 19–22 September 2016. [Google Scholar]
  25. Niu, W.; Liang, G.; Yuan, H.; Baoshu, L. A Fault Diagnosis Method of High Voltage Circuit Breaker Based on Moving Contact Motion Trajectory and ELM. Math. Probl. Eng. 2016, 2016, 1–10. [Google Scholar] [CrossRef] [Green Version]
  26. Zhu, K.; Mei, F.; Zheng, J. Adaptive fault diagnosis of HVCBs based on P-SVDD and P-KFCM. Neurocomputing 2017, 240, 127–136. [Google Scholar] [CrossRef]
  27. Huang, N.; Fang, L.; Cai, G.; Xu, D.; Chen, H.; Nie, Y. Mechanical Fault Diagnosis of High Voltage Circuit Breakers with Unknown Fault Type Using Hybrid Classifier Based on LMD and Time Segmentation Energy Entropy. Entropy 2016, 18, 322. [Google Scholar] [CrossRef] [Green Version]
  28. Zhang, J.; Liu, M.; Wang, K.; Sun, L. Mechanical Fault Diagnosis for HV Circuit Breakers Based on Ensemble Empirical Mode Decomposition Energy Entropy and Support Vector Machine. Math. Probl. Eng. 2015, 2015. [Google Scholar] [CrossRef]
  29. Landa, P.S. Nonlinear Oscillations and Waves in Dynamical Systems; Springer: Amsterdam, Netherlands, 1996. [Google Scholar]
  30. Thomsen, J.J. Vibrations and Stability: Advanced Theory, Analysis, and Tools; Springer: Berlin/Heidelberg, Germany, 2003. [Google Scholar]
  31. Rennie, J.D. Regularized Logistic Regression is Strictly Convex. Unpublished manuscript. Available online: people.csail.mit.edu/jrennie/writing/convexLR.pdf (accessed on 11 December 2019).
  32. Chen, K.; Hu, J.; He, J. Detection and Classification of Transmission Line Faults Based on Unsupervised Feature Learning and Convolutional Sparse Autoencoder. IEEE Trans. Smart Grid 2018, 9, 1748–1758. [Google Scholar]
Figure 1. Experiment and mechanical fault simulation: (a) experiment and field testing; (b) mechanical fault simulation.
Applsci 10 00944 g001aApplsci 10 00944 g001b
Figure 2. Inherent frequency analysis of vibration information.
Applsci 10 00944 g002
Figure 3. Mechanical analysis of three-phase GIS: (a) top view; (b) cross-section drawn.
Applsci 10 00944 g003
Figure 4. Time domain and frequency domain chart of various classes at 1000 A: (a) Class 1; (b) Class 2; (c) Class 3.
Applsci 10 00944 g004
Figure 5. Frequency spectrum distribution of normal case at different current levels.
Applsci 10 00944 g005
Figure 6. Scatter diagram of different feature sets at the common frequency: (a) Feature Set 1 and 2; (b) Feature Set 3; (c) Feature Set 4.
Applsci 10 00944 g006
Figure 7. Overall procedures for GIS system diagnosis under different currents condition.
Applsci 10 00944 g007
Figure 8. Prediction results for the internal and external test sets with the diagnosis model based on 500 A current data set: (a) internal testing; (b) external testing.
Applsci 10 00944 g008
Figure 9. Accuracy (mean and standard deviation) for the internal and external test sets under 10-fold cross validations: (a) accuracy (mean and standard deviation) for internal test set; (b) accuracy (mean and standard deviation) for external test set.
Applsci 10 00944 g009
Figure 10. Accuracy (mean and standard deviation) for the internal and external test sets under ten independent experiments: (a) accuracy (mean and standard deviation) for internal test set; (b) accuracy (mean and standard deviation) for external test set.
Applsci 10 00944 g010
Table 1. Summary of states of gas-insulated switchgear (GIS) considered in this study.
Health ConditionCategory LabelDescription of States
HealthyClass 1Normal case
FaultyClass 2Isolation switch fault
Class 3Looseness of flange screw
Table 2. Feature set definition.
Feature Set NumberFeature Set Expression
Feature Set 1 { G i , i = 1 , 2 , 12 }
Feature Set 2 { G i , i = 7 , 8 , 12 }
Feature Set 3 { H i , i = 1 , 2 , 12 }
Feature Set 4 { H i , i = 7 , 8 , 12 }
Table 3. Training and testing data set.
Test NumberTraining Set/Internal Testing SetExternal Testing Set
Test 1An = {500 A}Bm = {1000 A, 1500 A}
Test 2An = {1000 A}Bm = {500 A, 1500 A}
Test 3An = {1500 A}Bm = {500 A, 1000 A}
Test 4An = {500 A, 1000 A}Bm = {1500 A}
Test 5An = {500 A, 1500 A}Bm = {1000 A}
Test 6An = {1000 A, 1500 A}Bm = {500 A}
Table 4. Accuracy (mean and standard deviation, %) of internal testing under different test number.
Test NumberMean and Standard Deviation of Accuracy (%)
Feature Set 1Feature Set 2Feature Set 3Feature Set 4
Test 190.500 ± 7.49791.500 ± 6.50099.333 ± 2.10899.667 ± 0.703
Test 2100.000 ± 0.000100.000 ± 0.000100.000 ± 0.000100.000 ± 0.000
Test 397.000 ± 2.69989.500 ± 6.18994.167 ± 4.39296.167 ± 2.229
Test 494.917 ± 4.14794.167 ± 5.25696.000 ± 1.165100.000 ± 0.000
Test 591.250 ± 5.43385.750 ± 5.36493.917 ± 2.11797.667 ± 1.097
Test 694.667 ± 3.45292.833 ± 3.62699.833 ± 0.35195.917 ± 1.687
Table 5. Accuracy (mean and standard deviation, %) of external testing under different test number.
Test NumberMean and Standard Deviation of Accuracy (%)
Feature Set 1Feature Set 2Feature Set 3Feature Set 4
Test 151.683 ± 10.36066.783 ± 13.22069.108 ± 7.81879.408 ± 4.365
Test 261.050 ± 2.51060.833 ± 6.13675.075 ± 3.63976.525 ± 2.369
Test 360.617 ± 3.67365.358 ± 4.72269.792 ± 6.01474.425 ± 3.205
Test 467.167 ± 7.385072.950 ± 9.60178.767 ± 4.65980.267 ± 3.806
Test 582.033 ± 13.04971.867 ± 3.96387.717 ± 10.40785.100 ± 1.101
Test 648.583 ± 11.88051.767 ± 5.10768.783 ± 12.25696.333 ± 0.351
Table 6. Accuracy (mean and standard deviation, %) of internal testing with 10 independent and random trials.
Test NumberMean and Standard Deviation of Accuracy (%)
Feature Set 1Feature Set 2Feature Set 3Feature Set 4
Test 192.850 ± 1.80091.717 ± 1.28299.867 ± 0.64899.717 ± 0.120
Test 299.600 ± 1.01899.583 ± 1.205100.00 ± 0.000100.00 ± 0.000
Test 396.700 ± 0.46388.917 ± 0.77695.233 ± 1.07996.267 ± 0.539
Test 494.467 ± 0.75593.742 ± 0.75395.500 ± 0.59599.700 ± 0.367
Test 589.583 ± 0.63588.292 ± 0.84094.000 ± 0.31397.500 ± 0.393
Test 695.117 ± 1.07092.958 ± 0.69099.883 ± 0.32695.892 ± 0.348
Table 7. Accuracy (mean and standard deviation, %) of external testing with 10 independent and random trials.
Test NumberMean and Standard Deviation of Accuracy (%)
Feature Set 1Feature Set 2Feature Set 3Feature Set 4
Test 154.018 ± 1.51365.642 ± 2.39868.247 ± 1.04878.168 ± 2.966
Test 260.817 ± 1.74158.468 ± 1.18673.231 ± 0.38276.257 ± 1.251
Test 360.741 ± 1.14365.980 ± 2.14369.261 ± 1.62573.668 ± 0.671
Test 466.603 ± 1.33872.912 ± 0.92179.375 ± 1.33579.707 ± 1.759
Test 577.278 ± 1.65976.752 ± 2.66088.458 ± 2.56885.128 ± 0.310
Test 642.535 ± 2.13954.047 ± 4.11270.140 ± 2.63095.675 ± 1.145

