Article

Numerical Simulation of the Effect of Injected CO2 Temperature and Pressure on CO2-Enhanced Coalbed Methane

1
College of Electronics Science, Northeast Petroleum University, Daqing 163318, China
2
Key Laboratory of continental shale hydrocarbon accumulation and efficient development of Ministry of Education, Northeast Petroleum University, Daqing 163318, China
*
Authors to whom correspondence should be addressed.
Appl. Sci. 2020, 10(4), 1385; https://doi.org/10.3390/app10041385
Submission received: 9 January 2020 / Accepted: 15 February 2020 / Published: 19 February 2020
(This article belongs to the Section Energy Science and Technology)

Abstract

:
The injection of CO2 to displace CH4 in coal seams is an effective method to exploit coalbed methane (CBM), for which the CO2 injection temperature and pressure are important influential factors. We performed simulations, using COMSOL Multiphysics to determine the effect of CO2 injection temperature and pressure on CO2-enhanced coalbed methane (CO2-ECBM) recovery, according to adsorption/desorption, seepage, and diffusion of binary gas (CO2 and CH4) in the coal seam, and deriver a thermal–hydraulic–mechanical coupling equation of CO2-ECBM. The simulation results show that, as CO2 injection pressure in CO2-ECBM increases, the molar concentration and displacement time of CH4 in the coal seam significantly decrease. With increasing injection temperature, the binary gas adsorption capacity in the coal seam decreases, and CO2 reserves and CH4 production decrease. High temperatures are therefore not conducive for CH4 production.

1. Introduction

Coalbed methane (CBM) in coal seams is usually stored as free gas in cracks and pores and adsorbed gas on organic surfaces [1]. CBM production not only eliminates the threat of hazardous coal mine production and prevents gas over-limits, but also offers economic benefits [2,3]. CO2 is a major greenhouse gas and the biggest contributor to climate change [4,5,6,7,8], because its adsorption capacity is higher than that of CH4. CO2 displacement can be adopted for CBM recovery [9]. CO2-enhanced coalbed methane (CO2-ECBM) technology involves the injection of CO2 into a coal seam rich in CBM, to sequester CH4, promotes clean green energy, and is widely used in the production of deep ultra-low permeability coal seams [10,11,12,13,14].
Dell reported that CH4 could be effectively extracted from crushed coal by injecting flowing CO2 at ambient temperature [15]. Gentzis injected CO2 waste from CBM power plants into a coal seam and produced more CH4, obtaining a competitive adsorption CH4:CO2 ratio of approximately 2:1 [16]. Robertson and Christiansen found that H2S, CO2, CH4, and N2 expand to different degrees in coal seams, and the strain caused by CO2 adsorption was the largest [17]. Charrière conducted CH4 and CO2 adsorption experiments on coal at different temperatures and found that the equilibrium time of coal adsorption of CH4 and CO2 is negatively correlated with pressure and temperature and that matrix expansion leads to a decrease of pore width within coal seam fractures [18]. This leads to a significant decrease in permeability. The degree of coal expansion caused by CO2 is greater than that caused by CH4 [19]. Wei established a multi-component gas diffusion kinetic model based on a Bidisperse diffusion mechanism and Maxwell–Stefan (MS) diffusion theory to verify model effectiveness under pure gas diffusion conditions [20]. Fujioka studied the feasibility of storing CO2 underground while extracting CH4 from coal seams and showed that CO2 injection can increase gas production [21]. The results of Luo showed that vertical permeability heterogeneity can improve the transport capacity of CO2 to a production well [22]. Vishal used numerical simulations to study the production effect of coal with different sorption times under CO2 action. Their results indicate that the CO2 injection capacity of coal with high sorption time is higher than that of coal with low sorption time [23]. Wang established a fully coupled gas flow model based on double permeability diffusion, adsorption strain, and geomechanics and showed that the double-pore diffusion model better describes the diffusion process than the single-pore diffusion model [24]. Fan established the hydraulic–mechanical–thermal coupling model of CO2-ECBM, considering the diffusion of CO2 and CH4 gas and non-isothermal initial temperature absorption of coal, and simulated the effect of injection pressure and initial reservoir temperature on CO2-ECBM [25]. Fang established a fully coupled equation of gas diffusion, adsorption, seepage, and heat transfer and simulated the displacement process and effective influence radius of injected CO2 under different pressure and temperature conditions [26].
The abovementioned studies on CO2-ECBM established the developmental foundation CBM displacement by CO2. However, most scholars have assumed a single temperature or pressure parameter in the study of numerical simulation of CO2-ECBM, and most of them set the coal seam as a homogeneous body. In this paper, we established the THM coupling equation of CO2-ECBM for coal seams with non-uniform porosity and that are non-isothermal, and non-isobaric adsorption of binary gas is considered while combining percolation and diffusion. To study the effects on gas recovery and coal seam permeability, we used COMSOL Multiphysics to simulate the process of injecting CO2 with different pressures and temperatures to displace coalbed methane.

2. Theory

2.1. Desorption–Seepage–Diffusion Principle of CO2 Displacement of CH4

The CO2 adsorption capacity of coal seams is greater than that of CH4. After injecting CO2 into a coal seam, adsorption competes with CH4 and some of the latter is simultaneously displaced. The injection of CO2 increases the energy of the coal seam and produces a partial pressure effect on the adsorption of CH4, which reduces the adsorption pressure of CH4 and promotes its desorption. After desorption, CO2 changes from an adsorbed state to a free state. Gas molecules diffuse under a concentration and pressure gradient, migrating from higher concentration to lower concentration and then to the wellbore of the production well.

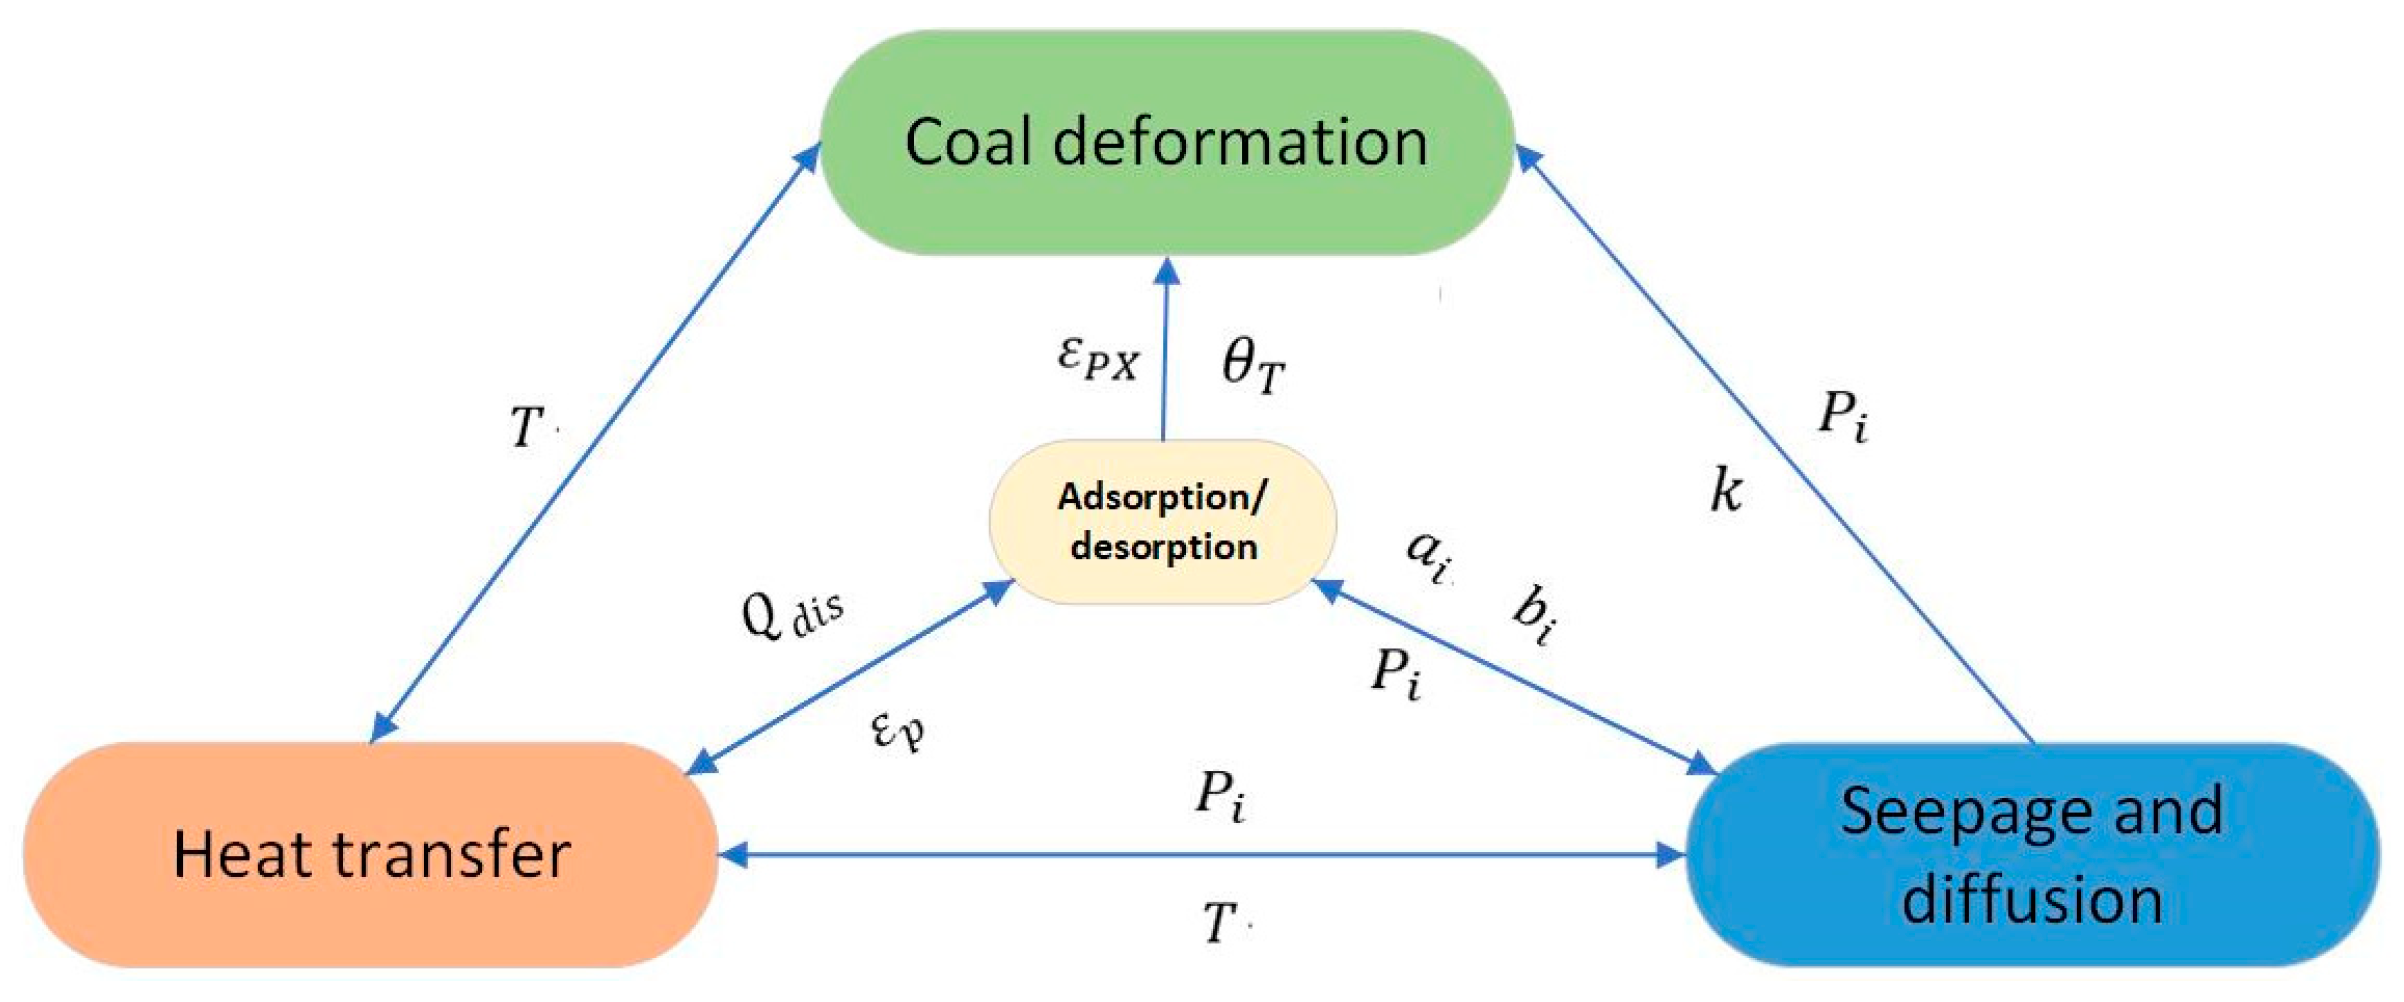
2.2. THM Coupling Equation of CO2 Displacement CBM

The process of CO2 displacement of CBM mainly involves THM coupling, as shown in Figure 1. We therefore establish a THM-coupling model of deformation, heat transfer, gas adsorption/desorption, seepage, and diffusion of coal with a heterogeneous porous medium. The field equation is based on the following assumptions:
(1)
The coal seam is a heterogeneous porous medium;
(2)
The binary gas adsorption and desorption models conform to the Langmuir equation [27];
(3)
The influence of water and vapor on gas transport is not considered [28];
(4)
The free-state carbon dioxide and methane gas in the coal seam obey the ideal gas state equation (ignoring the influence of gas compression coefficient and temperature on gas viscosity) [25,26,27,29,30,31];
(5)
The migration mode of binary gas in the coal seam pores obeys Fick diffusion law, the free binary gas transport in coal seam obeys Darcy’s law, and binary gas mass exchange occurs between diffusion and seepage [16,32];
(6)
The initial state of the coal seam’s only free adsorption state of CBM sets CO2 content to 0 with binary gas in the boundary around the coal seam as no flux.

2.2.1. Stress–Strain Equation

The coal seam is a heterogeneous porous medium model. The deformation field of coal seam is affected by pore pressure, temperature, and matrix expansion caused by gas adsorption and desorption. The stress is expressed as the strain equation [25,33,34,35,36]:
ε i j = 1 2 G δ i j ( 1 6 G 1 9 K ) σ k k δ i j + ε P Y δ i j + ε T δ i j + ε P X δ i j
where G is the shear modulus (Pa); K is the bulk modulus of coal (Pa); ε P Y is gas strain; ε T is thermal expansion strain; and ε P X is the strain caused by gas pressure. The equation is as follows:
{ G = E 2 ( 1 + v ) K = E 3 ( 1 2 v ) ε P Y = α Δ P 3 K s ε T = β Δ T 3 ε P X = 2 ρ c R T a i 3 V m K ln ( 1 + i = 1 2 b i P i )
where E is the Young’s modulus (Pa); v is the Poisson’s ratio; β is the thermal expansion coefficient (K−1); V m is the molar constant of gas; R is the universal gas constant (J/mol·k); δ i j is the Kronecker function; a i is the Langmuir volume constant (m3/kg); b i is the Langmuir pressure constant (Pa−1); P i is the gas pressure(MPa); ρ c is the density of coal (kg/m3); and T is the temperature of the coal (K).
The strain and displacement components satisfy the Cauchy equation [28,37]:
ε i j = 1 2 ( u i j + u j i )
where ε i j is the train component, and u i j is the displacement component.
The equilibrium differential equation of coal seam is defined as the Navier–Stokes equation [28,37]:
σ i j , j + F i = 0
The modified equilibrium differential equation is as follows [38]:
σ i j , j + ( α P σ ij ) , j + F i = 0
Combined with Equations (1)–(5), the coal stress equation is as follows:
G u i , j j + G 1 2 v u j , j i + θ P Y Δ P , i + θ T Δ T , i + θ P X a i T [ ln ( 1 + i = 1 2 b i P i ) ] , i + α P , i + F i = 0
where θ P Y is the stress coefficient caused by gas pressure, θ T is the coefficient of thermal stress, θ P X is the stress coefficient caused by gas adsorption, and α is the Biot coefficient. The equation is as follows:
{ θ P Y = 3 λ 2 G 3 K θ T = 3 λ + 2 G 3 β θ P X = 2 ρ c R ( 3 λ + 2 G ) 3 V m K α = 1 K / K s λ = E v ( 1 + v ) ( 1 2 v )
where K S is bulk modulus of coal skeleton, and σ i j is stress tensor (i, j = 1, 2).

2.2.2. Coupling Equation of Permeation and Diffusion of Binary Gas

Gas seepage in coal seams is driven by a pressure gradient and gas gravity is ignored. The gas seepage velocity expression in coal is derived from Darcy’s law [25]:
q g = K R T μ i c i
where q g is seepage velocity(m3/s); = [ x , y , z ] ; and μ i is viscosity coefficient of single phase.
Gas diffusion follows Fick’s law. Its diffusion flux is expressed as follows [39]:
J i = D i c i
where J i is the diffusion component of single phase; D i is the diffusion coefficient of single phase (m2/s).
CO2 is injected into coal seams containing CH4 driven by a pressure gradient, and the flow of binary gas in coal seam conforms to the convection–diffusion equation [25]:
( m i ) t + ( k R T μ i c i ρ i ) + ( D i φ c i ) = Q S
where i is the single component gas; i = 1 is CH4; i = 2 is CO2; m i is the gas mass of each component (kg); c i is the molar concentration of a single component (mol/m3); ρ i is the density of a single component (kg/m3); k is permeability (m2); φ is porosity; and Q S is the source term (kg/(m3·s)).
For the ideal state equation of binary mixed gas, the molar concentration of each gas is expressed as follows [24]:
c i = P i R T
CO2 and CH4 gases exist simultaneously in the coal seam during CO2 displacement. The mass of the gas is the sum of adsorbed and free gases considering the influence of temperature on the adsorption capacity. The Langmuir adsorption equation can be used to represent the adsorption mass as follows:
m i = ρ c ρ a a i b i c i R T 1 + i = 1 2 b i P i + φ M i c i
Combined with Equations (8)–(12), the binary gas seepage and diffusion equation can be obtained as follows:
( ρ c ρ a a i b i c i R T 1 + i = 1 2 b i P i + φ M i c i ) t + ( k R T μ i c i ρ i ) + ( D i φ c i ) = Q s

2.2.3. Temperature Field Equation of Binary Gas Flow

The system is treated as the thermal equilibrium state, and the coal seam is set as a porous medium of linear thermoelastic material [25]. Deformation work and heat applied to the coal seam are equal to the sum of its kinetic and internal energies. Because deformation of the coal seam is small and reversible, the kinetic energy can be ignored. The energy balance equation of the coal seam is then as follows:
δ Q H = d U δ i j d ε i j = ρ c C V d T + T δ i j t d ε i j
where d Q H is the heat source for thermal expansion, volumetric deformation, and adsorption deformation caused by temperature changes; d U is the internal energy per unit volume; and C V is specific heat at constant volume of coal seam.
The partial derivative of the thermoelastic physical equation is obtained:
σ i j t = [ Q T Δ T δ i j + Q P X Δ P δ i j + Q P Y a i T [ ln ( 1 + i = 1 2 b i P i ) ] δ i j ] t
Ignoring the influence of water and ash content on the coal seam, the heat source in the coal seam is mainly composed of energy absorbed by gas adsorption, release, and desorption. The heat generated by coal deformation, the gas flow temperature field equation, is as follows:
d Q H = η 2 T + Q d i s
where η is thermal conductivity of coal; η Δ 2 T is the change of heat flow into and out of unit volume by heat conduction of gas in unit time; and Q d i s is differential heat source.
Because binary gas desorption of the coal seam is a reversible adsorption process, gas desorption in the coal seam changes from an adsorption state to a free state. The expressions of heat absorbed during CH4 desorption in a coal seam and heat released during CO2 adsorption are as follows:
Q dis = [ a i b i P i ρ a ρ i R T M i ( 1 + i = 1 2 b i P i ) ln [ φ M i ( 1 + i = 1 2 b i P i ) a i b i ρ a ρ i R T ] ] t
By combining Equations (14)–(17), the temperature field control equation of binary gas is obtained as follows:
η 2 T + Q d i s = ρ c C V T t + Q T Δ T δ i j e t + Q P X a i T [ ln ( 1 + i = 1 2 b i P i ) ] e t

2.2.4. Porosity and Permeability

The adsorption and desorption of gas in the seepage and diffusion field, compression of the stress field on the coal seam, and thermal expansion of the temperature field are transformed into the influence on porosity, which is defined as follows [40]:
φ = 1 1 φ 0 1 + e ( 1 + Δ V S V S 0 )
where φ 0 is the initial porosity of coal; e is the volumetric strain of coal; V S 0 is the initial volume of coal skeleton; Δ V S is the coal skeleton volume changes under the comprehensive action of pore pressure compression, thermal expansion, and gas absorption expansion.
The effects of gas pressure and coal temperature on porosity are considered:
φ = 1 1 φ 0 1 + e ( 1 + Δ V S P V S 0 + Δ V S T V S 0 )
where Δ V S P is bulk expansion and deformation of coal caused by pressure; Δ V S T is bulk expansion and deformation of coal caused by temperature change, and the equation is as follows:
{ Δ V S P V S 0 = Δ P K S Δ V S T V S 0 = β Δ T
Volumetric deformation resulting from gas adsorption and desorption is given as follows [41]:
ε p = 2 ρ c R T a i 3 V m K ln ( 1 + i = 1 2 b i P i )
The porosity equation can be obtained by integrating the porosity factors:
φ = 1 1 φ 0 1 + e ( 1 K Y Δ P + β Δ T + 2 ρ c R T a i 3 V m K ln ( 1 + i = 1 2 b i P i ) 1 φ 0 )
The relationship between porosity, permeability, and particle size distribution in porous media is as follows [29,33]:
k = d e 2 φ 3 72 ( 1 φ ) 2
where d e is the effective diameter of particle. According to Equation (22), we obtain:
k k 0 = ( φ 0 φ ) 3 ( 1 φ 0 1 φ ) 2
The second term on the right tends to be consistent when porosity is substantially lower than 1. The relationship between porosity and permeability is as follows [42,43]:
k = k 0 ( φ φ 0 ) 3
where k 0 is the initial permeability (m2), and coal seam permeability is as follows:
k = k 0 ( 1 1 φ 0 1 + e ( 1 + Δ V S P V S 0 + Δ V S T V S 0 ) φ 0 ) 3

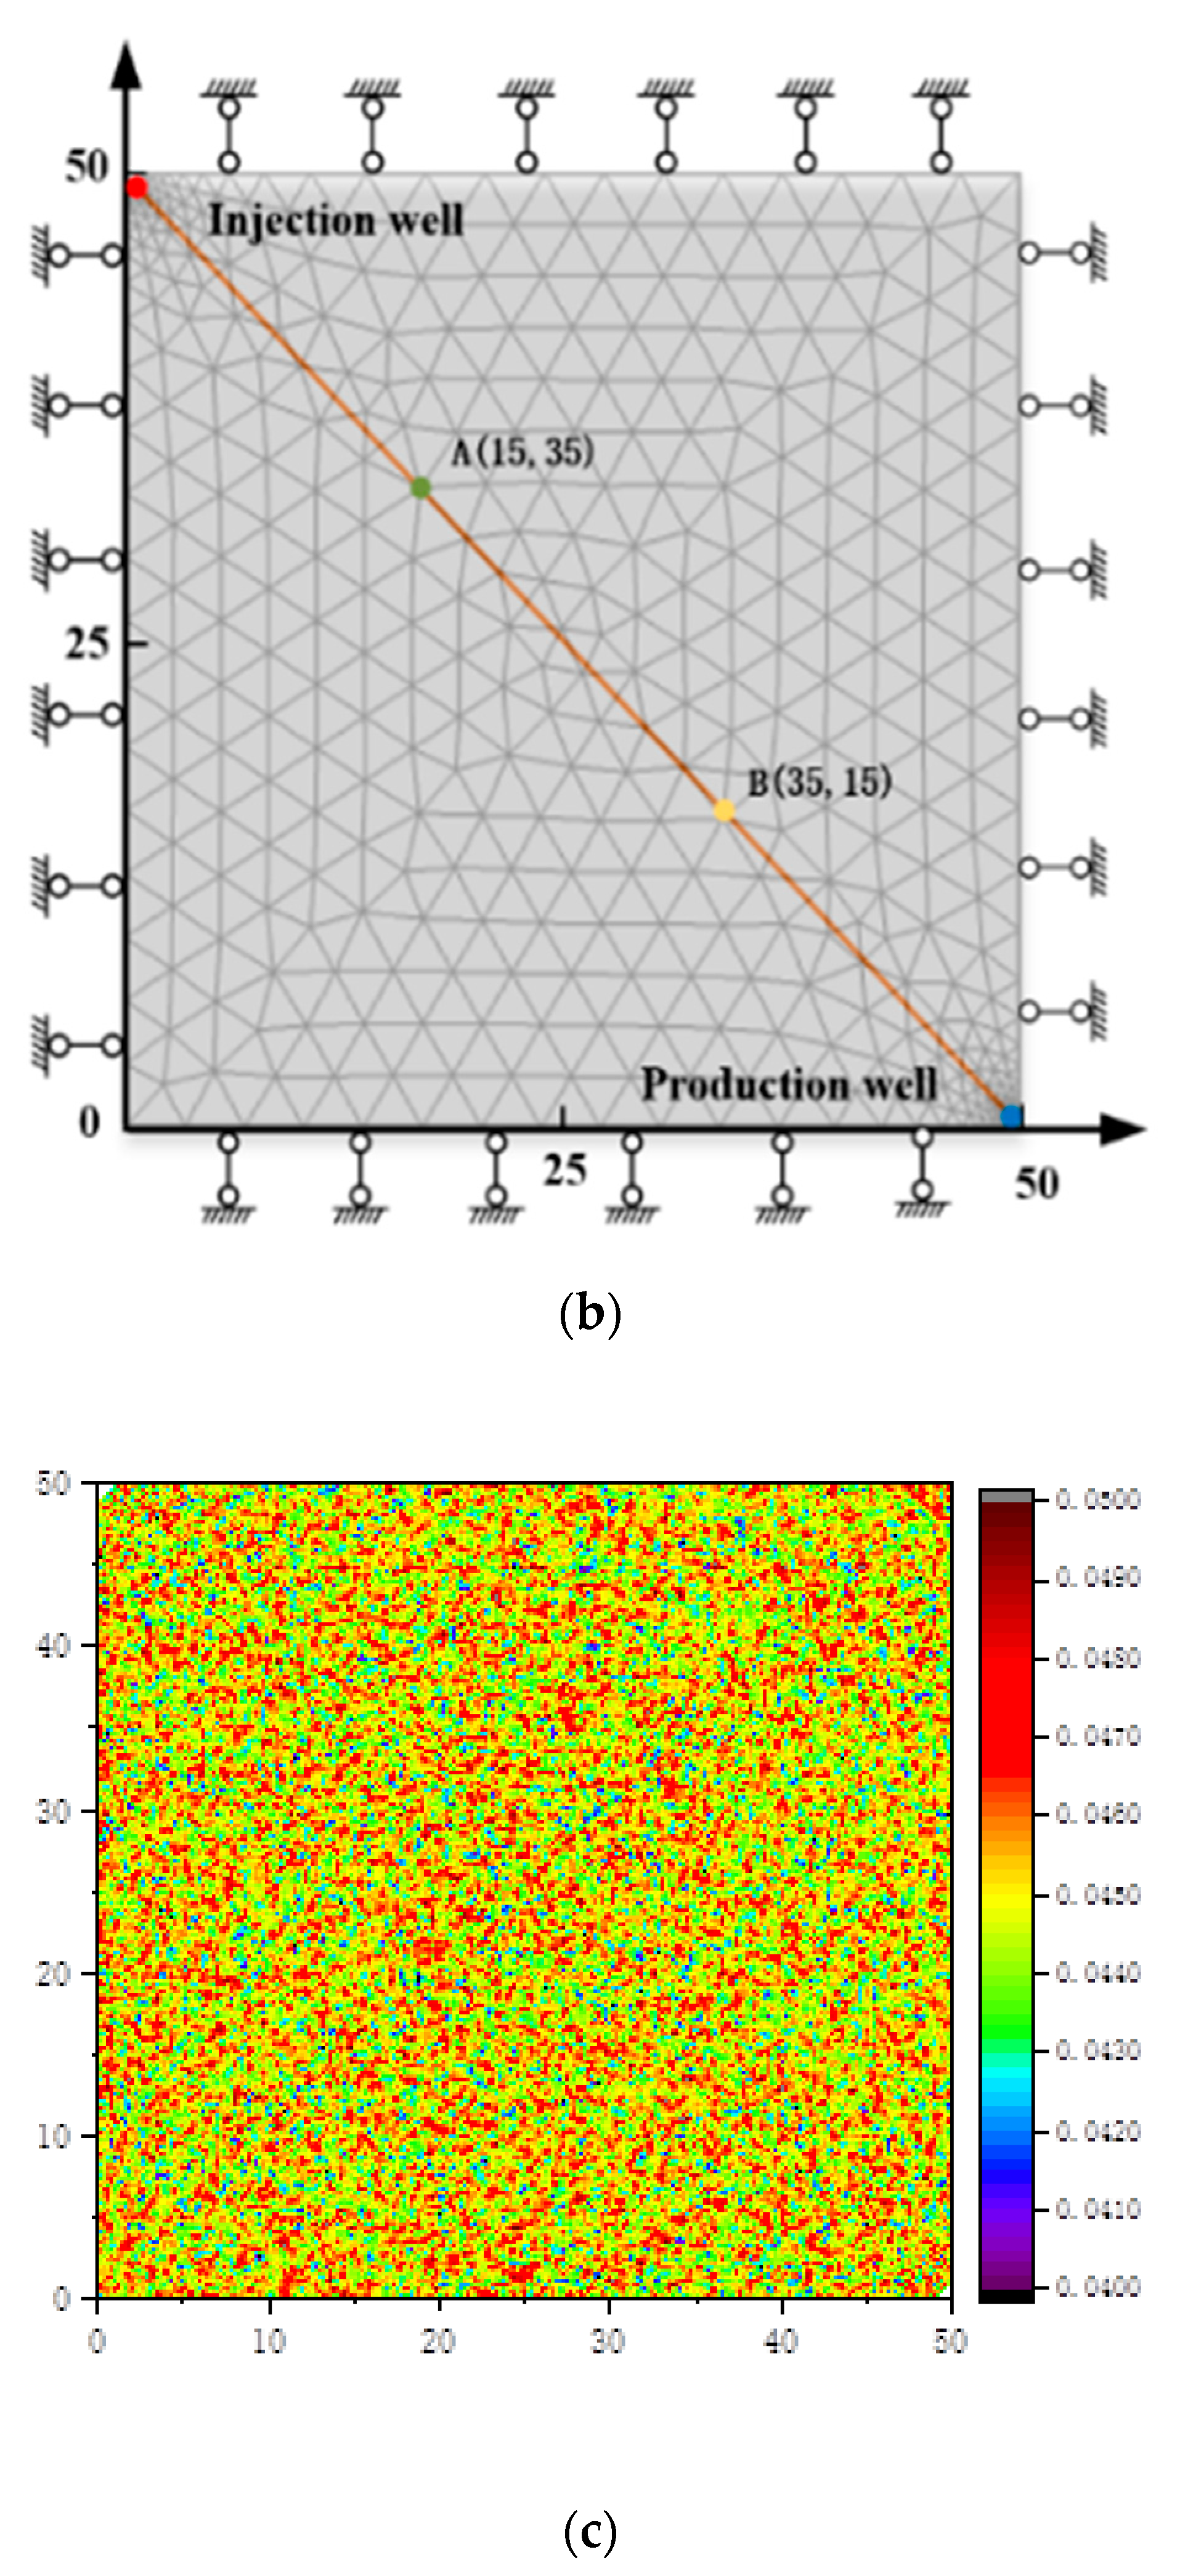
3. Geometric Model and Solution Conditions

We simplify the CBM reservoir in Northern Sichuan (Qinshui Basin, China) into a two-dimensional model, according to the production block of CO2 displacement of CH4 and ignoring the coal seam thickness. The geometric model simplify is simplified to a two-dimensional model of a square area with a side length of 100 m. Considering the symmetry, the 1/4 of the area is selected as a numerical simulation area. As shown in Figure 2, COMSOL Multiphysics software was used to establish a coal seam model with a size of 50 × 50 m. A 1 m diameter production well is located at the bottom right of the model and the pressure is set to 1 atm (0.1 MPa). An injection well with a 1 m diameter is located in the upper left of the model. A triangular mesh was used to divide into 25,504 cells. To facilitate the observation of simulation results, A (15, 35) and B (35, 15) were set as simulation monitoring points of the model. The initial pressure and temperature of the coal seam are 2 MPa and 273 K, respectively. The coal seam and well boundaries are fixed constraints. The initial porosity of each point is φ 0 ( x , y ) and the model parameters are listed in Table 1.

4. Results

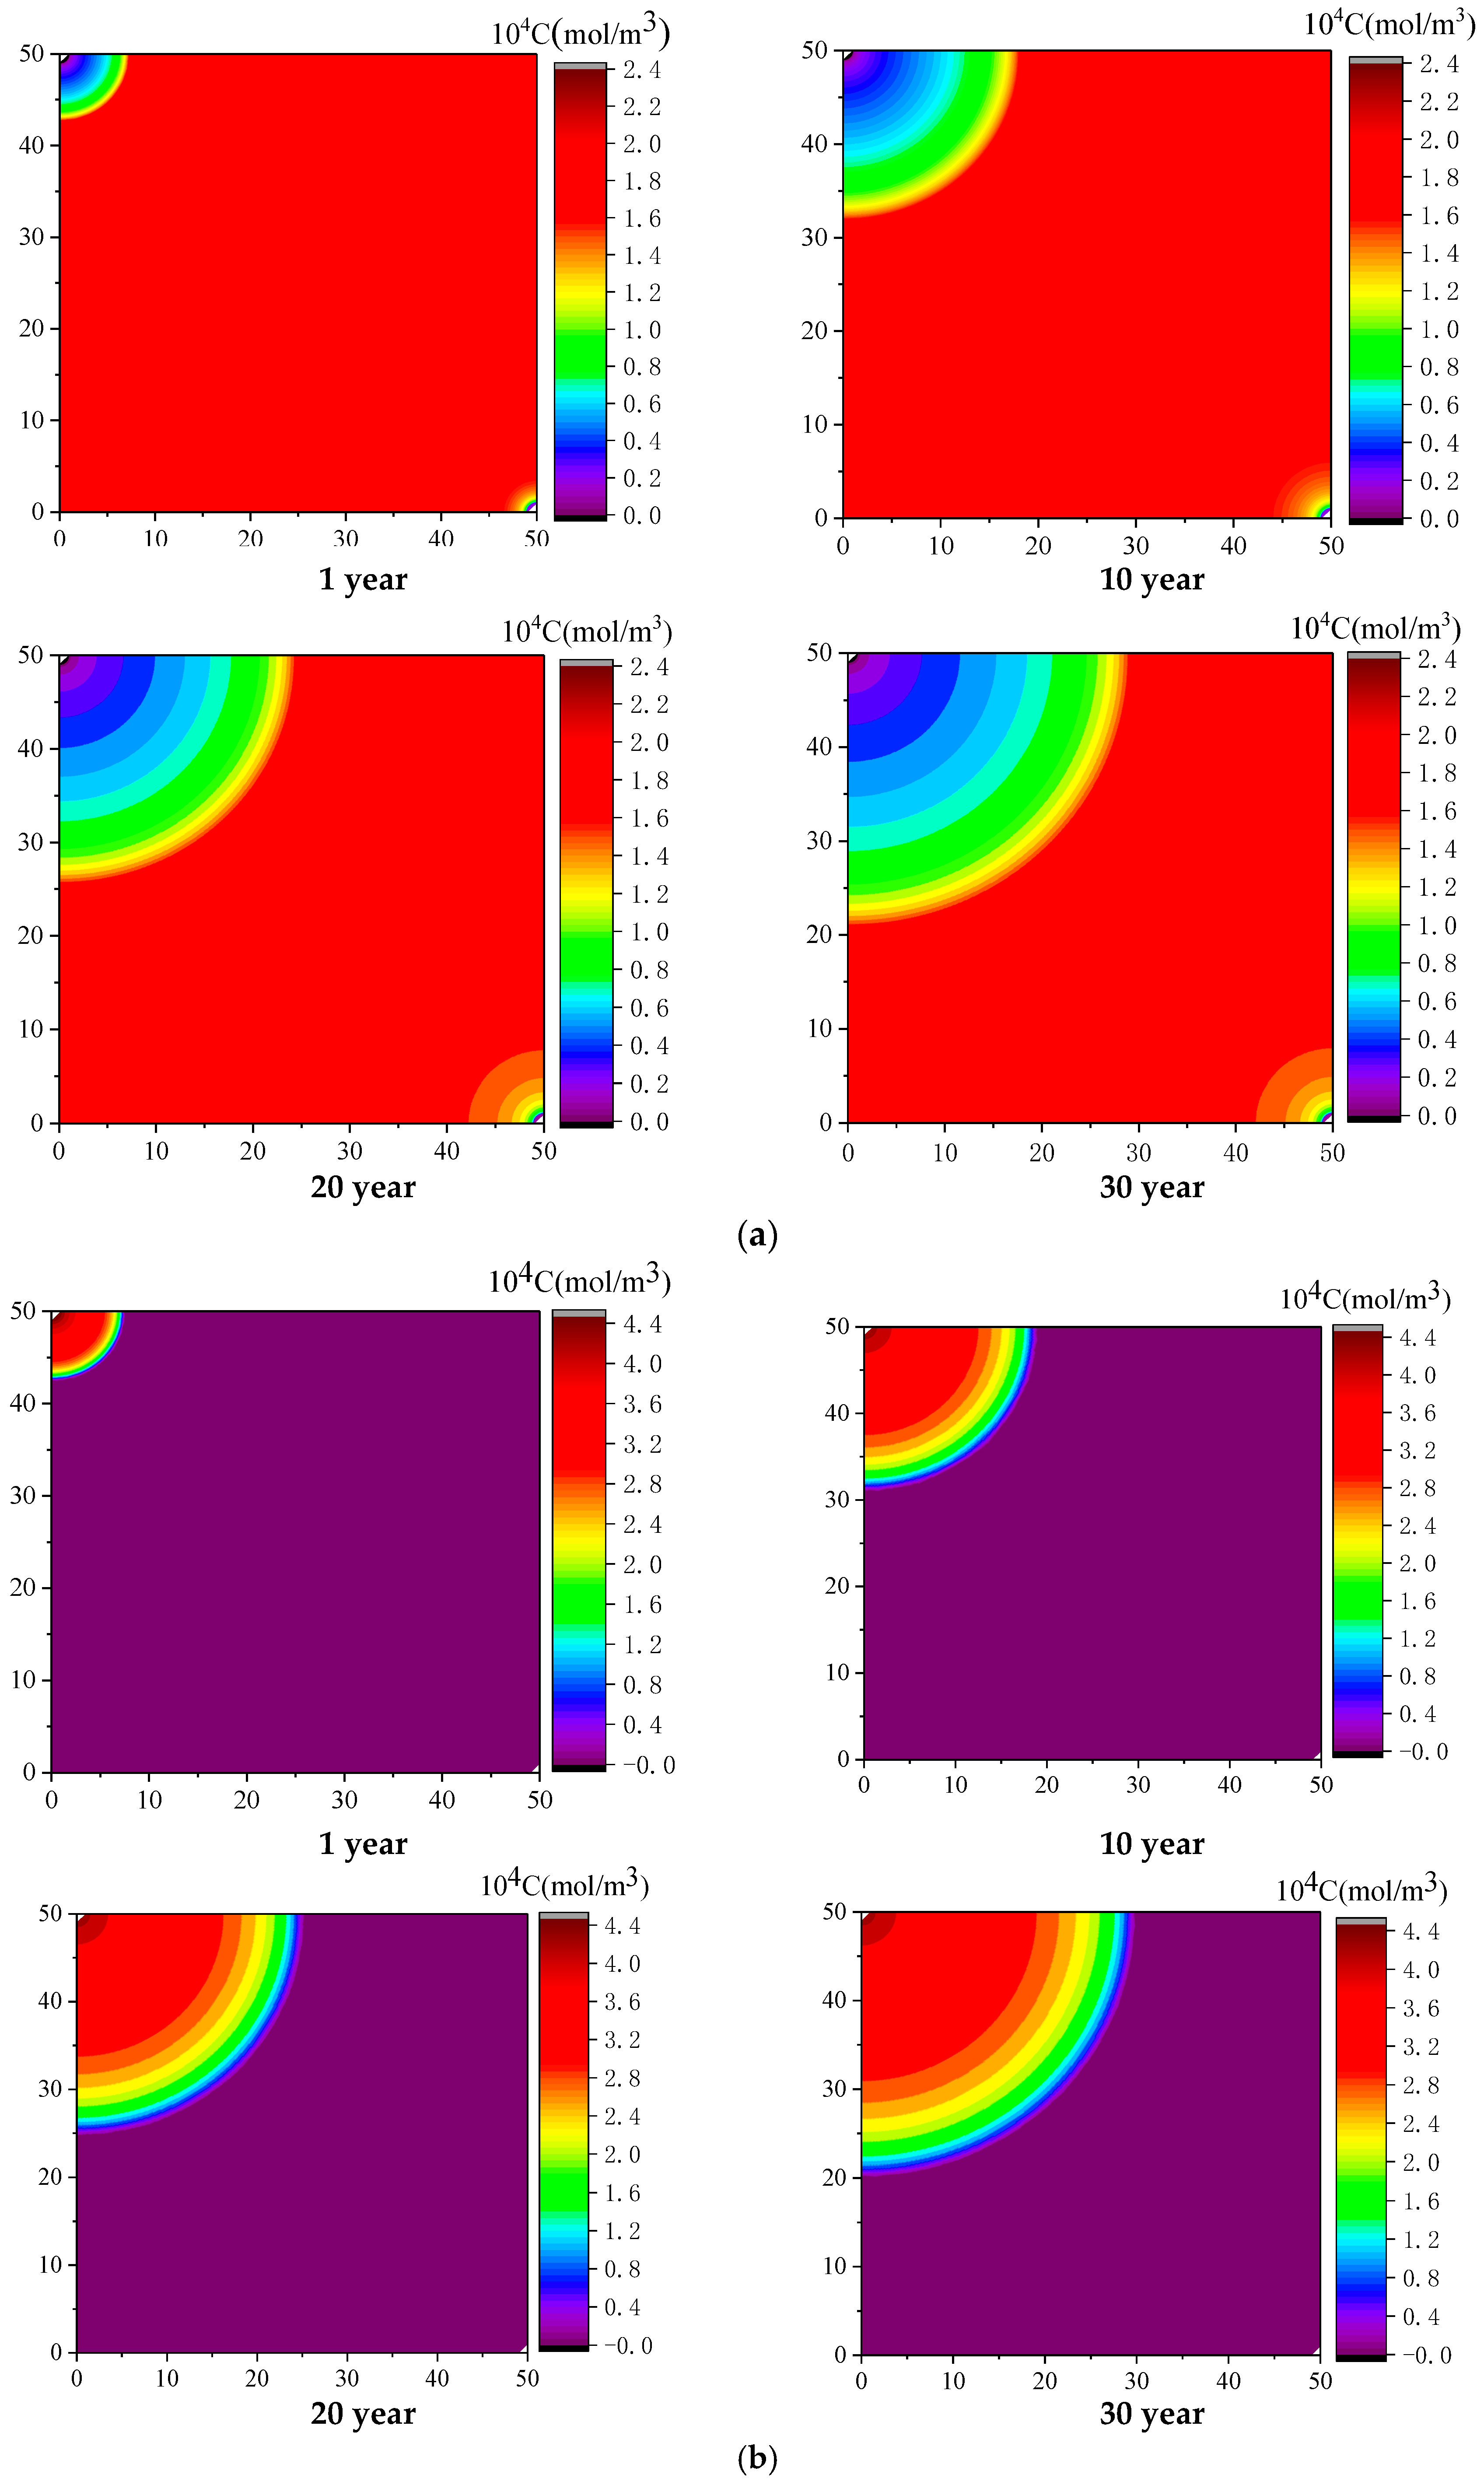
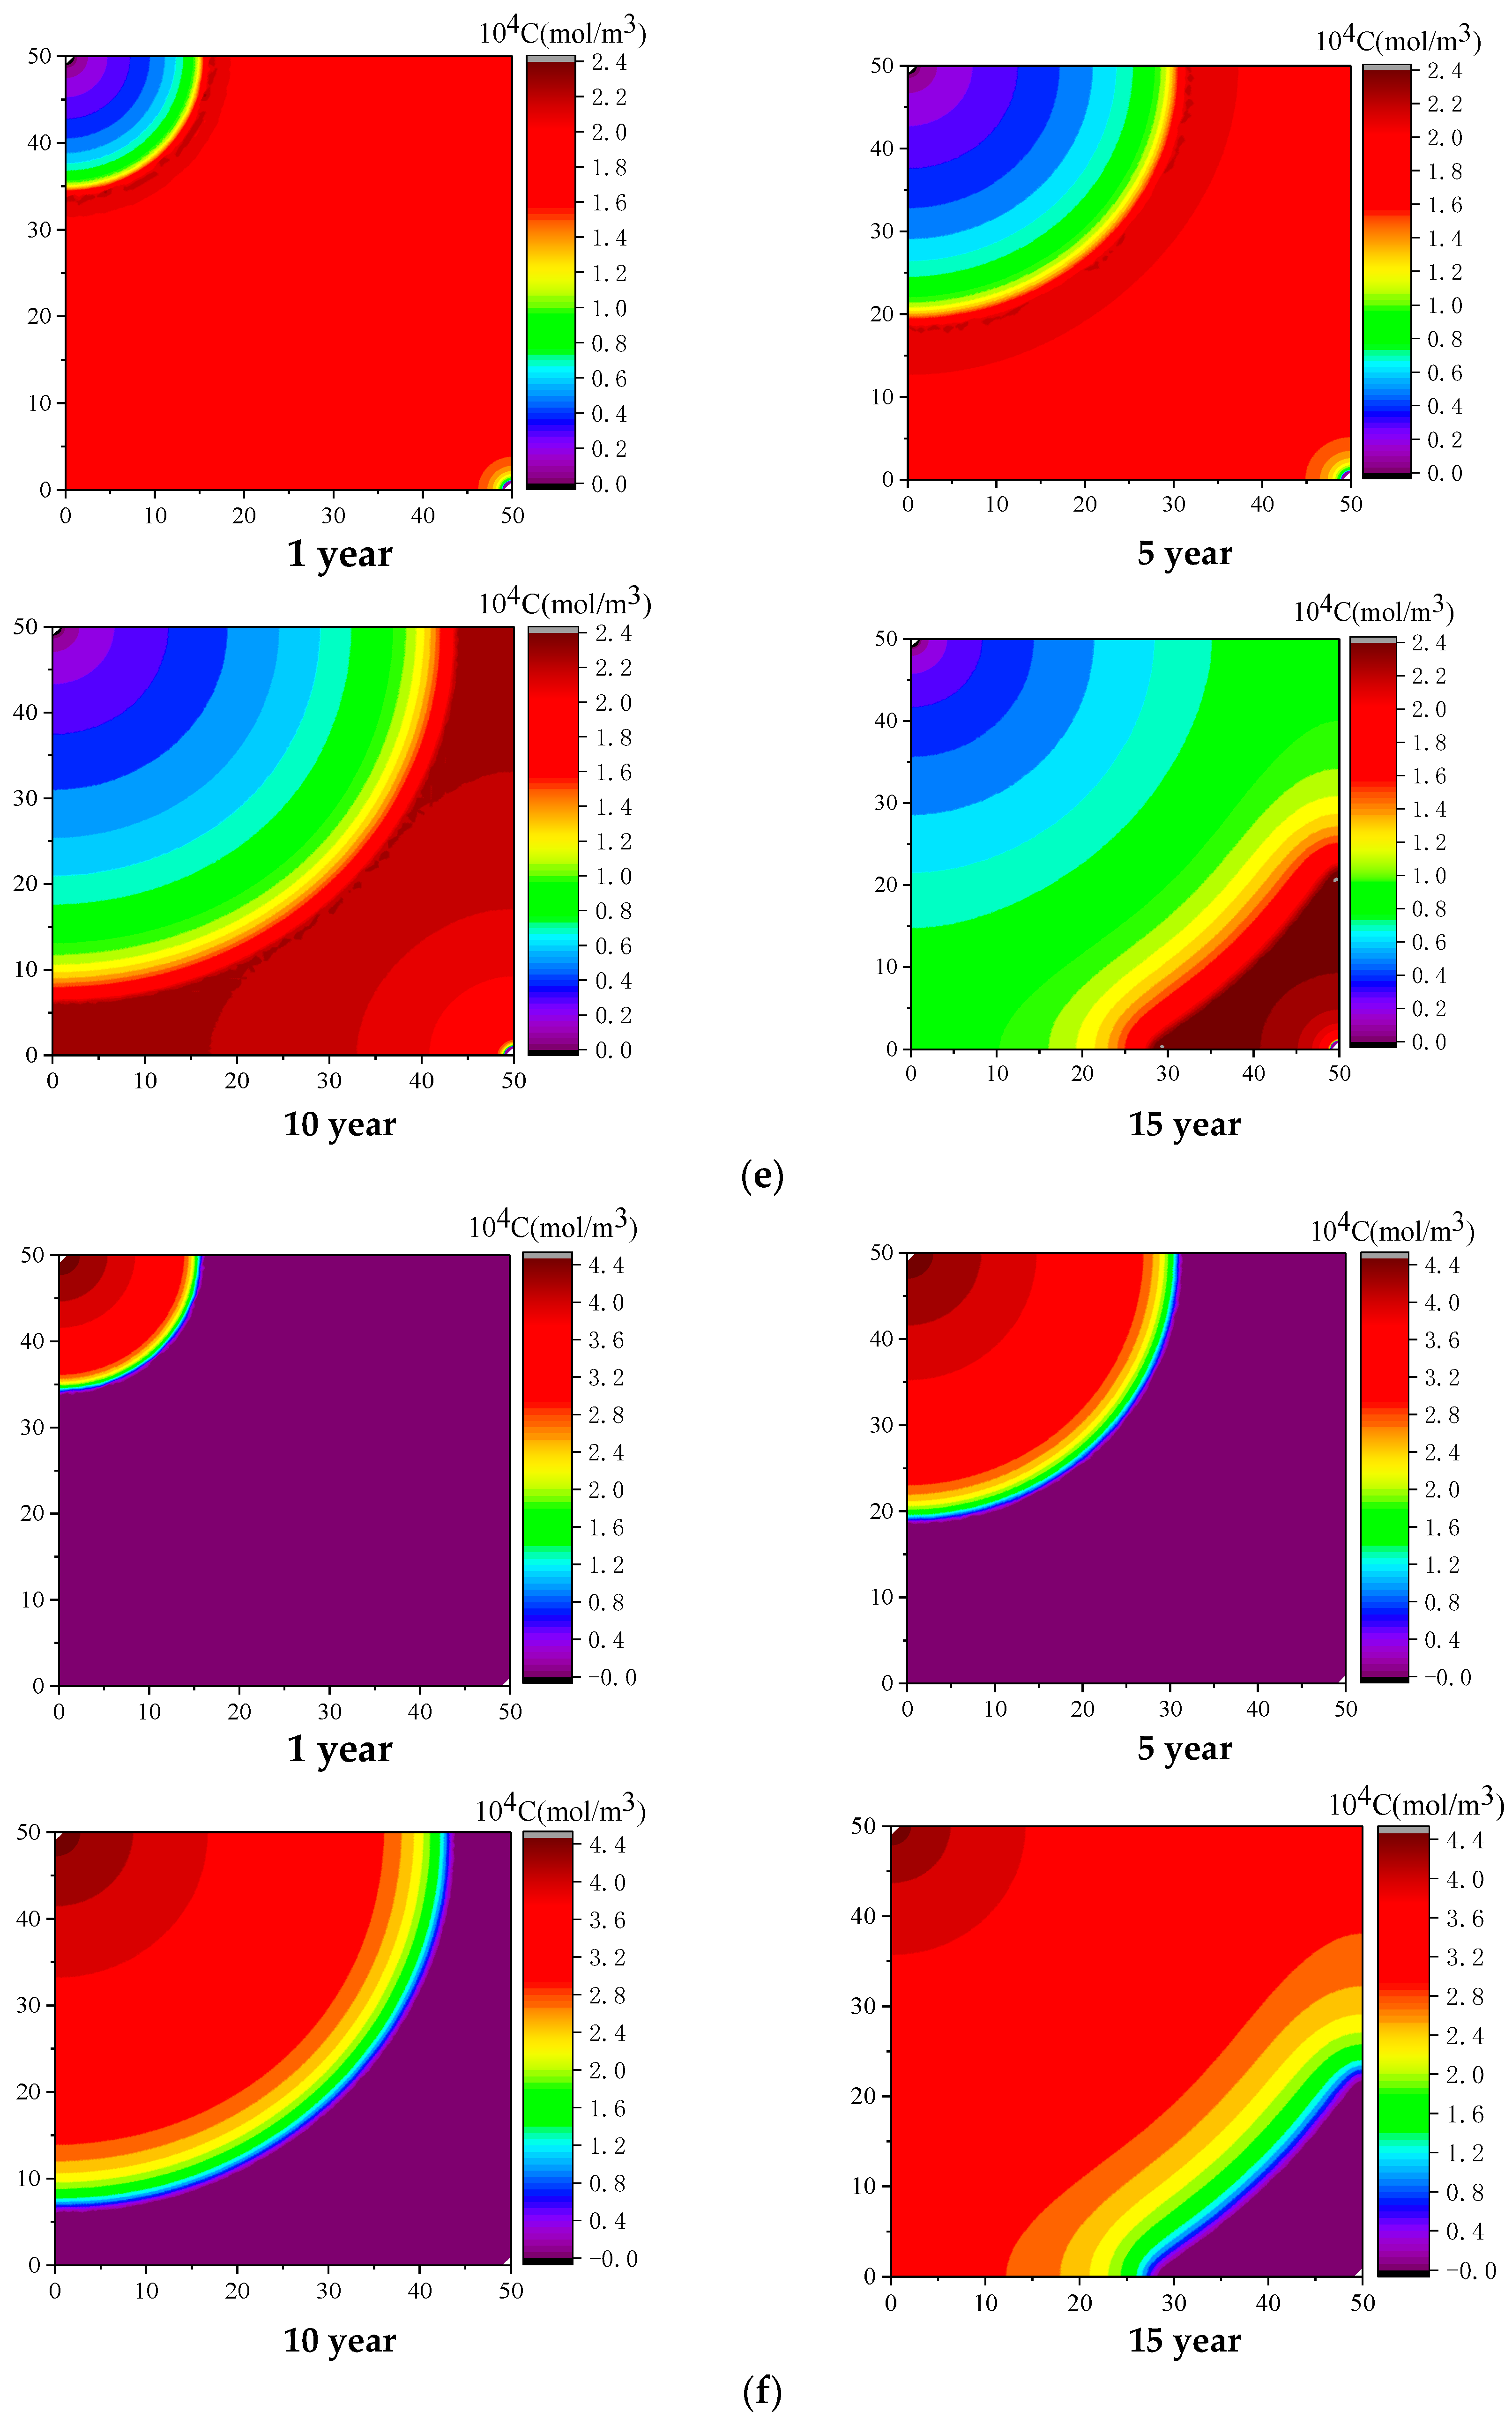
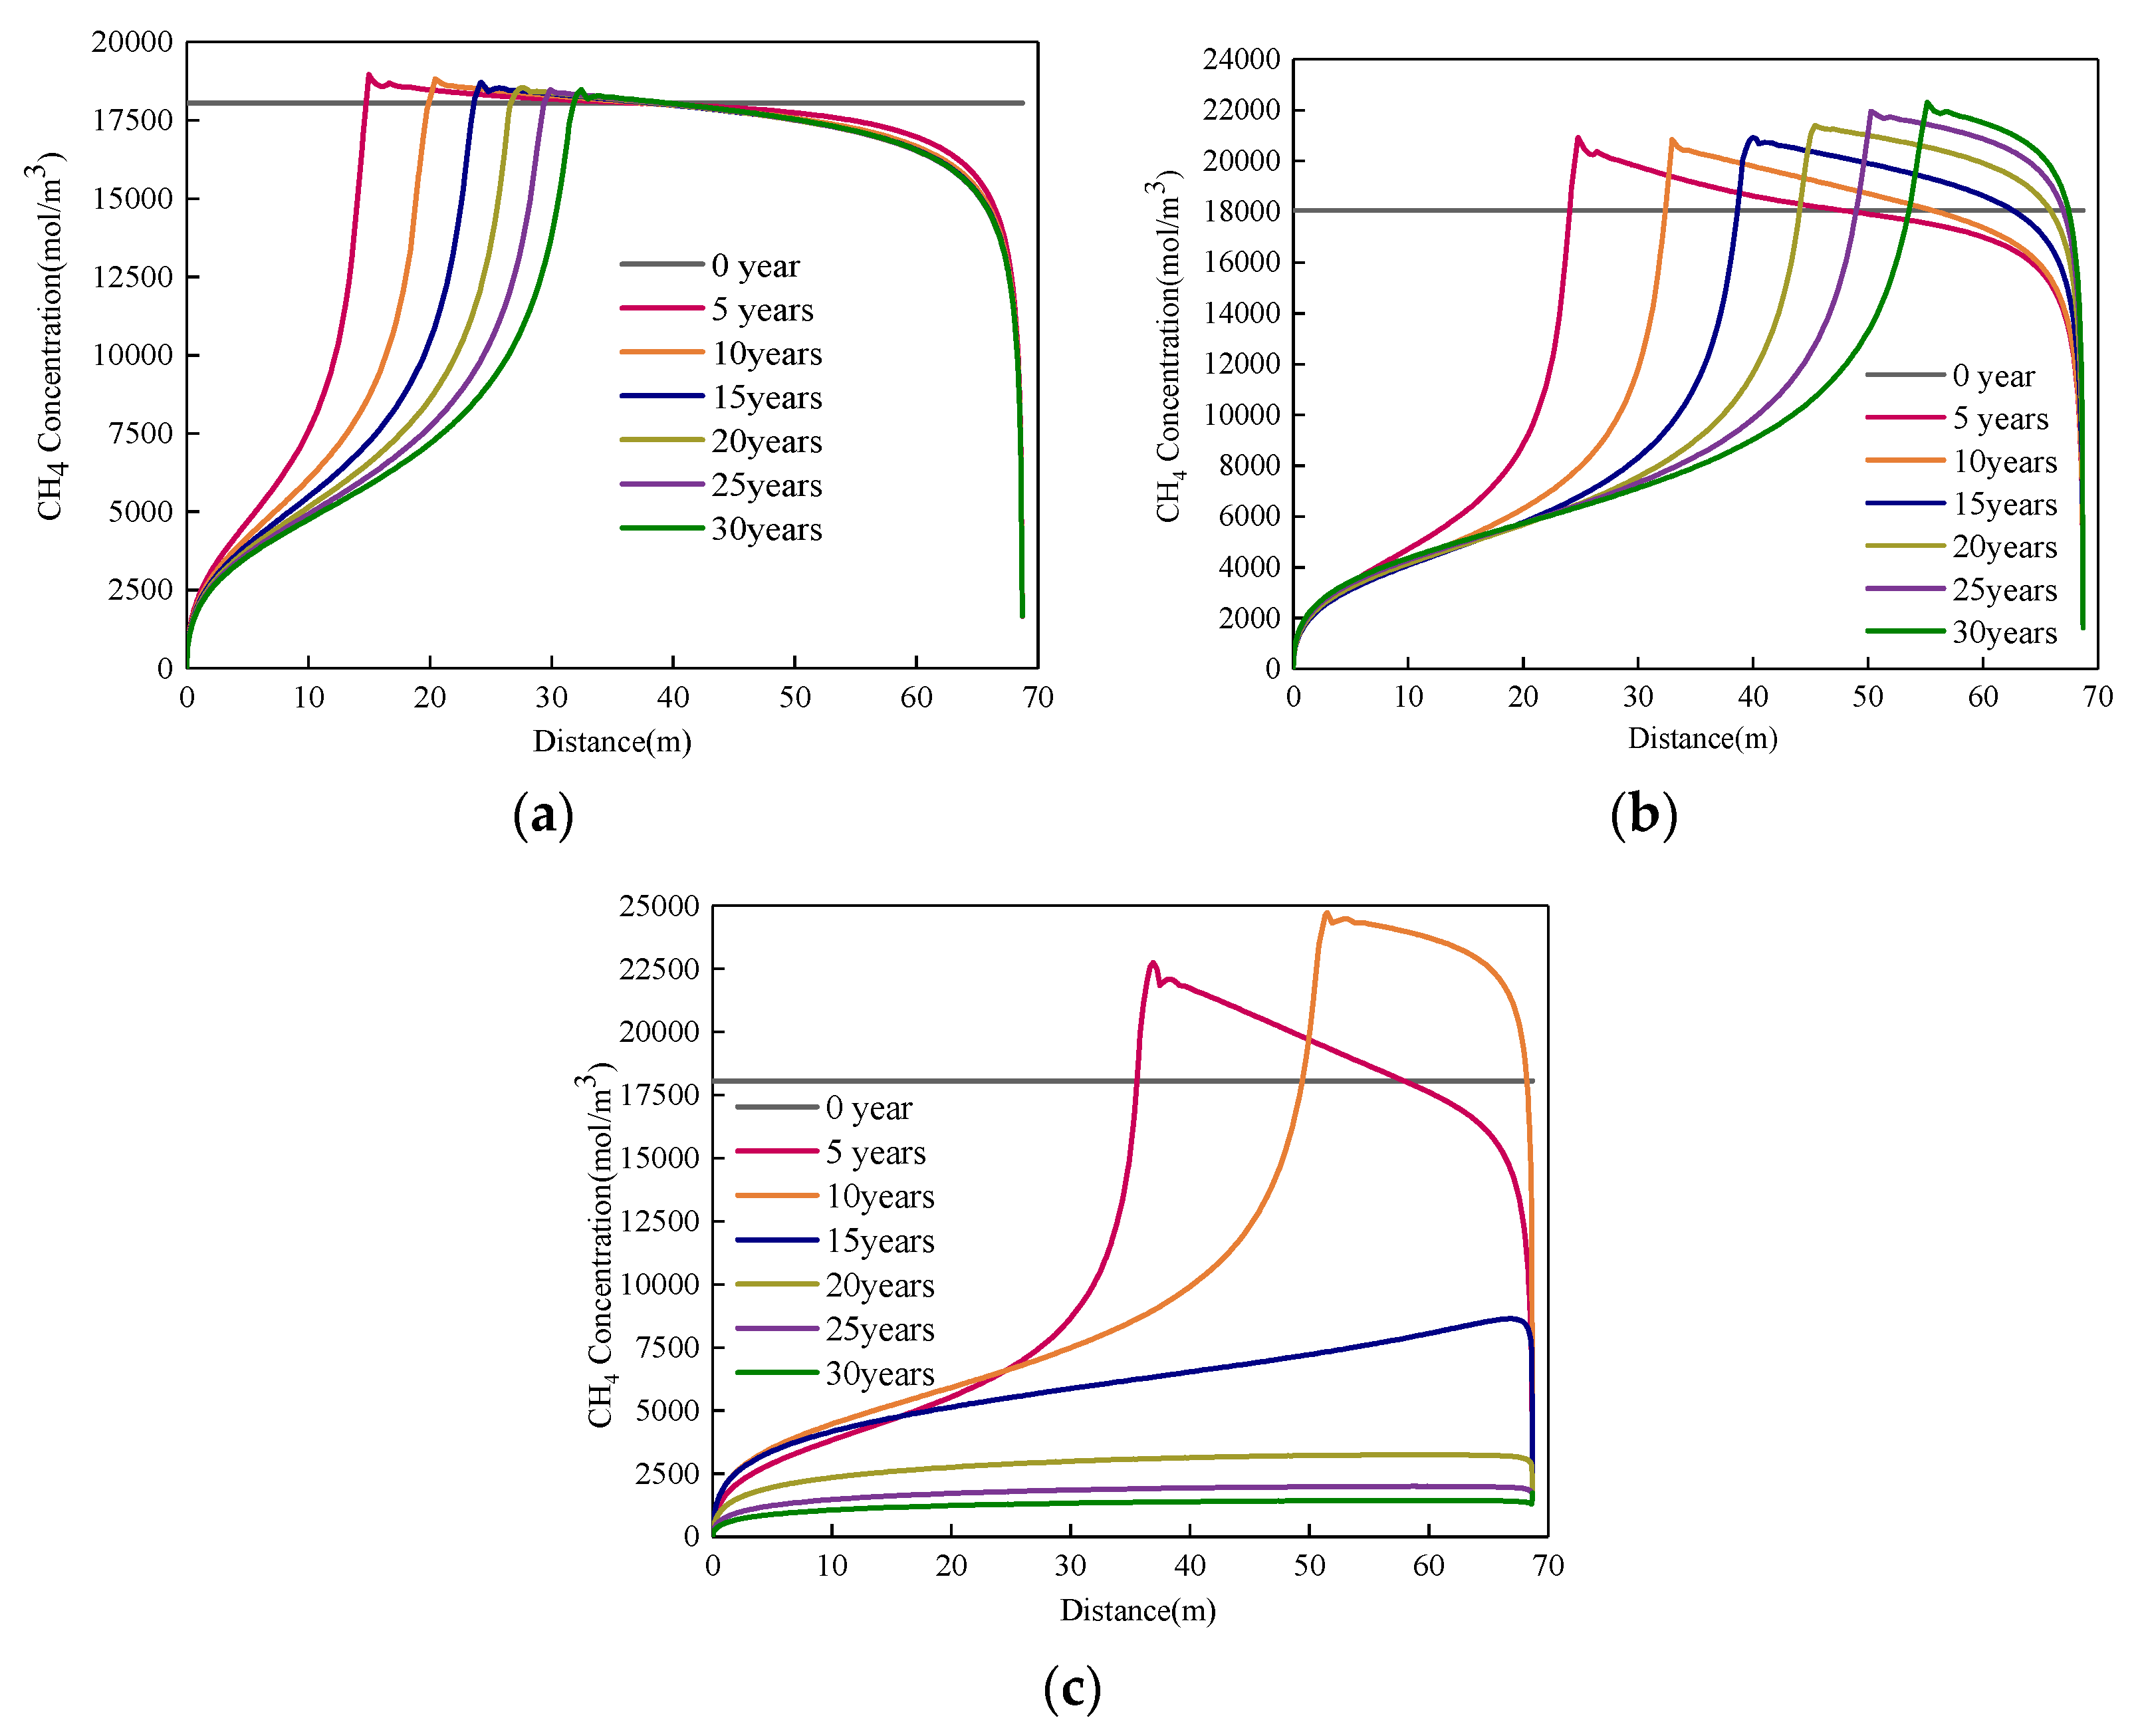
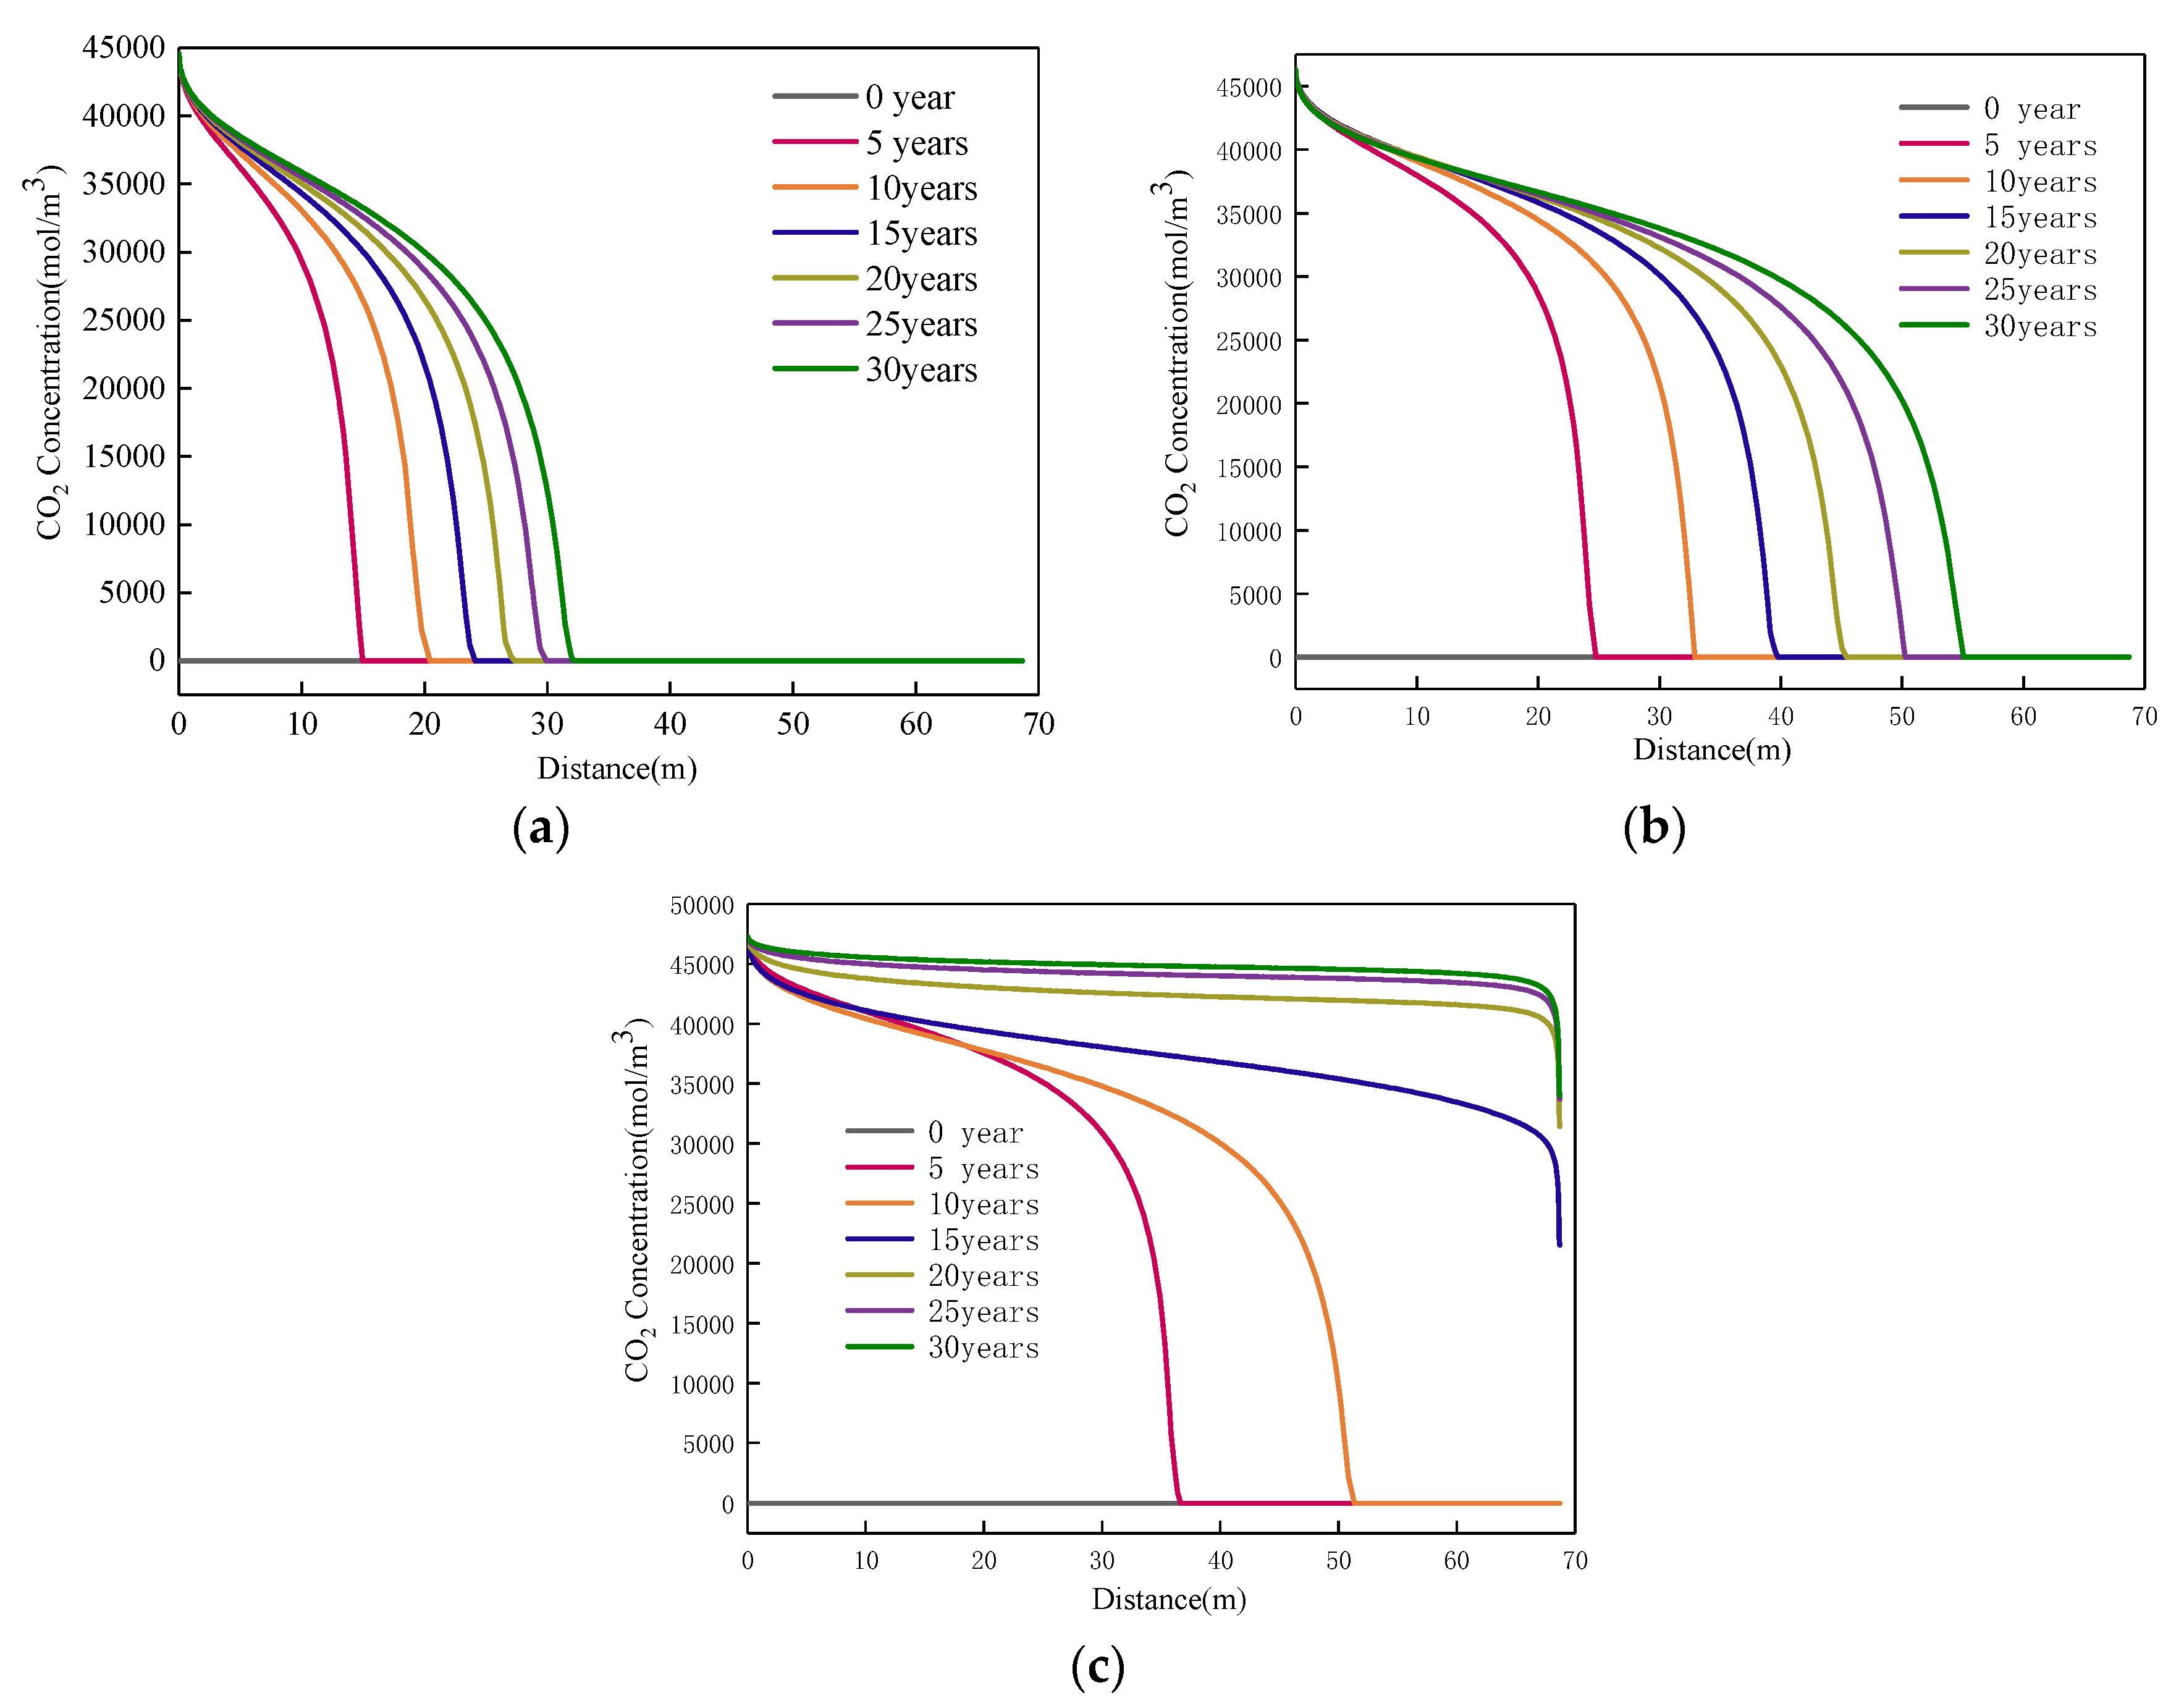
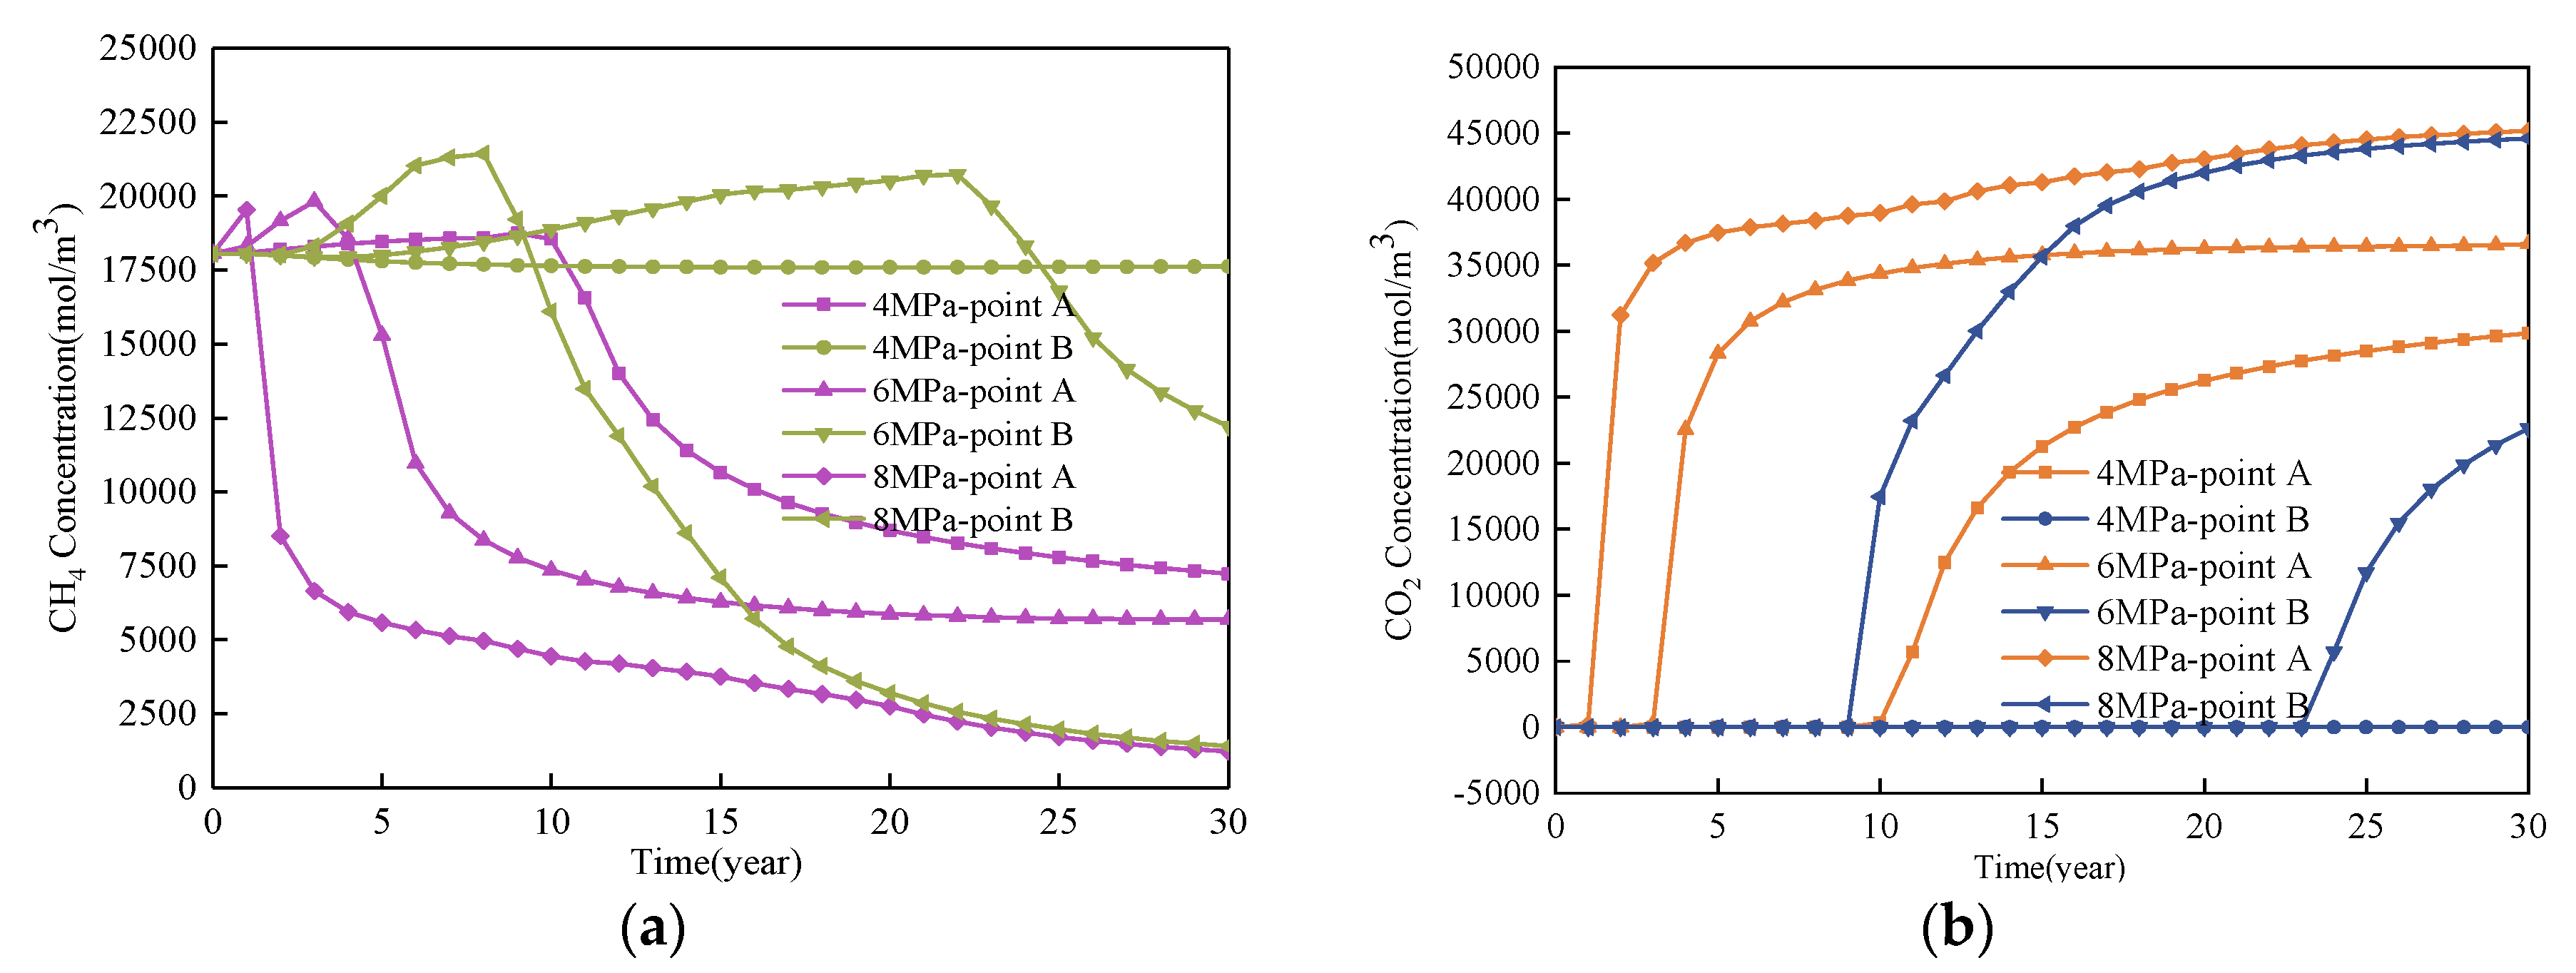
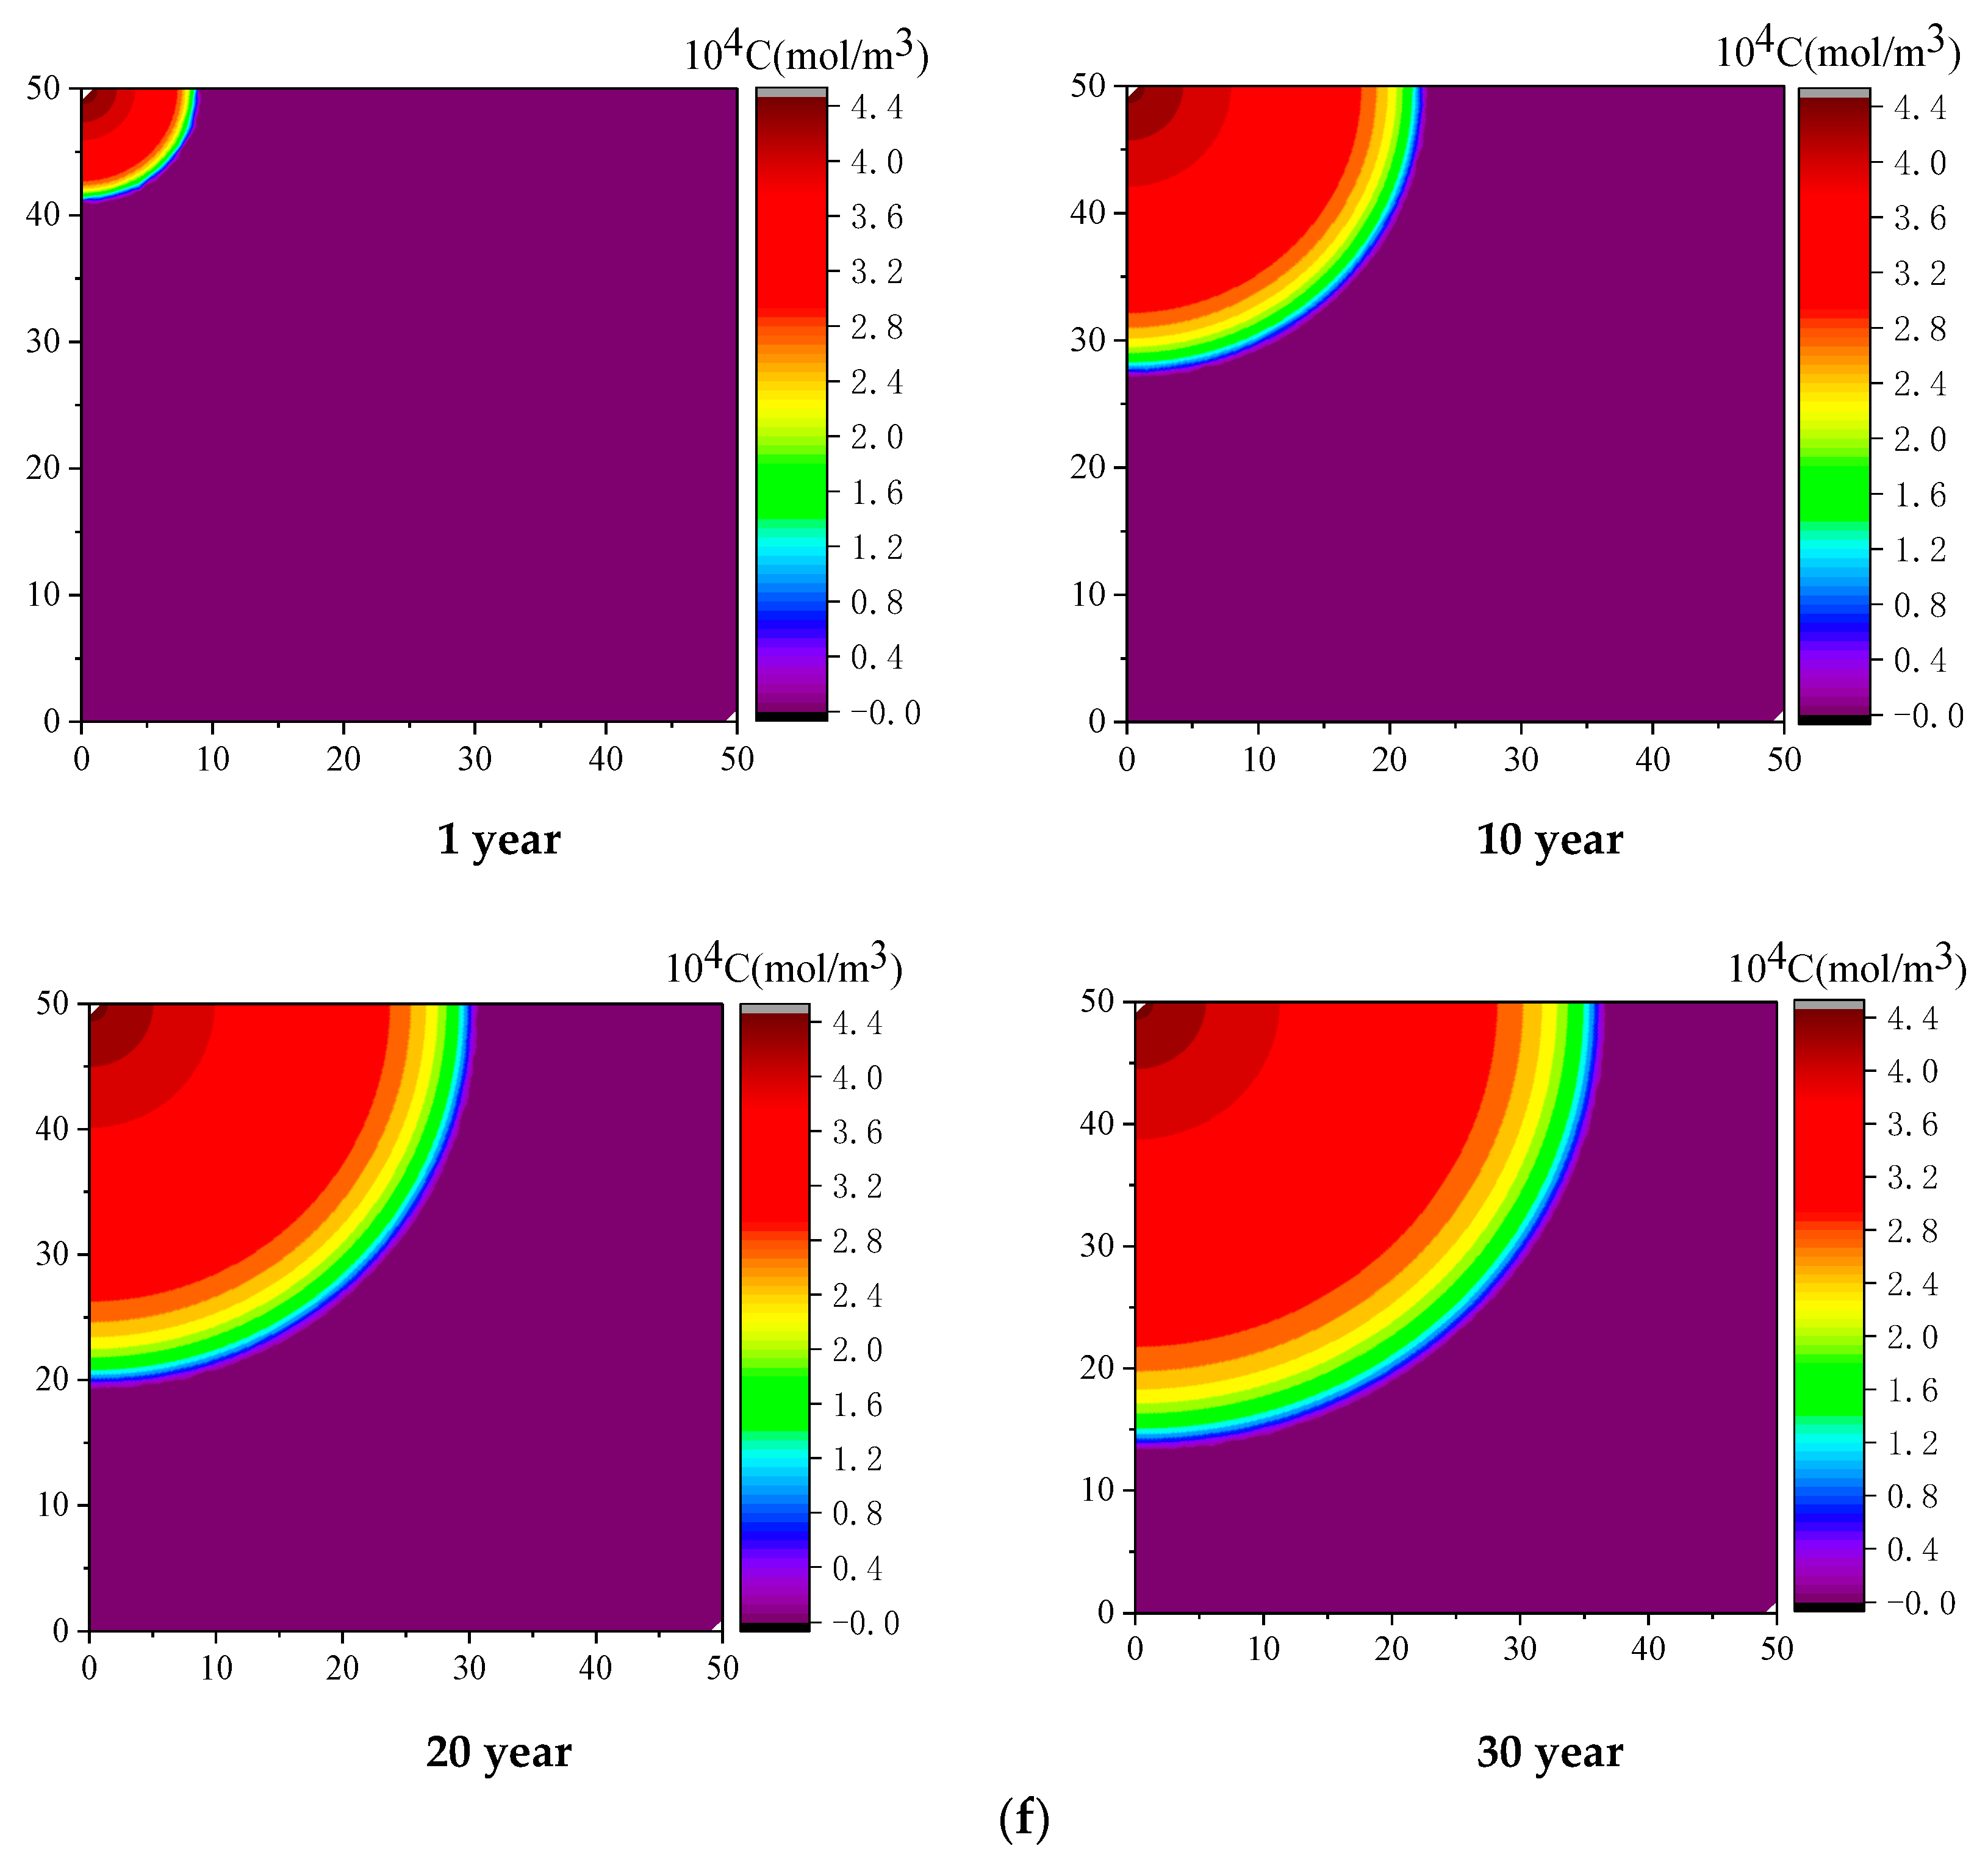
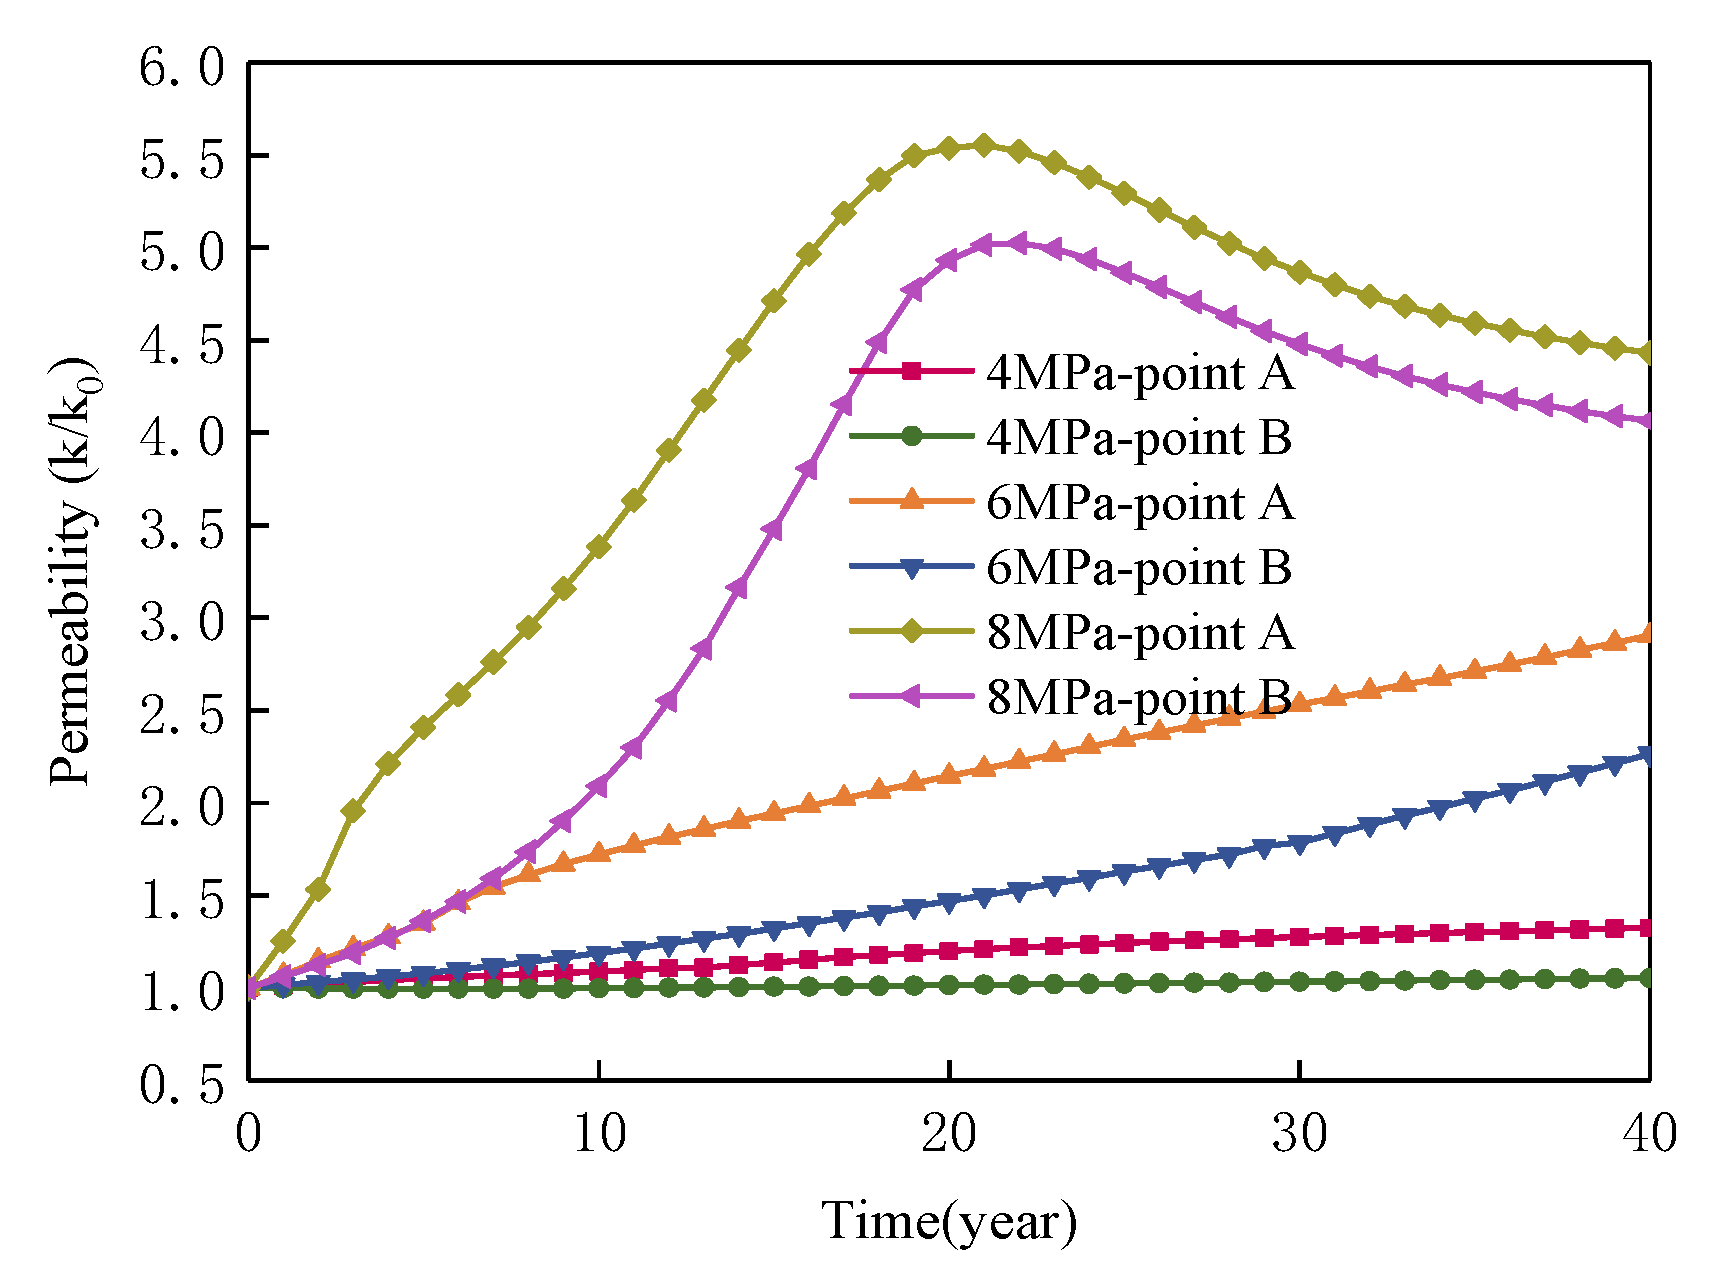
4.1. Effect of Injected CO2 Pressure on CO2-ECBM

According to [25,26], hydraulic–mechanical–thermal coupled model of CO2-ECBM can effectively reveal the influence of CO2 storage on CH4 production. Therefore, we investigate the distribution rule of CO2 and CH4 molar concentrations in CBM over a period of 30 years to study the effect of CO2 injection pressure on CO2-ECBM at constant temperature and variable pressure. The injected CO2 pressures are 4, 6, and 8 MPa, and the initial temperature of the coal seam is 273 K. Figure 3 shows the migration relationship of CH4 and CO2 molar concentration with time under injected CO2 of variable pressure.
Figure 3 shows the migration of CH4 and CO2 molar concentration with time under different injected CO2 pressures. Figure 3a,c,e shows CH4 molar concentration when the injection pressure is 4, 6, and 8 MPa, respectively. It can be seen that the CO2 injection pressure significantly affects the displacement and migration rate of CH4. Moreover, higher CO2 injection pressures are associated with faster CH4 migration rates and lower molar concentrations. Figure 3b–f shows the molar concentration of CO2 when the injection pressure is 4, 6, and 8 MPa, respectively. Increasing the injection pressure and time leads to an increase in influence radius and molar CO2 concentration in the coal seam. After 30 years of production, when the injection pressure is 4 and 6 MPa, the influence radius of CO2 is 32 and 55 m, respectively. CO2 reaches the producing well 17 years after production at an injection pressure of 8 MPa. The results are basically consistent with [25,26].
Figure 4 shows the variation of CH4 molar concentration per unit volume of the diagonal with time. The CH4 molar concentration increases from the injection well to the displacement front and reaches the maximum value at the latter. The same results can be obtained from the displacement front to the production well because the displacement front is the area with the greatest gas pressure caused by migration. At a certain point along the diagonal of the model, longer displacement times are associated with low CH4 molar concentrations, and higher injection pressures are associated with faster CH4 migration and lower molar concentration. After the injected CO2 pressure reaches 8 MPa for 30 years, the maximum molar concentration of CH4 in the coal seam is 1.42 × 10³ (mol/m3), and the production rate is 92%.
Figure 5 shows the variation of CO2 molar concentration per unit volume of the diagonal with time. Shorter distances from the injection well are associated with greater amounts of CO2. There is no CO2 from the displacement front to the production well. For a certain point along the diagonal, a longer displacement time and injection pressure lead to more CO2 entering the coal seam. The results are basically consistent with [27].
Figure 6a shows the change of CH4 molar concentration with time at points A and B simultaneously under different CO2 injection pressures. The CH4 molar concentration near the injection well A is lower than that far away from the injection well B, and higher injection pressures are associated with higher CH4 displacement per unit volume. Figure 6b shows the change of CO2 molar concentration with time at points A and B under different injection pressures. Higher pressures are associated with faster CO2 migration speeds and higher CO2 molar concentrations. The displacement occurs first near the injection well. Increasing displacement time shows increased CO2 molar concentrations in the coal seam.
The above analysis shows that high injection pressures are associated with faster gas seepage in the coal seam. CO2 reserves and CH4 production both increase with increasing injected CO2 pressure.

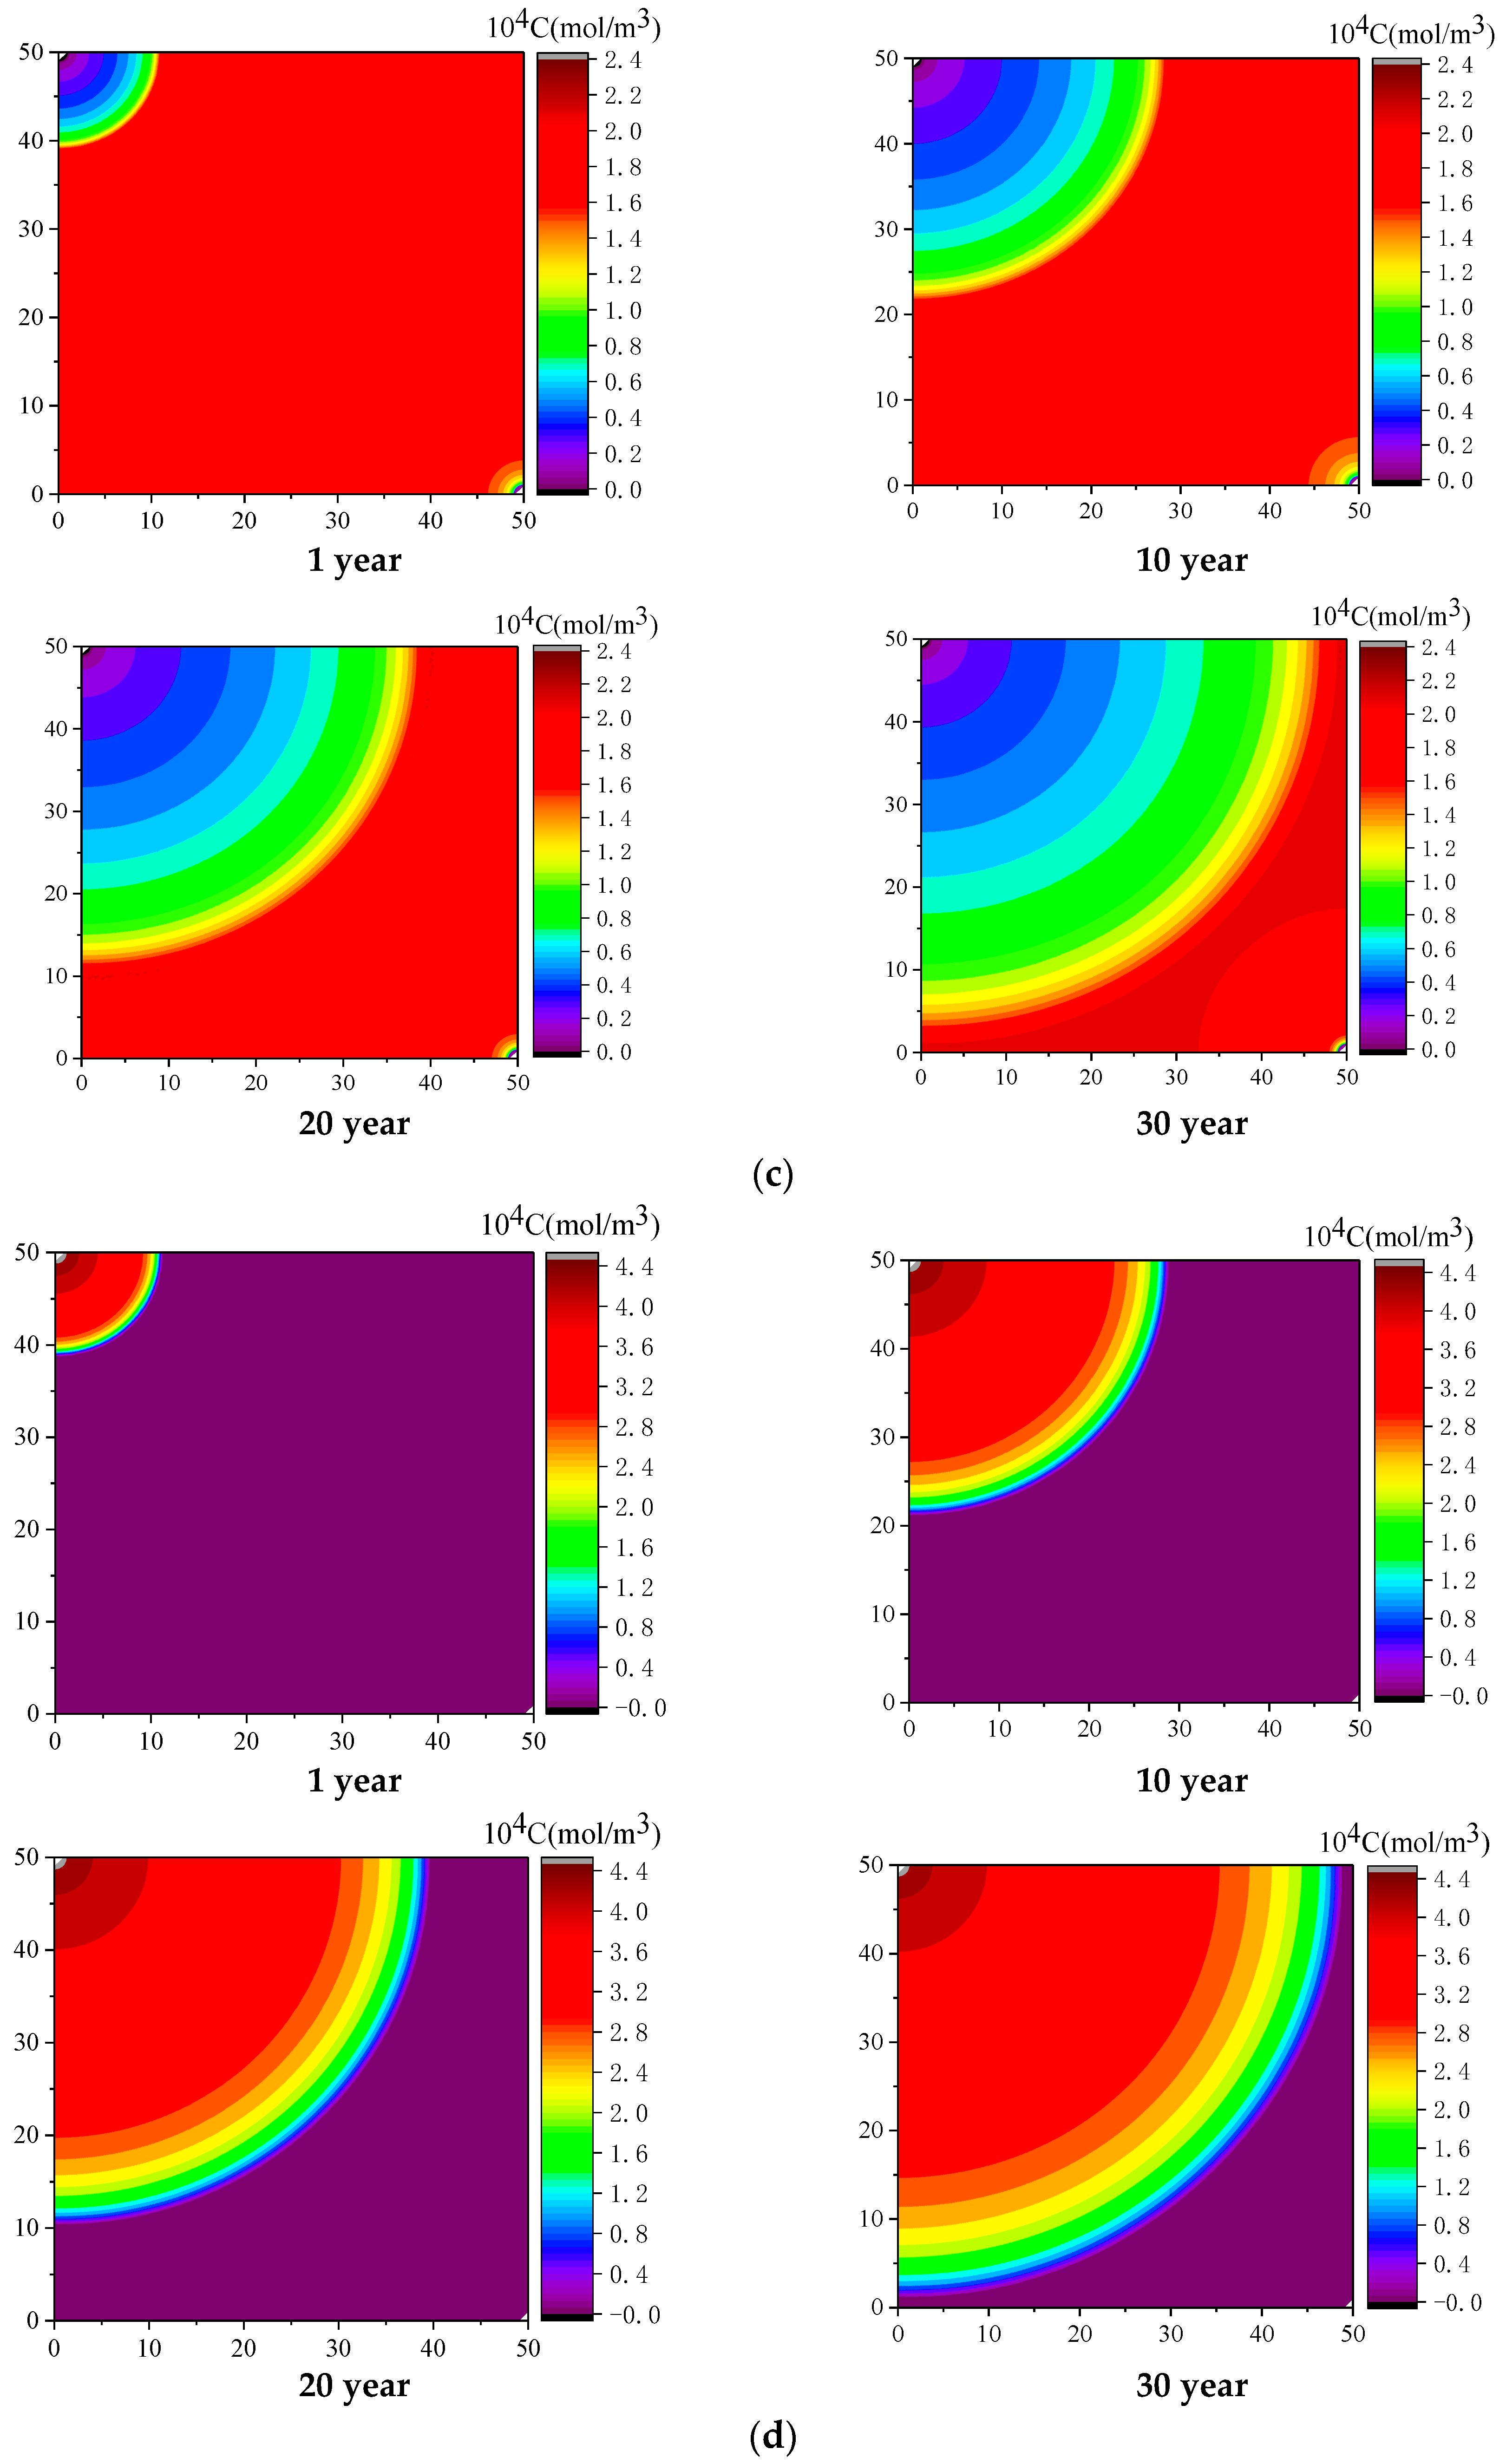
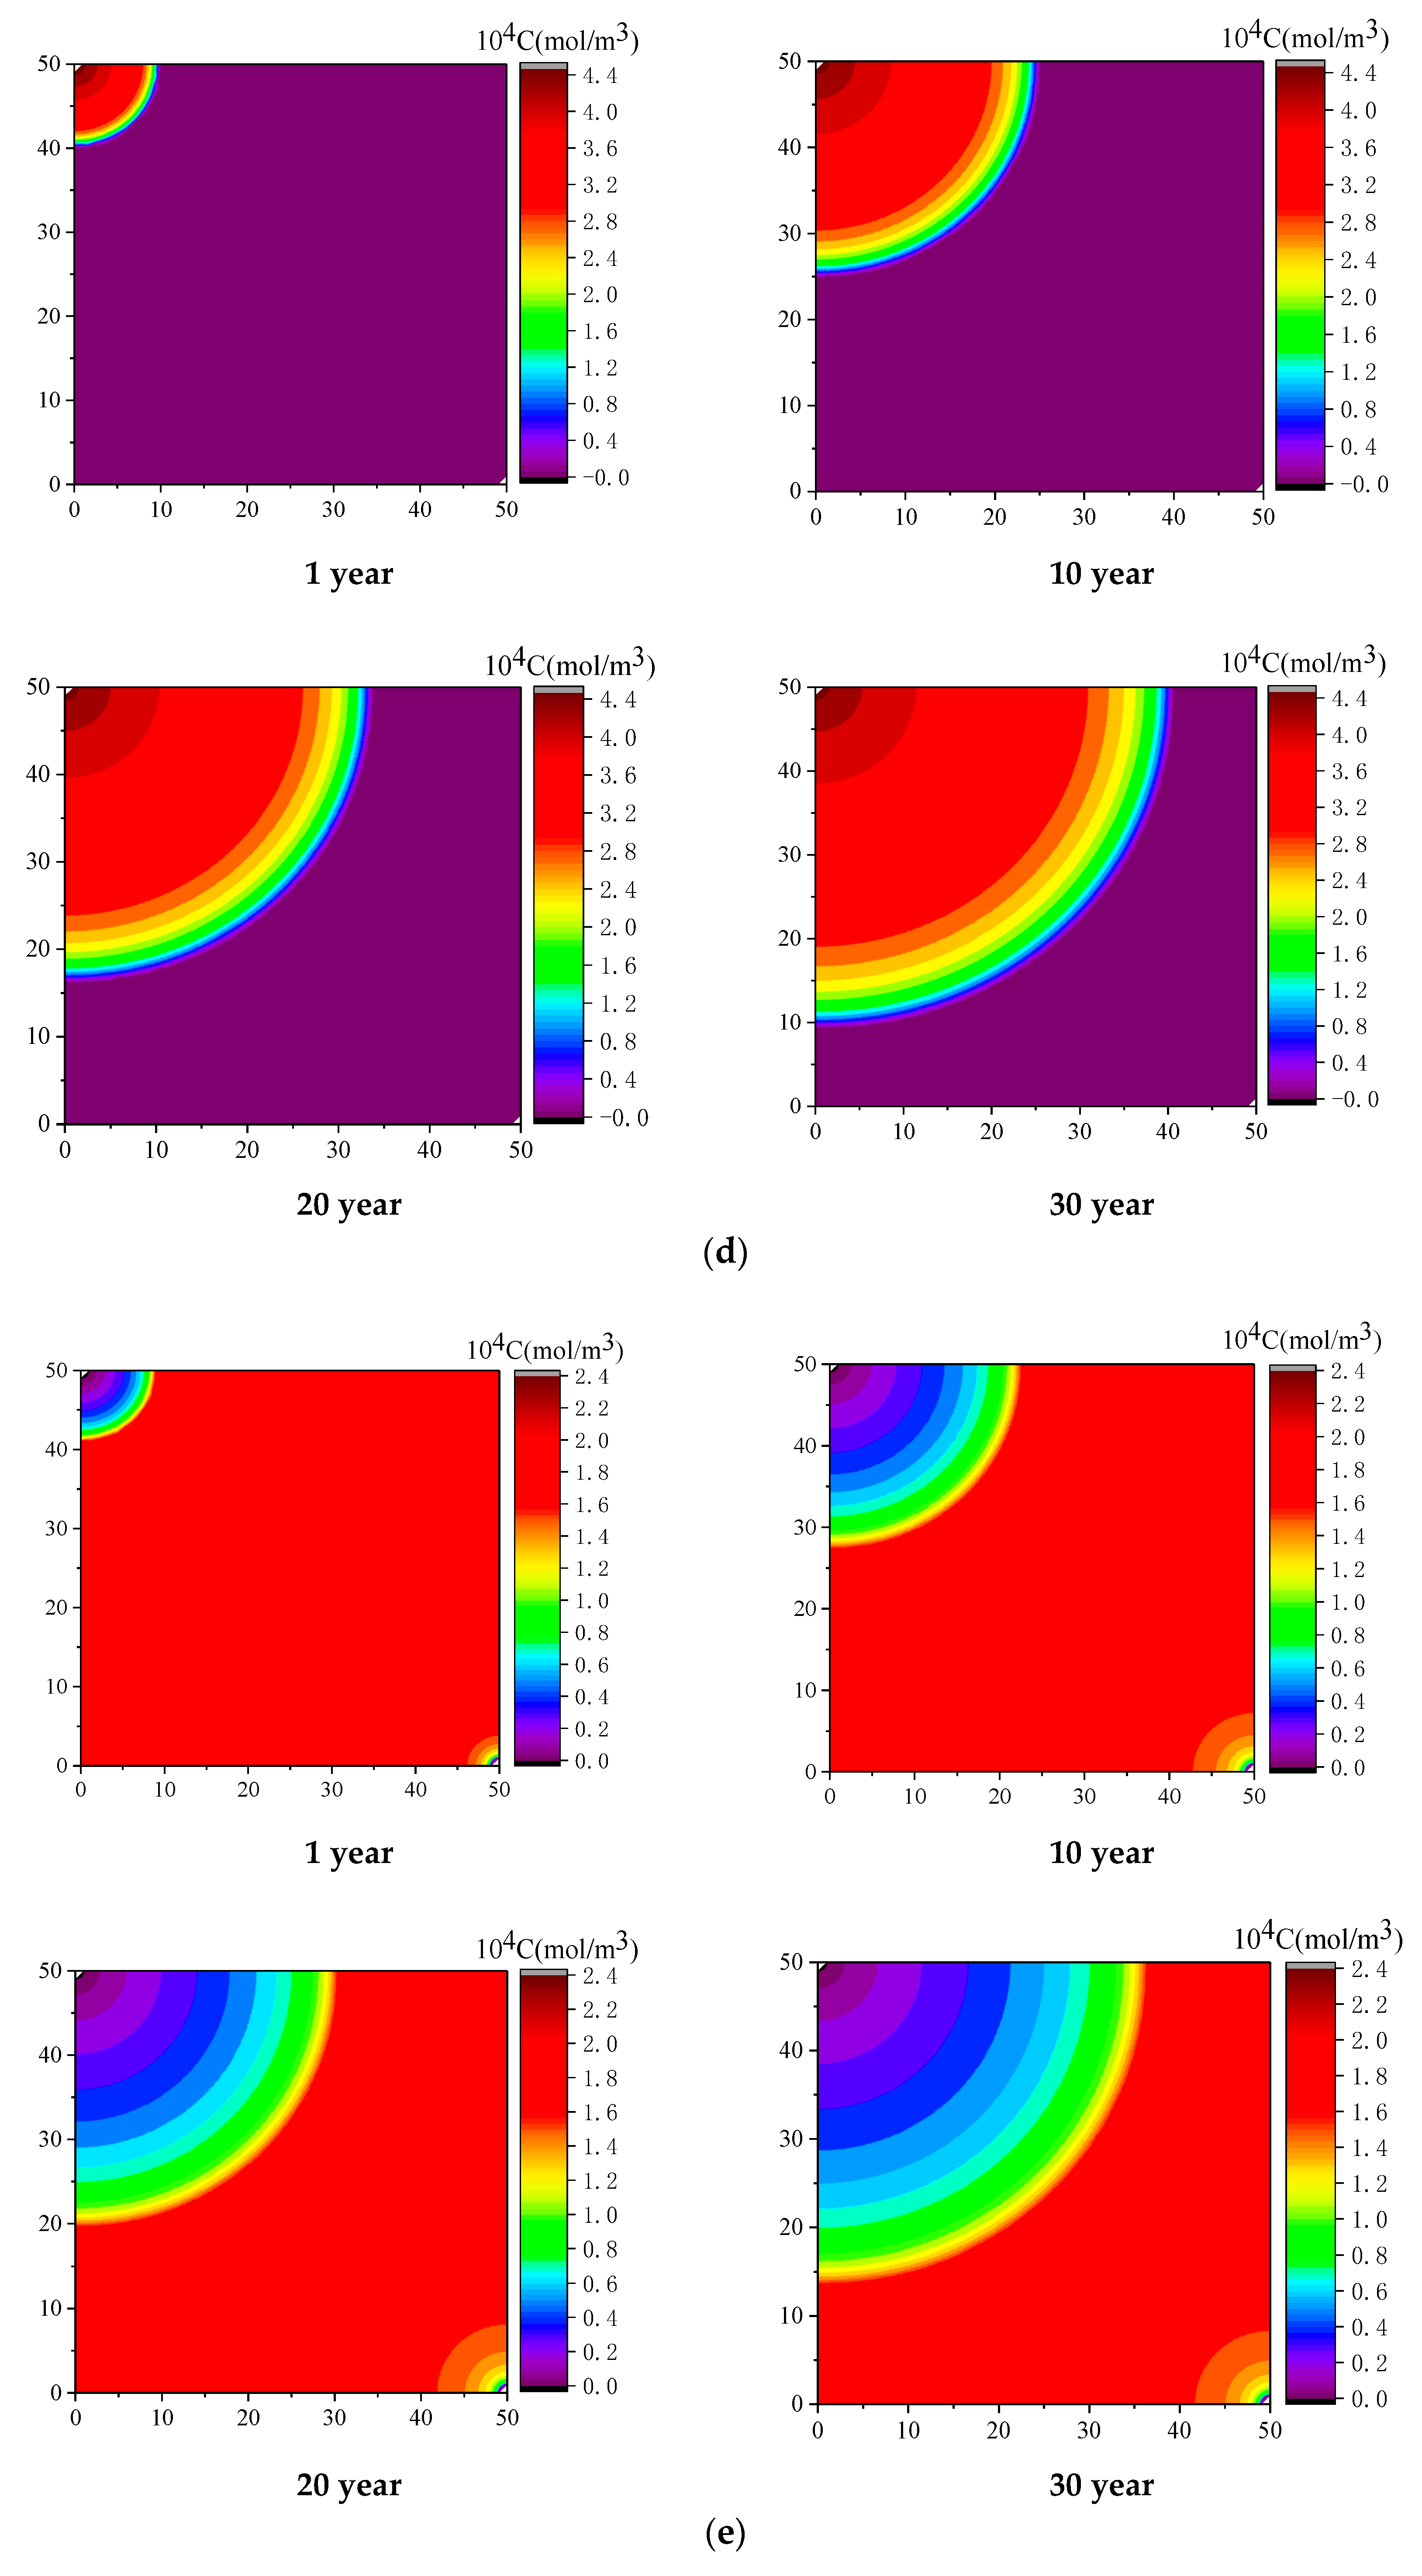
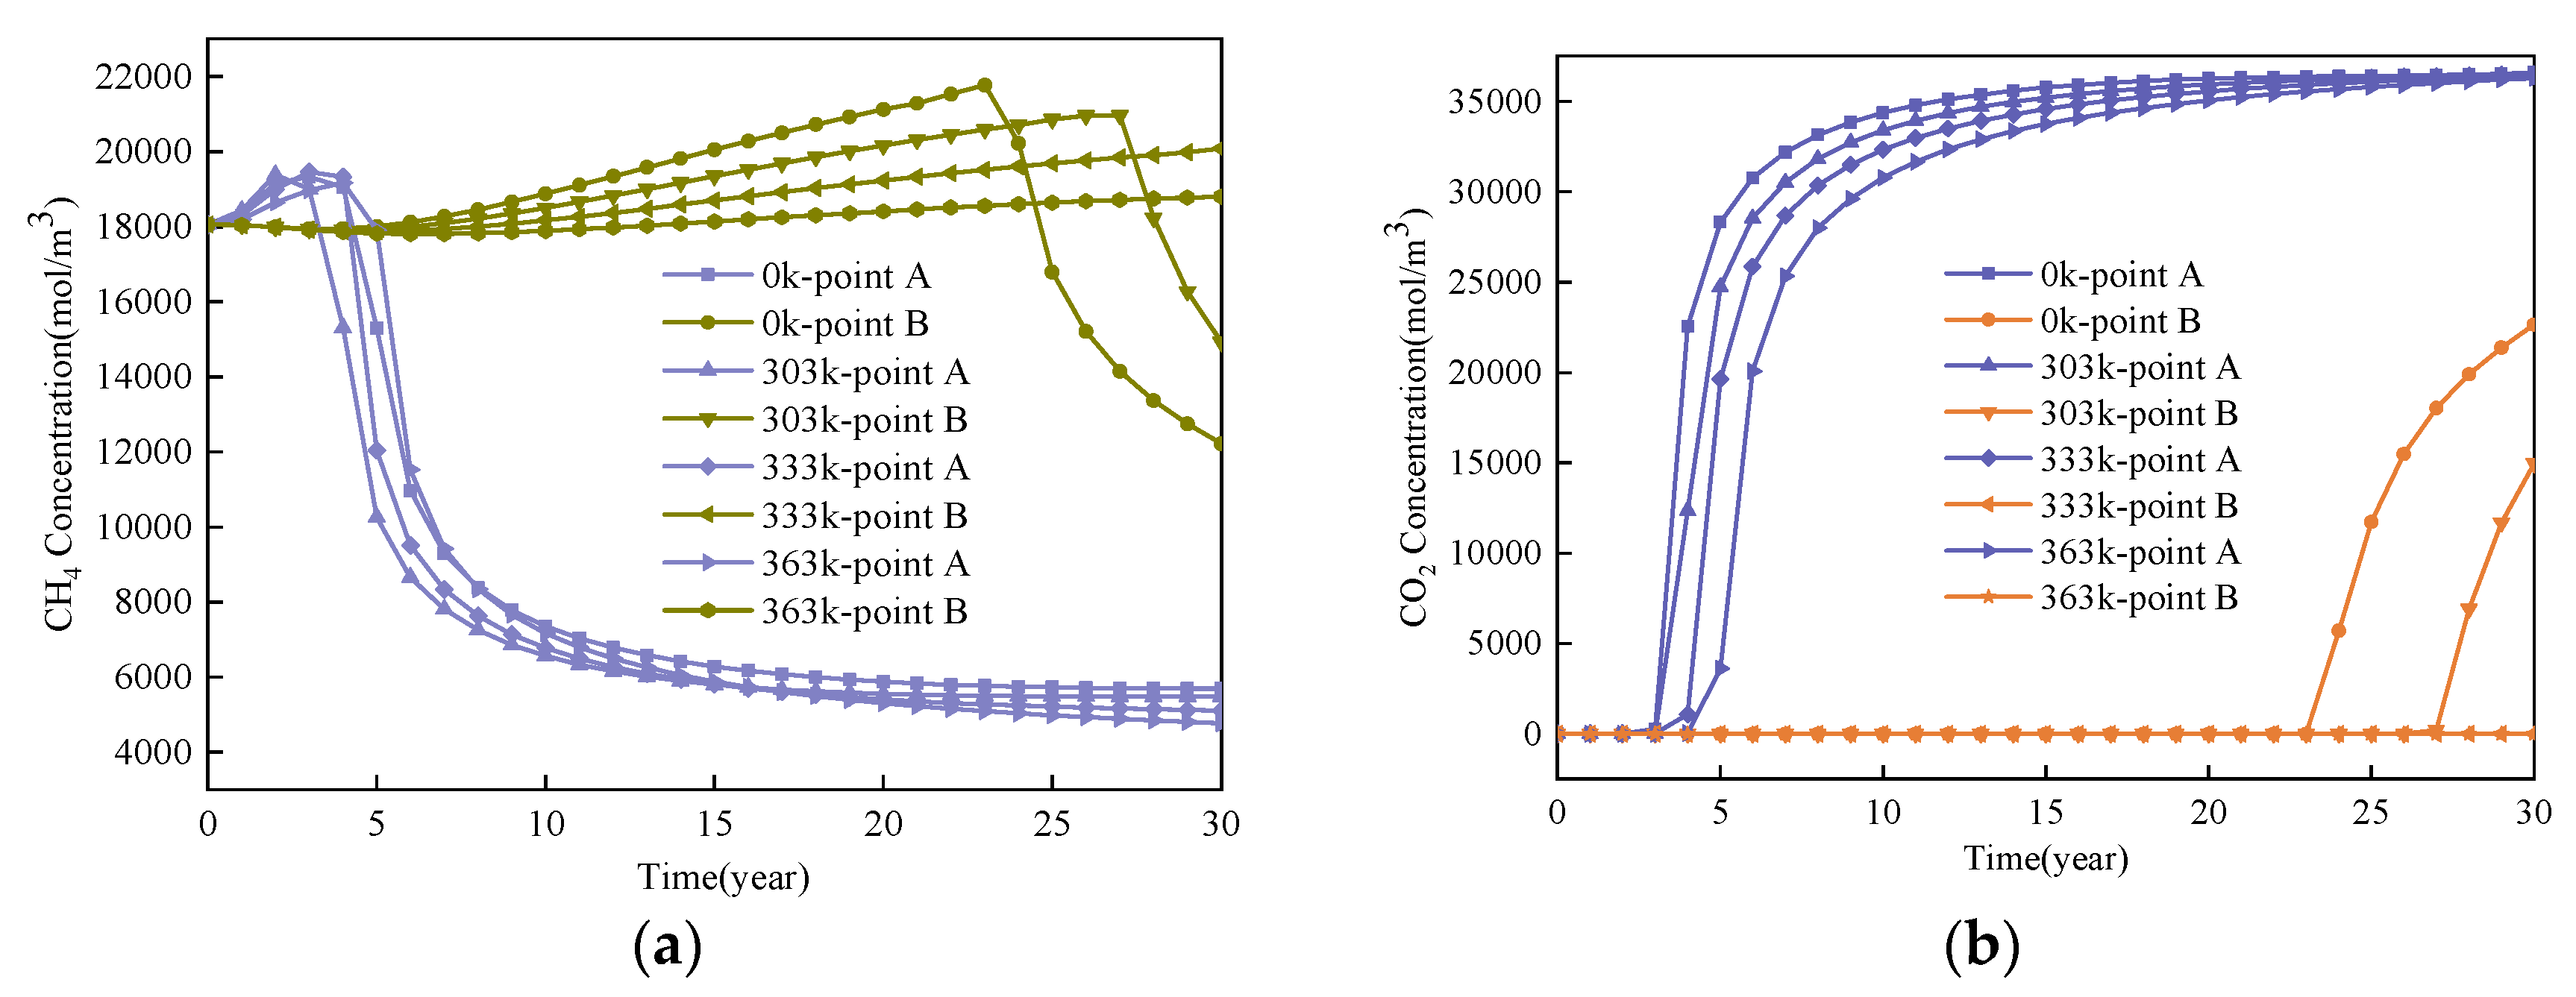
4.2. Effect of Injected CO2 Temperature on CO2-ECBM

To study the effect of CO2 injection temperature on CO2-ECBM, CO2 with different temperatures is injected into the coal seam at a fixed pressure, and the distribution rule of CO2 and CH4 mole concentrations in CBM over 30 years is investigated. The CO2 injection temperature is 303, 333, and 363 K, and the pressure of the coal seam is 6 MPa. Figure 7 shows the migration relationship of CH4 and CO2 molar concentration with time under different CO2 injection temperatures.
Figure 7a,c,e shows the molar concentrations of CH4 at different temperatures under a CO2 injection pressure of 6 MPa. The production of CH4 decreases with increasing injection well temperature. After 30 years of heating injection and production, the displacement radius of CH4 at high temperature is smaller than that at low temperature. Figure 7b,d,f are the molar concentrations of CO2 at different temperatures, also under an CO2 injection pressure of 6 MPa. After 30 years of heating, the diffusion rate of CO2 decreases with increasing temperature, which makes the molar concentration of CO2-ECBM lower at a high temperature than that at a low temperature under the same pressure.
Figure 8 shows the molar concentrations of CH4 and CO2 at points A and B at different temperatures under a CO2 injection pressure of 6 MPa. The molar concentration of CH4 at point A at high temperature is lower than that at low temperature, and the law of the molar concentration of CO2 at point A is the same as that of CH4. After 30 years of injection and production, the CH4 molar concentration at point B is higher at high temperature than at low temperature, while the CO2 molar concentration is lower than at low temperature. This is because to the coal seam under rising temperature undergoes matrix expansion and decreased permeability. The migration rate of CO2 decreases owing to the low permeability, which allows it to fully displace CH4 from the coal seam, but permeability is further reduced at high temperature as a result of CH4 in the coal seam. The molar concentration of CH4 production increase is therefore not apparent.
Figure 9 shows the changes in permeability ratio of monitoring points A and B when the CO2 injection pressure is 4, 6, and 8 MPa. The permeability ratio of monitoring points A and B increases over 40 years when the CO2 injection pressure is 4 and 6 MPa. When the injection pressure is 8 MPa, the permeability ratio initially rises and then declines, and higher injection pressures are associated with higher permeability ratios. This is because the higher injection pressures lead to the full displacement of CH4 in the coal seam, higher desorption, and higher pore shrinkage of the coal matrix promotes the increase of coal seam permeability. CH4 desorption decreases in the later stage of injection owing to the large amount of CO2 absorbed in the coal seam. The swelling effect of the coal matrix is greater than the pore shrinkage and permeability decreases [43,44,45,46].
Figure 10 shows the change of permeability ratio of the monitoring points at different temperatures when the CO2 injection pressure is 6 MPa. Permeability decreases with increasing injection temperature. This is because high temperatures increase the molecular free energy of CO2 and CH4, binary gas molecules become active, CO2 is not easily adsorbed, and the expansion rate of the coal matrix decreases, leading to reduced permeability.

5. Conclusions

We established a thermal–hydraulic–mechanical coupling model of binary gas seepage and diffusion and analyzed the factors influencing conventional production and CO2-ECBM. The results are summarized as follows:
(1)
Higher CO2 injection pressure is associated with higher gas seepage velocities. CO2 reserves and CH4 production increase with increasing CO2 injection pressure. When the injected CO2 pressure is 8 MPa, the storage capacity of CO2 is the highest, the radius of effected by CO2 injection of 5, 10 and 30 years are 31, 44, and 58 m, respectively. After 30 years with injected CO2 pressure of 4, 6, and 8 MPa, the productivity of CH4 in the coal seam is 28%, 43%, and 92%, respectively. Therefore, storage of CO2 and production of CH4 can be significantly increased by increasing pressure.
(2)
Coal seam temperature has a significant impact on CO2-ECBM. Under the same CO2 injection pressure, CO2 reserves, CH4 production, and coal seam permeability all decrease with increasing coal seam temperature. The coal seam matrix shrinks at the beginning due to the desorption of CH4, and then it expands due to the adsorption of CO2 and high temperature. This hinders the seepage and displacement of CO2. Therefore, reserve of CO2, production of CH4, and permeability of coal seam all decrease with increasing coal seam temperature. When the injected CO2 temperature is 363 K, the storage capacity of CO2 is the lowest, the radius of effected by CO2 injection of 10, 20, and 30 years are 22, 30, and 36 m, respectively. After 30 years with injected CO2 temperature of 303, 333, and 363 K, the productivity of CH4 in the coal seam is 25%, 22%, and 20%, respectively. The radius of effected by CO2 injection reduces 10 m when the temperature of CO2 injection increases from 303 to 363 K. Therefore, high temperatures are not conducive for CO2 displacement of CH4, and the injection temperature should be reduced.

Author Contributions

Methodology, H.L., F.C., H.J., and H.Y.; software, X.L., H.S., and H.L.; validation, F.C., H.Y., H.S., and L.X.; writing—original draft preparation, H.L. and H.Y.; writing—review and editing, H.S., H.L., H.J., H.Y., and F.C.; funding acquisition, H.L. All authors have read and agreed to the published version of the manuscript.

Funding

This research was funded by the National Science Foundation of China (51774092), the China Postdoctoral Science Foundation (2016M601399) and Guiding Projects of Daqing (ZD-2019-05).

Acknowledgments

The authors thank Tao Sun (Massachusetts Institute of Technology, USA) for his help on COMSOL application.

Conflicts of Interest

The authors declare no conflict of interest.

Abbreviations

The notations are introduced as follows:
G The shear modulus, Pa
K The bulk modulus of coal, Pa
E The Young’s modulus, Pa
K S Bulk modulus of coal skeleton
V m Molar constant of gas
R Universal gas constant, J/mol·k
P i Gas pressure, MPa
T Temperature of the coal, K
θ P Y Stress coefficient caused by gas pressure
θ P X Stress coefficient caused by gas adsorption
θ T Coefficient of thermal stress
q g Seepage velocity(m3/s)
J i Diffusion component of single phase
D i Diffusion coefficient of single phase, m2/s
m i Gas mass of each component, kg
c i Molar concentration of a single component, mol/m3
k Permeability, m2
Q S Source term, kg/(m3·s)
M i Molar mass of each component, kg/mol
d Q H Heat source for thermal expansion
d U The internal energy per unit volume
C V Specific heat at constant volume of coal seam
Q d i s Differential heat source.
V S 0 Initial volume of coal skeleton
Δ V S The coal skeleton volume changes
Δ V S P Bulk expansion and deformation of coal caused by pressure
Δ V S T Bulk expansion and deformation of coal caused by temperature
k 0 The initial permeability, m2
ν Poisson’s ratio
β Thermal expansion coefficient, K−1
δ i j Kronecker function
a i Langmuir volume constant, m3/kg
b i Langmuir pressure constant, Pa−1
ρ c Density of coal, kg/m3
ε T Thermal expansion strain
ε P Y Strain caused by gas pressure
ε P X Gas strain
ε i j Train component
u i j Displacement component
α Biot coefficient
σ i j Stress tensor(i, j = 1, 2)
μ i Viscosity coefficient of single phase
ρ i Density of a single component, kg/m3
φ Porosity
ρ a Density of gas at standard conditions, kg/m3
η Thermal conductivity of coal
φ 0 Initial porosity of coal
e Volumetric strain of coal
d e Effective diameter of particle

References

  1. Sun, H.; Yao, J.; Gao, S.H.; Fan, D.Y.; Wang, C.C.; Sun, Z.X. Numerical study of CO2 enhanced natural gas recovery and sequestration in shale gas reservoirs. Int. J. Greenh. Gas Control 2013, 19, 406–419. [Google Scholar] [CrossRef]
  2. Xia, T.; Zhou, F.; Liu, J.; Hu, S.; Liu, Y. A fully coupled coal deformation and compositional flow model for the control of the pre-mining coal seam gas extraction. Int. J. Rock Mech. Min. Sci. 2014, 72, 138–148. [Google Scholar] [CrossRef]
  3. Sobczyk, J. A comparison of the influence of adsorbed gases on gas stresses leading to coal and gas outburst. Fuel 2014, 115, 288–294. [Google Scholar] [CrossRef]
  4. Zhao, Y.; Feng, Y.; Zhang, X. Selective adsorption and selective transport diffusion of CO2–CH4 binary mixture in coal ultramicropores. Environ. Sci. Technol. 2016, 50, 9380–9389. [Google Scholar] [CrossRef] [PubMed]
  5. Orr, F.M. Onshore Geologic Storage of CO2. Science 2009, 325, 1656–1658. [Google Scholar] [CrossRef] [PubMed]
  6. Sreenivasulu, B.; Suresh, P.; Sreedhar, I.; Raghavan, K.V. Development trends in porous adsorbents for carbon capture. Environ. Sci. Technol. 2015, 49, 12641–12661. [Google Scholar] [CrossRef]
  7. Shahtalebi, A.; Shukla, P.; Farmahini, A.H.; Bhatia, S.K. Barriers to diffusion of CO2 in microporous carbon derived from silicon carbide. Carbon 2015, 88, 1–15. [Google Scholar] [CrossRef]
  8. Karacan, C.; Ruiz, F.A.; Michael, C.; Phipps, S. Coal mine methane: A review of capture and utilization practices with benefits to mining safety and to greenhouse gas reduction. Int. J. Coal Geol. 2011, 86, 121–156. [Google Scholar] [CrossRef]
  9. Zhou, F.; Hussain, F.; Cinar, Y. Injecting pure N2 and CO2 to coal for enhanced coalbed methane: Experimental observations and numerical simulation. Int. J. Coal Geol. 2013, 116, 53–62. [Google Scholar] [CrossRef]
  10. Liu, J.; Xie, L.; Elsworth, D.; Gan, Q. CO2/CH4 Competitive Adsorption in Shale: Implications for Enhancement in Gas Production and Reduction in Carbon Emissions. Environ. Sci. Technol. 2019, 53, 9328–9336. [Google Scholar] [CrossRef]
  11. Liu, X.; Wu, C.; Zhao, K. Feasibility and applicability analysis of CO2-ECBM based on CO2-H2O-coal interactions. Energy Fuels 2017, 31, 9268–9274. [Google Scholar] [CrossRef]
  12. Pratama, E.; Ismail, M.S.; Ridha, S. Identification of coal seams suitability for carbon dioxide sequestration with enhanced coalbed methane recovery: A case study in South Sumatera Basin, Indonesia. Clean Technol. Environ. Policy. 2017, 20, 581–587. [Google Scholar] [CrossRef]
  13. Zhang, R.; Yin, X.; Winterfeld, P.H.; Wu, Y.S. A fully coupled thermal-hydrological-mechanical-chemical model for CO2 geological sequestration. J. Nat. Gas Sci. Eng. 2016, 28, 280–304. [Google Scholar] [CrossRef] [Green Version]
  14. Liu, J.; Xie, L.; Yao, Y.; Gan, Q.; Zhao, P.; Du, L. Preliminary study of influence factors and estimation model of the enhanced gas recovery stimulated by carbon dioxide utilization in shale. ACS Sustain. Chem. Eng. 2019, 7, 20114–20125. [Google Scholar] [CrossRef]
  15. White, C.M.; Smith, D.H.; Jones, K.L.; Goodman, A.L.; Schroeder, K.T. Sequestration of carbon dioxide in coal with enhanced coalbed methane recovery a review. Energy Fuels 2005, 19, 659–724. [Google Scholar] [CrossRef]
  16. Gentzis, T. Subsurface sequestration of carbon dioxide-an overview from an Alberta (Canada) perspective. Int. J. Coal Geol. 2000, 43, 287–305. [Google Scholar] [CrossRef]
  17. Wu, Y.; Liu, J.; Elsworth, D.; Chen, Z.; Pan, Z. Dual poroelastic response of coal seam to CO2 injection. Int. J. Greenh. Gas Control 2010, 4, 668–678. [Google Scholar] [CrossRef]
  18. Charrière, D.; Pokryszka, Z.; Behra, P. Effect of pressure and temperature on diffusion of CO2 and CH4 into coal from the Lorraine basin. Int. J. Coal Geol. 2010, 81, 373–380. [Google Scholar] [CrossRef]
  19. Mazumder, S.; Wolf, K.H. Differential swelling and permeability change of coal in response to CO2 injection for ECBM. Int. J. Coal Geol. 2008, 74, 123–138. [Google Scholar] [CrossRef]
  20. Wei, X.R.; Wang, G.X.; Massarotto, P.; Golding, S.D.; Rudolph, V. Numerical simulation of multicomponent gas diffusion and flow in coals for enhanced coalbed methane recovery. Chem. Eng. Sci. 2007, 62, 4193–4203. [Google Scholar] [CrossRef]
  21. Fujioka, M.; Yamaguchi, S.; Nako, M. CO2-ECBM field tests in the Ishikari Coal Basin of Japan. Int. J. Coal Geol. 2010, 82, 287–298. [Google Scholar] [CrossRef]
  22. Luo, F.; Xu, R.N.; Jiang, P.X. Numerical investigation of the influence of vertical permeability heterogeneity in stratified formation and of injection/production well perforation placement on CO2 geological storage with enhanced CH4 recovery. Appl. Energy 2013, 102, 1314–1323. [Google Scholar] [CrossRef]
  23. Vishal, V.; Singh, T.N.; Ranjith, P.G. Influence of sorption time in CO2-ECBM process in Indian coals using coupled numerical simulation. Fuel 2015, 139, 51–58. [Google Scholar] [CrossRef]
  24. Wang, G.; Ren, T.; Qi, Q.; Zhang, L.; Liu, Q. Prediction of Coalbed Methane (CBM) Production Considering Bidisperse Diffusion: Model Development, Experimental Test, and Numerical Simulation. Energy Fuels 2017, 31, 5785–5797. [Google Scholar] [CrossRef]
  25. Fan, Y.; Deng, C.; Zhang, X.; Li, F.; Wang, X.; Qiao, L. Numerical study of CO2-enhanced coalbed methane recovery. Int. J. Greenh. Gas Control 2018, 76, 12–23. [Google Scholar] [CrossRef]
  26. Fang, H.H.; Sang, S.X.; Liu, S.Q. Numerical simulation of enhancing coalbed methane recovery by injecting CO2 with heat injection. Pet. Sci. 2019, 16, 32–43. [Google Scholar] [CrossRef] [Green Version]
  27. Fan, C.; Elsworth, D.; Li, S.; Zhou, L.; Yang, Z.; Song, Y. Thermo-hydro-mechanical-chemical couplings controlling CH4 production and CO2 sequestration in enhanced coalbed methane recovery. Energy 2019, 173, 1054–1077. [Google Scholar] [CrossRef]
  28. Li, H.; Lin, B.; Yang, W.; Hong, Y.; Wang, Z. A fully coupled electromagnetic-thermal-mechanical model for coalbed methane extraction with microwave heating. J. Nat. Gas Sci. Eng. 2017, 46, 830–844. [Google Scholar] [CrossRef]
  29. Fan, C.; Elsworth, D.; Li, S.; Chen, Z.; Luo, M.; Song, Y.; Zhang, H. Modelling and optimization of enhanced coalbed methane recovery using CO2/N2 mixtures. Fuel 2019, 253, 1114–1129. [Google Scholar] [CrossRef]
  30. Li, S.; Fan, C.; Han, J.; Luo, M.; Yang, Z.; Bi, H. A fully coupled thermal-hydraulic-mechanical model with two-phase flow for coalbed methane extraction. J. Nat. Gas Sci. Eng. 2016, 33, 324–336. [Google Scholar] [CrossRef] [Green Version]
  31. Teng, T.; Zhao, Y.; Gao, F.; Wang, J.G.; Wang, W. A fully coupled thermo-hydro-mechanical model for heat and gas transfer in thermal stimulation enhanced coal seam gas recovery. Int. J. Heat Mass Transf. 2018, 125, 866–875. [Google Scholar] [CrossRef]
  32. Xia, T.; Zhou, F.; Gao, F.; Kang, J.; Liu, J.; Wang, J. Simulation of coal self-heating processes in underground methane-rich coal seams. Int. J. Coal Geol. 2015, 141, 1–12. [Google Scholar] [CrossRef]
  33. Liu, J.; Chen, Z.; Elsworth, D.; Qu, H.; Chen, D. Interactions of multiple processes during CBM extraction: A critical review. Int. J. Coal Geol. 2011, 87, 175–189. [Google Scholar] [CrossRef]
  34. Qu, H.; Liu, J.; Chen, Z.; Wang, J.; Pan, Z.; Connell, L. Complex evolution of coal permeability during CO2 injection under variable temperatures. Int. J. Greenh. Gas Control 2012, 9, 281–293. [Google Scholar] [CrossRef]
  35. Huang, S.P. In situ stress distribution and its impact on CBM reservoir properties in the Zhengzhuang area, southern Qinshui Basin, North China. J. Nat. Gas Sci. Eng. 2019, 61, 83–96. [Google Scholar] [CrossRef]
  36. Zhang, H.; Liu, J.; Elsworth, D. How sorption-induced matrix deformation affects gas flow in coal seams: A new FE model. Int. J. Rock Mech. Min. Sci. 2008, 45, 1226–1236. [Google Scholar] [CrossRef]
  37. Liu, T.; Lin, B.; Yang, W.; Liu, T.; Kong, J.; Huang, Z. Dynamic diffusion-based multifield coupling model for gas drainage. J. Nat. Gas Sci. Eng. 2017, 44, 233–249. [Google Scholar] [CrossRef]
  38. Zhu, W.C.; Wei, C.H.; Liu, J.; Qu, H.Y.; Elsworth, D. A model of coal–gas interaction under variable temperatures. Int. J. Coal Geol. 2011, 86, 213–221. [Google Scholar] [CrossRef]
  39. Liu, Z.; Cheng, Y.; Liu, Q.; Jiang, J.; Li, W.; Zhang, K. Numerical assessment of CMM drainage in the remote unloaded coal body: Insights of geostress-relief gas migration and coal permeability. J. Nat. Gas Sci. Eng. 2017, 45, 487–501. [Google Scholar] [CrossRef]
  40. Kong, X.; Wang, E.; Liu, Q.; Li, Z.; Li, D.; Cao, Z. Dynamic permeability and porosity evolution of coal seam rich in CBM based on the flow-solid coupling theory. J. Nat. Gas Sci. Eng. 2017, 40, 61–71. [Google Scholar] [CrossRef]
  41. Li, X.C.; Guo, Y.Y.; Wu, S.Y.; Nie, B.S. Mathematical model and numerical simulation of fluid-solid coupled flow of coal-bed gas considering swelling stress of adsorption. Chin. J. Rock Mech. Eng. 2007, 26, 2743–2748. [Google Scholar]
  42. Zheng, C.; Chen, Z.; Kizil, M.; Aminossadati, S.; Zou, Q.; Gao, P. Characterisation of mechanics and flow fields around in-seam methane gas drainage borehole for preventing ventilation air leakage: A case study. Int. J. Coal Geol. 2016, 162, 123–138. [Google Scholar] [CrossRef] [Green Version]
  43. Pan, Z.; Connell, L.D. Comparison of adsorption models in reservoir simulation of enhanced coalbed methane recovery and CO2 sequestration in coal. Int. J. Greenh. Gas Control 2009, 3, 77–89. [Google Scholar] [CrossRef]
  44. Balan, H.O.; Gumrah, F. Assessment of shrinkage–swelling influences in coal seams using rank-dependent physical coal properties. Int. J. Coal Geol. 2009, 77, 203–213. [Google Scholar] [CrossRef]
  45. Durucan, S.; Shi, J.Q. Improving the CO2 well injectivity and enhanced coalbed methane production performance in coal seams. Int. J. Coal Geol. 2009, 77, 214–221. [Google Scholar] [CrossRef]
  46. Han, L.F.; Hou, Y.D.; Wang, Y.J.; Liu, X.B.; Han, J.; Xie, R.H.; Mu, H.W.; Fu, C.F. Measurement of Velocity of Sand -Containing Oil–Water Two-Phase Flow with Super High Water Holdup in Horizontal Small Pipe Based on Thermal Tracers. Flow Meas Instrum. 2019, 69, 101622–101631. [Google Scholar] [CrossRef]
Figure 1. Schematic diagram of the full coupling of THM for CO2 displacement CBM.
Applsci 10 01385 g001
Figure 2. Numerical model of CO2 displacement of coalbed methane: (a) geological model of enhancing CBM recovery by injecting CO2 with heat injection; (b) numerical simulation model for CO2-ECBM; and (c) initial porosity of CO2-ECBM.
Applsci 10 01385 g002aApplsci 10 01385 g002b
Figure 3. Distribution of CH4 molar concentration and CO2 molar concentration under different injection CO2 pressures: (a) distribution of CH4 molar concentration at 4 MPa injection pressure; (b) distribution of CO2 molar concentration at 4 MPa injection pressure; (c) distribution of CH4 molar concentration at 6 MPa injection pressure; (d) distribution of CO2 molar concentration at 6 MPa injection pressure; (e) distribution of CH4 molar concentration at 8 MPa injection pressure; and (f) distribution of CO2 molar concentration at 8 MPa injection pressure.
Applsci 10 01385 g003aApplsci 10 01385 g003bApplsci 10 01385 g003c
Figure 4. Distribution of diagonal CH4 molar concentrations at different injection pressures: (a) injection pressures is 4 MPa; (b) injection pressures is 6 MPa; and (c) injection pressures is 8 MPa.
Applsci 10 01385 g004
Figure 5. Distribution of diagonal CO2 molar concentrations at different injection pressures: (a) injection pressures is 4 MPa; (b) injection pressures is 6 MPa; and (c) injection pressures is 8 MPa.
Applsci 10 01385 g005
Figure 6. CH4 and CO2 molar concentrations at monitoring points A and Bunder different CO2 injection pressures: (a) CH4 molar concentration and (b) CO2 molar concentration.
Applsci 10 01385 g006
Figure 7. Distribution of CH4 and CO2 molar concentrations under different CO2 injection temperatures: (a) distribution of CH4 molar concentration at 303 K injection temperatures; (b) distribution of CO2 molar concentration at 303 K injection temperatures; (c) distribution of CH4 molar concentration at 333 K injection temperatures; (d) distribution of CO2 molar concentration at 333 K injection temperatures; (e) distribution of CH4 molar concentration at 363 K injection temperatures; and (f) distribution of CO2 molar concentration at 363 K injection temperatures.
Applsci 10 01385 g007aApplsci 10 01385 g007bApplsci 10 01385 g007cApplsci 10 01385 g007d
Figure 8. CH4 and CO2 molar concentrations at monitoring points A and Bunder different CO2 injection temperatures: (a) CH4 molar concentration and (b) CO2 molar concentration.
Applsci 10 01385 g008
Figure 9. Permeability ratios of monitoring points at different injection pressures.
Applsci 10 01385 g009
Figure 10. Permeability ratio at the monitoring points at 6 MPa and different injection temperatures.
Applsci 10 01385 g010
Table 1. Numerical simulation parameter [25,26,28].
VariableParameterValue
P 0 Gas pressure under standard conditions (MPa)2
T 0 Initial temperature of coal seam (K)273
ρ c The density of coal (kg/m3)1350
M 1 CH4 molar mass (kg/mol)0.016
M 2 CO2 molar mass (kg/mol)0.044
μ 1 CH4 dynamic viscosity coefficient (Pa·s) 1.03 × 10 5
μ 2 CO2 dynamic viscosity coefficient (Pa·s) 1.38 × 10 5
ρ 1 CH4 density under standard conditions (kg/m3)0.717
v Poisson’s ratio0.35
E Young’s modulus of coal (MPa)2713
R Universal gas constant (J/(mol·k))8.314
σ Thermal conductivity (W/(m·k))0.478
β Thermal expansion coefficient (K−1)2.4 × 10⁻⁵
C p Heat capacity at constant stress (J/(kg·k)1000

