Experimental Study on the Flexural Behavior of Steel-Textile-Reinforced Concrete: Various Textile Reinforcement Details


Abstract
:1. Introduction
2. Experiment Program
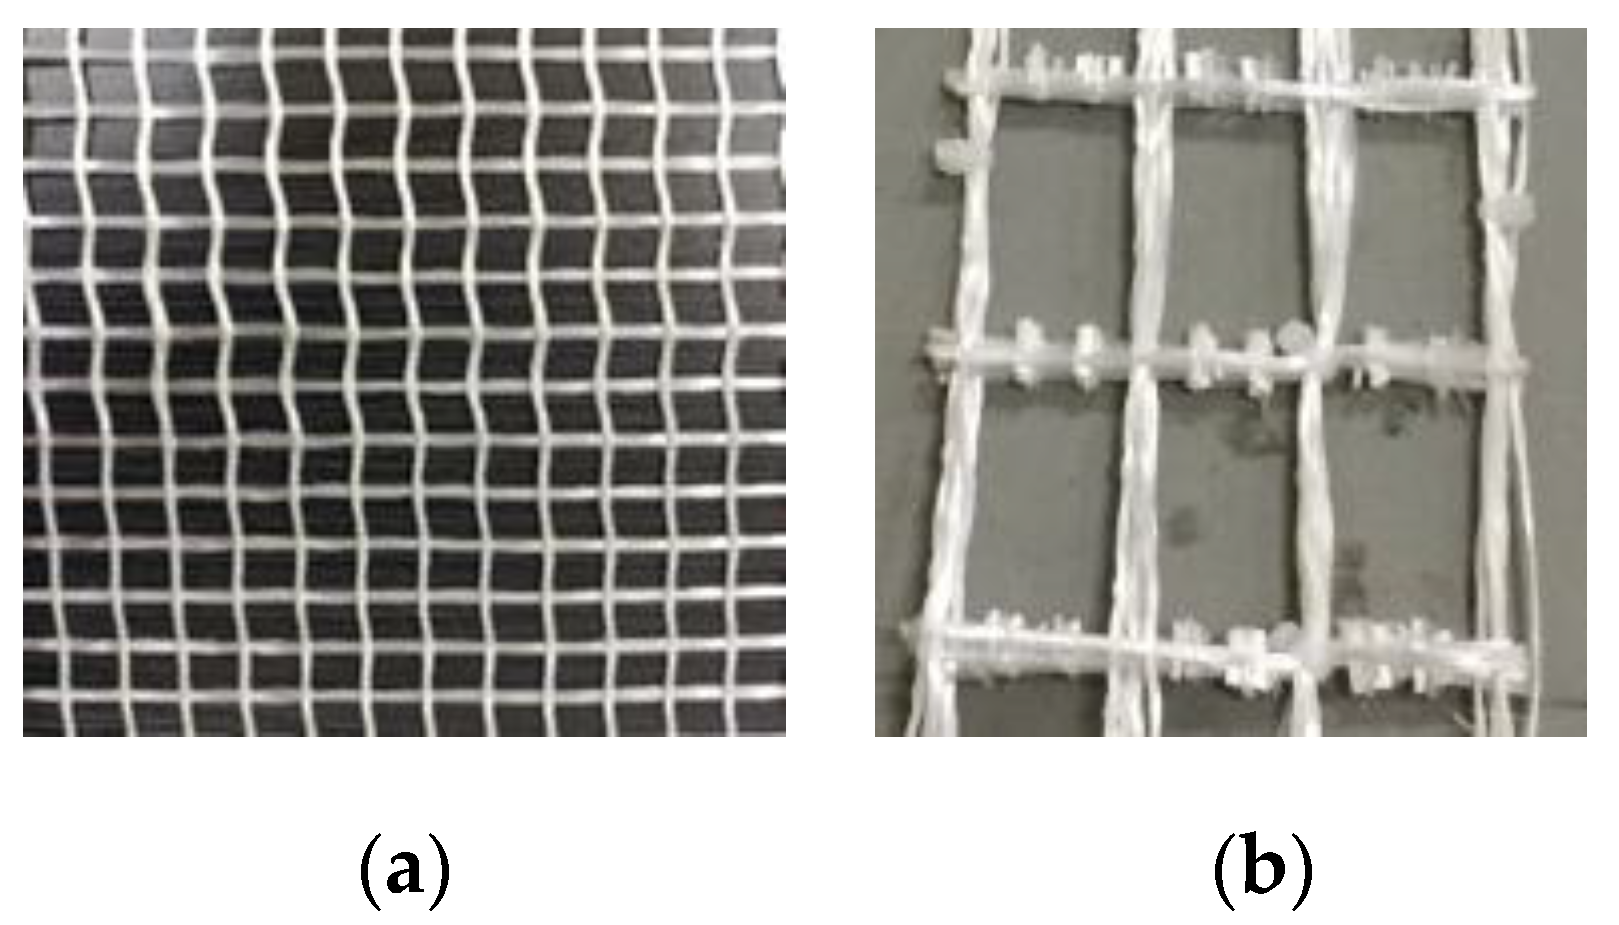
2.1. Textile
2.2. Fine Concrete
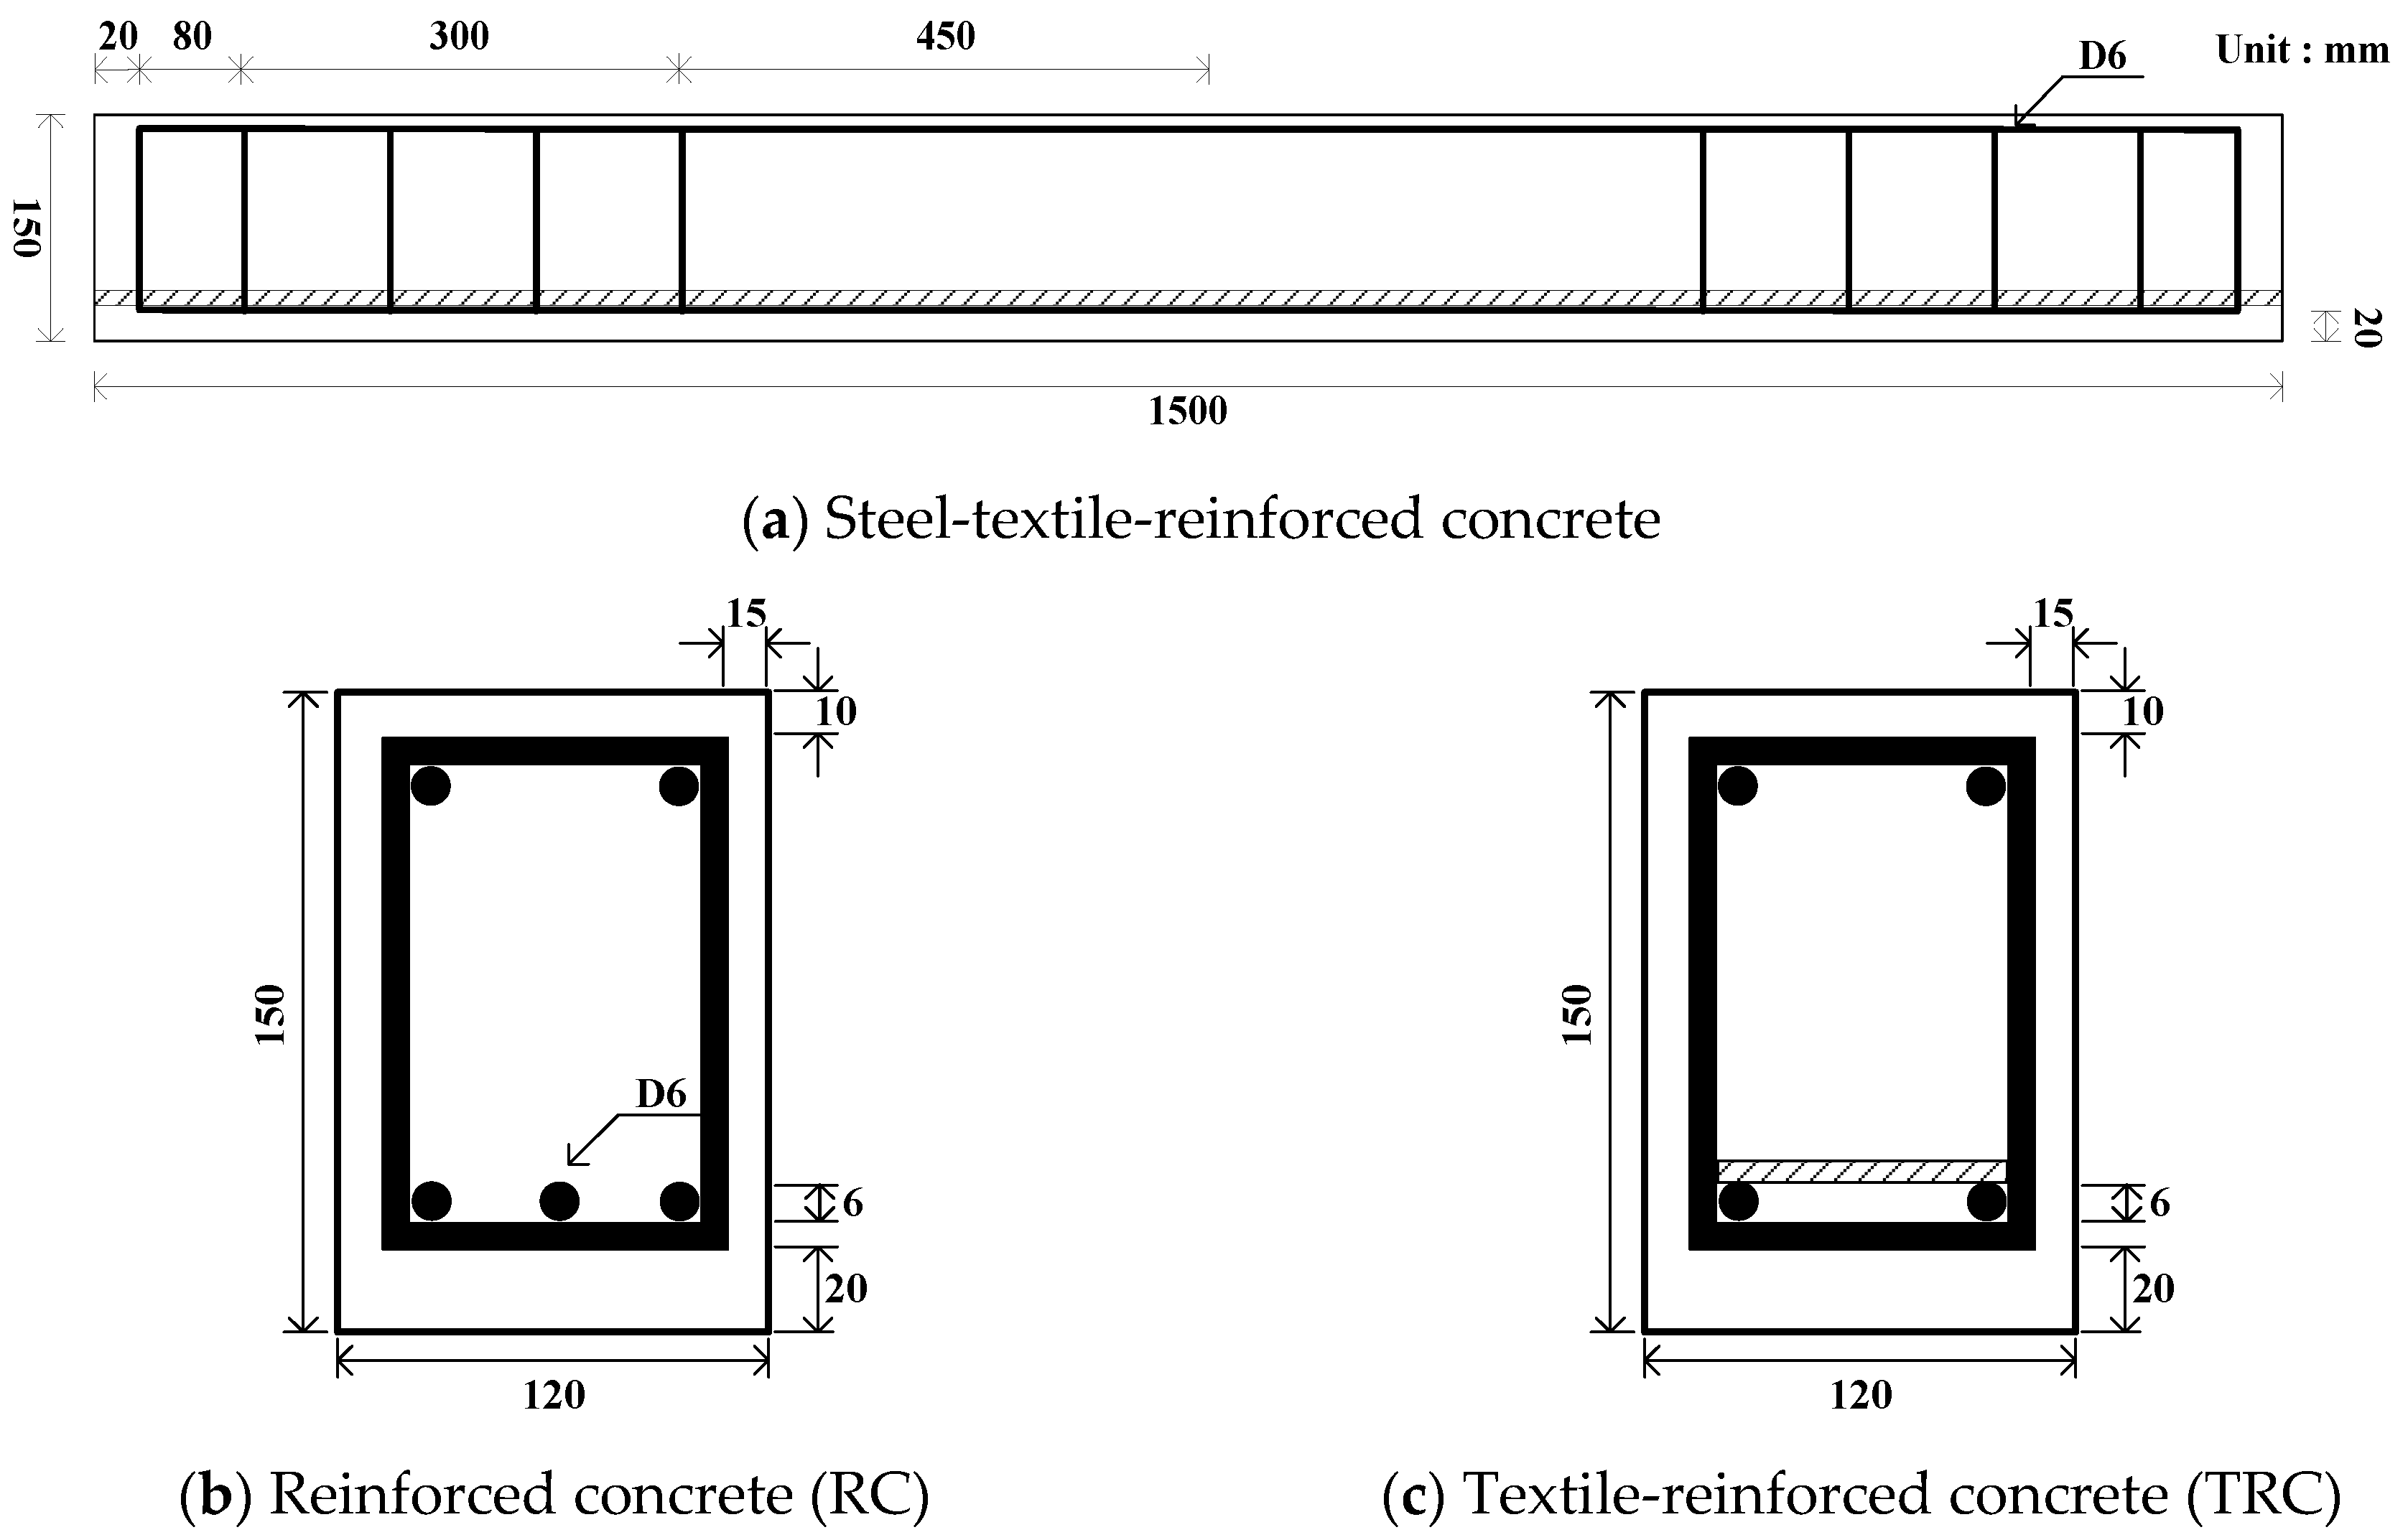
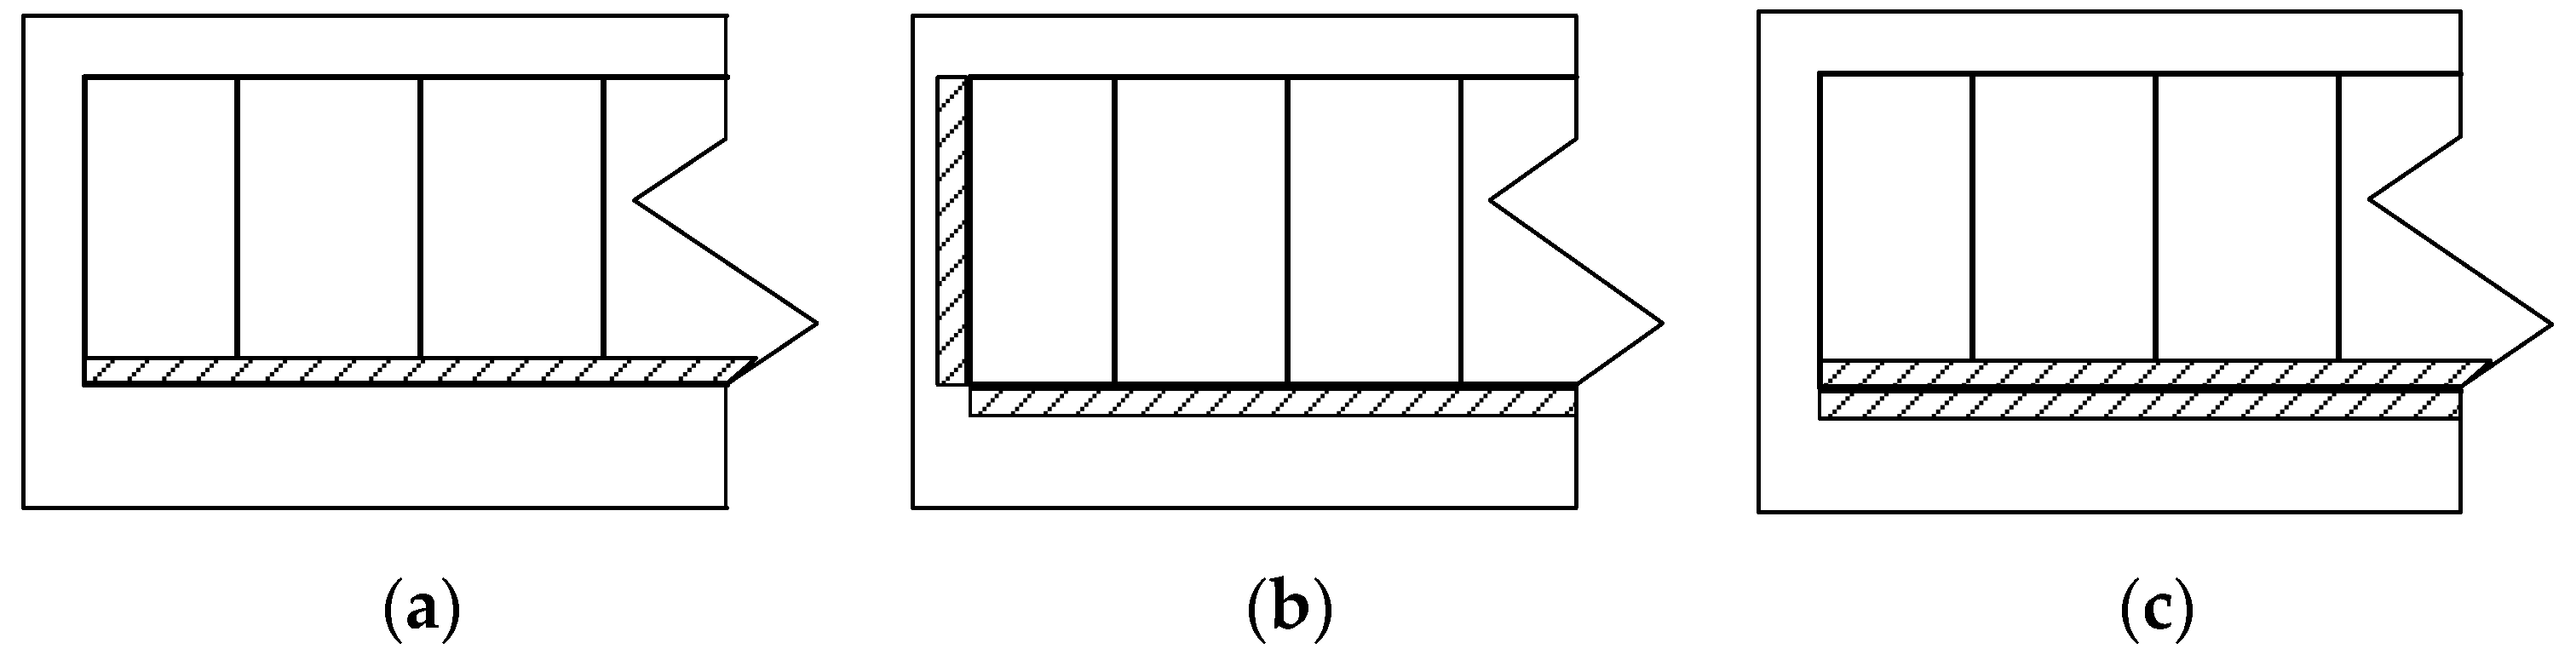
2.3. Specimens
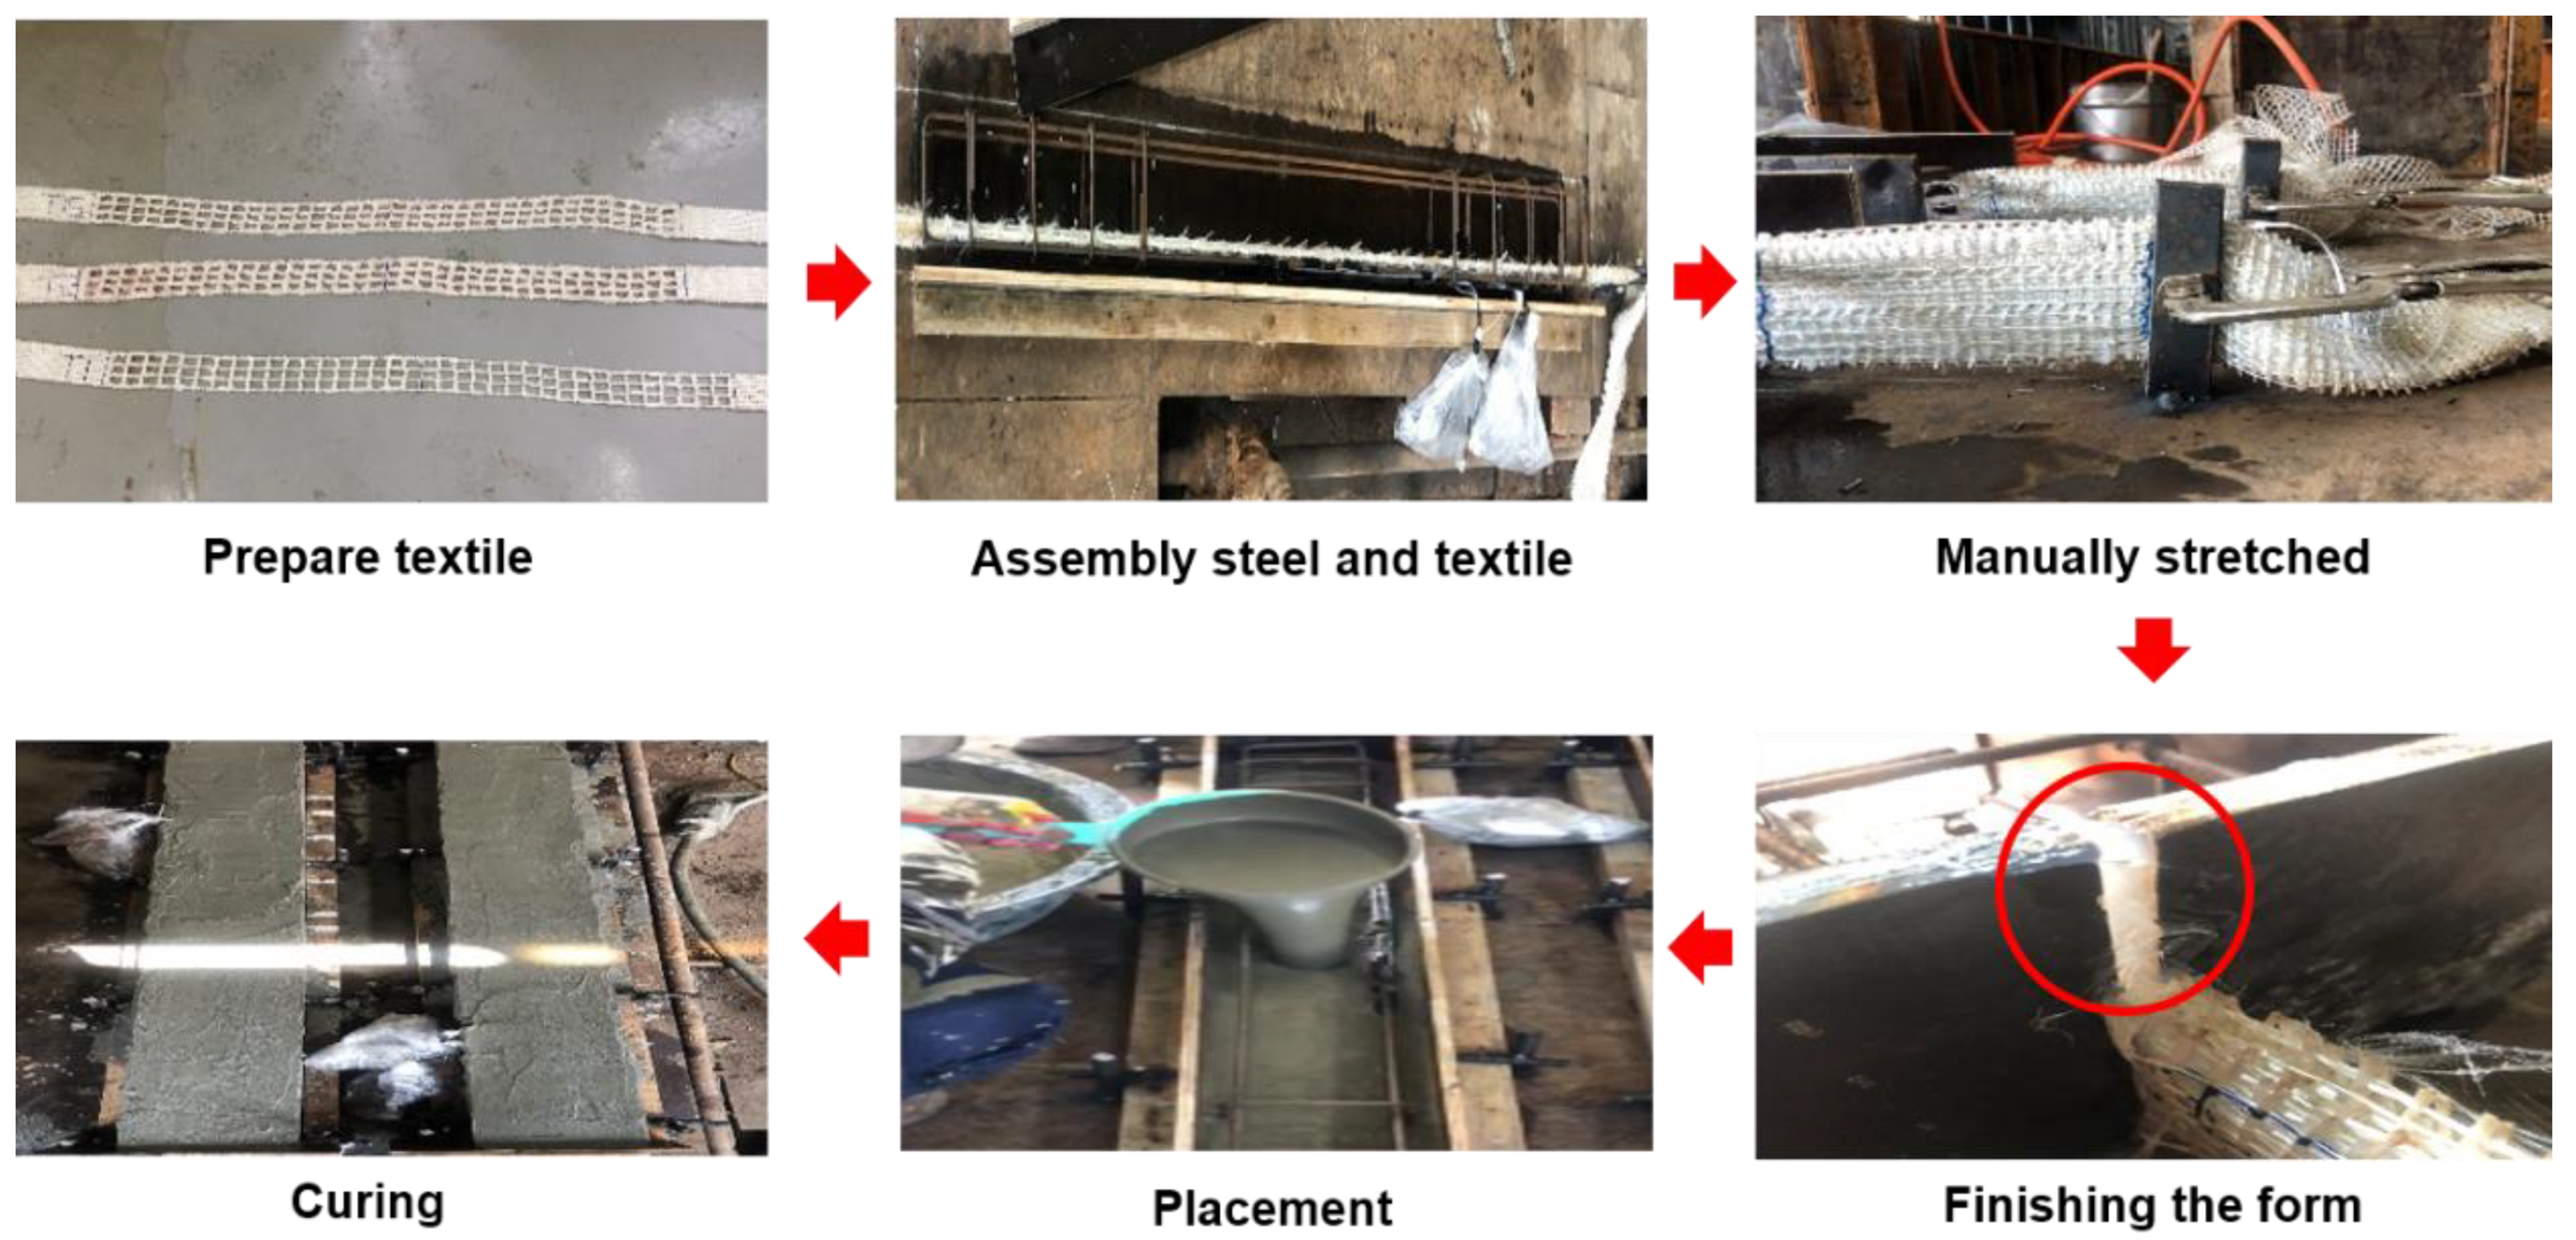
2.4. Manufacture of the Specimens
2.5. Test Setup
3. Experiment Results
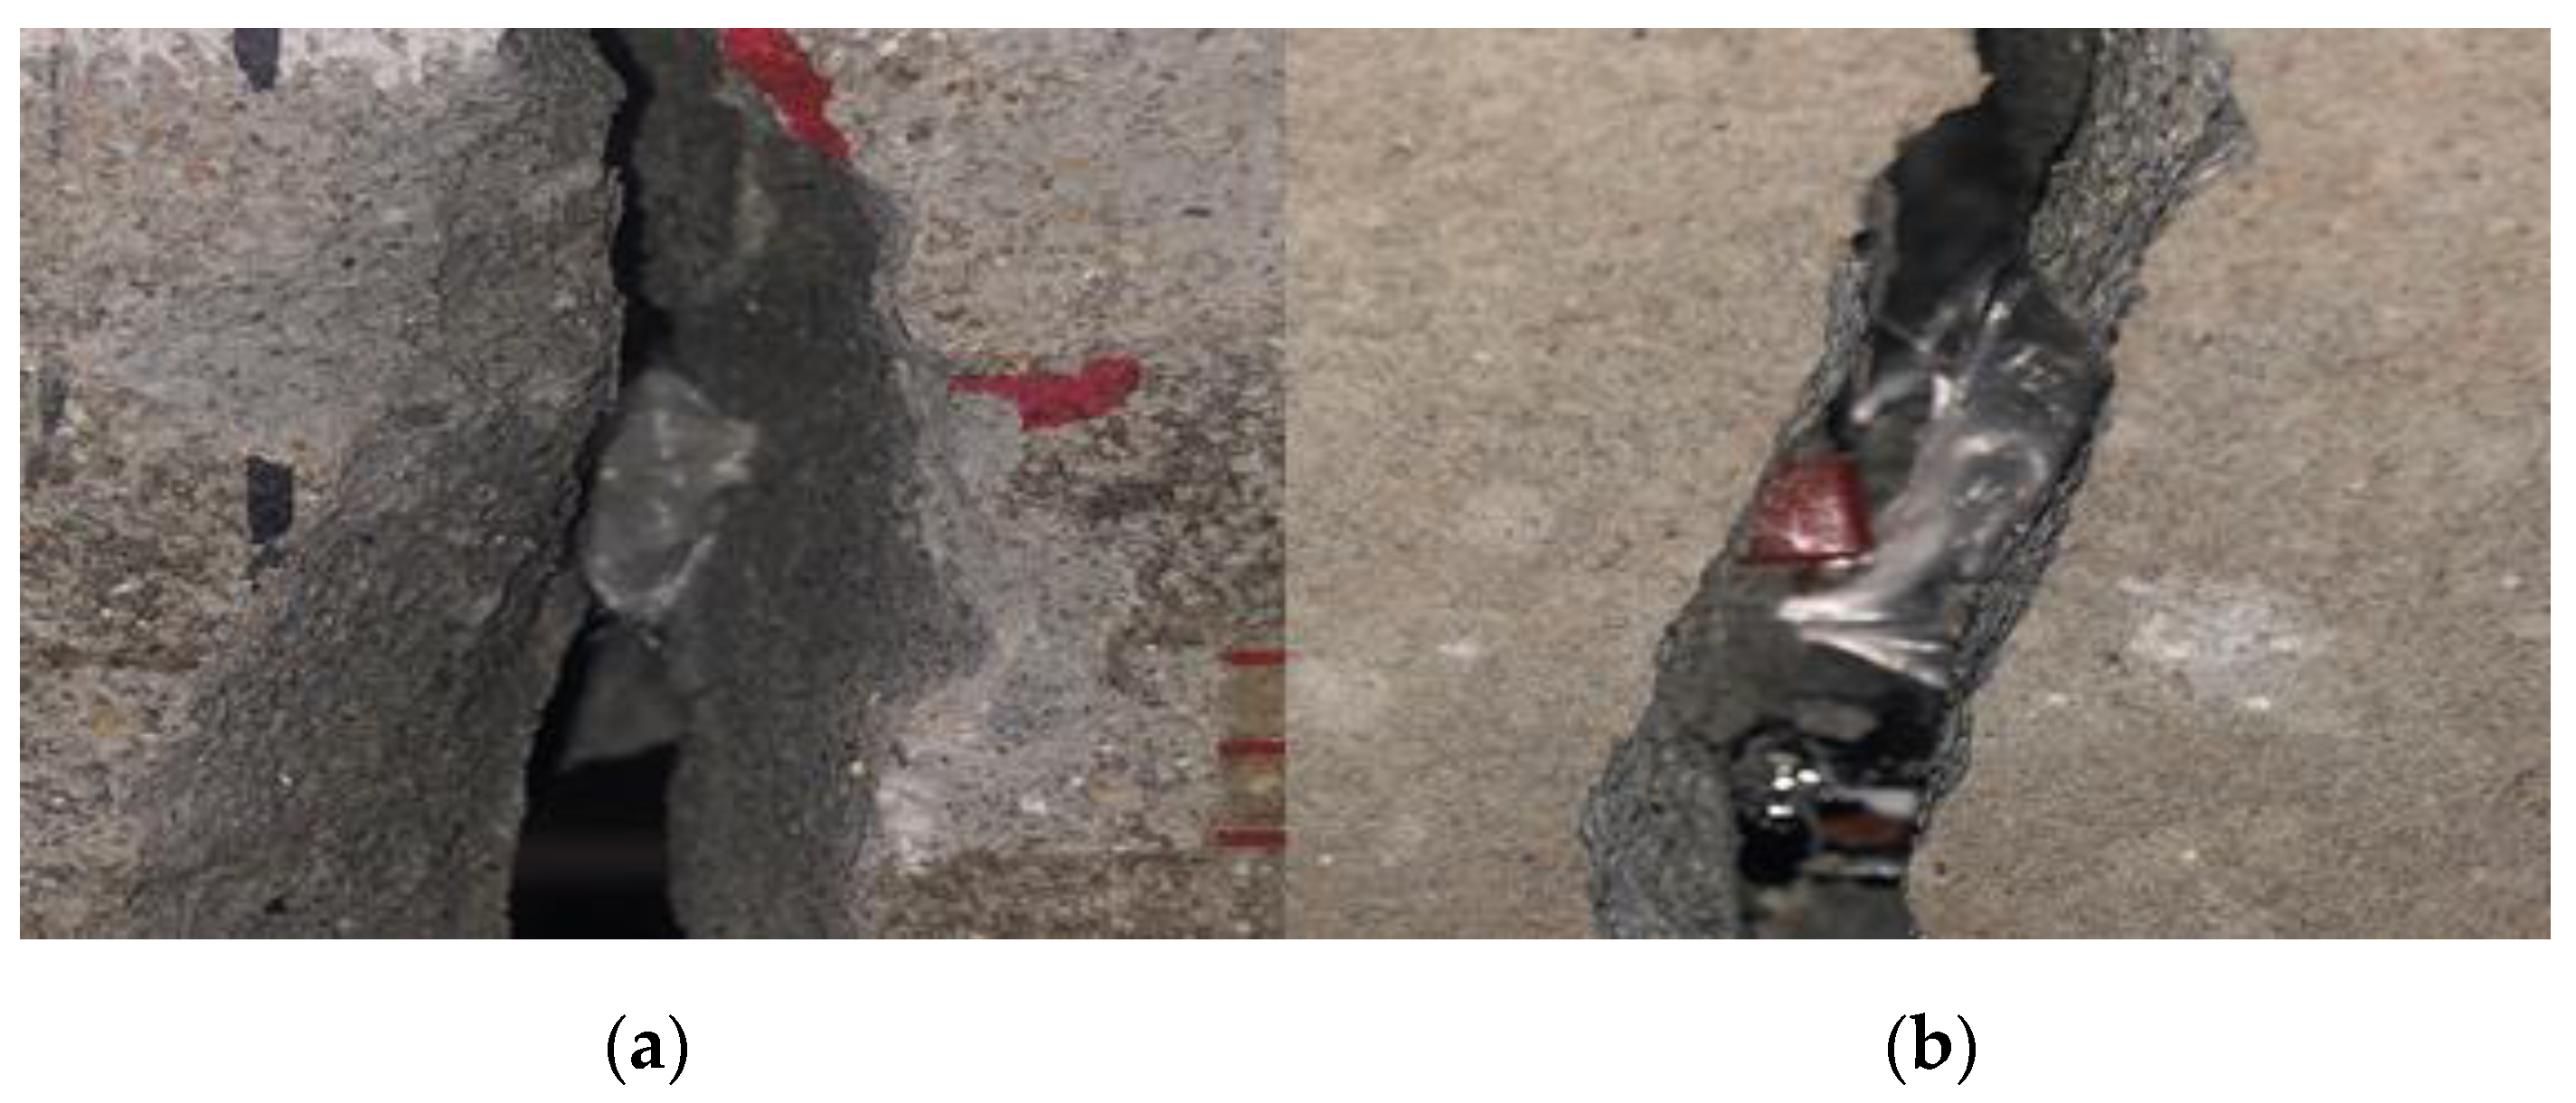
3.1. Crack and Failure
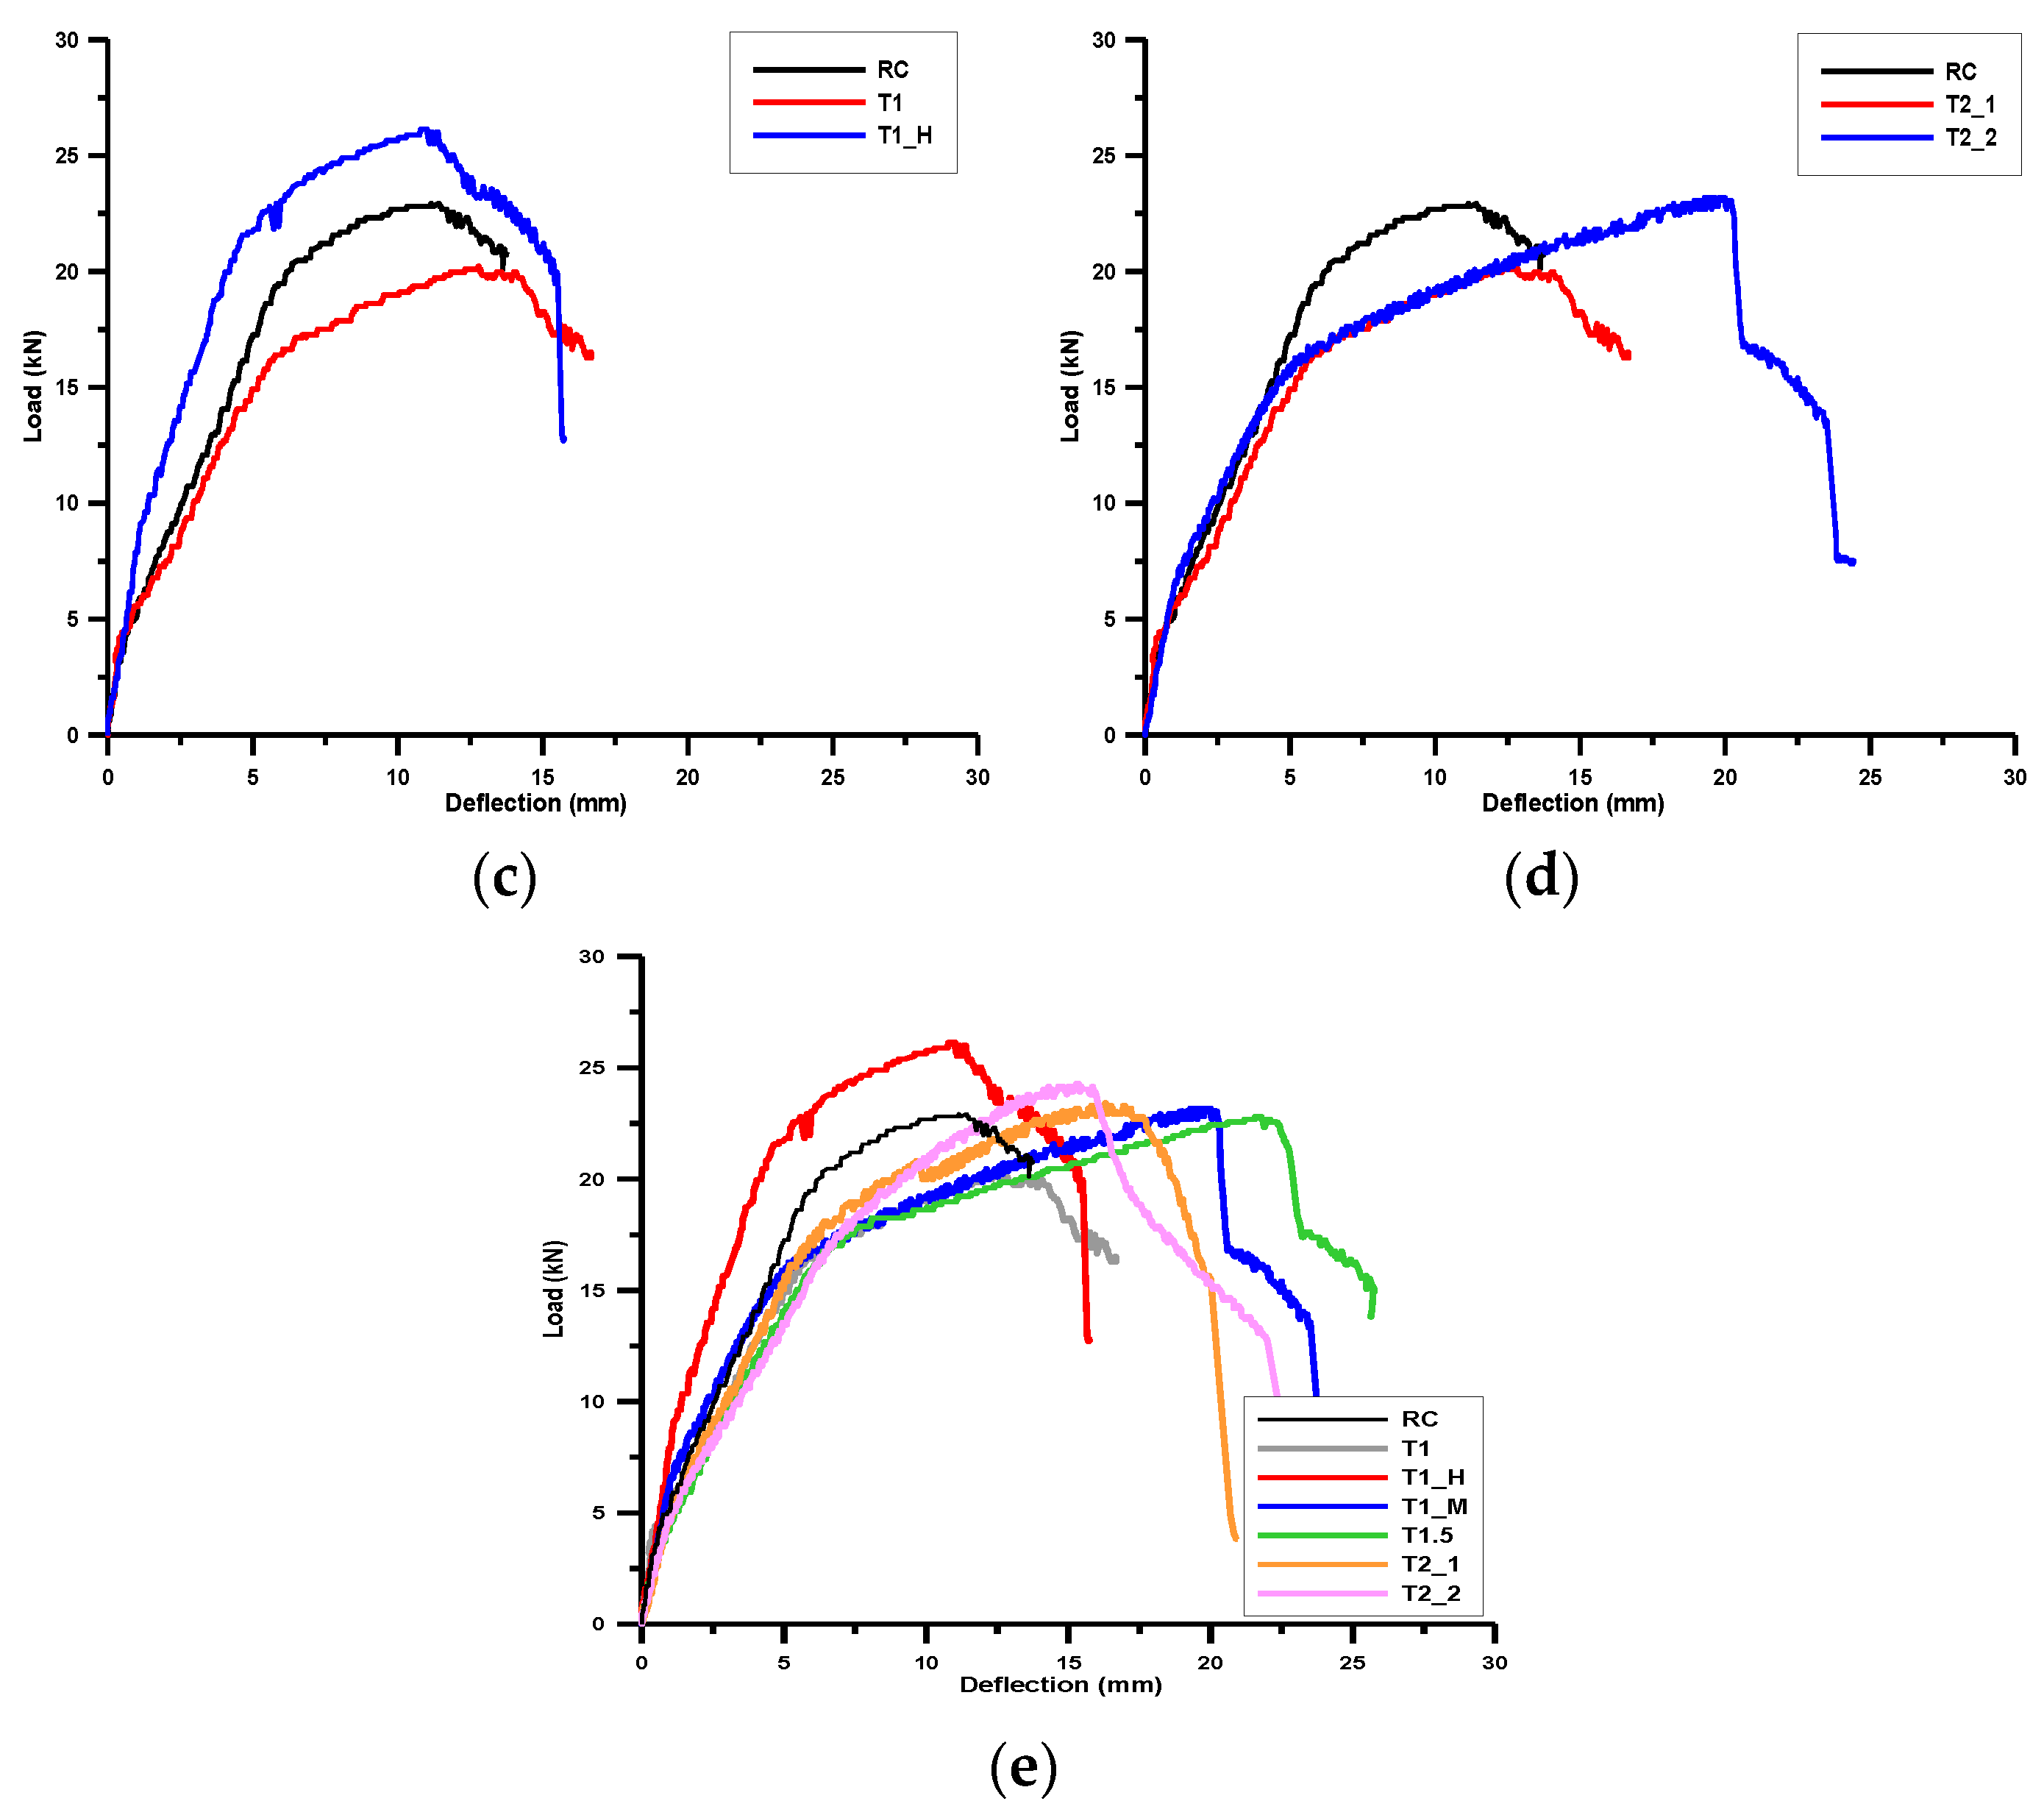
3.2. Load–Deflection Relationship
Ductility
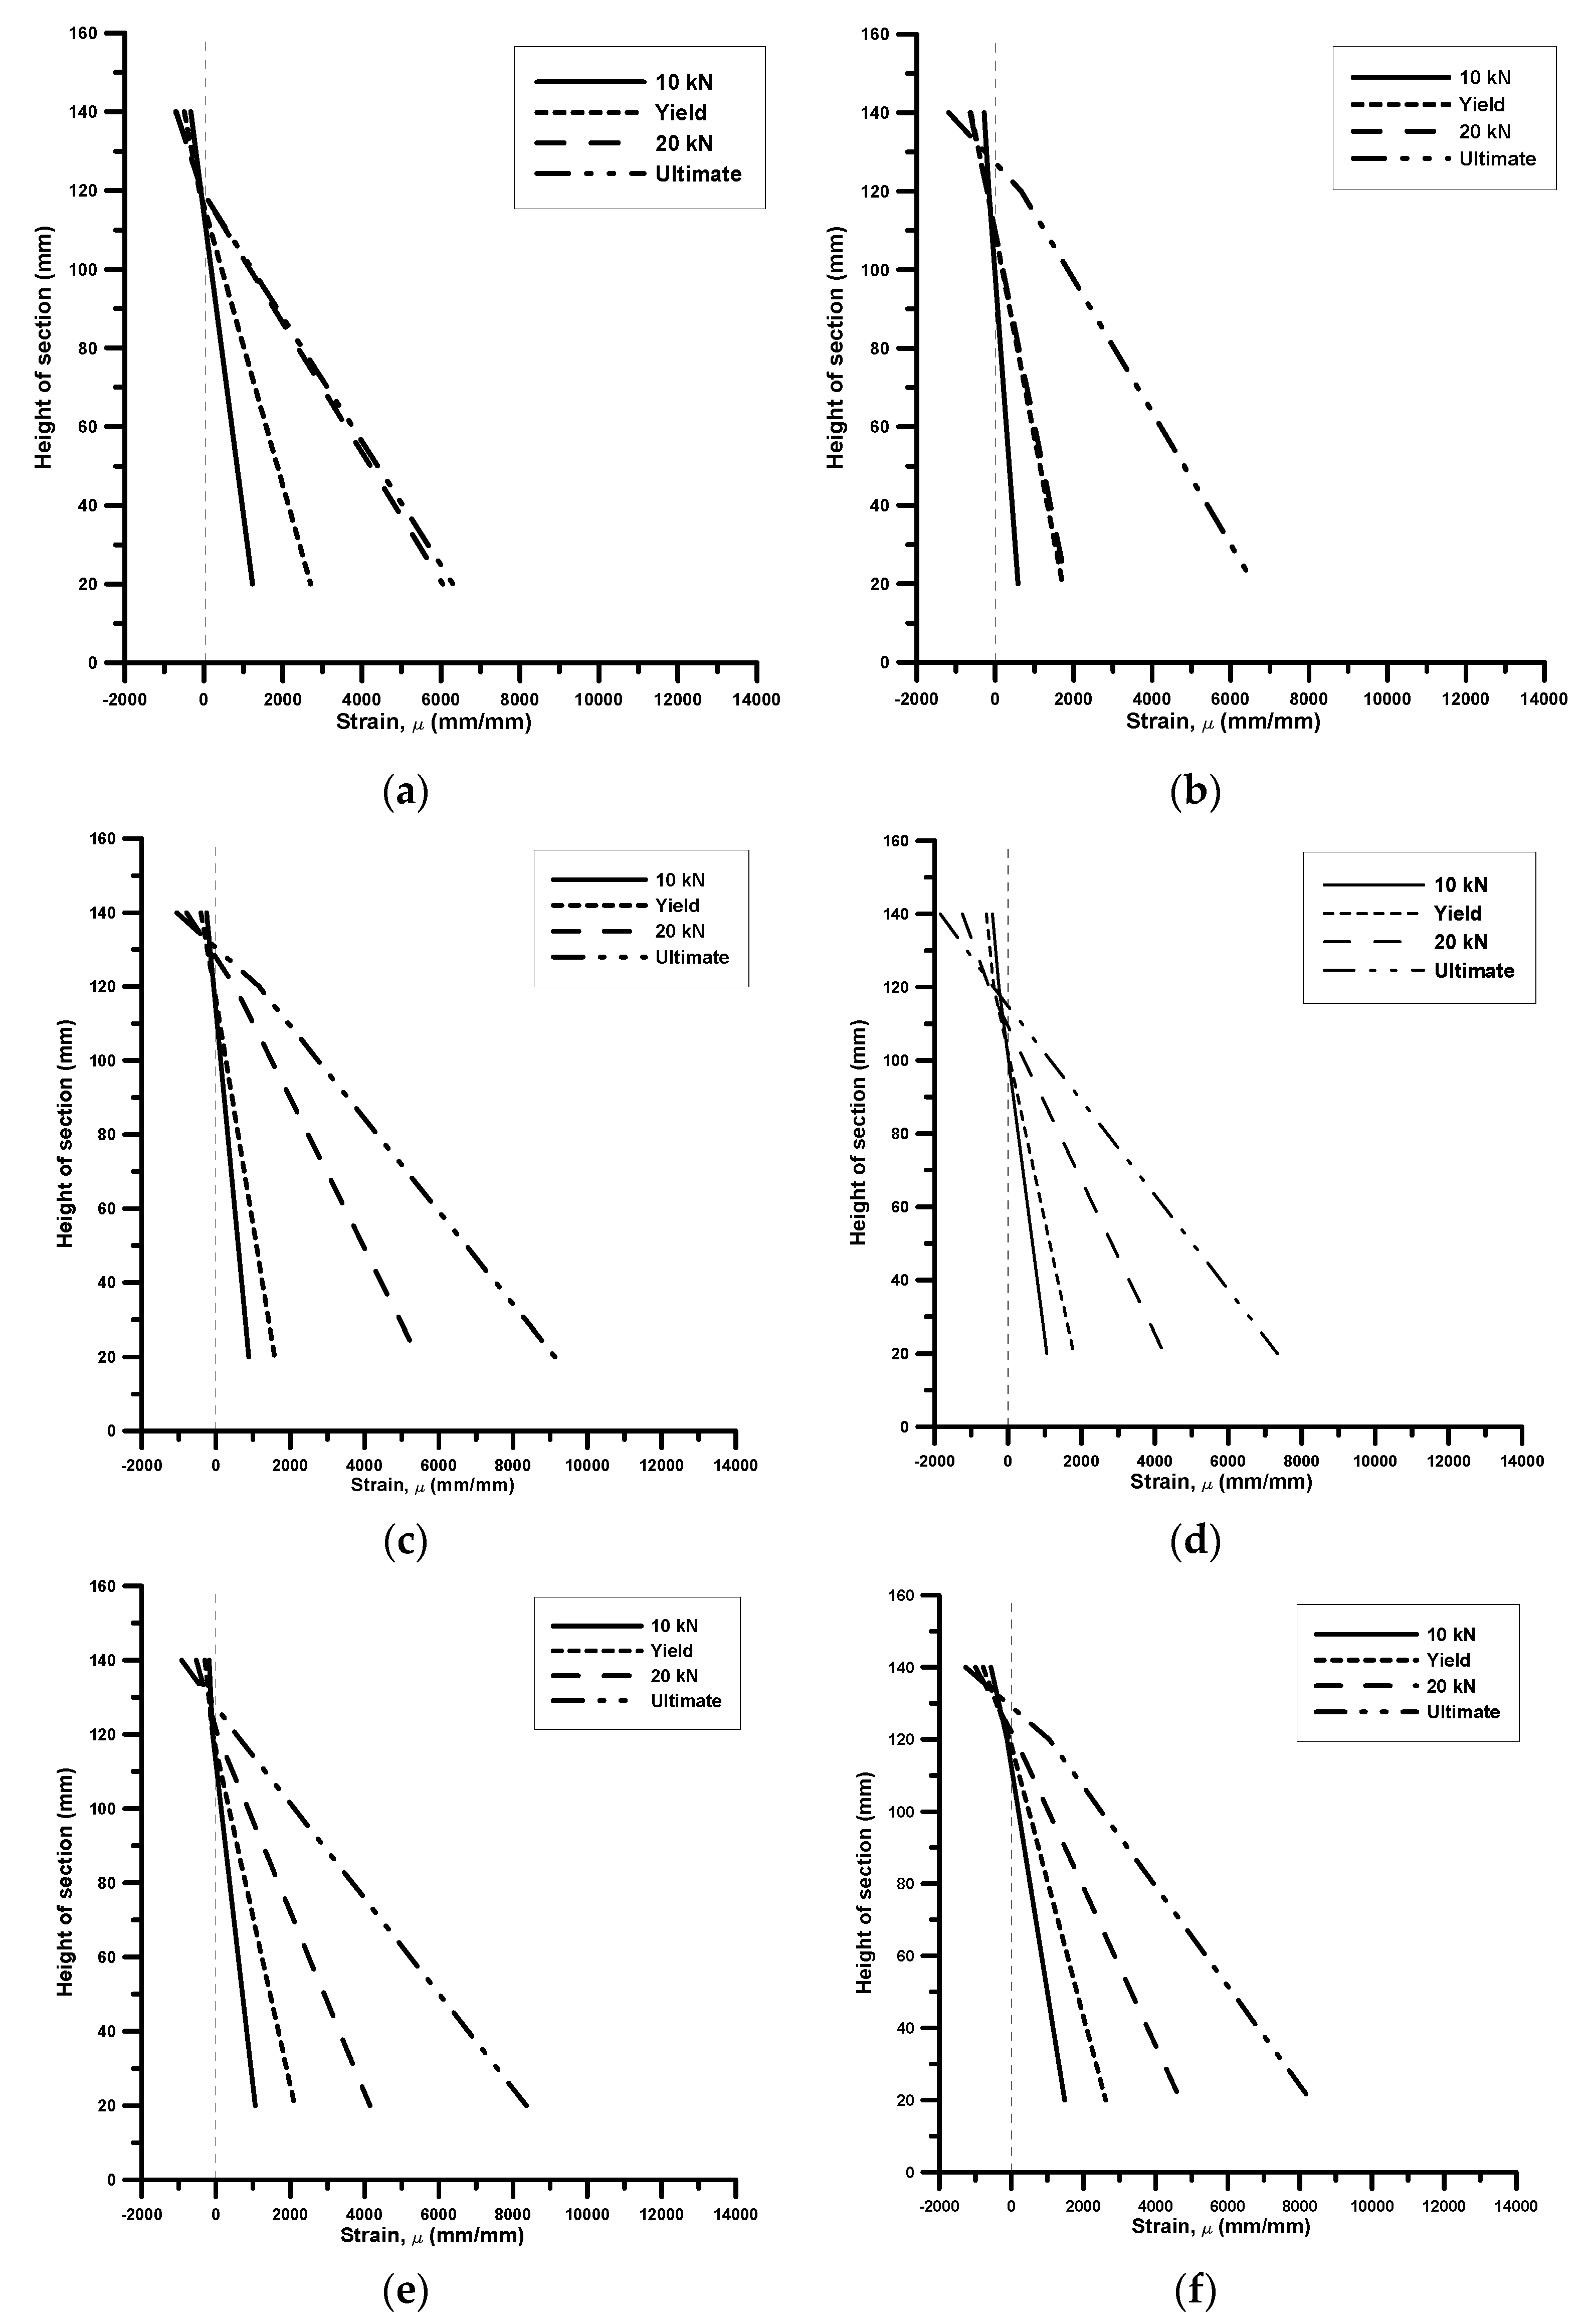
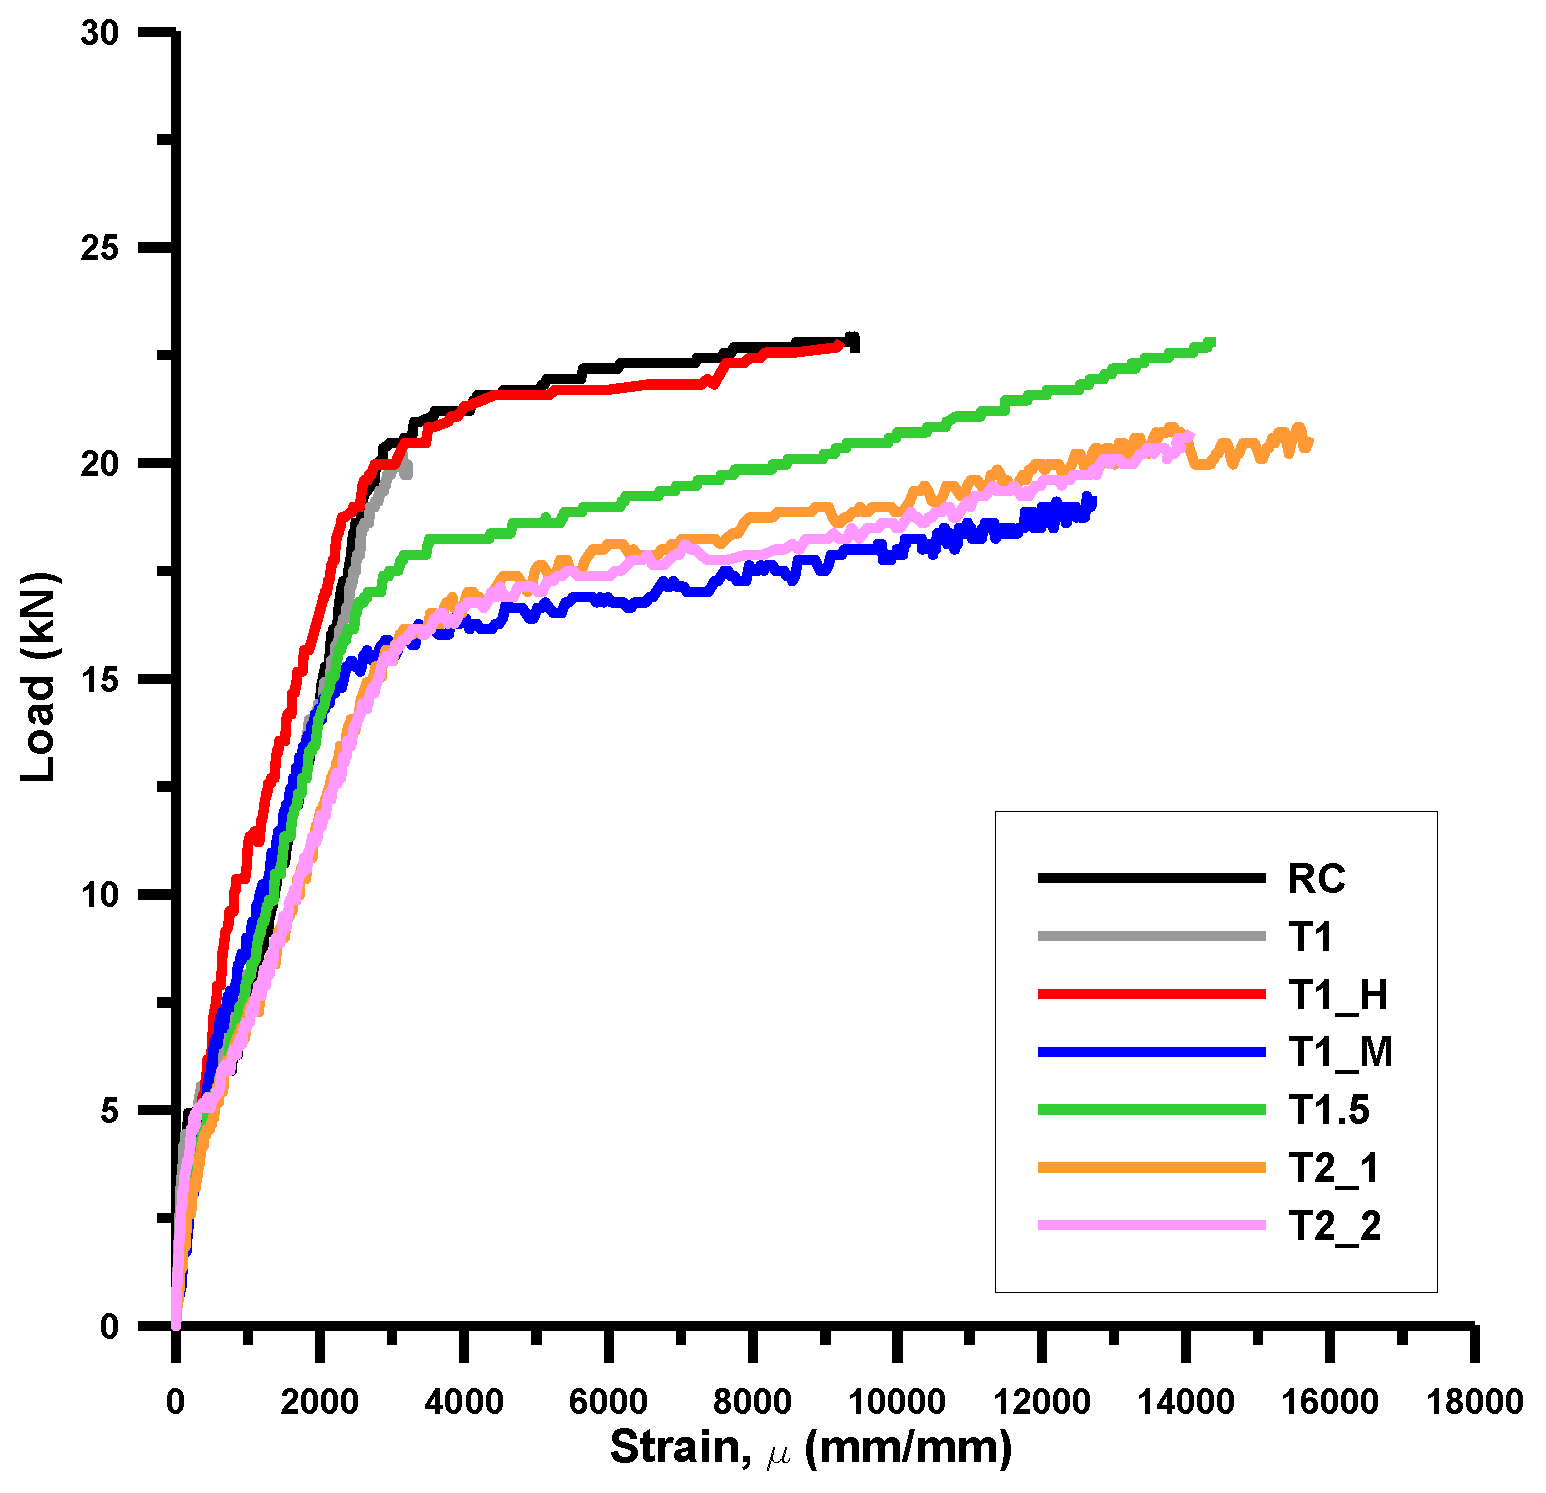
3.3. Strain
3.4. Serviceability
4. Conclusions
- (1)
- The textile was placed over the steel reinforcement, which had a remarkable reinforcement effect on the flexural behavior of the TRC specimens, resulting in the same type of flexural cracking in all specimens. It was found that TRC was more advantageous for distributing cracking evenly because cracking occurred more frequently overall in TRC than in RC.
- (2)
- The flexural performance of the specimen increased with increasing the textile reinforcement amount. However, the results of comparing the T1–T1.5 and T1.5 –T2_1 textile results showed that the performance of the test did not increase proportionally with the increase of the textile reinforcement amount. This was because as the textile reinforcement amount increased, slippage occurred because the bond of concrete to inner textile reinforcement was not perfect.
- (3)
- When the mesh of the textile was made smaller, the number of contacts in the warp and weft rovings of the textile increased, which prevented slippage between the textiles. In addition, when reinforcing the same textile reinforcement amount, the area of fiber that was unbonded from concrete was reduced, thereby securing a flexural performance close to the design value.
- (4)
- The adoption of the textile reinforcement hook for textiles significantly improved the flexural performance and was proven to be effective at controlling the deflection of the beams despite the low rigidity of the used textile.
- (5)
- In most of the TRC specimens in this study, ductility similar to that of the RC specimen was found; therefore TRC can be expected to have a sufficient ductility for beam stability. The load comparison at the same maximum allowable deflection for the TRC usability verification proved that TRC was disadvantageous compared to RC. Regarding the textile reinforcement hook, the TRC specimens showed better performance than the RC specimen. The experiment in this study, however, considered the flexural performance of the flexural members of steel-textile-reinforced concrete in special cases; therefore further research is needed to generalize the experimental results.
Author Contributions
Funding
Acknowledgments
Conflicts of Interest
References
- Brameshuber, W. Textile Reinforced Concrete—State of the Art Report of RILEM TC 201-TRC, 1st ed.; RILEM: Aachen, Germany, 2006; pp. 1–271. [Google Scholar]
- Hegger, J.; Will, N.; Bruckermann, O.; Voss, S. Load-bearing behaviour and simulation of textile reinforced concrete. Mater. Struct. Constr. 2006, 39, 765–776. [Google Scholar] [CrossRef]
- Brückner, A.; Ortlepp, R.; Curbach, M. Textile reinforced concrete for strengthening in bending and shear. Mater. Struct. Constr. 2006, 39, 741–748. [Google Scholar] [CrossRef]
- Williams Portal, N.; Lundgren, K.; Walter, A.M.; Frederiksen, J.O.; Thrane, L.N. Numerical modelling of textile reinforced concrete. In Proceedings of the 8th Intermational Conference on Fracture Mechanics of Concrete and Concrete Structures (FraMCoS) 2013, Toledo, Spain, 11–14 March 2013; pp. 886–897. [Google Scholar]
- Volkova, A.; Paykov, A.; Semenov, S.; Stolyarov, O.; Melnikov, B. Flexural Behavior of Textile-Reinforced Concrete. MATEC Web Conf. 2016, 53, 1–7. [Google Scholar] [CrossRef] [Green Version]
- Ehlig, D.; Schladitz, F.; Frenzel, M.; Curbach, M. Textilbeton: Ausgeführte Projekte im Überblick. Beton- und Stahlbetonbau 2012, 107, 777–785. [Google Scholar] [CrossRef]
- Scheerer, S.; Schladitz, F.; Curbach, M. Textile reinforced concrete—from the idea to a high performance material. In 3rd ICTR International Conference on Textile Reinforced Concrete Brameshuber; RILEM Publications SARL: Aachen, Germany, 2015; pp. 15–33. [Google Scholar]
- Kulas, C.; Goralski, C. Die weltweit längste Textilbetonbrücke: Technische Details und Praxiserfahrungen. Beton und Stahlbetonbau 2014, 109, 812–817. [Google Scholar] [CrossRef]
- Soranakom, C.; Mobasher, B. Flexural Analysis and Design of Textile Reinforced Concrete. In Proceedings of the 4th Colloquium on Textile Reinforced Structures, Dresden, Germany, 2009; pp. 273–288. Available online: https://www.academia.edu/3336038/Flexural_Analysis_and_Design_of_Textile_Reinforced_Concrete (accessed on 19 February 2020).
- Yao, Y.; Silva, F.A.; Butler, M.; Mechtcherine, V.; Mobasher, B. Tension stiffening in textile-reinforced concrete under high speed tensile loads. Cem. Concr. Compos. 2015, 64, 49–61. [Google Scholar] [CrossRef]
- Brameshuber, W. Materials and Structures/Materiaux et Constructions: Editorial. Mater. Struct. Constr. 2006, 39, 739–740. [Google Scholar] [CrossRef]
- Barhum, R.; Mechtcherine, V. Influence of short dispersed and short integral glass fibres on the mechanical behaviour of textile-reinforced concrete. Mater. Struct. Constr. 2013, 46, 557–572. [Google Scholar] [CrossRef]
- Banholzer, B.; Brockmann, T.; Brameshuber, W. Material and bonding characteristics for dimensioning and modelling of textile reinforced concrete (TRC) elements. Mater. Struct. Constr. 2006, 39, 749–763. [Google Scholar] [CrossRef]
- Xu, S.; Krüger, M.; Reinhardt, H.W.; Ožbolt, J. Bond characteristics of carbon, alkali resistant glass, and aramid textiles in mortar. J. Mater. Civ. Eng. 2004, 16, 356–364. [Google Scholar] [CrossRef]
- Yin, S.; Xu, S. An experimental study on improved mechanical behavior of textile-reinforced concrete. Adv. Mater. Res. 2011, 168–170, 1850–1853. [Google Scholar] [CrossRef]
- Yin, S.; Xu, S.; Lv, H. Flexural behavior of reinforced concrete beams with trc tension zone cover. J. Mater. Civ. Eng. 2014, 26, 320–330. [Google Scholar] [CrossRef]
- Jongho, P.; Sungnam, H.; SunKyu, P. Experimental study on flexural behavior of TRM-strengthened RC beam: Various types of textile-reinforced mortar with non-impregnated textile. Appl. Sci. 2019, 9, 1981. [Google Scholar]
- Jungbhin, Y. An Experimental Study on the Flexural Behavior of Textile Reinforced Concrete Flexural Members with Combined Steel; Sungkyunkwan University: Suwon, Korea, 2019. [Google Scholar]
- Jongho, P.; SunKyu, P.; TaeKyun, K. Bond Strength of AR-Glass Textile with Development Length in Fine Concrete; Korea Insitute for Structural Maintenance and Inspection: Daejeon, Korea, 2016; pp. 390–391. [Google Scholar]
- Reinhardt, H.W.; Krüger, M.; Große, C.U. Concrete prestressed with textile fabric. J. Adv. Concr. Technol. 2003, 1, 231–239. [Google Scholar] [CrossRef] [Green Version]
- Du, Y.; Zhang, X.; Liu, L.; Zhou, F.; Zhu, D.; Pan, W. Flexural Behaviour of Carbon Textile-Reinforced Concrete with Prestress and Steel Fibres. Polymers 2018, 10, 98. [Google Scholar] [CrossRef] [PubMed] [Green Version]
- Banholzer, B. Bond Behaviour of A Multi-Filament Yarn Embedded in A Cementitious Matrix; RWTH AACHEN University: Aachen, Germany, 2004. [Google Scholar]
- Sung-u, S. Flexural Design and Ductile Capacity of Reinforced High Strength Concrete Beams. J. Korea Concr. Inst. 1996, 8, 141–149. [Google Scholar]
- ACI 318R. ACI 318R-14, Commentary on Building Code Requirements for Structural Concrete; American Concrete Institute: Farmington Hills, MI, USA, 2014; ISBN 9780870319303. [Google Scholar]
- Korea Concrete Institute. Concrete Structures Design Code; Korea Concrete Institute: Seoul, Korea, 2012. [Google Scholar]


| Properties and Geometric Parameters | AR Glass |
|---|---|
| Number of filaments per yarn (or roving) | 1600 |
| Tensile strength of the warp (N/50 mm *) | 2142 |
| Tensile strength of the weft (N/50 mm) | 1833 |
| Rupture elongation ratio of the warp (%) | 2.85 |
| Rupture elongation ratio of the weft (%) | 2.36 |
| Tex of the yarn (g/km) | 640 |
| Area of the yarn (or roving) (mm2) | 0.246 |
| Component | Unit | Content |
|---|---|---|
| Water | kg/m3 | 315 |
| Cement | 490 | |
| Fly ash | 175 | |
| Silica fume | 35 | |
| Sand No. 6 (0.42–0.22 mm) | 500 | |
| Sand No. 7 (0.22–0.15 mm) | 713.75 | |
| Superplasticizer | % | 0.7 |
| Name | Strengthening Configuration | Tensile Reinforcement Area (mm2) | Number of Textiles in One Layer | Tensile Capacity of Reinforcement (kN) | ||
|---|---|---|---|---|---|---|
| Steel | Textile | Steel | Textile | |||
| RC | Reinforced Concrete | 95.01 (3@D6) | - | - | 38 | - |
| T1 | Same tensile capacity as RC | 63.34 (2@D6) | 17.712 | 18 | 25 | 13 |
| T1_H | Textile hook type | 18 | ||||
| T1_M | 8×8 mm textile mesh size | 9 | ||||
| T1.5 | 1.5 times the textile amount of T1 | 25.58 | 26 | 18 | ||
| T2_1 | 2.2 times the textile amount of T1 | 39.36 | 40 | 28 | ||
| T2_2 | Different layout to T2_1 | 40 (2 layers) | ||||
| Name | Number of Cracks |
|---|---|
| RC | 11 |
| T1 | 13 |
| T1-H | 19 |
| T1-M | 26 |
| T1.5 | 16 |
| T2_1 | 28 |
| T2_2 | 28 |
| Name | (kN) | (kN) | |||
|---|---|---|---|---|---|
| RC | 19.36 | 22.93 | 5.74 | 11.42 | 1.99 |
| T1 | 16.64 | 20.22 | 6.35 | 12.81 | 2.02 |
| T1_H | 19.60 | 26.14 | 3.95 | 11.01 | 2.79 |
| T1_M | 14.80 | 23.18 | 4.45 | 19.93 | 4.48 |
| T1.5 | 15.04 | 22.81 | 5.60 | 21.78 | 3.89 |
| T2_1 | 16.03 | 23.43 | 5.30 | 16.30 | 3.08 |
| T2_2 | 15.41 | 24.29 | 5.86 | 15.36 | 2.62 |
| Name | Load at the Max. Permissible Deflection (kN) | |
|---|---|---|
| RC | 14.13 | 1 |
| T1 | 11.59 | 0.82 |
| T1_H | 18.40 | 1.30 |
| T1_M | 13.26 | 0.94 |
| T1.5 | 11.04 | 0.78 |
| T2.2 | 11.78 | 0.83 |
| T2.2_L | 10.48 | 0.74 |
© 2020 by the authors. Licensee MDPI, Basel, Switzerland. This article is an open access article distributed under the terms and conditions of the Creative Commons Attribution (CC BY) license (http://creativecommons.org/licenses/by/4.0/).
Share and Cite
You, J.; Park, J.; Park, S.-K.; Hong, S. Experimental Study on the Flexural Behavior of Steel-Textile-Reinforced Concrete: Various Textile Reinforcement Details. Appl. Sci. 2020, 10, 1425. https://doi.org/10.3390/app10041425
You J, Park J, Park S-K, Hong S. Experimental Study on the Flexural Behavior of Steel-Textile-Reinforced Concrete: Various Textile Reinforcement Details. Applied Sciences. 2020; 10(4):1425. https://doi.org/10.3390/app10041425
Chicago/Turabian StyleYou, Jungbhin, Jongho Park, Sun-Kyu Park, and Sungnam Hong. 2020. "Experimental Study on the Flexural Behavior of Steel-Textile-Reinforced Concrete: Various Textile Reinforcement Details" Applied Sciences 10, no. 4: 1425. https://doi.org/10.3390/app10041425