Article

Study of Lead Rubber Bearings for Vibration Reduction in High-Tech Factories

Department of Civil Engineering, National Cheng Kung University, Tainan 70101, Taiwan
*
Author to whom correspondence should be addressed.
Appl. Sci. 2020, 10(4), 1502; https://doi.org/10.3390/app10041502
Submission received: 21 January 2020 / Revised: 19 February 2020 / Accepted: 20 February 2020 / Published: 22 February 2020

Abstract

:
This paper studies the seismic and micro vibrations of the high-tech factory with and without lead rubber bearings (LRBs) using the three-dimensional (3D) finite element analysis. The soil-structure interaction is included using the p-y, t-z, and Q-z nonlinear soil springs, while the time-history analysis is performed under seismic, wind, or moving crane loads. The finite element results indicate that the moving crane does not change the major ambient vibrations of the factory with and without LRBs. For a normal design of LRBs, the high-tech factory with LRBs can decrease the seismic base shear efficiently but will have a much larger wind-induced vibration than that without LRBs, especially for the reinforced concrete level. Because micro-vibration is a major concern for high-tech factories, one should use LRBs with a large initial stiffness to resist wind loads, and use a small final LRB stiffness to reduce the seismic load of high-tech factories. This situation may make it difficult to obtain a suitable LRB, but it is an opportunity to reduce the seismic response without increasing the micro-vibration of high-tech factories.

1. Introduction

The lead rubber bearing (LRB) has the advantage of increasing a building’s natural period, which is away from the seismic period range, to avoid the amplification caused by earthquakes, so it is ideal to reduce seismic loads using LRBs for high-tech factories. However, the LRB may increase environmental vibrations induced by moving vehicles and wind loads, which will damage the high-tech production. In the literature, the issue of LRBs for high-tech factories is rarely studied. However, LRBs have many references in building and bridge research and testing. Turkington et al. [1,2] demonstrated the bridge isolation design process that can be applied to all earthquakes and used the numerical simulation of LRB bridges to obtain the long-term periodic displacement and effective damping, due to LRBs, which can improve the seismic capacity of general bridges. Fujita et al. [3] conducted a base isolation test for a building and found that LRBs can effectively reduce the building response. Salic et al. [4] used LRB numerical simulation on eight-layer structures to propose that the structure increases the natural period to avoid the shortest period of earthquake damage. Kalpakidis et al. [5] proposed a theory that predicts the dependence of feature intensity and energy time to predict the behavior of LRBs to simplify the analysis. Kalpakidis and Constantinou [6] proposed the necessary conditions for reducing the LRB scaling test and the need to consider the temperature rise of the lead core. Islam et al. [7] made a multi-layer building foundation combined with finite element simulations of LRBs, suggesting that this isolation technology has the ability to survive buildings under strong earthquakes. Li et al. [8] studied the rational yield ratio of isolation system for buildings, considering the influences of total heights, yield ratios, and seismically isolated schemes, and the rational range of the yield ratio is recommended to be 2%–3%.
In a number of references, correlation studies on the effects of LRB parameters are used to understand the best design parameters. Warn et al. [9] studied the relationship between lateral displacement and vertical stiffness of LRB and found that the vertical stiffness decreases with the increase of lateral displacement. Weisman and Warn [10] conducted experiments and numerical simulations to understand the relationship between LRB critical loads and lateral displacements and found that the critical loads decrease with the increase of lateral displacements. Al-Kutti and Islam [11] proposed that LRB systems with higher characteristic strength and relatively less isolation periods behave better to reduce structural offset, and LRBs with lower characteristic strength and a high isolation period can control the basic shear, providing a small acceleration and low inertia. Several references investigated the biaxial interactions of LRBs, which is convenient for understanding interaction effects. Nagarajaiah et al. [12] considered the formula proposed by Park to simulate the biaxial interaction of LRB. Huang et al. [13] proposed a two-way simulation formula for LRBs and made some experiments to compare the uniaxial and biaxial effects. Abe et al. [14] conducted a biaxial test on LRBs to understand the effect of the torsional coupling effect. It is suggested that the two-axis interaction cannot be ignored. Falborski and Jankowski [15] used the experiment to verify the effectiveness of an isolation system made of polymeric bearings in reducing structural vibrations and demonstrated that the application of this bearing can significantly reduce the lateral acceleration.
Although the application of LRBs is quite mature, there is very little or probably no research that focuses on high-tech factories directly. The reason is because the equipment used to produce high-tech productions requires strict micro-vibration standards, but it is unclear whether micro-vibration will increase significantly when LRBs are installed in high-tech factories. This study thus investigates both the seismic and ambient vibrations, due to the LRB installed in the high-tech factory, using the finite element method, while the ambient vibrations are induced by the wind load and moving crane.

2. Finite Element Modeling of Lead Rubber Bearings

The LRB, as shown in Figure 1, is a single or multiple lead core built into laminated rubber to reduce structural horizontal vibration during earthquakes. Because the laminated rubber has high vertical stiffness, low horizontal stiffness, and high recovery and lead metal has low yield stress, combining the characteristics of the two makes the LRB a good vibration isolation device.
Nagarajaiah et al. [12] proposed a two-way LRB model as below:
{ P } = { P x P y } = α F y Y { U } + ( 1 α ) F y { Z } = k d { U } + ( 1 α ) F y { Z }
Y { Z x ˙ Z y ˙ } = ( A [ I ]   [ z x 2 ( γ S i g n ( U ˙ x Z x ) + β ) Z x Z y ( γ S i g n ( U ˙ y Z y ) + β ) Z x Z y ( γ S i g n ( U ˙ x Z x ) + β ) z y 2 ( γ S i g n ( U ˙ y Z y ) + β ) ] ) { U x ˙ U y ˙ }
where {P} = [Px, Py]T is the LRB force vector, {U} = [Ux, Uy]T is the in-plane displacement vector between the LRB two sides, α is the ratio of the final LRB stiffness over the initial LRB stiffness ( α = kd/ke, ke= Fy/Y = initial LRB stiffness), Fy is the LRB yielding force, Y is the LRB deflection at the yielding force, kd is the yielding LRB stiffness, {Z} = [Zx, Zy]T is the LRB nonlinear variable, γ, β, and A are dimensionless parameters to control the shape of the hysteresis loop used in the two-way theory, where A/((γ + β)=1, and [I] is a unit vector. Equation (2) is nonlinear, and the Newton–Raphson method can be used to find {Z} using { U ˙ } obtained from the finite element analysis. The details can be found in [16]. The finite element stiffness matrix of the shear force contribution is:
K s h e a r = [ K 11 K 12 K 21 K 22 ]
Where ,   K 11 = P x U x = α ( F y Y ) + ( 1 α ) F y Z x U x ,   K 12 = P x U y = ( 1 α ) F y Z x U y K 21 = P y U x = ( 1 α ) F y Z y U x ,   and   K 22 = P y U y = α ( F y Y ) + ( 1 α ) F y Z y U y
where Z x U x , Z x U y , Z y U x , and Z y U y , can be found in [16]. Equations (3) and (4) produce an unsymmetrical global stiffness matrix, which may cause the double requirement of computer memory and time. Thus, one can empirically set K 21 = K 12 = ( K 12 + K 21 ) / 2 , and use the Newton–Raphson method to obtain the solution with small unbalance forces. The solution is still accurate, since equation (1) is used to find the LRB internal force vector without errors, but the Newton–Raphson iterations may increase when one direction is loading and the other is unloading. For the vertical direction of the LRB stiffness (Kv), a linear spring is used. The original LRB hysteretic curve under low speed loads can be modified as the functions of the wave frequency, wave speed, and axial load [17,18]. For simplicity, we used the original LRB model for finite element analyses.
Laboratory experiments were conducted to find the LRB characteristics at a vertical compressive force of 6300 kN and a maximum horizontal displacement of 0.149 m. The experimental results are shown in Figure 2, plotted as the dot line, where the LRB calibrated material properties are Ke = Kd/ α = 1.9 × 10⁵ kN/m (initial stiffness), Kv = 5 × 10⁷ kN/m, Fy = 370 kN, α = 0.0288, β = 0.1, and γ = 0.9 based on equation (1). Finite element analysis using the proposed LRB element mentioned above was then performed to find the hysteresis curve, as shown in the black line in Figure 2. This figure indicates a good agreement between the finite element analysis and experimental result.

3. High-Tech Factory and Finite Element Model

3.1. Illustration of the Structure of the High-Tech Factory

Before explaining the studied factory, we first briefly introduce the micro vibration standards in the high-tech industry. Gordon [19] recommended the vibration criterion (VC) for high-tech factories, where five levels include VC-E to VC-A under the velocity vibration at the floor slab from 42 dB to 66 dB with the increment of 6 dB, where the dB calculation can be found in the references [19,20]. The studied high-tech factory located in southern Taiwan is a three-story building mainly used for producing photovoltaic panels, where the first level is the VC-C reinforced concrete (RC) structure, the second level is the VC-B steel structure, and the third level is the VC-A steel structure. Intensive RC columns are used in the first level to avoid environmental vibration, while large span truss frames are used in the second and third levels to achieve greater production space. It is noted that the studied factory has no currently installed LRBs, and we use it to perform the seismic and micro vibration analyses with and without LRBs. Figure 3 shows the two typical frames in the X and Y direction. In the RC level, the column span is 6 m in the X direction and 5.2 m in the Y direction, where there are 71 and 27 column lines in the X and Y directions, respectively. As shown in Figure 3, the RC columns connected to the steel frame have a big square size of 1.5 m, and others are 0.6 m. For the two steel levels, the column span is 12 m in the X direction and 32 m in the Y direction, while the section properties are shown in Table 1. The thickness of the RC slab is 0.725, 0.55, and 0.45 m for the first to third level, respectively, and the main purpose of thick slabs is to reduce ambient vibration. For the two steel levels, the properties of steel sections are listed in Table 1, where columns are the box section and others are the H-shape section. This high-tech factory used pile foundations of 28 m length to avoid excess environmental vibration, while the reversed circulation piles with two different sections were constructed, and one is the diameter of 1.5 m connected to the big columns and the others are the diameter of 0.6 m connected to other columns. The soil profile contains 10 m inorganic clays of medium plasticity (undrained shear strength Su = 50 kPa), 5 m sandy soil (submerge internal frictional angle of sand ϕ = 33°), 10 m clay of hard plasticity (Su = 150 kPa), and the rest is very hard sand ( ϕ = 37°). We used the axial forces from columns to select appropriate LRBs, where two types of LRBs were used at the top of piles. As shown in Figure 3, the first type, named LRB1, was used to connect with the big columns, and the second type, named LRB2, was used to connect to other columns, where Table 2 shows the material properties of the two types of LRBs.

3.2. Finite Element Model

The finite element program from reference [21] was used in the finite element analysis, where the LRB element mentioned in Section 2 has been added into this program. The three-dimensional (3D) finite element mesh is shown in Figure 4 with the total number of degrees of freedom of 1,849,662 and 695,643 elements, where the high-tech factory, warrior slabs, crane, and rail system are included. Although the finite element is complicated, the major part of the mesh is modelled using 2-node 3D beam elements, such as beams, columns, piles, and crane rails of the factory, and the end released moments of beam elements are used to model truss members. Waffle slabs are simulated using 2-node 3D beam elements with 0.75 m interval, 0.4 m width, and 0.75, 0.55, and 0.45 m depth on the first, second, and third floor slabs, respectively, where the 0.18 m rigid zone at two beam ends is set. The slabs at the truss bottom on the second and third steel stories are modeled using 4-node plate elements with a thickness of 0.15 m. The soil-structure interaction is modelled using the API p-y, t-z, and Q-z nonlinear soil spring elements [22], where one end of these elements are connected to the beam element nodes of piles, and the other nodes are applied to the time-history seismic displacements for the earthquake load. If LRBs are included, the LRB elements mentioned in Section 2 are generated between foundation beams and the top of piles, as shown in Figure 3. The Rayleigh damping was used in the finite element analysis, where the mass damping equals 0.3/s and the stiffness damping equals 0.0003 s, which gives approximately 4% damping ratio at frequencies of 0.6 and 40 Hz, respectively.
The rail and crane system on the second level, as shown in Figure 4, contains two steel rails with the properties of the axial area of 0.17 × 10⁻² m2, Ix of 0.19E-4 m4, and Iy of 0.6 × 10⁻⁴ m4. The 2-node 3D beam element is used to simulate rails supported by the 1.3 m interval springs with the stiffness of 4.8 × 10⁵ kN/m and the damping of 10 kN-s/m between rails and slabs. Two slave nodes, labeled as node S in Figure 4, are controlled by the master node at the beam center at each support section, while a number of slave nodes W at the rail top are set for the route of moving wheel elements. Thus, the crane finite element model can be moved on the rails which are connected to the slab of the high-tech factory. The crane, as shown in Figure 4, is generated using a beam, spring-damper, and moving wheel elements [20] with the mass of five tons. Except the API soil spring, LRB, and moving wheel elements, other finite elements are linear elastic. The consistent mass method, Newmark’s integration method with the average acceleration, and the Newton–Raphson method were used to solve this nonlinear problem with a time step of 0.005 s and a simulation of 20,000 time steps for wind loads and 10,000 time steps for other loads. The finite element analysis contains two stages, where the first stage is the static analysis under the dead weight load using a step, and the second stage is the time-history analysis using 10,000 or 20,000 time steps. It is noted that a comparison against sensors’ measurements under both wind-induced and crane-induced vibrations was reported in [20,23] to validate the accuracy of the finite element analysis.

3.3. Illustration of Seismic Loads

The artificial earthquake generation software Simqke [24] was used to generate the time-history seismic acceleration using the spectrum from IBC 2006 [25], as shown in Figure 5. The peak ground accelerations (PGA) of 0.25, 0.28, 0.32, 0.36, and 0.40, respectively, were used for five seismic loads in the global X direction with Ts (Figure 5) of 0.6 s, where one group is shown in Figure 6. Moreover, the important parameter Ts representing the dominant frequency of seismic loads, as shown in Figure 5, was set to 0.4, 0.5, 0.6, 0.7, 0.8, 0.9, 1.0, 1.2, and 1.4 s, respectively, with the PGA of 0.32 g for nine seismic loads in the global X direction. For the other two directions, 70% and 30% of that PGA in the global Y and Z directions, respectively. This three-direction seismic accelerations are applied on the ground surface. We used ten soil layers with the interval of 5 m for the SHAKE 91 [26] input data. The SHAKE 91 program is then used to generate the acceleration field in each soil layer. Finally, the integration to obtain the displacement fields, which are applied to the node of each p-y, t-z, and Q-z curve elements for the seismic simulation.

4. Parametric Study Using LRBs in High-Tech Factories

4.1. Earthquake Effect

The base shears in the X and Y directions of the factory with and without LRBs are shown in Figure 7, where the PGA of the applied seismic load is 0.32 g, and Ts is 0.7 and 1.4 s for two cases, respectively. The base shear is determined from the summation of the shear forces at the top of all the piles, and it represents the total seismic loads changing with time for the superstructure of the high-tech factory. To simplify the time-dependent base shears in the X and Y directions, we first find the magnitude (S(t)) of the two-direction base shears using the following equation:
S ( t ) = S x ( t ) 2 + S y ( t ) 2
where Sx(t) and Sy(t), as shown in Figure 7, are the time-dependent base shears in X and Y directions, respectively. Then, we obtain the maximum base shear (Smax) of all the time steps during the finite element analysis. Finally, we define the base shear ratio (R = SmaxLRB/ SmaxNO-LRB) as the maximum base shear of the structure with LRBs (SmaxLRB) over that without LRBs (SmaxNO-LRB)), and this ratio can be used to understand the efficiency of the LRB used to structures during earthquakes. Figure 8 shows this base shear ratio changing with PGA under Ts of 0.6 s, and Figure 9 shows that changing with Ts under the PGA of 0.32 g. These figures indicate the following features:
(1) Figure 8 shows that when PGA increases, the base shear ratio increases slightly. However, for the worse case, the ratio for the PGA of 0.4 g is still small, which means that the LRB can effectively reduce the seismic load regardless of the magnitude of earthquakes. Figure 9 shows that when the dominant period of the earthquake increases, the base shear ratio increases to a noted extent. For long period seismic loads, such as near fault earthquakes, this situation can lead to LRB disadvantages.
(2) Usually, the high-tech factory requires thick floor slabs, big long trusses, and dense RC columns to reduce ambient vibration, but this arrangement will largely increase the building mass that causes large seismic loads during earthquakes. The high-tech factory with LRBs can decrease over 50% of the seismic base shear under Ts ≤ 1.0, which means that the high-tech factory can resist larger earthquakes using LRBs for not very long periods of seismic loads. The comparison of base shears, shown in Figure 7a,b, between the factory with and without LRBs indicates the above conclusion, where the time-history base shears of the factory with LRBs are much smaller than those without LRB.
(3) For the earthquake with a very long dominant period, such as 1.4 s, the LRB efficiency to reduce the factory base shear may decrease a little, since the natural period of the factory, due to the full yield of the LRB, can approach the earthquake with a long dominant period. However, earthquakes with this long dominant period often occur in significantly soft soil, and the design of LRBs for the high-tech factory may avoid this condition. Nevertheless, the simulation results indicate that the LRB efficiency for the earthquake with a long dominant period is still in the acceptable range, as shown in Figure 7c,d.

4.2. Micro-Vibration Induced by Mobile Cranes

Floor micro-vibration induced by moving cranes inside the high-tech factory is the major environmental source which affects the production operation in high-tech factories. As shown in Figure 4, the rail and crane system on the second level was studied, where the crane moves back and forth on the 60-m rail system with a maximum crane speed of 3 m/s. Figure 10 shows the ambient vibration in X, Y, and Z directions at the 10 m location from the railway centerline of the moving crane, while the factory was arranged with and without LRBs. This figure shows that the vertical (Z) vibration induced by moving cranes is much larger than those in the in-plane (X and Y) directions. Moreover, the major vibrations that are above 40 dB, and between 15 to 40 Hz, in these three directions for the factory with and without LRBs are almost identical, in which these major vibrations between 15 to 40 Hz are the slab natural frequencies invoked by the vibration of the moving crane, more details can be referred to in [20]. The ambient vibrations at other frequencies are small but different from the factory with and without LRBs. One can still realize that the factory without LRBs has smaller ambient vibrations than that with LRBs, because the LRBs cause a big rigid body motion of the high-tech factory. Nevertheless, the moving crane does not change the major ambient vibrations between the factory with and without LRBs.

4.3. Micro-Vibration Simulation Under Wind Loads

In addition to vibration generated by moving cranes, wind-induced floor vibration in high-tech buildings is another major source of environmental loads affecting production operations. Therefore, we followed the reference [23] to study the wind induced vibration, and the LRB effect was investigated in this paper, where the analysis only included dead and wind loads and the seismic load was not used in this section. Since wind forces applied to the factory are space- and time-dependent, we used the wind speed simulation software TurbSim [27] to generate the space- and time-dependent wind speed field in the Y direction on the whole X-direction outer plane to compare the floor vibration of the factory with and without LRBs. Since the building is much longer in the X direction than that in the Y and Z directions, the Y-direction wind-induced vibration should be the largest, and we will thus only focus on this direction vibration. The normal turbulence model is used in the analysis with the average wind speed at the height of 30 m (V30m) during 10 min, while V30m is set to 5, 10, 15, 20, and 25 m/s for the five cases, and the turbulence standard deviation is set according to IEC-61400-1 in 2019 [28], as follows:
σ 1 ( m / s ) = 0.16 ( 0.75 V 30 m + 5.6 )
In the setting of this program, an area of 500 m wide by 60 m high was arranged with 41 by 41 girders to find the turbulent wind speeds. The average wind speed in the vertical direction is according to the normal wind profile as below:
V Z = V 30 m ( Z 30 ) α
where Z (m) is the vertical height above the ground, and α equal to 0.14 is the power law exponent. Figure 11 shows the turbulent wind velocity at the height of 30 m on the building center, and it is noted that the wind velocity is time- and location-dependent. The wind pressure is determined as below:
P ( X , Y , Z , t ) = C P ρ V ( X , Y , Z , t ) 2 / 2
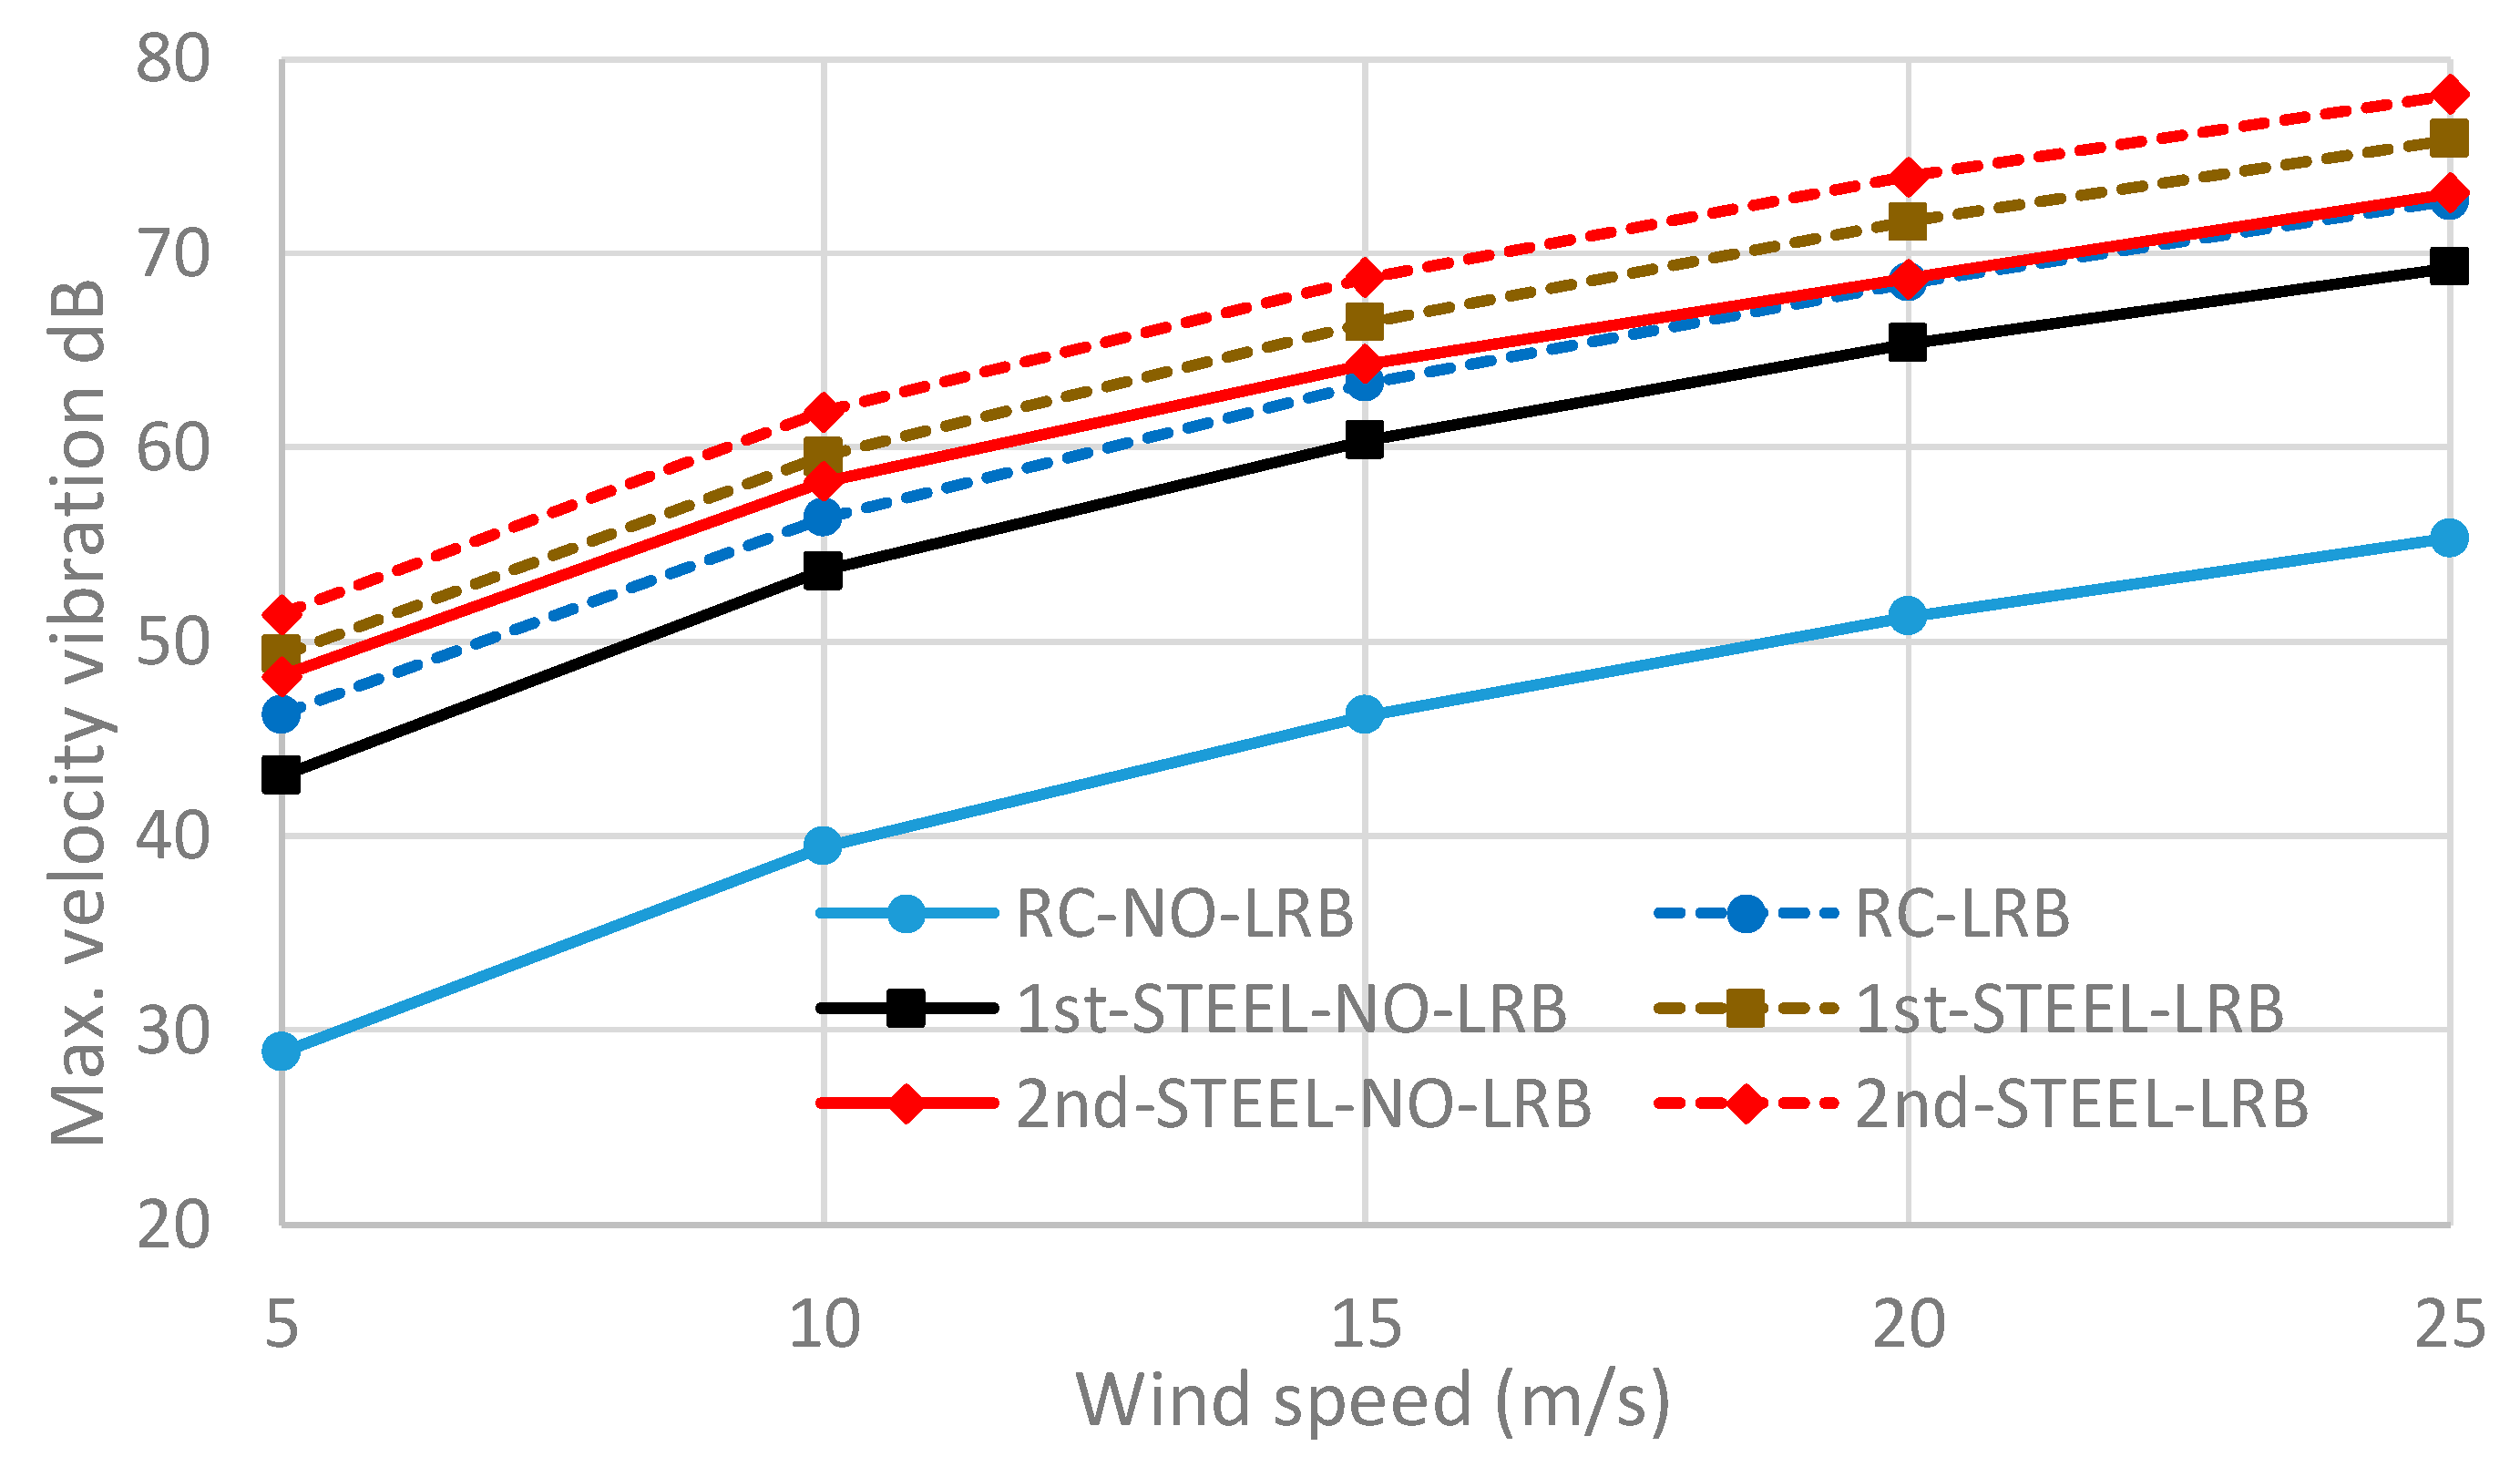
where P(X,Y,Z,t) is the time- and space-dependent wind pressure, V(X,Y,Z,t) is the time-and space-dependent wind speed from the TurbSim result, Cp (0.8) is the shape coefficient, and ρ (0.00128 t/m3) is the air density. Finally, the time-history finite element analysis is performed to find the wind-induced vibrations on the three floors, which are shown in Figure 12 for the case of the average wind speed V30m equal to 15 m/s. These figures indicate that the high-tech factory with LRBs will have much larger wind-induced vibration than that without LRBs, especially for the RC level that is located at the first level. The increased velocity vibration dBs for the RC level, the first steel level, and the second steel level are about 19, 6, and 4 dB, respectively. Therefore, this situation will bring great disadvantage to the use of LRB in high-tech factories. The reason for largely increasing the floor vibration induced by wind loads is that the initial stiffness of the LRB is considerably soft, so that the rigid body motion of the factory superstructure cannot be avoided due to the wind load. Even for a small wind load, which is still much larger than the load of moving cranes, the wind induced rigid body motion still causes problems for the factory with LRBs. We further analyzed the factory under different average wind speeds (V30m) and then only selected the maximum dB from all the frequencies, as shown in Figure 13. This figure indicates a very similar conclusion as that of the average wind speed equal to 15 m/s not only for the steel levels but also for the RC level, while the average wind speed was set to a board range from 5 to 25 m/s. An interpolation scheme was used to find the requirement of micro vibration according to the guidelines for high-tech factories, and the result is shown in Table 3. The table can be used to estimate the wind-induced vibration for a high-tech factory approximately, although the result is dependent on the structure dimensions and member sizes. This table also indicates that using LRBs for the high-tech factory will highly increase the wind-induced vibration, especially for the vibration on the RC level. For the high-tech without LRBs, the RC level at the first floor can resistant vibration under a moderate wind field, but the steel levels above the RC level may not be qualified for such a wind field. To overcome this problem, the shade of adjacent buildings for the high-tech factory was proposed to resistant the wind induced vibration [23], where the height of the shading building should be more than 60% of the factory height. This shade method is still useful for the high-tech factory with LRBs.

5. Design of LRBs Concerning the Micro Vibration

The LRBs should possess large stiffness for frequent small or moderate earthquakes but small stiffness for extreme earthquakes. If the micro vibration is the major concern for the high-tech factory, the investigation of Section 4 indicates that the selection of LRBs should first consider the problem of the large micro vibration induced by the wind load. Thus, the LRB with a large initial stiffness (Ke) and a small ratio of the final stiffness over the initial stiffness ( α ) should be used, where the large Ke can resist wind loads and the small α can reduce seismic loads. However, this situation may cause difficulties in finding a suitable LRB, so we will first select LRBs with large Ke, where 5E5 kN/m (Fy = 300 kN and Kv = 8E7 kN/m) and 3E5 kN/m (Fy = 200 kN and Kv = 5E7 kN/m) are used at the bottom of the big and small columns, respectively. Then, α is set to 1%, 2.5%, 5%, and 7% for three cases. The artificial earthquake is set using the PGA of 0.32 g and Ts of 0.9 s (Figure 5), and the average speed of the turbulent wind load is set to 25 m/s. The finite element results are shown in Figure 14 and Figure 15, where Figure 14 shows the velocity dB changing with frequencies for the wind load, in which the results are not dependent on α because the yield of LRBs is not obvious under the average wind speed of 25 m/s, and Figure 15 shows the base shear ratio (R = SmaxLRB/ SmaxNO-LRB) changing with α . The two figures indicate the following features:
(1) Figure 14 shows that the slab vibrations induced by the wind load are similar between the factories with and without LRBs, where the vibrations of the LRB factory are slightly large about 2 to 3 dB greater than those without LRBs. This improvement is significant compared to the result in Figure 11, because the large initial stiffness of the LRB resists the wind loads. Moreover, most of the LRBs are still not yielded, so the slab vibrations are independent of the LRB parameter α .
(2) Figure 15 shows that the α should be smaller at higher LRB initial stiffness to reduce the seismic load of high-tech factories. This situation may make it difficult to obtain a suitable LRB, for example, α in Figure 15 is less than 2%. Nevertheless, using the large initial stiffness and small α may reduce seismic responses but not increase the micro vibration for high-tech factories

6. Conclusions

The important conclusions drawn from this work are the following:
(1) For the crane-induced vibration, the vertical vibration is much larger than that in the in-plane directions. Moreover, the major vibrations between 15 to 40 Hz, induced by the slab natural frequencies and the moving crane, are almost identical for the factory with and without LRBs, and the ambient vibrations at other frequencies are small. This is because the factory mass is much larger than that of the moving crane. Thus, the moving crane does not change the major ambient vibrations between the factory with and without LRBs.
(2) The high-tech factory with LRBs can decrease over 50% of the seismic base shear for earthquakes with Ts≤ 1.0, and for earthquakes with a long dominant period, such as Ts = 1.4 s, the LRB efficiency may decrease a little. However, the high-tech factory with LRBs may have much larger wind-induced vibration than that without LRBs, especially for the RC level that is the most critical for micro vibration. This is because the turbulent wind is fully loaded to the factory while the LRB initial stiffness is not large enough. Therefore, this situation will bring great disadvantage to the use of LRB in high-tech factories. To overcome this problem, the shade of adjacent buildings for the high-tech factory may be an alternative to resistant the wind-induced vibration.
(3) Because micro vibration is a major concern for high-tech factories, one should use the LRB with a large initial stiffness and a small ratio of the final stiffness over the initial stiffness ( α ). The large initial stiffness of the LRB can resist the wind loads, while the small α can reduce the seismic load of high-tech factories. This situation makes it difficult to obtain a suitable LRB but may reduce seismic responses while not increasing the micro vibration for high-tech factories.

Author Contributions

S.-H.J. was responsible for simulations and paper writing, and C.-C.Y. and W.-K.H. checked the data and helped analyze results. All authors have read and agreed to the published version of the manuscript.

Funding

This research received no external funding.

Conflicts of Interest

The authors declare no conflict of interest.

References

  1. Turkington, D.H.; Carr, A.J.; Cooke, N.; Moss, P.J. Seismic design of bridges on lead-rubber bearings. J. Struct. Eng. 1989, 115, 3000–3016. [Google Scholar] [CrossRef]
  2. Turkington, D.H.; Carr, A.J.; Cooke, N.; Moss, P.J. Design method for bridges on lead-rubber bearings. J. Struct. Eng. 1989, 115, 3017–3030. [Google Scholar] [CrossRef]
  3. Fujita, T.; Sasaki, Y.; Fujimoto, S.; Tsuruya, C. Seismic isolation of industrial facilities using lead-rubber bearing. JSME Int. J. Ser. 3 Vib. Control Eng. Eng. Ind. 1990, 33, 427–434. [Google Scholar] [CrossRef]
  4. Salic, R.B.; Garevski, M.A.; Milutinovic, Z.V. Response of lead-rubber bearing isolated structure. In Proceedings of the 14th World Conference on Earthquake Engineering (14WCEE), Beijing, China, 12–17 October 2008. [Google Scholar]
  5. Kalpakidis, I.V.; Constantinou, M.C.; Whittaker, A.S. Modeling strength degradation in lead-rubber bearings under earthquake shaking. Earthq. Eng. Struct. Dyn. 2010, 39, 1533–1549. [Google Scholar] [CrossRef]
  6. Kalpakidis, I.V.; Constantinou, M.C. Principles of scaling and similarity for testing of lead-rubber bearings. Earthq. Eng. Struct. Dyn. 2010, 39, 1551–1568. [Google Scholar] [CrossRef]
  7. Islam, A.B.M.S.; Hussain, R.R.; Jumaat, M.Z.; Rahman, M.A. Nonlinear dynamically automated excursions for rubber-steel bearing isolation in multi-storey construction. Autom. Constr. 2013, 30, 265–275. [Google Scholar] [CrossRef]
  8. Li, A.; Yang, C.; Xie, L.; Liu, L.; Zeng, D. Research on the Rational Yield Ratio of Isolation System and Its Application to the Design of Seismically Isolated Reinforced Concrete Frame-Core Tube Tall Buildings. Appl. Sci. 2017, 7, 1191. [Google Scholar] [CrossRef] [Green Version]
  9. Warn, G.P.; Whittaker, A.S.; Constantinou, M.C. Vertical Stiffness of Elastomeric and Lead–Rubber Seismic Isolation Bearings. J. Struct. Eng. 2007, 133, 1227–1236. [Google Scholar] [CrossRef]
  10. Weisman, J.; Warn, G.P. Stability of elastomeric and lead-rubber seismic isolation bearings. J. Struct. Eng. 2012, 138, 215–223. [Google Scholar] [CrossRef]
  11. Al-Kutti, W.; Islam, A.B.M.S. Potential design of seismic vulnerable buildings incorporating lead rubber bearing. Buildings 2019, 9, 37. [Google Scholar] [CrossRef] [Green Version]
  12. Nagarajaiah, S.; Reinhorn, A.M.; Constantinou, M.C. Nlinear dynamic analysis of 3-d-base-isolated structures. J. Struct. Eng. 1991, 117, 2035–2054. [Google Scholar] [CrossRef] [Green Version]
  13. Huang, W.H.; Fenves, G.L.; Whittaker, A.S.; Mahin, S.A. Characterization of seismic isolation bearings for bridges from bi-directional testing. In Proceedings of the 12th World Conference on Earthquake Engineering, Auckland, New Zealand, 30 January–4 February 2000. [Google Scholar]
  14. Abe, M.; Yoshida, J.; Fujino, Y. Multiaxial behaviors of laminated rubber bearings and their modeling. I: Experimental study. J. Struct. Eng. 2004, 130, 1119–1132. [Google Scholar] [CrossRef]
  15. Falborski, T.; Jankowski, R. Experimental study on effectiveness of a prototype seismic isolation system made of polymeric bearings. Appl. Sci. 2017, 7, 808. [Google Scholar] [CrossRef]
  16. Yuantien, C.C. Application of Biaxial Lead Rubber Bearings in High-Tech Factories. Master’s Thesis, National Cheng-Kung University, Tainan, Taiwan, 2019. Available online: http://etds.lib.ncku.edu.tw/etdservice/view_metadata?etdun=U0026-1408201913481400 (accessed on 22 February 2020).
  17. Benzoni, G.; Casarotti, C. Effects of vertical load, strain rate and cycling on the response of lead-rubber seismic isolators. J. Earthq. Eng. 2009, 13, 293–312. [Google Scholar] [CrossRef]
  18. De Domenico, D.; Falsone, G.; Ricciardi, G. Improved response-spectrum analysis of base-isolated buildings: Asubstructure-based response spectrum method. Eng. Struct. 2018, 162, 198–212. [Google Scholar] [CrossRef]
  19. Gordon, C.G. Generic criteria for vibration sensitive equipment 1991. In Vibration Control in Microelectronics, Optics, and Metrology; SPIE: Bellingham, WA, USA, 1992; Volume 1619, pp. 71–75. [Google Scholar]
  20. Ju, S.H.; Kuo, H.H.; Yu, S.W.; Ni, S.H. Investigation of vibration induced by moving cranes in high-tech factories. J. Low Freq. Noise Vib. Act. Control 2019. [Google Scholar] [CrossRef]
  21. Ju, S.H. Development a Nonlinear Finite Element Program with Rigid Link and Contact Element; NSC-86-2213-E-006-063; Taiwan, 1997; Available online: http//myweb.ncku.edu.tw/~juju (accessed on 22 February 2020).
  22. American Petroleum Institute (API). Planning, Design, Planning, Designing, and Constructing Fixed Offshore Platforms—Load and Resistance Factor Design. In API RP 2A-LRFD, 2nd ed.; American Petroleum Institute: Washington, DC, USA, 2019. [Google Scholar]
  23. Ju, S.H.; Kuo, H.H. Experimental and numerical study of wind-induced vibration in high-tech factories. J. Perform. Constr. Facil. 2019. [Google Scholar] [CrossRef]
  24. MIT. SIMQKE: A Program for Artificial Motion Generation: User’s Manual and Documentation; M.I.T. Department of Civil Engineering: Cambridge, MA, USA, 1976. [Google Scholar]
  25. IBC. International Building Code 2006; International Code Council: Birmingham, AL, USA, 2006. [Google Scholar]
  26. Idriss, I.M.; Sun, J.I. User’s Manual for SHAKE91: A Computer Program for Conducting Equivalent Linear Seismic Response Analyses of Horizontally Layered Soil Deposits; Center for Geotechnical Modeling, Dept. of Civil and Environmental Engineering; University of California: Davis, CA, USA, 1993. [Google Scholar]
  27. Jonkman, B.J.; Buhl, M. Turbsim User’s Guide v2.00.00; Technical Report No. NRELEL-500-36970; National Renewable Energy Laboratory (NREL): Golden, CO, USA, 2004. [Google Scholar]
  28. International Electrotechnical Commission. IEC 61400-1: Wind Turbines—Part 1: Wind Energy Generation Systems–Part 1: Design Requirements; International Electrotechnical Commission: Geneva, Switzerland, 2019. [Google Scholar]
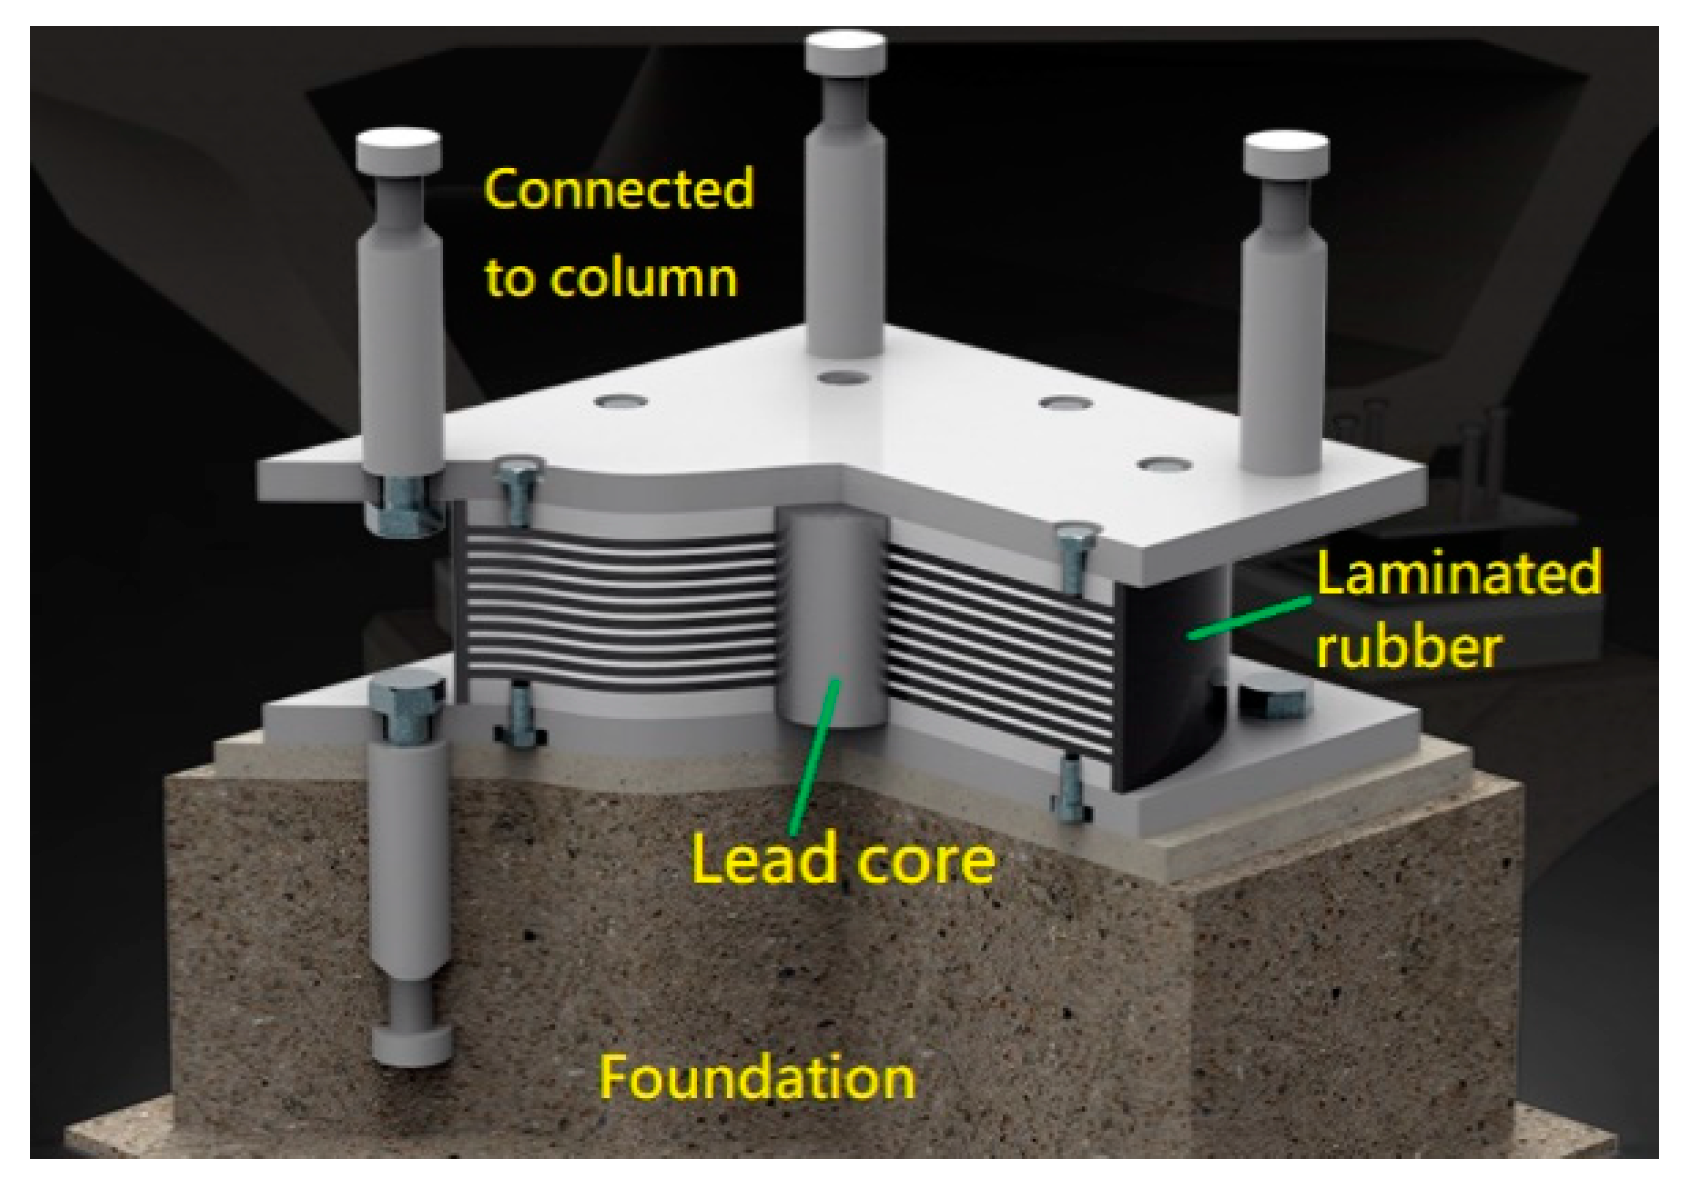
Figure 1. Illustration of the lead rubber bearing (LRB) containing a lead core and laminated rubber.
Applsci 10 01502 g001
Figure 2. Experimental and finite element results for the LRB hysteresis curve.
Applsci 10 01502 g002
Figure 3. Two typical frames of the high-tech factories.
Applsci 10 01502 g003aApplsci 10 01502 g003b
Figure 4. Three-dimensional (3D) Finite element mesh containing the high-tech factory, slabs, rails, and crane (The big and small columns are connected to LRB1 and LRBs, respectively, as shown in Table 2).
Applsci 10 01502 g004
Figure 5. Seismic response spectrum according to IBC 2006 [25].
Applsci 10 01502 g005
Figure 6. Artificial time-history seismic acceleration for Ts = 0.6 and peak ground accelerations (PGAs) of 0.36, 0.252, and 0.108 g in the local X, Y, and Z directions.
Applsci 10 01502 g006aApplsci 10 01502 g006b
Figure 7. Comparison of base shears between the factory with and without LRBs under the seismic load of PGA = 0.32 g and Ts = 0.7 s and 0.14 s.
Applsci 10 01502 g007
Figure 8. The base shear ratio changing with PGA under Ts of 0.6 s.
Applsci 10 01502 g008
Figure 9. The base shear ratio changing with Ts under the PGA of 0.32 g.
Applsci 10 01502 g009
Figure 10. Velocity vibration dB at 10 m from the centerline of the crane railway on the first steel level for the factory with or without LRBs.
Applsci 10 01502 g010
Figure 11. Turbulent wind velocity at the height of 30 m on the building center.
Applsci 10 01502 g011
Figure 12. Velocity vibration dB at the first to third floors under the wind load with the average wind speed of 15 m/s for the factory with or without LRBs.
Applsci 10 01502 g012aApplsci 10 01502 g012b
Figure 13. Maximum velocity vibration dB at the first to third floors under the wind load with the average wind speed from 5 to 25 m/s for the factory with or without LRBs.
Applsci 10 01502 g013
Figure 14. Velocity vibration dB changing with frequencies at the first to third floors under the wind load with the average speed of 25 m/s for the factory with or without LRBs (The dB values with LRBs due to α from 0.01 to 0.07 are almost identical.).
Applsci 10 01502 g014
Figure 15. The base shear ratio changing with α (Equation (1)) under the PGA of 0.32 g and Ts of 0.9 s.
Applsci 10 01502 g015
Table 1. The steel sections in the second and third levels of the high-tech factory, as shown in Figure 3 (A572 steel with Fy = 345 MPa).
MemberAxisLabelMember Dimensions (mm)
d×bf×tw×tf
ColumnALLC1BOX 900 × 900 × 35 × 35
BracesXB1RH 400 × 400 × 13 × 21
BracesYB2RH 414 × 405 × 18 × 28
BracesYB3RH 428 × 407 × 20 × 35
GirderXG1RH 588 × 300 × 12 × 20
GirderYG2BH 375 × 200 × 10 × 25
Table 2. LRB material properties (= 0.1, and = 0.9 based on Equation (1)).
NameModel/Parameter K e ( k N / m ) F y ( kN ) α K v ( k N / m )
LRB1EIRL-G4-1000-1701.9732×104196.08500.07694.660×106
LRB2EIRL-G4-700-1301.4058×104114.82990.07693.259×106
Table 3. The minimax average wind speed (m/s) during 10 min for the criteria of the micro-vibration for the studied high-tech factory.
Level VC-D(48dB)VC-C(54dB)VC-B(60dB)VC-A(66dB)Type
1st Without LRB16.823.4>25>25RC
1st With LRB 5.98.812.617.6RC
2nd Without LRB7.310.314.720.9Steel
2nd With LRB 4.47.310.414.7Steel
3rd Without LRB4.97.911.517Steel
3rd With LRB 3.46.29.113Steel