Abstract
In Traditional Chinese Medicine (TCM), tongue diagnosis is an indispensable diagnostic method. Due to the limitations of acquisition devices and variations of the illumination, there is a significant color distortion between the captured tongue image and the human visual perceived image. In this paper, we proposed a Two-phase Deep Color Correction Network (TDCCN) for TCM tongue images. In the first phase, a deep color correction network was designed to model the mapping between the captured image and the target objective chromatic values under a standard lighting condition. The first phase provides consistent color tongue images by using different cameras and capture devices. The output tongue images at this phase can be used for further automatic quantitative analysis. The second phase provides flexible color adjusting options to adapt to different work environments and the subjective preference of doctors for visually perceived color appearance. Only three additional parameters are used to describe the adjustment operation. Experimental results show that our method achieved state-of-the-art performance in objective color correction and obtained satisfactory perceptual adaptation.
1. Introduction
In Traditional Chinese Medicine (TCM), the tongue conveys abundant valuable information about the health status of the human body, i.e., disorders or even pathological changes of internal organs can be reflected by the human tongue and observed by medical practitioners [1]. Tongue image analysis is the main direction of the objectification of tongue diagnosis [2,3]. Tongue color is one of the most important characteristics of tongue diagnosis. However, even under the same tongue, the color appearance of captured digital tongue images displayed using different cameras under different lighting conditions and displayed on different monitors can lead to different diagnostic results. Therefore, color correction of the tongue image is indispensable for computer-assisted tongue image analysis.
The color distortion of the captured tongue image usually results from lighting conditions, cameras, and monitors. In this paper, we formulate color distortion as the sum of the objective distortion () and the perceptual distortion (), as shown in Figure 1. The objective distortion represents a quantitative difference between the captured image and the target chrominance value. Perceptual distortion reflects the difference between the human perceived tongue images from the patients and the monitors. As shown in Figure 1, a doctor examines a patient’s tongue under natural lighting in a traditional manner. The human visual system has the ability to respond to various dynamic lighting conditions through adaptive mechanisms. In order to quantitatively record and analyze color information, the color checker [4] is a useful tool for providing chromaticity values for specific colors under standard (static) lighting conditions. As shown in the bottom row of Figure 1, there are several color distortions during tongue image capture and display, including differences between simulated lighting conditions and standard light sources (), differences via cameras () and difference via displays (). Note that also includes inconsistencies between different devices.
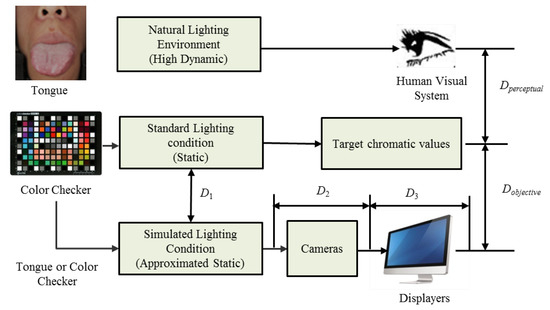
Figure 1.
Color distortions in the procedure of tongue images acquisition. We formulate the color distortion as the sum of an objective distortion () and a perceptual distortion ().
There are several approaches to reduce color distortion. We can simulate standard lighting conditions with specially designed devices. According to the recommendations of the International Commission on Illumination (CIE), a D65 light source with a color temperature of 6500 K is selected as the standard lighting environment, which can simulate daylight. Distortions introduced by the camera can be significantly alleviated by the gray card correction, which is suitable for some specific types of cameras. We can also correct the color distortion of the monitor with professional tools like X-Rite i1 Display Pro or Spyder5 Express. Color distortion from different cameras and inconsistencies with different capture devices should be corrected by a color correction algorithm.
As shown in Figure 1, in addition to objective distortions (), perceptual distortions () such as the variety in the open working environment and subjective preference of the doctors are also difficult to handle, which has been ignored by most color correction methods.
Generally, the lighting condition of a doctors’ consultation room exhibits a high dynamic variation due to many factors, such as windows, sunlight, and lighting. They differ from the simulated lighting conditions in our capture device. Some doctors are not accustomed to the differences between standard lighting conditions and the environments that they are familiar with. When observing the tongue images obtained by the imaging system, their accurate diagnosis will be affected. Therefore, it is necessary to provide a flexible solution to adjust the perceived color appearance of the imaged tongue image according to the doctor’s preferences and keep the objective chromaticity value of the captured tongue image unchanged for further quantitative analysis.
In this paper, a Two-phase Deep-Color Correction Network (TDCCN) for TCM tongue images is proposed, which extends our previous conference work [5] to handle objective and subjective color correction. In our method, the color correction of the tongue image is divided into two phases, namely objective color correction (OCC) for computer analysis and perceptual color correction (PCC) for doctor observation. The contributions of this paper are as follows:
- A novel two-phase color correction framework for tongue images is proposed in this paper for the first time. The framework can handle both objective color consistency and the perceptual flexibility. The output tongue image of the proposed method does help the computer-assisted tongue diagnosis, as well as the subjective preference of doctors.
- In order to correct the objective color distortion of the tongue image, a simple and effective convolutional neural network was designed in the first phase, where the number of layers was determined through experimental performance.
- To provide flexibility in dealing with various working environments and personal preference of doctors, a color transformation based perceptual color adjustment scheme is provided in the second phase.
Intensive experiments and results show that our proposed TDCCN can achieve better performance than several existing methods of color correction of TCM tongue images. Our method can effectively deal with objective and subjective color correction.
2. Related Work
Color correction has become one of the most critical issues in tongue image processing and computational color constancy. Thus far, lots of methods have been investigated, such as polynomial-based methods [6,7,8,9,10,11], SVR-based methods [12], and neural network-based color correction methods [13,14].
Most existing color correction methods record the three-color response (RGB) to a standard color space. Graham et al. [8] employ the alternating least squares technique for color correction of nonuniform intensity. Their method estimates both the intensity variation and the transformation matrix from a single image of the color checker. Finlayson et al. [9] employs root-polynomial regression to handle color correction as the exposure changes. These two methods are proposed for general color correction applications. Regarding the tongue images, David Zhang’s research group at the Hong Kong Polytechnic University did excellent research. In their group, Wang et al. [11] classify the 24-patch color checker into tongue-related and tongue-independent categories to calculate the color difference between the target value and the corrected value. They further designed a new color checker for the tongue color space to improve the accuracy of the correction by a polynomial regression algorithm [10]. In addition to polynomial-based methods, Zhang et al. [12] use support vector regression (SVR) in tongue image color correction. Our group, the Signal and Information Processing Lab at Beijing University of Technology has been researched on tongue image analysis system for more than 20 years. In our group, Wei et al. [15] apply Partial Least Squares Regression (PLSR) to their algorithm. To improve the effectiveness of the PLSR-based color correction algorithm, Zhuo et al. [16] proposed a K-PLSR-based color correction method for TCM tongue images under different lighting conditions. Zhuo et al. [13] further propose a SA-GA-BP (Simulated Annealing-Genetic Algorithm-Back Propagation) neural network. They used several colors similar to the tongue body, tongue coating, and skin to improve the accuracy of the correction.
In addition to the contributions of these two groups, there are several papers on this topic. Zhang et al. [14] applied the mind evolutionary computation and the AdaBoost algorithm in the conventional BP neural network. Sui et al. [17] established a mapping between the collected RGB tongue images and the standard RGB value through the calibration of the X-rite Color Checker.
The above-mentioned methods have made great progress in the development of tongue image color correction. However, the existing methods have two drawbacks. Firstly, most of them ignore the issue of perceptual adaptation. They mainly aim to reduce objective chromatic errors to facilitate further machine analysis rather than reduce perceptual color distortion. Secondly, due to the limitations of traditional regression models, there is still room to further improve the regression accuracy of objective color correction.
Image objective color correction is a regression problem, and we attempt to solve it through a convolutional neural networks (CNN). CNN is a special form of feed-forward neural network (FNN), which is trained by back-propagation [18]. Hornik et al. [19] have proved that FNN are capable of approximating any measurable function to any desired accuracy. In addition, many advances have been achieved on learning methods and regularization for training CNN, such as Rectified Linear Unit (ReLU) [20]. Furthermore, the training process can be accelerated by the powerful GPUs. Generally, CNNs are used to recognize visual patterns directly from pixel images variability. Gou et al. [21] corrected large-scale remote sensing image based on Wasserstein CNN. However, CNNs are rarely used for accurate color correction of tongue images. Motivated by Hornik et al. [19], we established a CNN model to embed the relationship between the distorted color of the captured tongue image and the target chromatics under standard lighting conditions.
As for perceptual color correction, in practice, due to the correlation of the RGB channels, directly adjusting the RGB channels will be complicated. We should choose an appropriate color space where each component is independent [22]. When representing a typical three-channel image in many of the most well-known color spaces, there will be correlations between the different channels. For example, in RGB space, if the blue channel is larger, most pixels will have larger values for the red and green channels. This means that, if we want to change the appearance of a pixel colors in a coherent way, we should carefully fine-tune all the color channels in tandem. It makes color modification more complicated.
Motivated by the color transfer method, we choose an appropriate color space and then use simple operations. We want an orthogonal color space without a correlation between the axes. Ruderman et al. developed a color space called l, which minimizes the correlation between the channels of various natural scenes [23]. We modified the color transfer to provide a simple parameter-based adjustment scheme to handle perceptual distortion in our method.
In order to meet the requirements of quantitative analysis and perceptual color adaptability, we formulated the color distortion of the tongue image acquisition and analysis system as objective distortion and perceptual distortion. Minimizing objective distortion results in chromaticity consistency, which means that similar colors of the tongue are represented as similar chromatic values. This is a prerequisite for automatic image analysis. While reducing perceptual distortion, it helps to show an image of the tongue that is as close as the real tongue. TCM practitioners can make a correct diagnosis from low-perceptual distortion tongue images.
In our algorithm, a two-phase framework is designed to reduce objective distortion and perceptual distortion, respectively. These two phases are objective color correction (OCC) and perceptual color correction (PCC). In the first phase, a simple but effective deep neural network was designed to correct the tongue image to standard lighting conditions. In the second phase, a manual adjustment scheme is provided to adapt the perceptual tongue color images to the color perceived by humans under different lighting conditions. The two phases are cascaded together.
3. The Proposed Algorithm
The framework of our proposed algorithm is shown in Figure 2. It can be divided into offline training and online testing stages. During the offline training stage, a simple convolutional neural network is designed and trained using a color checker. During the online testing stage, the well trained convolutional neural network is utilized to objectively correct the captured tongue images to a standard lighting condition. The output images of the first phase will be stored in a database for further automatic analysis. Then, the second phase provides a flexible way to adjust the color appearance of the tongue image displayed on the screen through three parameters. We will also save these parameters to convert the saved objectively corrected tongue images into a perceptual adjusted image. We also defined a set of default parameters for several typical lighting conditions.
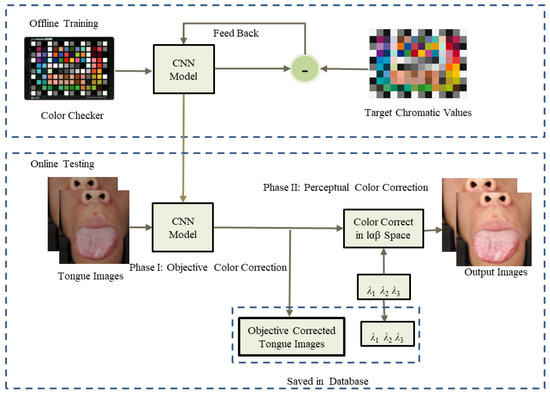
Figure 2.
The framework of the proposed algorithm.
We will describe our algorithm in detail in the rest of this section.
3.1. Phase I: Objective Color Correction (OCC)
3.1.1. The Architecture of the OCC Network
The architecture of the OCC network is shown in Figure 3. OCC network includes three parts: input layer, nonlinear transform layers, and an output layer. They work together to perform feature learning between distorted color map and original color map. For a regression model, we only utilize the convolution layers without pooling in our network.
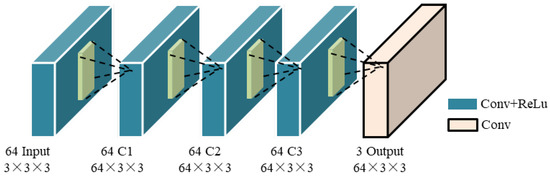
Figure 3.
The framework of the OCC network.
In the input layer, the first operation is feature extraction. The convolutional layers transfer the image from the spatial domain to the feature domain. To train the OCC network for color correction, the input image is the captured color patches of the color checker, which is tiled into the pixel color patches. The target output is the standard chroma value of the color checker. In the input layer, the feature map is composed of a set of three-dimensional tensors. There are 64 filters of size for generating 64 feature maps. The nonlinear activation function is ReLU. The input layer can be expressed as the following equation:
where and are filters and biases, respectively. The size of is . Subsequent feature learning plays an important role in learning the nonlinear model, which is essential for color recover. In the nonlinear transformation layers, ReLU is used for nonlinearity. They can be expressed as
where and are the convolution filters and biases in the 2nd to 4th layers. The kernel size of the convolution filter is . Except for the output layer, the feature map of each layer is 64 channels. All feature maps have the same spatial resolution as the input image.
In the output layer, the size of filter is . These filters reconstruct the output by a convolutional operation given by Equation (3):
To demonstrate the architecture of the OCC network, the parameter details are listed in Table 1. For all convolutional layers, the padding is zero, and the stride is set at 1.

Table 1.
The architecture of the OCC network.
The number of hidden layers of the OCC network model is defined by experimental performance. We tested the numbers 1 to 10 of the hidden layers and chose the best number of hidden layers. For more details, see Section 4.1.
3.1.2. Network Training
For network training, a training set is collected. In general, color correction works better if the Color Checker has more color patches with a wider color gamut. Therefore, we chose Color Checker SG [4] with 140 color patterns to train our model. Standard reference chromaticity values are available on the official website of X-Rite’s [4]. In this phase, the sRGB color space is chosen because of its device-independent property.
The loss function is Mean Squared Error (MSE), given by Equation (4):
where represents N training samples, contains R, G, B color channels, and is the output of the OCC network, with as the input and parameters W and B. To train network parameters, the loss function is optimized by using the Adam algorithm [24].
3.2. Phase II: Perceptual Color Correction (PCC)
Inspired by Reinhard et al.’s method of color transfer between images [22], we proposed an adjustable scheme for the phase of perceptual color correction. The original color transfer imposed the color characteristics of the example image on the target image through a simple statistical analysis. Using color space [22], it can minimize the correlations between the channels of many natural scenes. In the color space, l is the achromatic channel, is the yellow-blue channel, and is the red-green channel. In the color transfer method, both the source and reference images are first converted to the color space. Then, the ratio of the standard deviations of the two images is used to average and scale the data in each channel. Finally, the average of the reference image of each channel is added to the scaled data and then converted back to the RGB color space. The procedure for this process in the space is given as the following Equations (5)–(7):
During our perceptual color correction phase, no reference image was available. Therefore, we improved this method to a single image color correction method:
where , , and are user adjustment parameters. , , and are the values of the input color in space, , , and are averages for each channel. The specific effects of the tongue image and the range of user parameters will be discussed later.
The range of each adjustable parameter is determined by a collection of tongue images that are captured under open lighting conditions. We capture tongue images at different times of the day, say 9:00 a.m., 1:00 p.m. and 6:00 p.m., and calculate the mean and variance of each channel in color space for the collected images. The range of each channel is used to ensure that the adjusted parameters are reasonable.
One could immediately think of the question of why we don’t exploit the color transfer scheme for objective color correction. Actually, the mean and standard deviation of the image depends on the content. Therefore, in addition to efficiency in perceptual color correction, content in the image, such as textual and objects, will also cause changes in the mapping function. Therefore, it is not suitable for objective color correction.
In practice, we capture an image of the tongue in the consultation room, and doctors can adjust the image to their personal preferences and make the image look like it was captured in the room instead of the imaging system. We get a set of parameters that can be used to adjust the captured image. Please note that we only need to save the output corrected image and three perceptual parameters of the first phase. Perceptually corrected images can be easily restored from stored tongue images and their parameters.
4. Experimental Results and Discussion
We now evaluate the performance of our proposed method in this section, including the experimental setup and evaluation metrics, evaluation of the objective color correction network, and the effectiveness of perceptual color correction.
4.1. Experimental Setup and Evaluation Metrics
4.1.1. Experimental Setup
In this paper, tongue image capturing devices developed by Signal and Information Processing Lab at Beijing University of Technology are used. As shown in Figure 4, the lighting condition in the device simulates the standard D65 illumination, which is intended to approximate the daylight with a color temperature of 6500 K. The color rendering index (CRI) of the Light-Emitting Diode (LED) lights is above 92. The brightness of the device can be adjusted. The default shooting camera is Canon EOS 1200D (Canon Inc., TaiChung, Taiwan), which has been corrected using a gray card. The simulated lighting condition can be adjusted slightly to model deviation between different individual devices. In our experiments, we considered five cases in Section 4.2.
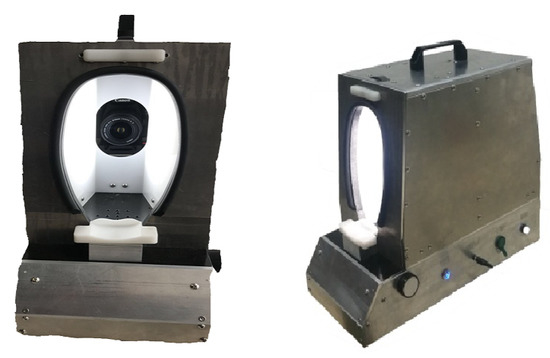
Figure 4.
Appearance of the capturing device.
In our paper, the model is trained using the MatConvNet software package. The weight of the proposed network is initialized by the method in [25]. We use an Adam optimization algorithm and a mini-batch size of 128 in our OCC network. The configuration of the computer is Intel Core i7-6700 CPU @ 3.40 GHZ and TITAN X (Pascal) GPU.
4.1.2. Data Sets
The images in the training set and test set are captured by the capture device shown in Figure 4. We collected a set of color checker images for objective evaluation. For each color square, we have captured more than 52 images at different locations in the imaging field. We randomly selected two images for each color to construct the test set, and the remaining images are used to form the training set.
For each color square in a captured image, we manually select five patches from the center and four corners of the color square. The size of each patch is pixels. To enhance the robustness of the CNN network, we augmented each patch by flipping, rotation, and slight translation, to eight patches. Then, 140 color patches for a color checker were stitched into the image sample. Therefore, about 2000 images for each experimental scenario are synthesized into our training set.
For the test set, we constructed it from the selected test images. We selected color squares called the area of interest in Color Checker SG composed of three regions and shown in Figure 5. The first region is the original color checker colors the same as which is used in [11,15]. The second region is the expanded skin tone, and these are similar to the colors of tongue coating. Colors in the third region are close to those of the tongue body and tongue coating. Without argumentation, there are 10 synthesized images with 40 colors in our test set. Examples are shown in the upper row of Figure 6.
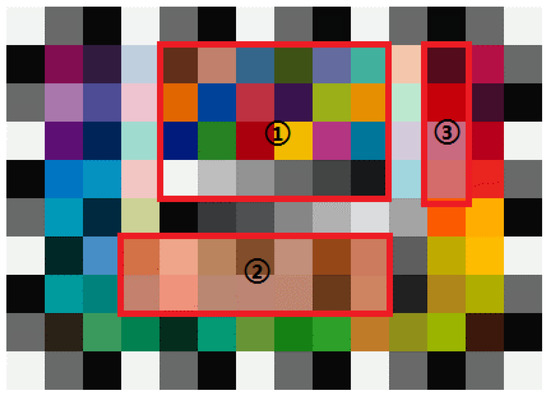
Figure 5.
The color area of interest.
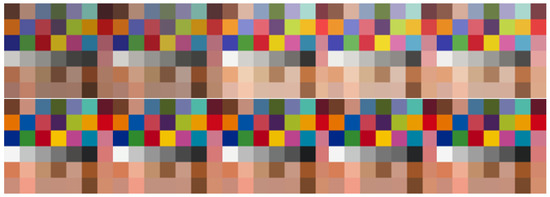
Figure 6.
The captured color checkers (upper row) and their corrected results (bottom row) under five different illuminations. From left to right, they are captured under ILL1 to ILL5.
The standard RGB and Lab values for each color in the color checker are employed as the labels for image samples in the training and test sets.
4.1.3. Compared Methods
To comprehensively evaluate the performance of our OCC network in the following sections, we have compared it with three methods that are commonly used in color correction of the TCM tongue images, including the polynomial-based correction method (POLY) [11], the SVR-based correction method (SVR) [12], and the Kernel Partial Least Squares Regression (K-PLSR) based color correction method [16]. In the experiments, the regression model of 3 elements x: [R, G, B] used by [6] is selected in the polynomial-based method. The parameters of the SVR-based method are selected the same as [12], that is, using RBF (Radial Basis Function) kernel and , , . For the K-PLSR-based method, the nonlinear kernel function selected is also RBF, which is , the same as [8]. We have implemented the polynomial-based method. The source codes of the SVR and the K-PLSR based methods are provided by the authors. We have trained the models using our training set.
4.1.4. Evaluation Metric
Involving physiology, psychology, and colorimetry, the evaluation of color correction algorithms is very challenging. The evaluation methods are usually composed of two parts: the subjective evaluation and the objective evaluation. The subjective evaluation is to visually evaluate the color quality of the color samples by a certain number of observers. This method is intuitive and reliable.
In general, two colors appear different from a visual perspective if their chromatic distance is out of a threshold. It is commonly considered in the range if in the CIE Lab color space [16,26]:
For subjective evaluation, we captured tongue images for testing. We can conduct the subjective evaluation by making comparisons between the captured and the corrected tongue images.
4.1.5. The Hidden Layers of the OCC Network
To analyze the optimal structure of the OCC network, we have trained the network with the different number of hidden layers. The experimental results are shown in Table 2. We can see that the becomes stable from three to eight hidden layers, while the testing time will increase as the number of layers increase. According to experimental results, we set the number of hidden layers at 3.
Table 2.
Comparison results of different hidden layers.
4.2. Evaluation of the Objective Color Correction Network
To measure the performance of the OCC network, we conducted several experiments under five different lighting conditions using different cameras and compare them with different color correction methods.
4.2.1. Robustness on Different Lighting Conditions
Our capture devices provide different lighting conditions by adjusting the brightness. There are five conditions, including 1328lux, 1415lux, 1968lux, 2226lux, and 2424lux. They are denoted as ILL1 to ILL5 (ILluminance Level). The top row of the Figure 6 shows examples of test samples under different lighting conditions. After color correction, the visual perception of color patches will be closer, as shown in the bottom row of Figure 6. Figure 7 shows the comparison results of tongue images captured under five different illuminations before and after correction. To enhance the color difference of the tongue, segmentation results are shown. Subjectively, our method allows the tongue image to show a consistent rendering after correction. We can conclude that our OCC network can eliminate inconsistencies in five different lighting conditions.
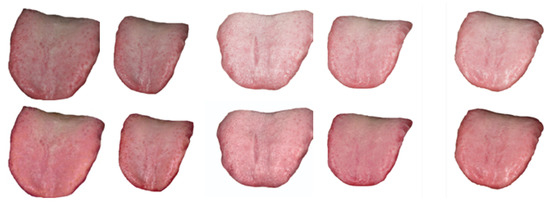
Figure 7.
The captured tongue images (upper row) and their corrected results (bottom row) under five different illuminations. From left to right, they are captured under ILL1 to ILL5.
To obtain objective results, we re-selected pixel color patches in each color block to calculate the color difference. The results are shown in Table 3, where and are the average color difference and the maximum color difference of the color patches, respectively. As shown in Table 3, under five lighting conditions, and are greatly reduced. Furthermore, all of the corrected images are less than 3, which means there is no visual difference. Therefore, our OCC network achieves high accuracy correction results for objective evaluation.
Table 3.
Color difference of testing samples under five different illuminances before and after correction.
We have calculated the average difference of the same color patches in the region of interest before and after correction in the CIE Lab color space, as shown in Table 4. Before correction, the average color difference of the same color patch in the color checker image ranged from 2.71 to 18.17. After color correction, the range is reduced to [0.67, 1.21].
Table 4.
Average color difference between region of interest under different illuminances before and after correction.
4.2.2. The Robustness between Different Cameras
To verify the robustness between the different cameras, we compared the corrected images which are captured by Logitech C920 under the lighting conditions of the ILL3 manual camera. The results are shown in Table 5. Obviously, our method is the most robust model for different cameras.
Table 5.
Comparison results of the color differences using the four methods with different cameras.
The results show that a single well-calibrated imaging device can achieve highly consistent tongue image acquisition.
4.2.3. The Consistency of Inter-Device
Consistency between devices is critical to the usability of the device. The inter-device variations are mainly caused by fluctuations in illumination, which are random errors. This random error cannot be completely eliminated. Moreover, in addition to random errors, another factor that causes variations in the two devices is the difference in imaging characteristics of the cameras. Regardless of the fact that the calibration procedure can reduce this kind of disparity, it is a systematic error and also cannot be eliminated completely. Therefore, color correction methods can be used to reduce the inter-device inconsistency.
We evaluated our method on two tongue image capture devices. After calibration, the two devices should have very similar image rendering capability. In this experiment, the two devices first captured the same Color Checker SG. Then, the color difference is calculated to measure the accuracy between the devices. We have captured the image groups of these two devices and calculated the color difference between them.
As shown in Table 6, the mean of color differences without color corrected is 5.03. There will be perceptual differences. Compared with other methods, our proposed OCC network achieved the best objective results of 1.32 .
Table 6.
Comparison results of the mean color differences between two devices.
For more details, we will show the difference between the corrected color checker and Color Check SG in the CIE Lab color space. The objective result is shown in Table 7. The OCC network achieved the best results in terms of mean color differences, and it almost achieves the best results in the maximum color differences among the four methods.
Table 7.
Comparison results of the color differences using four methods for two devices.
Figure 8 shows the tongue images captured with device 01 and device 02. Comparison results of tongue and face images captured in the two imaging systems before and after correction are listed. Subjectively, our method makes the corrected tongue and face images render consistently.
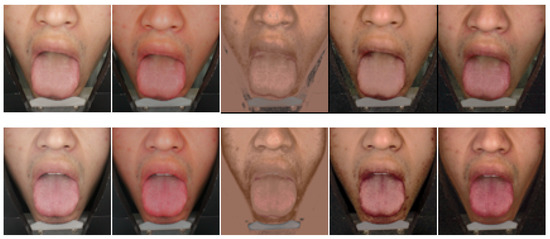
Figure 8.
Four color correction methods applied on facial and tongue images and their corrected results, upper: deceive 01, bottom device 02. From left to right, they are uncorrected and the results of the POLY, SVR, K-PLSR, and Ours.
4.2.4. Comparison of Different Methods
Subjective results of the compared methods are shown in Figure 9. From left to right, they are the uncorrected images, results of the polynomial-based correction method, the SVR-based correction method, the K-PLSR-based color correction method, and our method. Our algorithm significantly outperforms other methods in subjective quality.
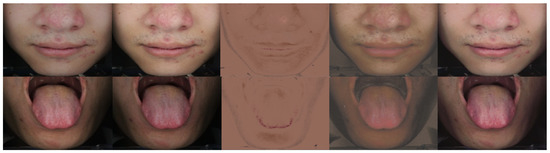
Figure 9.
Subjective results of the 4 compared methods. From left to right, they are uncorrected and the results of the POLY, SVR, K-PLSR, and Ours.
To evaluate the performance of the four compared algorithms under five different illuminances, the mean chromatic distances ) and the maximum ( are shown in Table 8. We can see that the mean of color differences our PCC performs best among the four compared algorithms. Compared with the maxima of the color differences, the result of our OCC network is more stable, which can get better results in practice.
Table 8.
Comparison results of color differences using four methods under different illuminances.
4.2.5. Analysis of Real Tongue Images
To provide more in-depth insights on our OCC, we will investigate its performance of real tongue images in the views of subjective and objective analysis. We have collected a set of tongue images in the open and closed lighting environment. They are shown in Figure 10 and Figure 11, respectively. The OCC corrected images of the closed environment are shown in Figure 12.
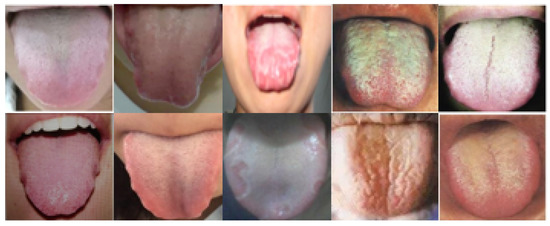
Figure 10.
Tongue images in the open environment.
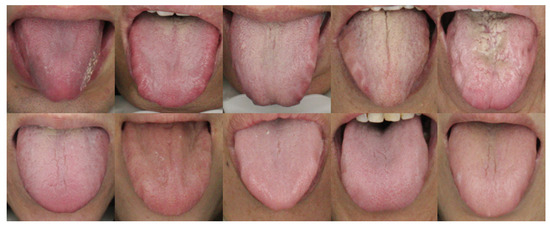
Figure 11.
Tongue images in the closed environment.
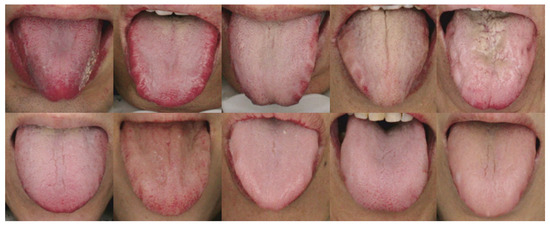
Figure 12.
The OCC corrected images in the closed environment.
We can see that the tongue images captured in the open environment suffer from high dynamic lighting variety. Some tongue images are pale, some are reddish, and some are yellowish. The tongue images of the open environment are more susceptible to blurring. Lighting effects and image quality pose challenges for subsequent automated analysis, while, as shown in Figure 11, for the tongue images captured in the closed environment, the color consistency has been greatly improved. We can see that the effects of light changes are almost completely eliminated. From the OCC corrected images shown in Figure 11, we can observe that some red regions in the tongue body become more significant. For example, in the tip of the 1st and 5th images, the side of the 2nd image in Figure 11, the red parts are realistic reproduced. The tooth marks in the 3rd and 4th images are more obvious. The color of the tongue coating in the 4th and 5th images looks unchanged. The above observations implied that the results of our OCC may be good for further color classification.
The subjective evaluation by assessing the color perception is hard to quantify. It is difficult to calculate the color difference between two color images directly. Like Wang et al. [11], we will calculate the average color to represent each tongue image, and then analyze the distribution of their color centers. Here, the CIE xyY color space is employed to obtain the coordinate for each pixel.
The distribution of the open tongue images, the closed tongue images, and the OCC corrected images are shown in Figure 13. We can see that the tongue image in an open environment is distributed over a large area, while the images captured in the closed environment and their corrected version attempt to be more clustered into a central image. The stable light source provided by the closed environment eliminates the interference of different lighting conditions, which makes the distribution of the captured tongue images more compact. The central point of the OCC corrected images moves to the right up from the central point of uncorrected images. This change implies that the OCC adapted the captured color images to the target color space to overcome the objective distortion. Note that the scattered shape of the closed images and their corrected version are similar. It is reasonable for a color to transition from a static color space to a standard color space with a similar color appearance.
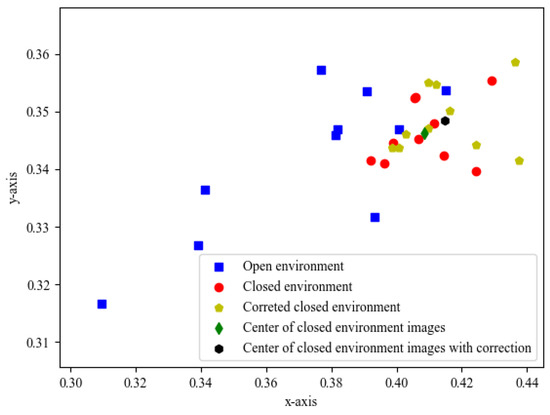
Figure 13.
Distribution of the color central of the tongue images captured in the open and closed environment.
Some statistical results including mean coordinates and variance of the three groups of images are listed in Table 9. From the table, we can see that our OCC moves the center of the input images from (0.404, 0.346) to (0.415, 0.348). This change indicates that the OCC helps to reduce the objective color distortion.
Table 9.
Average coordinates and their variances of image centers for three groups of images.
4.3. Evaluation on the Perceptual Color Correction
In this subsection, we will analyze the effectiveness of the PCC phase. The effects of each user parameters are analyzed and several typical recommended parameter settings are provided.
4.3.1. The Function Analysis on User Parameters
In space, l denotes an achromatic channel, and and are chromatic yellow-blue and red-green opponent channels. Therefore, our three user parameters , , and in Equations (8)–(10) can be used to effectively adjust the perceptual colors. The vividness and intensity of a color are represented by its saturation. Depending on the presence or absence of this saturation, colors can be broadly divided into chromatic and achromatic colors. The achromatic color is one that lacks hues such as white, gray, and black, and the chromatic color is a color that has even the slightest amount of hue. The effects of user parameters are shown in Figure 14. We adjust one parameter for each row increasingly, while the other two parameters are set at 1. The first image of each row is the result of the OCC. From the first row, we can see that the color becomes more vivid with the increasing of the . The image will saturate if the value of becomes too large. With the increase of and , the adjusted image will turn red and yellow, respectively.
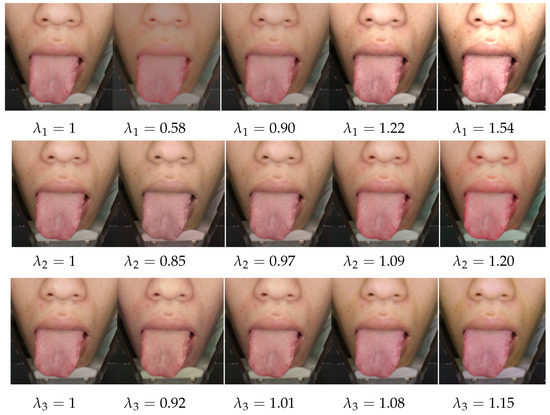
Figure 14.
The effects of the user parameters.
4.3.2. Recommend Parameters for Typical Lighting Conditions
We explored subjective results with different perceptual parameters. Capture tongue images under different lighting conditions of the day, such as 9:00 a.m., 1:00 p.m. and 6:00 p.m. We calculated the variance data for each channel in the color space. In order to effectively adjust the tongue image and avoid bad adjustment results, we constrained the results of perceptual adjustment with the range of the tongue image set. The range of three parameters is estimated as shown in Table 10. The adjustment steps of user parameters are set at 0.01.
Table 10.
The max and min value of the three parameters in adjustment.
The default values of the three user parameters are set at 1, which means that the PCC phase is turned off. We also calculated three recommended settings for three typical lighting conditions, viz. in the morning, noon, and evening, as shown in Table 11.
Table 11.
The recommend settings for the typical lighting conditions.
To get more convincing results, we adjusted the tongue image captured in the imaging system with reference to Table 11. The results are shown in Figure 15. The tongue image (a) is the output of our OCC network. Figure 15b–d are the results of the PCC phase by recommending parameters for the Morning, Noon, and Evening lighting conditions, respectively. Obviously, the morning tone is more natural. The tone of tongue image at noon becomes a little bit redder. The perceptual color of in the evening becomes a little pale due to the effects of daylight lamps.
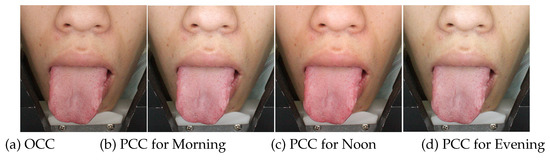
Figure 15.
The PCC results with typical recommended user parameters.
In Figure 16, we adjusted the image compared with the person who is captured in the imaging system, and we obtained a set of parameters. Then, we adopt the same parameter in another image shown in Figure 16b. As we can see, the corrected images remain coincident. Thus, the color adjustment scheme can get a good result in satisfying doctors’ preferences for their diagnosis.
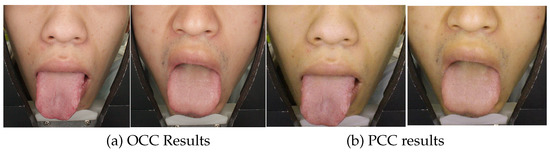
Figure 16.
The PCC results with typical recommended user parameters.
4.4. Discussion
Extensive discussion of our proposed two-phase deep color correction network for tongue images is made in this section to provide further insights into the potential of further work.
- Two-phase framework vs. single-phase frameworkThe two-phase framework proposed in this paper enables the color correction methods to deal with both quantitative chromatic correction and perceptual color adaptability. The traditional single-phase framework focuses on establishing a mapping from the input image to the target color space to obtain the preferred results of color constancy or perception. The color constancy and flexibility of adaptive perceptual colors are difficult to be compatible with each other.
- Deep network on the OCCA simple and efficient deep convolutional neural network is designed for the OCC phase. The architecture design of deep network for specific applications remains an open problem. We don’t think that the color correction problem is a very complicated problem, and it has been solved through a lookup table. Therefore, our principle is to find low-capacity models. In other words, the architecture of a deep neural network should be as simple as possible. As can be seen from the experimental results in Table 2, there is a trade-off between the number of hidden layers and performance. Other hyper parameters of the network, such as the size and number of filters in each layer, can also be determined through experimental results. However, a priori insight into the color correction of tongue images and the interpretability of deep networks may help design a more reasonable architecture.
- Objective accuracy and robustnessFrom the objective performance in Section 4.2, we can be confident of the power of deep networks in OCC. From Table 2, Table 3, Table 4, Table 5, Table 6 and Table 7, the average color difference and maximum color difference will be greatly reduced in different situations. Our OCC achieves high accuracy and robustness. In our experiments, we trained a unique model for each experimental scenario. However, due to the simple structure, the training quickly converged. To simplify the training process, users can try training a single model for all scenarios. The accuracy may decrease slightly. In future work, you can develop automated training applications for end users.
- Evaluation metricsThe purpose of the first phase is to reduce the objective color distortion for further automatic tongue image analysis. In this phase, reducing the chromatic distance is critical. Although chromatic distance is widely used for color correction of the tongue image [16,26], it also makes it easy to use in order to compare our method with other methods. According to related research on calculating color constancy, it may be a promising approach to design a comprehensive experiment to solve the tongue image color correction.
- Perceptual color correctionIn the evaluation of the perceptual color correction, subjective results for several tongue images are employed. Furthermore, we also showed a set of corrected tongue samples to the TCM doctors at the Xuanwu Hospital Capital Medical University. They confirmed that the corrected images can be used for diagnosis. More professional and in-depth subjective study on the effectiveness of the tongue image acquisition and analysis system will be considered in our future work.
- Other potential applicationsAlthough TDCCN is proposed for the tongue image correction, it has the potential to be widely used for computing color constancy and color-related computer vision applications. For example, in the design of anti-counterfeit color packaging, chromaticity accuracy and perceived color difference should be considered at the same time. The proposed OCC and PCC can be used separately. The OCC model provides high accuracy and robustness for quantitative color analysis, while the PCC provides a flexible tool for perceptual color design.
5. Conclusions and Future Work
This paper presents a two-phase color correction network for TCM tongue images. The objective color correction phase is developed to meet the requirements of quantitative analysis, while the perceptual color correction phase is designed to handle the variety of the open lighting conditions and doctors’ preferences. Experimental results show that our proposed method can effectively reduce the average color difference under different lighting conditions, cameras, and capturing devices. Perceptual color correction provides flexibility to simulate a variety of open lighting conditions and personal preferences of the physician. This method has been applied in our tongue analyzer and practical experiments in Xuanwu Hospital Capital Medical University.
The work in this paper was developed for tongue image acquisition devices under closed lighting conditions. However, nowadays, most images come from smartphones in an open lighting environment. Future work will focus on the color correction of tongue images in an open environment.
Author Contributions
Conceptualization, X.L. and H.Z.; methodology, Y.L. and Z.G.; software, Y.L.; validation, Y.L. and Z.G.; writing—original draft preparation, X.L. and Y.L.; writing—review and editing, X.L.; funding acquisition, L.Z. and X.L. All authors have read and agreed to the published version of the manuscript.
Funding
This research was funded by the National Natural Science Foundation of China (NSFC) Grant No. 61871006 and 61471013, the Beijing Municipal Natural Science Foundation Cooperation Beijing Education Committee Grant No. KZ201810005002 and KZ201910005007.
Acknowledgments
We would like to thank Wenqiang Chen from Xuanwu Hospital Capital Medical University for providing experimental opportunity and professional consultation.
Conflicts of Interest
The authors declare no conflict of interest.
Abbreviations
The following abbreviations are used in this manuscript:
| TCM | Traditional Chinese Medicine |
| TDCCN | Two-phase Deep Color Correction Network |
| CIE | International Commission on Illumination |
| OCC | Objective Color Correction |
| PCC | Perceptual Color Correction |
| POLY | Polynomial-based method |
| ILL | ILumination Level |
| SVR | Support Vector Regression |
| PLSR | Partial Least Squares Regression |
| K-PLSR | Kernel Partial Least Squares Regression |
| SA-GA-BP | Simulated Annealing-Genetic Algorithm-Back Propagation |
| CNN | Convolutional Neural Network |
| FNN | Feed-forward Neural Network |
| ReLU | Rectified Linear Unit |
| GPU | Graphic Processing Unit |
| RGB | Red Green Blue |
| CRI | Color Rendering Index |
| LED | Light-Emitting Diode |
References
- Zhang, D.; Zhang, H.; Zhang, B. Tongue Image Analysis; Springer: Berlin, Germany, 2017. [Google Scholar]
- Shen, L.; Cai, Y.; Zhang, X. Acquisition and Analysis of Tongue Image in Traditional Chinese Medicine; Beijing University of Technology Press: Beijing, China, 2007. (In Chinese) [Google Scholar]
- Zhou, J.; Zhang, Q.; Zhang, B.; Chen, X. TongueNet: A Precise and Fast Tongue Segmentation System Using U-Net with a Morphological Processing Layer. Appl. Sci. 2019, 9, 3128. [Google Scholar] [CrossRef]
- Rite, X. X-Rite MSDCCSG Digital ColorChecker SG Imaging Accessory. Available online: https://www.xrite.com/categories/calibration-profiling/colorchecker-digital-sg (accessed on 29 July 2018).
- Lu, Y.; Li, X.; Zhuo, L.; Zhang, J.; Zhang, H. DCCN: a deep color correction network for traditional Chinese medicine tongue images. In Proceedings of the 2018 IEEE International Conference on Multimedia Expo Workshops (ICMEW), San Diego, CA, USA, 23–27 July 2018; pp. 1–6. [Google Scholar]
- Charrière, R.; Hébert, M.; Trémeau, A.; Destouches, N. Color calibration of an RGB camera mounted in front of a microscope with strong color distortion. Appl. Opt. 2013, 52, 5262–5271. [Google Scholar] [CrossRef] [PubMed]
- Su, Q.; Cheng, H.; Sun, W.; Zhang, F. A Novel Correction Algorithm Based on Polynomial and TPS Models. In Proceedings of the 2011 International Conference of Information Technology, Computer Engineering and Management Sciences, Nanjing, China, 24–25 September 2011; Volume 1, pp. 52–55. [Google Scholar] [CrossRef]
- Finlayson, G.D.; Maryam, M.D.; Michal, M. The alternating least squares technique for nonuniform intensity color correction. Color Res. Appl. 2015, 40, 232–242. [Google Scholar] [CrossRef]
- Finlayson, G.D.; Mackiewicz, M.; Hurlbert, A. Color Correction Using Root-Polynomial Regression. IEEE Trans. Image Process. 2015, 24, 1460–1470. [Google Scholar] [CrossRef] [PubMed]
- Wang, X.; Zhang, D. A New Tongue Colorchecker Design by Space Representation for Precise Correction. IEEE J. Biomed. Health Inform. 2013, 17, 381–391. [Google Scholar] [CrossRef] [PubMed]
- Wang, X.; Zhang, D. An Optimized Tongue Image Color Correction Scheme. IEEE Trans. Inf. Technol. Biomed. 2010, 14, 1355–1364. [Google Scholar] [CrossRef] [PubMed]
- Zhang, H.Z.; Wang, K.Q.; Jin, X.S.; Zhang, D. SVR based color calibration for tongue image. In Proceedings of the 2005 International Conference on Machine Learning and Cybernetics, Guangzhou, China, 18–21 August 2005; Volume 8, pp. 5065–5070. [Google Scholar] [CrossRef]
- Zhuo, L.; Zhang, J.; Dong, P.; Zhao, Y.; Peng, B. An SA-GA-BP neural network-based color correction algorithm for TCM tongue images. Neurocomputing 2014, 134, 111–116. [Google Scholar] [CrossRef]
- Zhang, J.; Yang, Y.; Zhang, J. A MEC-BP-Adaboost neural network-based color correction algorithm for color image acquisition equipments. Optik Int. J. Light Electron Opt. 2016, 127, 776–780. [Google Scholar] [CrossRef]
- Wei, B. The Research on Color Reproduction and Texture Morphological Analysis of TCM Tongue Analysis. Ph.D. Thesis, Beijing University of Technology, Beijing, China, 2004. [Google Scholar]
- Zhuo, L.; Zhang, P.; Qu, P.; Peng, Y.; Zhang, J.; Li, X. A K-PLSR-based color correction method for TCM tongue images under different illumination conditions. Neurocomputing 2016, 174, 815–821. [Google Scholar] [CrossRef]
- Sui, J.; Xia, C.; Yang, K.; Zhang, Y.; Wang, Y.; Yan, H.; Qian, P. Tongue image color correction method based on root polynomial regression. In Proceedings of the 2019 IEEE 8th Joint International Information Technology and Artificial Intelligence Conference (ITAIC), Chongqing, China, 24–26 May 2019; pp. 1337–1342. [Google Scholar] [CrossRef]
- Kuo, C.C.J. Understanding Convolutional Neural Networks with A Mathematical Model. J. Visual Commun. Image Represent. 2016, 41, 406–413. [Google Scholar] [CrossRef]
- Hornik, K.; Stinchcombe, M.; White, H. Multilayer feedforward networks are universal approximators. Neural Netw. 1989, 2, 359–366. [Google Scholar] [CrossRef]
- Krizhevsky, A.; Sutskever, I.; Hinton, G.E. Imagenet classification with deep convolutional neural networks. In Advances in Neural Information Processing Systems; Curran Associates Inc.: Red Hook, NY, USA, 2012; pp. 1097–1105. [Google Scholar]
- Guo, J.; Pan, Z.; Lei, B.; Ding, C. Automatic Color Correction for Multisource Remote Sensing Images with Wasserstein CNN. Remote Sens. 2017, 9, 483. [Google Scholar] [CrossRef]
- Reinhard, E.; Adhikhmin, M.; Gooch, B.; Shirley, P. Color transfer between images. IEEE Comput. Graph. Appl. 2001, 21, 34–41. [Google Scholar] [CrossRef]
- Ruderman, D.L.; Cronin, T.W.; Chiao, C.C. Statistics of cone responses to natural images: implications for visual coding. J. Opt. Soc. Am. A 1998, 15, 2036–2045. [Google Scholar] [CrossRef]
- Kingma, D.P.; Ba, J. Adam: A method for stochastic optimization. arXiv 2014, arXiv:1412.6980. [Google Scholar]
- He, K.; Zhang, X.; Ren, S.; Sun, J. Delving Deep into Rectifiers: Surpassing Human-Level Performance on ImageNet Classification. In Proceedings of the 2015 IEEE International Conference on Computer Vision (ICCV), Santiago, Chile, 7–13 December 2015; pp. 1026–1034. [Google Scholar] [CrossRef]
- Melgosa, M.; Quesada, J.; Hita, E. Uniformity of some recent color metrics tested with an accurate color-difference tolerance dataset. Appl. Opt. 1994, 33, 8069–8077. [Google Scholar] [CrossRef] [PubMed]


© 2020 by the authors. Licensee MDPI, Basel, Switzerland. This article is an open access article distributed under the terms and conditions of the Creative Commons Attribution (CC BY) license (http://creativecommons.org/licenses/by/4.0/).