Abstract
Water spewing from the screw conveyor often occurs in cohesionless soil strata below the groundwater level during tunnel excavation with earth pressure balanced (EPB) tunnel boring machines (TBM). Foaming agents have been extensively employed as soil conditioner during the use of EPB TBMs to change the properties of soil, and the conditioned soil, with its low permeability, was the key to reduce the frequency of water spewing. To determine effect of foam parameters on cohesionless soil permeability, the conditioned sand permeability under different foam liquid half-lives () foam expansion rates (FERs), and foam injection rates (FIRs) was tested. To verify the permeability test results, a case study was carried out to optimize the foam parameters for preventing water spewing. Based on these results, this paper suggests that high-stability foaming agents with a medium FER and FIR represent an effective way to reduce cohesionless soil permeability and to prevent water spewing.
1. Introduction
Currently, earth pressure balanced (EPB) technology has been widely used as the main construction method of urban subway tunnel construction. With the continuous advancements in technology and soil conditioner, the application scope of EPB construction encompasses almost all types of strata from clay to rock mass [1,2]. When the tunnel is below the groundwater level, extreme water spewing will occur during the excavation in cohesionless soil that had loose structure and large permeability. To prevent groundwater spewing accidents in water-rich strata, the conditioned soil needs to have low permeability. Generally, when the conditioned soil permeability is less than m/s, the soil has reliable water resistance and can prevent the occurrence of water-spewing [3,4].
Foam stability has a large correlation with the permeability of foam-conditioned soils. The foam liquid half-life () is the critical parameter of the foam stability. However, there is no uniform standard method to evaluate . In the field of tunnel, most scholars tested the referencing the European Federation of National Associations Representing for Concrete (EFNARC) [5]. Some research shows that the is affected not only by the foam type, concentration, and FER, but also by the foam height, temperature, and atmospheric pressure [6,7]. Therefore, to unify the test methods of , it is necessary to specify the container (container diameter), foam height, foaming expansion ratio and laboratory temperature.
Below the groundwater level in EPB TBMs, low permeability is the key to reducing the frequency of the water spewing phenomenon for the cohesionless soil layer with good flow plasticity and compressibility. To evaluate the foam properties of conditioned cohesionless soil, some scholars studied the influence of foam parameters (concentration, foaming ratio, injection ratio, etc.) on conditioned soil compression, slump, and permeability to meet the requirement of workability, plasticity (slump between 10–20 cm), and impermeability (permeability < m/s) [8,9]. Based on the results of slump and compressibility laboratory experiments, Peila et al. (2009) [10] suggested that a higher FER (FER = 10–15) should be used in cohesionless soils. Borio and Peila (2010) [11] measured the permeability of foam-conditioned sandy soil (sand with a silt fraction equal to 5%) at FER = 12 and FER = 7.5 with, FIR = 60% and FIR = 40%. Kim et al. (2018) [12] concluded that the increase in FIR (0%, 22%, 45%, and 67%) led to a decrease in permeability of the foam-conditioned weathered granite from to cm/s. However, most of the studies focused on the plasticity, compressive strength, and shear strength of foam-conditioned cohesionless soil, whereas systematic research on permeability was relatively limited.
Cohesionless soil with a small amount of fine particles has a large porosity and permeability. When excavating below groundwater, it is easy to remove sand from the screw conveyor [13,14]. The higher the outlet pressure of the screw conveyor, the more obvious the water spewing phenomenon. Vinai et al. (2008) [15] found that soil pressure was linearly distributed with the screw conveyor length. When the groundwater pressure is high, it is not sufficient to rely on foam to improve the impermeability of cohesionless soils. Therefore, it is necessary to add a bentonite slurry or high-molecular-weight polymer materials to improve the impermeability of the cohesionless soils [16,17].
To verify effect of foam parameters on cohesionless soil permeability and water spewing, this study explored the influence of , FER and FIR on the sand permeability of foam-conditioned soils. Two aspects were included: (1) Determine the influence of the three factors on permeability and propose the optimal foam parameters; (2) Perform a case study to verify the optimum foam formation.
2. Materials and Methods
2.1. Foam Formation
Figure 1 presents the structure of a foam generating device, which consists of a gas pipeline, a liquid pipeline and a foam generating pipeline. The foam generator was equipped with a porous block of cylindrical stainless-steel wire with a diameter of 10 mm and a height of 14 mm. This device can prepare the foam with varying FERs from 1 to 30 by adjusting the air pressure and liquid pressure. Next, the generated foam was filled into a container. The time to exudate half of the liquid was recorded as .
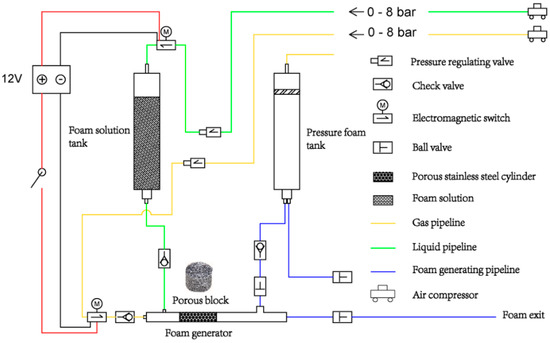
Figure 1.
Structural diagram of the foam generating device.
2.2. Foaming Agents and the Test Method
Referencing the method of the test proposed by Sebastiania et al. (2019) [18], a test device was designed as shown in Figure 2. To unify the test methods, the foam container size, foaming agent concentration (5 wt%), foam height ( = 20 cm), foam expansion ratio (FER = 10), and laboratory temperature (20 ± 2 °C) were determined in this research. Six foaming agents were selected in this study, which were recorded as ZDF-01, ZDF-02, ZDF-01P, ZDF-03, ZDF-03P, and ZDF-03AB, and they were provided by the Beijing Geo-Shield Research Institute Co., Ltd. The six foaming agents were grouped (ZD10, ZD20, ZD30, ZD40, ZD50, and ZD60) according to their foam liquid half-life ( ± 3 min) values (Table 1).
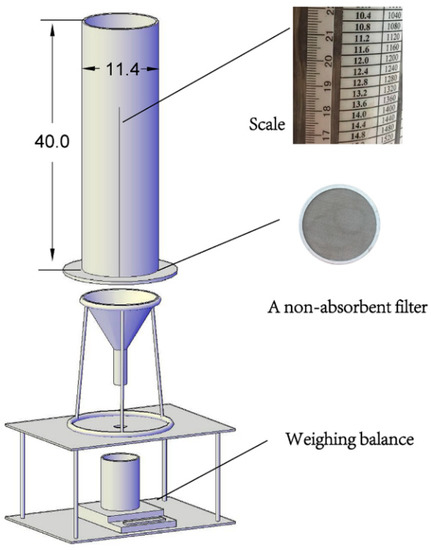
Figure 2.
Device for testing the foam liquid half-life.

Table 1.
Liquid half-life for the different foaming agents.
2.3. Permeability Test
Figure 3 shows the schematic diagram of the permeability test device. The size of the acrylic container was 26 cm in height, 6 cm in inner diameter, and 0.5 cm in thickness. The steps of the permeability test were as follows. The test sample was 15 cm in height and was placed in the container before 200 mL of water was poured on top. The air pressure was set to 0.3 bar. After opening the air valve switch, the mass of the total exudate water was recorded every 2–5 min (converted to volume Q according to the density of water (lg/cm3) until the sample was penetrated or the penetration time was greater than 60 min. Similar experimental device has also been used by many scholars [19,20,21] to find reasonable formulas for calculating permeability coefficients in slurry TBM. To compare the conditioned sand permeability with different foam parameters, Darcy’s seepage formula Equation (1) was selected to calculate permeability coefficient (k).
where is the average flow volume of the unit per time (cm3/s). L is the penetration length of the sample, which is a fixed value of 15 cm. S is the area of the cross section of water, , where d = 6 cm. P is the water pressure, which is 0.3 bar in this study.
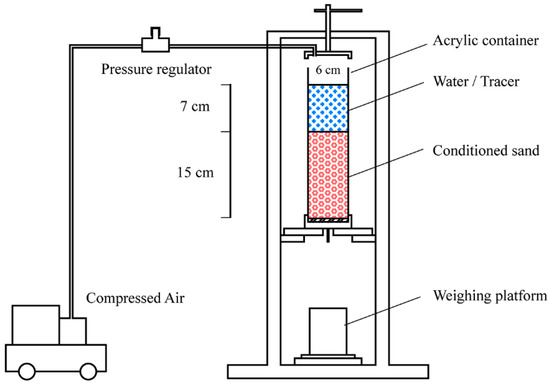
Figure 3.
Permeability test device.
Standard sand (ISO 679:2009), provided by Xiamen ISO Sand Co., Ltd., was selected in this study for the permeability test. The measured average particle size gradation curve is shown in Figure 4. The average density of standard sand was 1.74 g/cm3, as determined by experiments. Table 2 shows the foam injection weight of different FIRs when the foam expansion ratio was 10. According to the design of the permeability experiment (D = 6 cm, filling height = 15 cm), the mass of the standard sand required for each group of permeability experiments was 750 g (the equivalent volume was 420 mL).
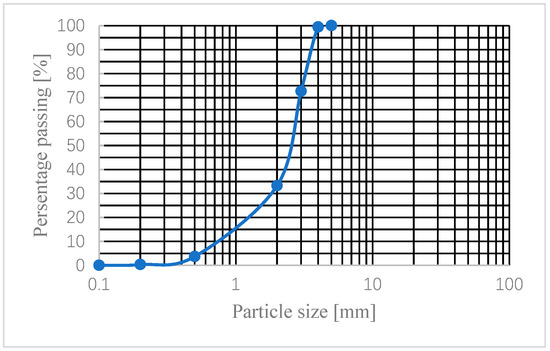
Figure 4.
Standard sand average particle size gradation curve.
Table 2.
Weight at different foam injection ratios.
3. Permeability Test Results and Discussion
3.1. Effect of
In this study, effect of different foaming agents on the permeability of standard sand was investigated. The permeability results (FER = 10 and FIR = 50%) shown in Figure 5a indicates that the permeabilities of ZD10, ZD20, and ZD30 ( < 30 min) were significantly greater than those of ZD40, ZD50, ZD60 (> 30 min). In 30 min, the permeability coefficients of the ZD10 and ZD20 samples increased from cm/s to cm/s, while the permeability coefficient of the sample group with a large (ZD30-ZD60) was always less than cm/s. In addition, the larger Is, the lower the permeability coefficient. Figure 5b presents the changes of in sizes for ZD10 and ZD30 foams when FER = 10 within 5 min. The bubble image results of ZD30 foams shows that the size and shape changes are significantly smaller than those of the ZD10 foams. This phenomenon also indicates that a foam with a high has better structural stability and a lower liquid flow rate [22,23].
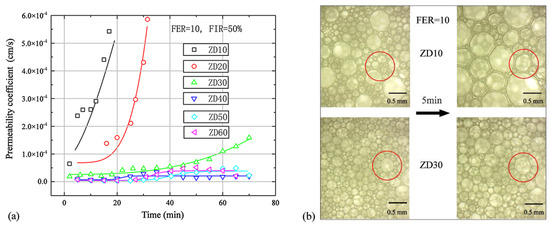
Figure 5.
Effect of on conditioned sand permeability. (a) Change in conditioned sand permeability coefficient with time under different foam products, and (b) the bubble image of ZD10 and ZD30 foam sizes within 5 min.
In the permeability experiments, when the voids of the standard sand were completely filled by foam, the sand particle skeleton and the foam jointly resisted the external water pressure. High stability foams that have a long were also more resistant to external water pressure due to their more stable liquid film structure and slower liquid loss rate. These results indicated the permeability performance of conditioned sand was closely related to the stability of foam.
3.2. Effect of FER
Figure 6a presents the conditioned sand permeability results for the ZD30 foam under various FERs. With the increase in FER, the permeability of the sand first decreased and then increased, and the permeability was the lowest when FER was 15. In 60 min, the permeability coefficient is less than 10−4 cm/s at FERs between 5 and 20. When FER > 20, the rate of change in permeability increased rapidly. In the experiments, it was also found that FER had a very significant effect on the fluidity of the foam. When FER < 10, the solution did not sufficiently foam to form a wet foam with good fluidity (Figure 6b). As the FER increased to 20, the solution was fully foamed to form dry foam that had a lower liquid content. However, the foam liquid film became thinner (the liquid content of foam decreased) as the FER increased, until the sand particles could not be completely wetted by the liquid. After mixing the foam and sand, most foams began to dehydrate and defoam (Figure 6c), which eventually led to an increase in permeability. Therefore, effect of FER on sand permeability was related to the water content. Given that the sand particles were moist by the water of the foam, the conditioned sand permeability decreased as the FER increased. However, as the FER continues to increase, the decrease in foam volume led to a rapid increase in sand permeability.
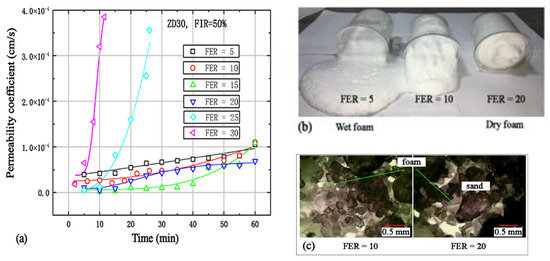
Figure 6.
Effect of FER on conditioned sand permeability. (a) Conditioned sand permeability coefficient under different FERs, (b) flowability of foam under different FERs, and (c) foam defoaming between sand particles when FER = 20.
3.3. Effect of FIR
Figure 7a shows the test results of the permeability coefficients at four different injection rates (FIR = 25%, 50%, 75%, and 100). Compared with FIR = 25%, the FIR = 50% permeability coefficient and its rate of change were small. When the FIR was greater than 75%, the permeability coefficient was less than cm/s within 60 min, which had little effect on the change in the permeability coefficient of the conditioned sand. The experimental results showed that the permeability coefficient first increased and then stabilized with increasing FIR.
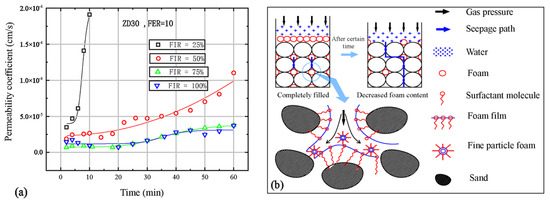
Figure 7.
Effect of FIR on conditioned sand permeability. (a) Conditioned sand permeability coefficient under different FIRs, and (b) penetration of foam between sand particles.
During the permeability experiments, the injected foam volume was determined by the FIR when the FER was constant. As shown by Figure 7b, when the volume of the foam was larger than the voids in the sand, the foam completely filled in the voids in the sand. The fine foam, together with the void pressure of the sand particles, resisted the external water pressure and uniformly penetrated along the voids of the sand. At this time, the permeability of the sand was mainly determined by the adhesiveness of the foam (related to the ). The loss and dissipation of foam caused the foam volume in the sand decreasing over time. When the volume of the foam was smaller than the void volume of the sand, water mainly penetrated along the voids of the sand filled with no foam, and the permeability coefficient of the sand started to increase. Therefore, the FIR primarily affected the rate of change of the permeability coefficient, but had a smaller effect on permeability. The smaller the FIR was, the faster the permeability coefficient changed, and the larger FIR led to slower permeability coefficient changes.
4. Field Experiments
4.1. Background
Effects of foam parameters on water spewing were studied during the construction of 160 to 290 rings (1.5 m/ring) of Tianqiao Station and Yongdingmenwai Station of Beijing Metro Line 8. Figure 8 shows that the main structure of the tunnel is located on the No. 5 pebble layer, in which the 160–220th ring excavation layer is composed of silty clay, medium sand and a pebble layer, and the 225–290th ring is composed of medium sand and a pebble layer. In addition, the excavation cutter diameter was 6180 mm, and the cutter head opening rate was approximately 66%.
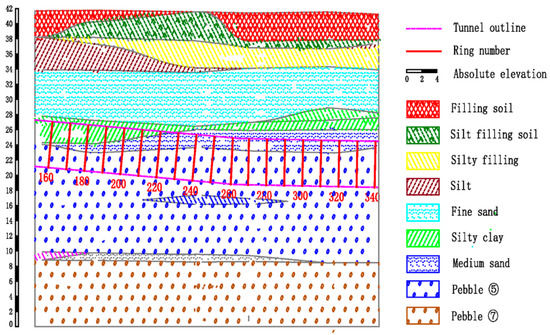
Figure 8.
Sections of excavated strata in the study area.
Through the investigation, the depth of the tunnel bottom in the study area was 20.8–22.7 m. The water depth was 20.5–24.9 m, and the measured water pressure was 0–0.6 bar. The permeability of the layer above the tunnel (filling soil, silty filling soil, silty clay) was 0.02 m/d. The strata of medium sand and pebble to be excavated were below the groundwater level, and their permeability coefficients were 5 m/d and 200 m/d.
4.2. Water Spewing Problems
The water spewing occurred from the 180th ring, and became serious at the 198th ring (Figure 9a). The difference was compared between the front pressure of the screw conveyor (Pf) and the outlet pressure of the screw conveyor (Po) when water spewing occurred (the position of the pressure sensor is shown in Figure 9b). The Po and Pf of the 160th and 206th rings during the construction process varies with the forward distance, as shown in Figure 10. The results showed that the Po of the 160th ring was lower (average 0.18 bar) and relatively stable, while the Po of the 206th ring was higher (average value was 0.56 bar), and the fluctuation was very obvious. When significant water spewing from the conveyor occurred, the outlet pressure was usually greater than 0.5 bar. Moreover, water spewing did not occur when the outlet pressure was less than 0.2 bar.
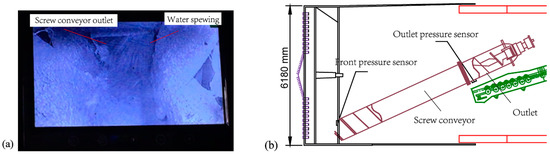
Figure 9.
Water spewing from the screw conveyor. (a) The water spewing at ring 198th, and (b) the pressure sensor position.
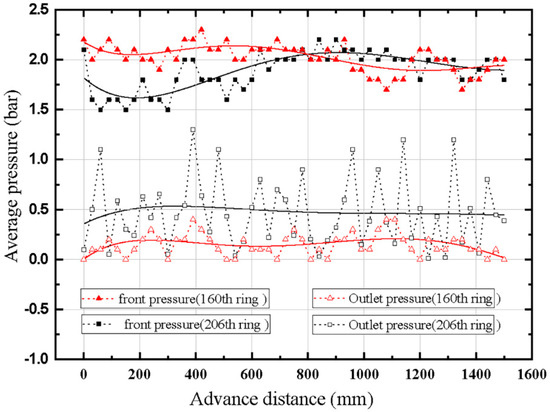
Figure 10.
Changes in and with forward distance during the excavation of the 160th and 206th rings.
A foam and bentonite slurry were mainly used to condition the excavated soil during engineering. According to the statistics of the 1–250th rings, the average amount of foam solution liquid that was consumed was 43 kg per ring. The average construction time of each ring was 40 min, and the FIR was approximately 33% (FER = 10). The foaming agent (Thl = 8.2 min) was used in the 0–220th rings, and the parameters were a 3% concentration, FER = 10 and FIR = 30–40%. Starting from the 220th ring, the foaming agent was replaced by ZD30 foam (Thl = 27.4 min), and the foam using parameters remained unchanged. In addition, the amount of sodium bentonite was 10 wt%, the injection ratio was 5%–7%, and the apparent viscosity was 13 mPa.s.
4.3. Effect of Foam on Water Spewing
To investigate the influence of foam parameters on the water spewing, Po and Pf have been compared under the different foam types, FERs, and FIRs. Accordingly, the foaming agent with good stability was replaced starting from the 220th ring, replaced from the 240–250th rings to increase the FER, and replaced from the 250–280th rings to increase the FIR.
Figure 11 shows the average Po and Pf values during the construction of the 190–285th rings. Under the same foam and bentonite parameters, a ZD30 foaming agent (Thl = 27.4 min) was used starting from the 220th ring. As shown in Figure 11 (area C), the Po values of the 220–240th rings were lower (the maximum was less than 0.5 bar), than those of the 200–220th rings. Observing the construction process of the 220–240th rings, the water spewing frequencies were significantly reduced after replacing the ZD30 foam. The results of this experiment indicated that the foam with a higher stability was more effective in preventing water spewing.
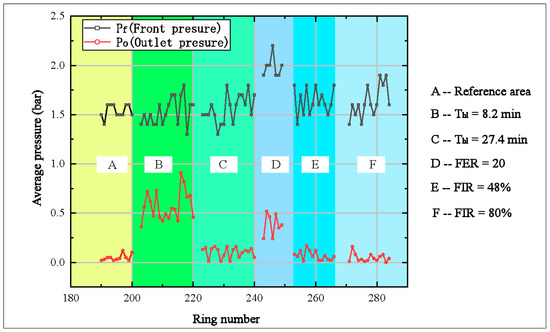
Figure 11.
The average of and from the 190th to 285th rings.
The FER was increased from 10 to 20 at the 240th ring (as the FER increased, the volume of liquid injection was reduced, and the FIR remained the same). Figure 11 (area D) shows that the values of the 241–249th rings are between 0.3–0.5 bar, and is greater than 1.5 bar (the maximum value reached 2.3 bar). Moreover, discontinuous water spewing occurred from the 241th ring. However, compared with the data of the 220–240th rings in Figure 11 (area B), the in area D was larger, but the was smaller. The results showed that a high FER foam increased the , and the pressure drop per unit length of the screw conveyor.
Starting from the 251th ring, the FER was restored to 10. The flow of the foam pump was increased from the original 31 L/min to 50 L/min, at which time the FIR was approximately 48%. The data of the 250–265th rings in Figure 11 (area E) show that the average does not change significantly after increasing the FIR when(compared to area C). Upon increasing the FIR value further to 80% (adding a foam pump of 35 L/min), the and values remained unchanged (as shown in the F area in Figure 11). The data of the three areas C, E, and F in Figure 11 shows that increasing the FIR has little effect on . When the FIR > 33%, increasing the FIR was not an effective way to prevent the water spewing.
5. Conclusions
Using foam with appropriate parameters as a soil conditioner to reduce the permeability of the soil during the EPB TBM in cohesionless soil stratum is an effective method to prevent spewing. This paper presented a series of experiments to assess the influence of foam parameters on conditioned soil permeability. Based on the experimental results, a case study was performed to verify the optimum foam formation. The main findings of the soil permeability experiments and the field tests are summarized as follows:
(1) The larger Thl is, the lower the conditioned sand permeability. For the foaming agent with > 30 min (FER = 10 and FIR = 50%), the permeability coefficient of the conditioned sand was less than 2 × 10⁻⁵ cm/s within 30 min. The results suggested that highly stable foam products were more suitable cohesionless soil. And the field experiments also verified that the ZDF-01P foam agents were effective in reducing the outlet pressure of the screw conveyor.
(2) When FER increased, the permeability first decreased and then increased (FER > 15), due to the increase in the FER improved the foam stability and reduced the water content. The results showed that too low or too high FER was not good for reducing permeability. The field experiments verified that the pressure in the chamber and the outlet pressure of the screw conveyor rapidly increased when the FER was increased from 10 to 20.
(3) The permeability decreased with increasing FIR, and there was no significant change when the FIR = 70%–100%. The FIR primarily affected the rate of change in the permeability coefficient, but had a little effect on permeability. A suitable FIR can reduce the permeability coefficient and simultaneously reduce the consumption of foam. Similar results was obtained in the field experiments: When FIR was higher than 33%, increasing FIR was not an effective method to prevent against water spewing.
Permeability tests and field experiment results suggested that using high-stability foaming agents with a medium foam expansion ratio (FER = 10–20) and foam injection ratio (FIR = 50%–75%) was effective to reduce the cohesionless soil permeability and to prevent the occurrence of water spewing from the screw conveyor.
Author Contributions
Conceptualization, X.Z. and Y.Y.; methodology, X.Z.; formal analysis, X.Z. and Y.Y.; investigation, X.Z.; writing—original draft preparation, X.Z.; writing—review and editing, X.Z. and Y.Y.; funding acquisition, Y.Y. All authors have read and agreed to the published version of the manuscript.
Funding
This research was funded by the National Key Research and Development Program of China, grant number 2017YFC0805008 and the Fundamental Research Funds for the Central Universities, grant number 265201708.
Conflicts of Interest
The authors declare no conflict of interest.
References
- Zumsteg, R.; Plötze, M.; Puzrin, A. Effects of dispersing foams and polymers on the mechanical behaviour of clay pastes. Géotechnique 2013, 63, 920–933. [Google Scholar] [CrossRef]
- Martinelli, D.; Peila, D.; Campa, E. Feasibility study of tar sands conditioning for earth pressure balance tunneling. J. Rock Mech. Geotech. Eng. 2015, 7, 684–690. [Google Scholar] [CrossRef]
- Wei, K. On the “Ideal Soil” in the Earth Pressure Balanced Shield Tunnelling. Urban Mass Transit. 2007, 10, 67–70. [Google Scholar] [CrossRef]
- Budach, C.; Thewes, M. Application ranges of EPB shields in coarse ground based on laboratory research. Tunn. Undergr. Space Technol. 2015, 50, 296–304. [Google Scholar] [CrossRef]
- EFNARC-Specification and Guidelines for the Use of Specialist Products for Mechanized Tunnelling (TBM) in Soft Ground and Hard Rock, Soft Ground and Hard Rock Tunnelling. Available online: http://www.efnarc.org/publications.html (accessed on 3 April 2005).
- Thewes, M.; Budach, C.; Galli, M. Laboratory tests with various conditioned soils for tunnelling with earth pressure balance shield machines. Tunn. Int. J. Subsurf. 2010, 6, 21–30. [Google Scholar]
- Wu, Y.; Mooney, M.A.; Minsu Cha, M. An experimental examination of foam stability under pressure for EPB TBM tunneling. Tunn. Undergr. Space Technol. 2018, 77, 80–93. [Google Scholar] [CrossRef]
- Quebaud, S.; Sibai, M.; Ehenry, J. Use of chemical foam for improvement in drilling by earth-pressure balanced shields in granular soils. Tunn. Undergr. Space Technol. 1998, 13, 173–180. [Google Scholar] [CrossRef]
- Peila, D.; Picchio, A.; Chieregato, A. Earth pressure balance tunnelling in rock masses: Laboratory feasibility study of the conditioning process. Tunn. Undergr. Space Technol. 2013, 35, 55–66. [Google Scholar] [CrossRef]
- Peila, D.; Oggeri, C.; Borio, L. Using the Slump Test to Assess the Behavior of Conditioned Soil for EPB Tunneling. Environ. Eng. Geosci. 2009, 15, 167–174. [Google Scholar] [CrossRef]
- Borio, L.; Peila, D. Study of the Permeability of Foam Conditioned Soils with Laboratory Tests. Am. J. Environ. Sci. 2010, 6, 365–370. [Google Scholar] [CrossRef]
- Kim, T.H.; Kim, B.K.; Lee, K.H.; Lee, I.M. Soil Conditioning of Weathered Granite Soil used for EPB Shield TBM: A Laboratory Scale Study. KSCE J. Civ. Eng. 2018, 23, 1829–1838. [Google Scholar] [CrossRef]
- Barzegari, G.; Uromeihy, A.; Zhao, J. EPB tunneling challenges in bouldery ground: A new experience on the Tabriz metro line 1, Iran. Bull. Eng. Geol. Environ. 2014, 73, 429–440. [Google Scholar] [CrossRef]
- Wang, S.; Lu, X.; Wang, X.; He, C.; Xia, X.; Ruan, L.; Jian, Y. Soil Improvement of EPBS Construction in High Water Pressure and High Permeability Sand Stratum. Adv. Civ. Eng. 2019. [Google Scholar] [CrossRef]
- Vinai, R.; Oggeri, C.; Peila, D. Soil conditioning of sand for EPB applications: A laboratory research. Tunn. Undergr. Space Technol. 2008, 23, 308–317. [Google Scholar] [CrossRef]
- Zhao, B.Y.; Liu, D.Y.; Jiang, B. Soil Conditioning of Waterless Sand–Pebble Stratum in EPB Tunnel Construction. Geotech. Geol. Eng. 2018, 36, 2495–2504. [Google Scholar] [CrossRef]
- Langmaack, L.; Lee, K.F. Difficult ground conditions? Use the right chemicals! Chances–limits–requirements. Tunn. Undergr. Space Technol. 2016, 57, 112–121. [Google Scholar] [CrossRef]
- Sebastiania, D.; Vilardib, G.; Bavassob, I.; di Palmab, L.; Milizianoa, S. Classification of foam and foaming products for EPB mechanized tunneling based on half-life time. Tunn. Undergr. Space Technol. 2019, 92. [Google Scholar] [CrossRef]
- Bezuijen, A. Compensation Grouting in Sand: Experiments, Field Experiences and Mechanisms. Ph.D. Thesis, Delft University of Technology, Delft, The Netherlands, 2010. [Google Scholar]
- Talmon, A.M.; Mastbergen, D.R.; Huisman, M. Invasion of pressurized clay suspensions into granular soil. J. Porous Media. 2013, 16, 351–365. [Google Scholar] [CrossRef]
- Xu, T.; Bezuijena, A. Experimental study on the mechanisms of bentonite slurry penetration in front of a slurry TBM. Tunn. Undergr. Space Technol. 2019, 93. [Google Scholar] [CrossRef]
- Wang, H.; Li, J.; Wang, Z.; Wang, D.; Zhan, H. Experimental investigation of the mechanism of foaming agent concentration affecting foam stability. J. Surfactants Deterg. 2017, 20, 1443–1451. [Google Scholar] [CrossRef]
- Mori, L.; Mooney, M.; Cha, M. Characterizing the influence of stress on foam conditioned sand for EPB tunnelling. Tunn. Undergr. Space Technol. 2018, 71, 454–465. [Google Scholar] [CrossRef]


© 2020 by the authors. Licensee MDPI, Basel, Switzerland. This article is an open access article distributed under the terms and conditions of the Creative Commons Attribution (CC BY) license (http://creativecommons.org/licenses/by/4.0/).