Concrete Corrosion Cracking and Transverse Bar Strain Behavior in a Reinforced Concrete Column under Simulated Marine Conditions

 , , ,
, , ,
Abstract
:1. Introduction
2. Materials and Methods
2.1. Concrete Mixes
2.2. Experimental Design
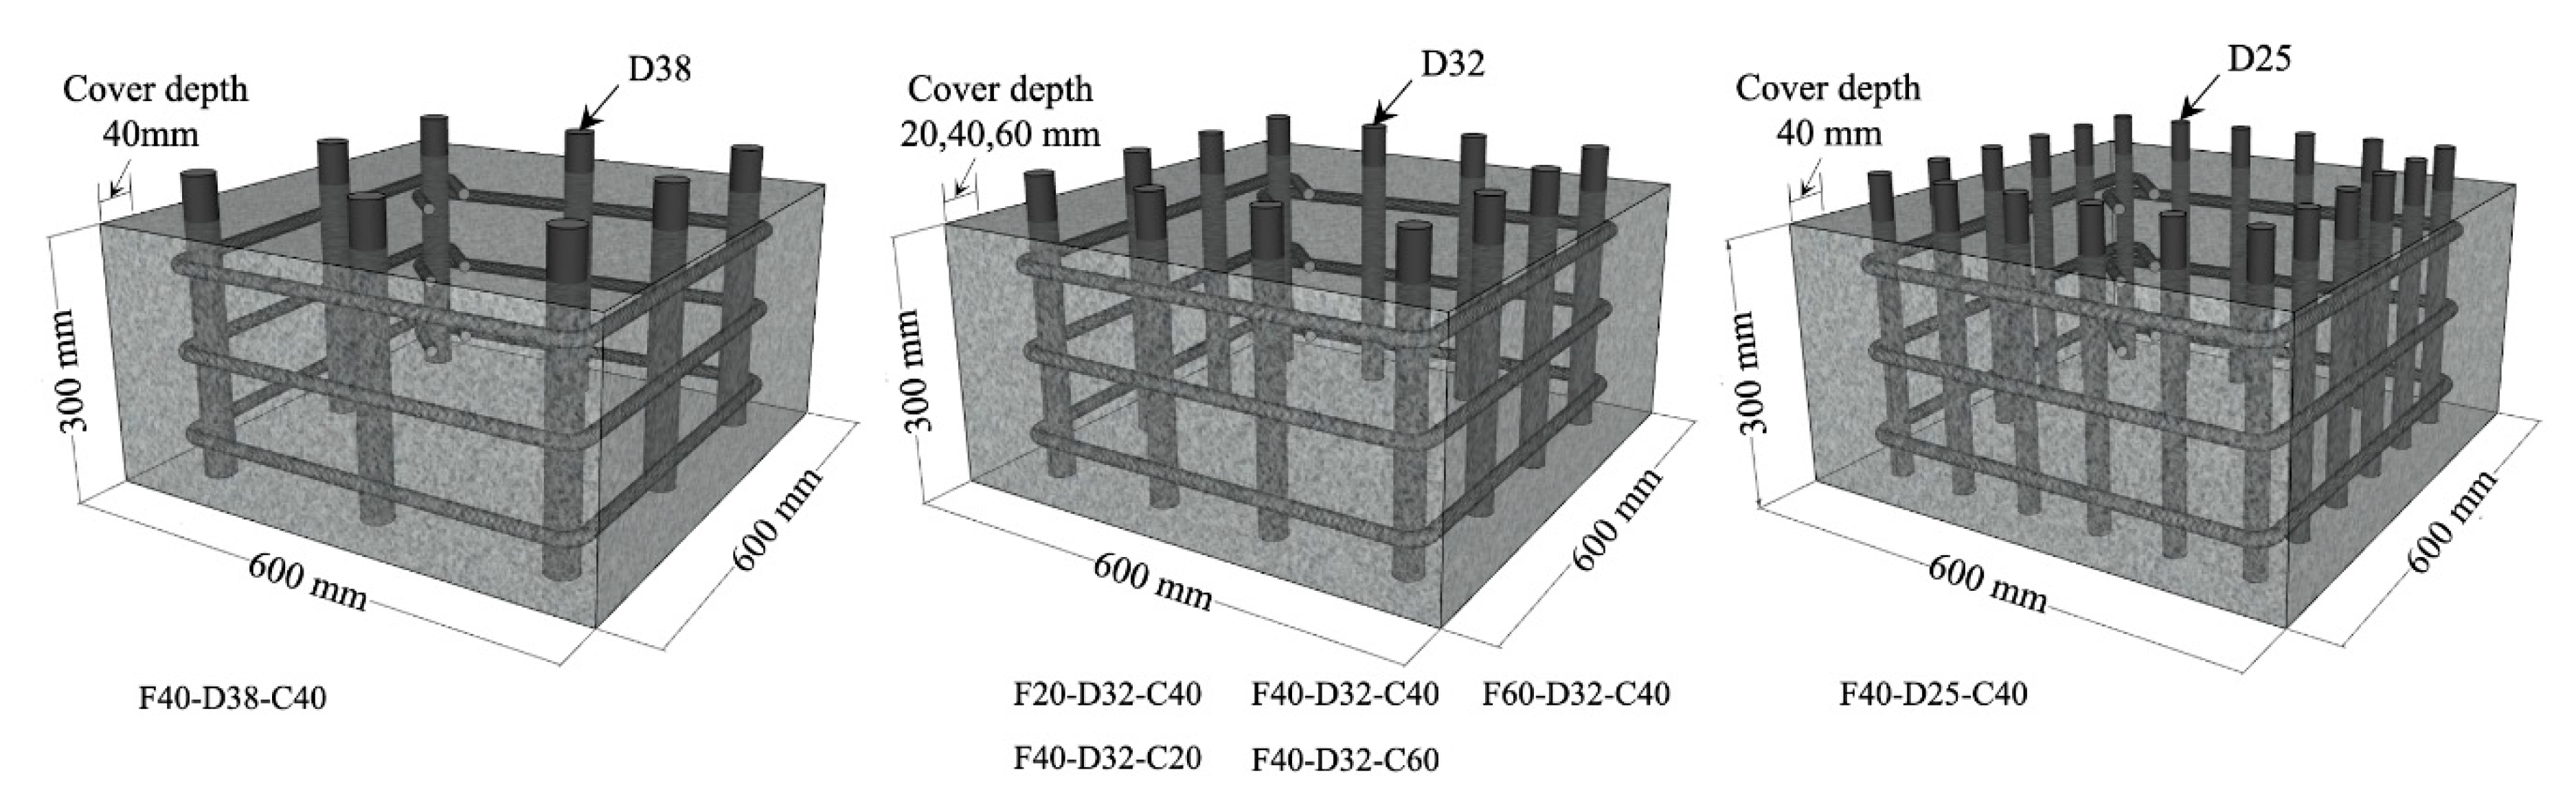
2.3. Specimens
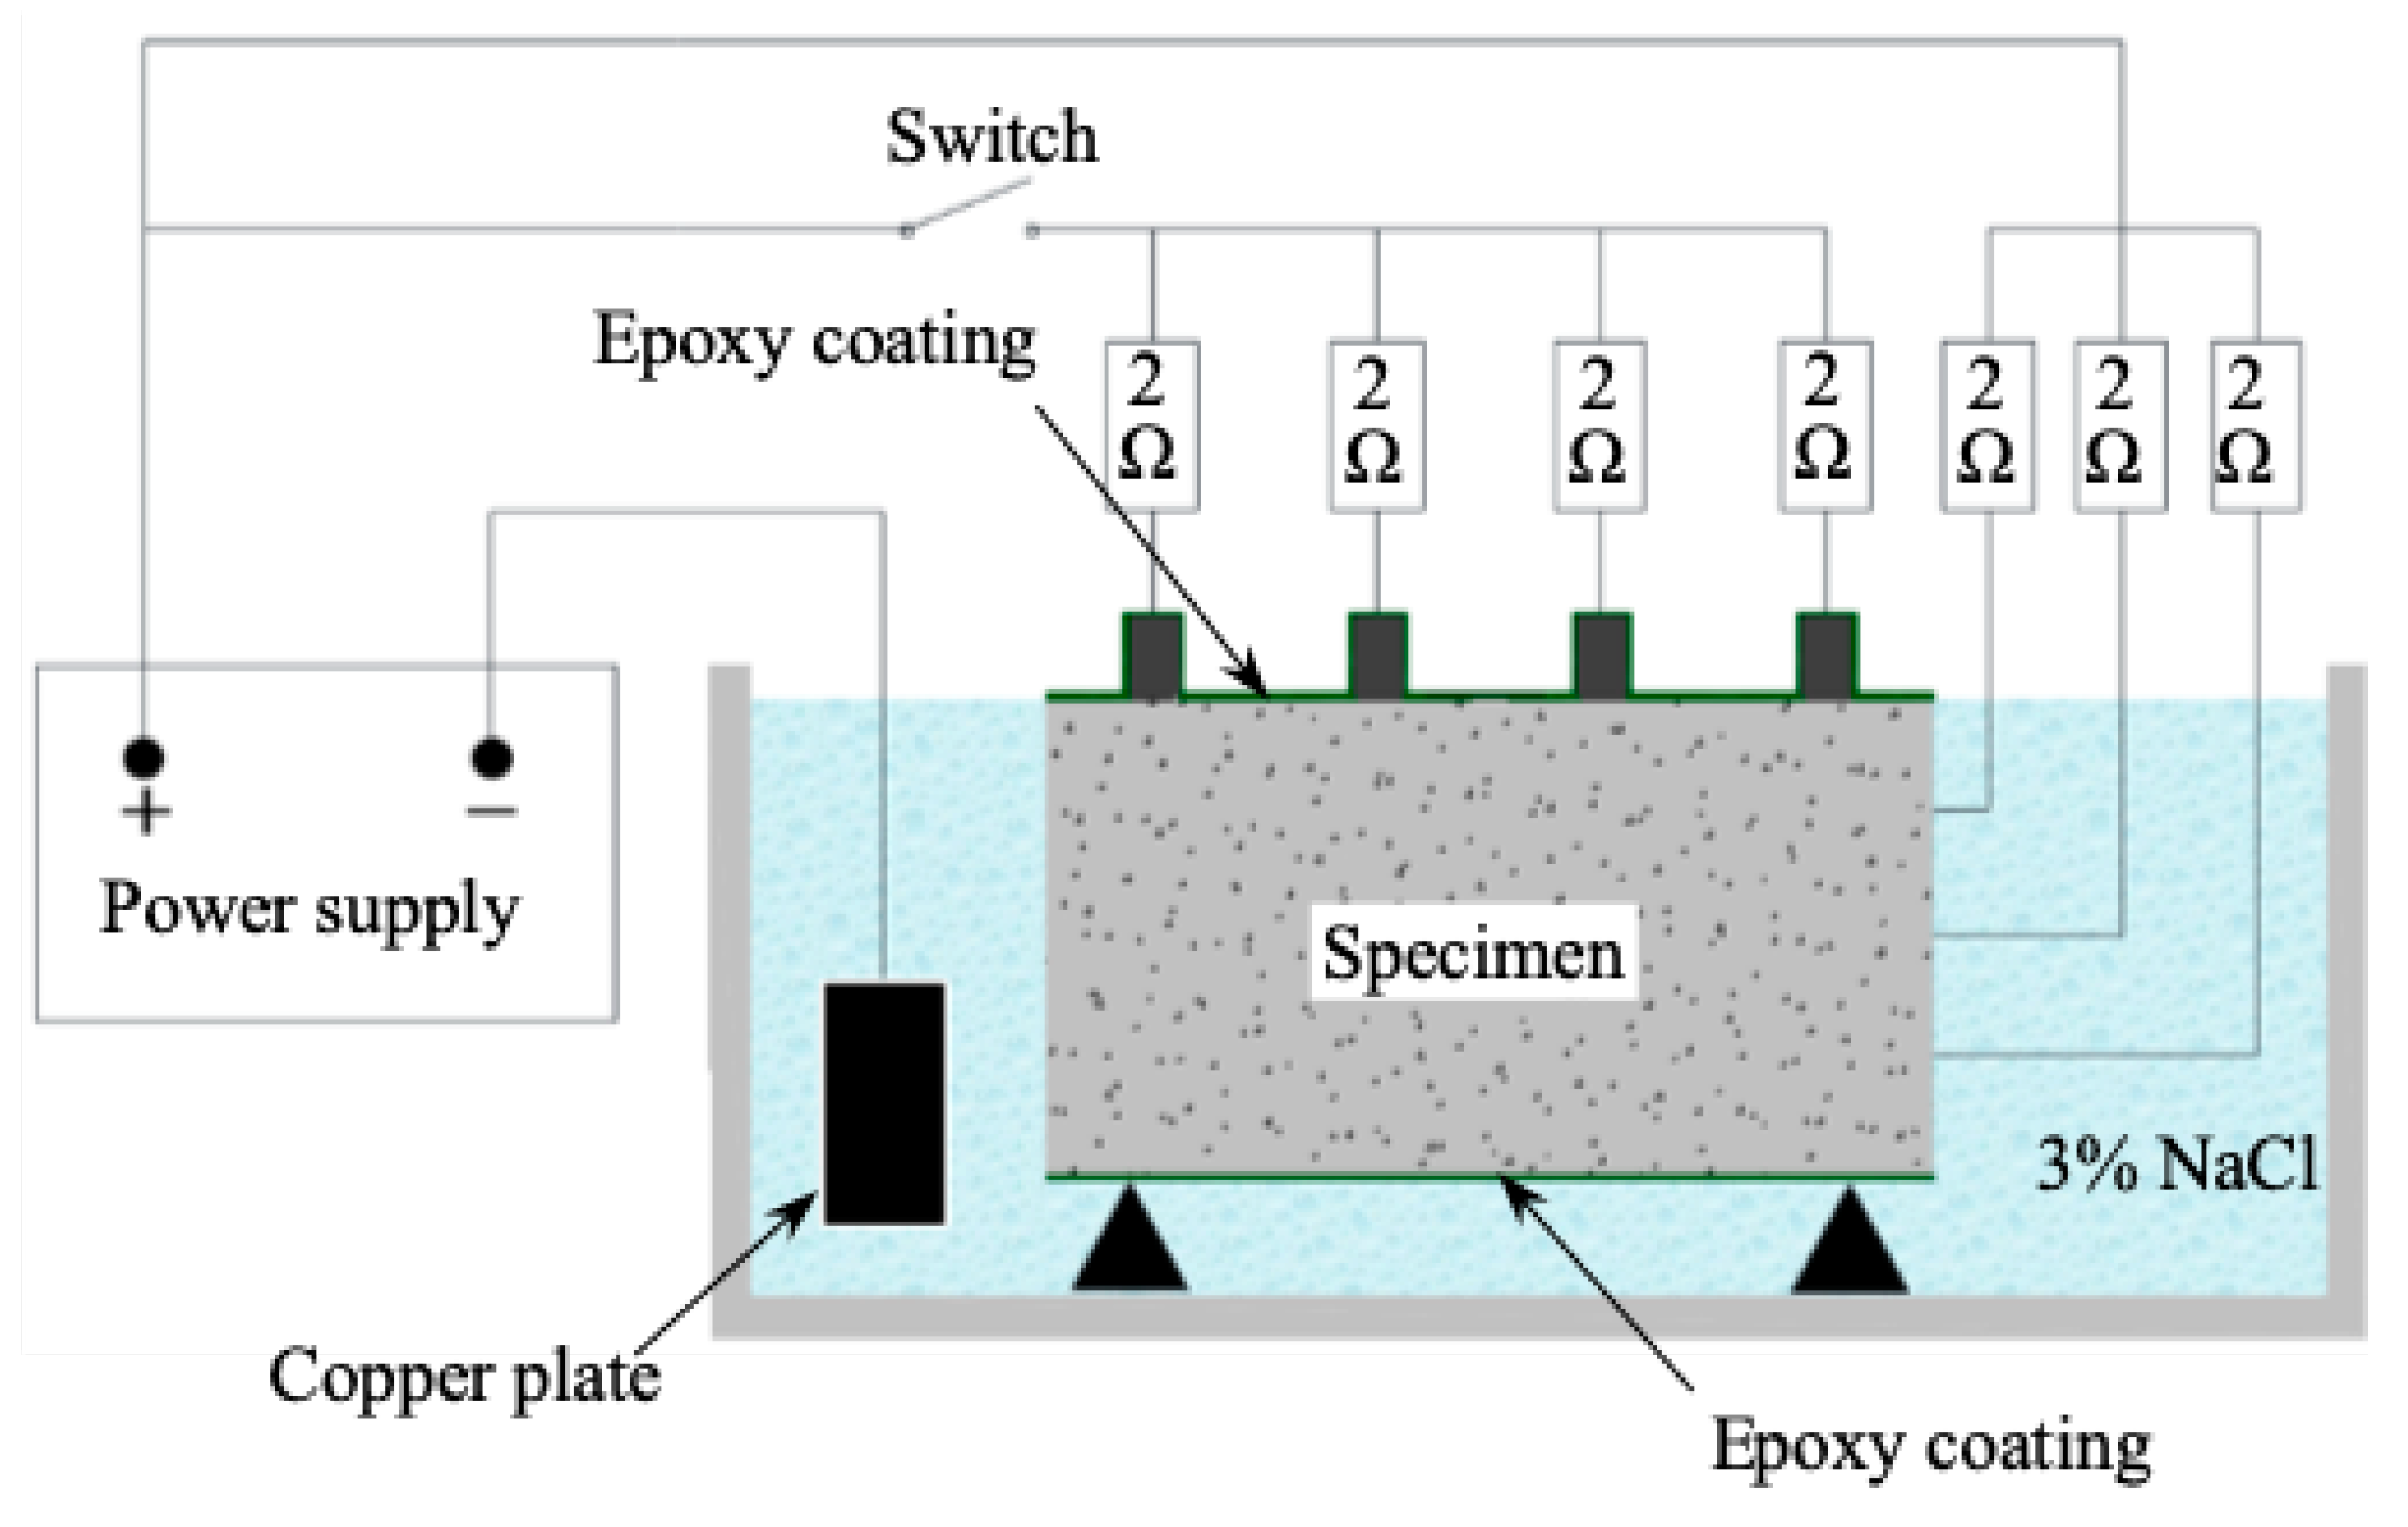
2.4. Experimental Design
3. Results and Discussion
3.1. Weight Loss of Corroded Steel Bar
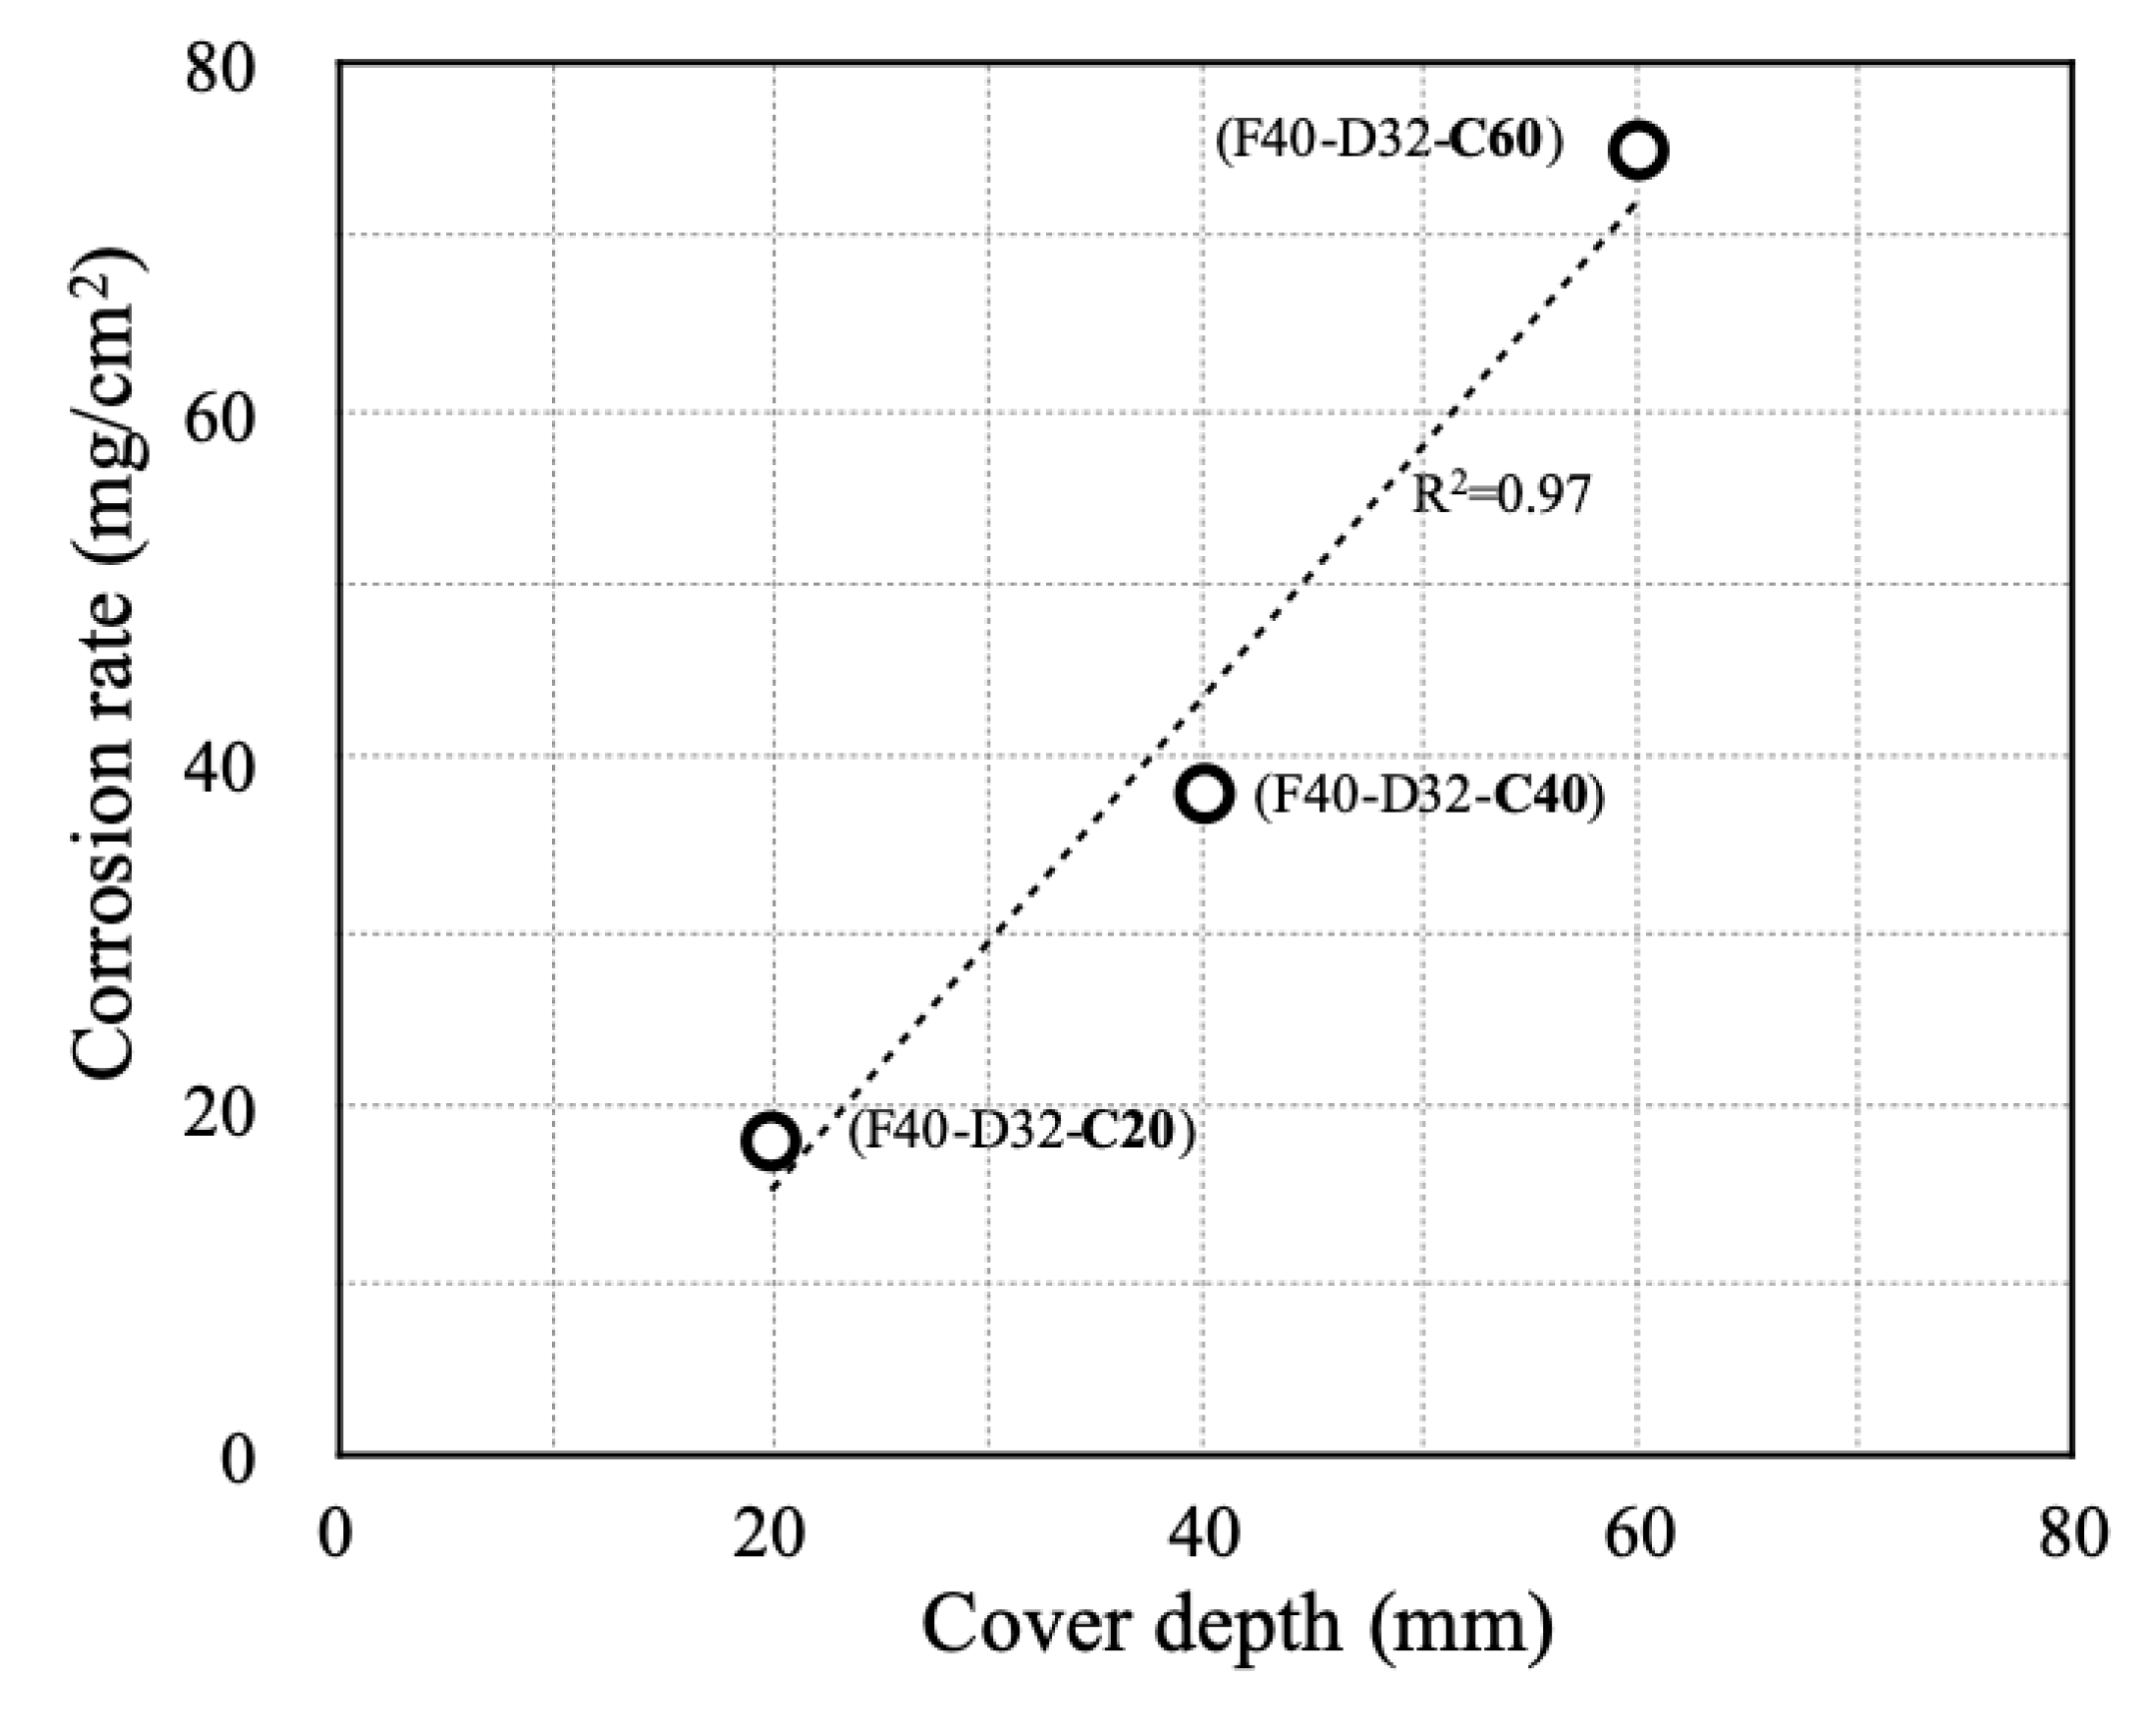
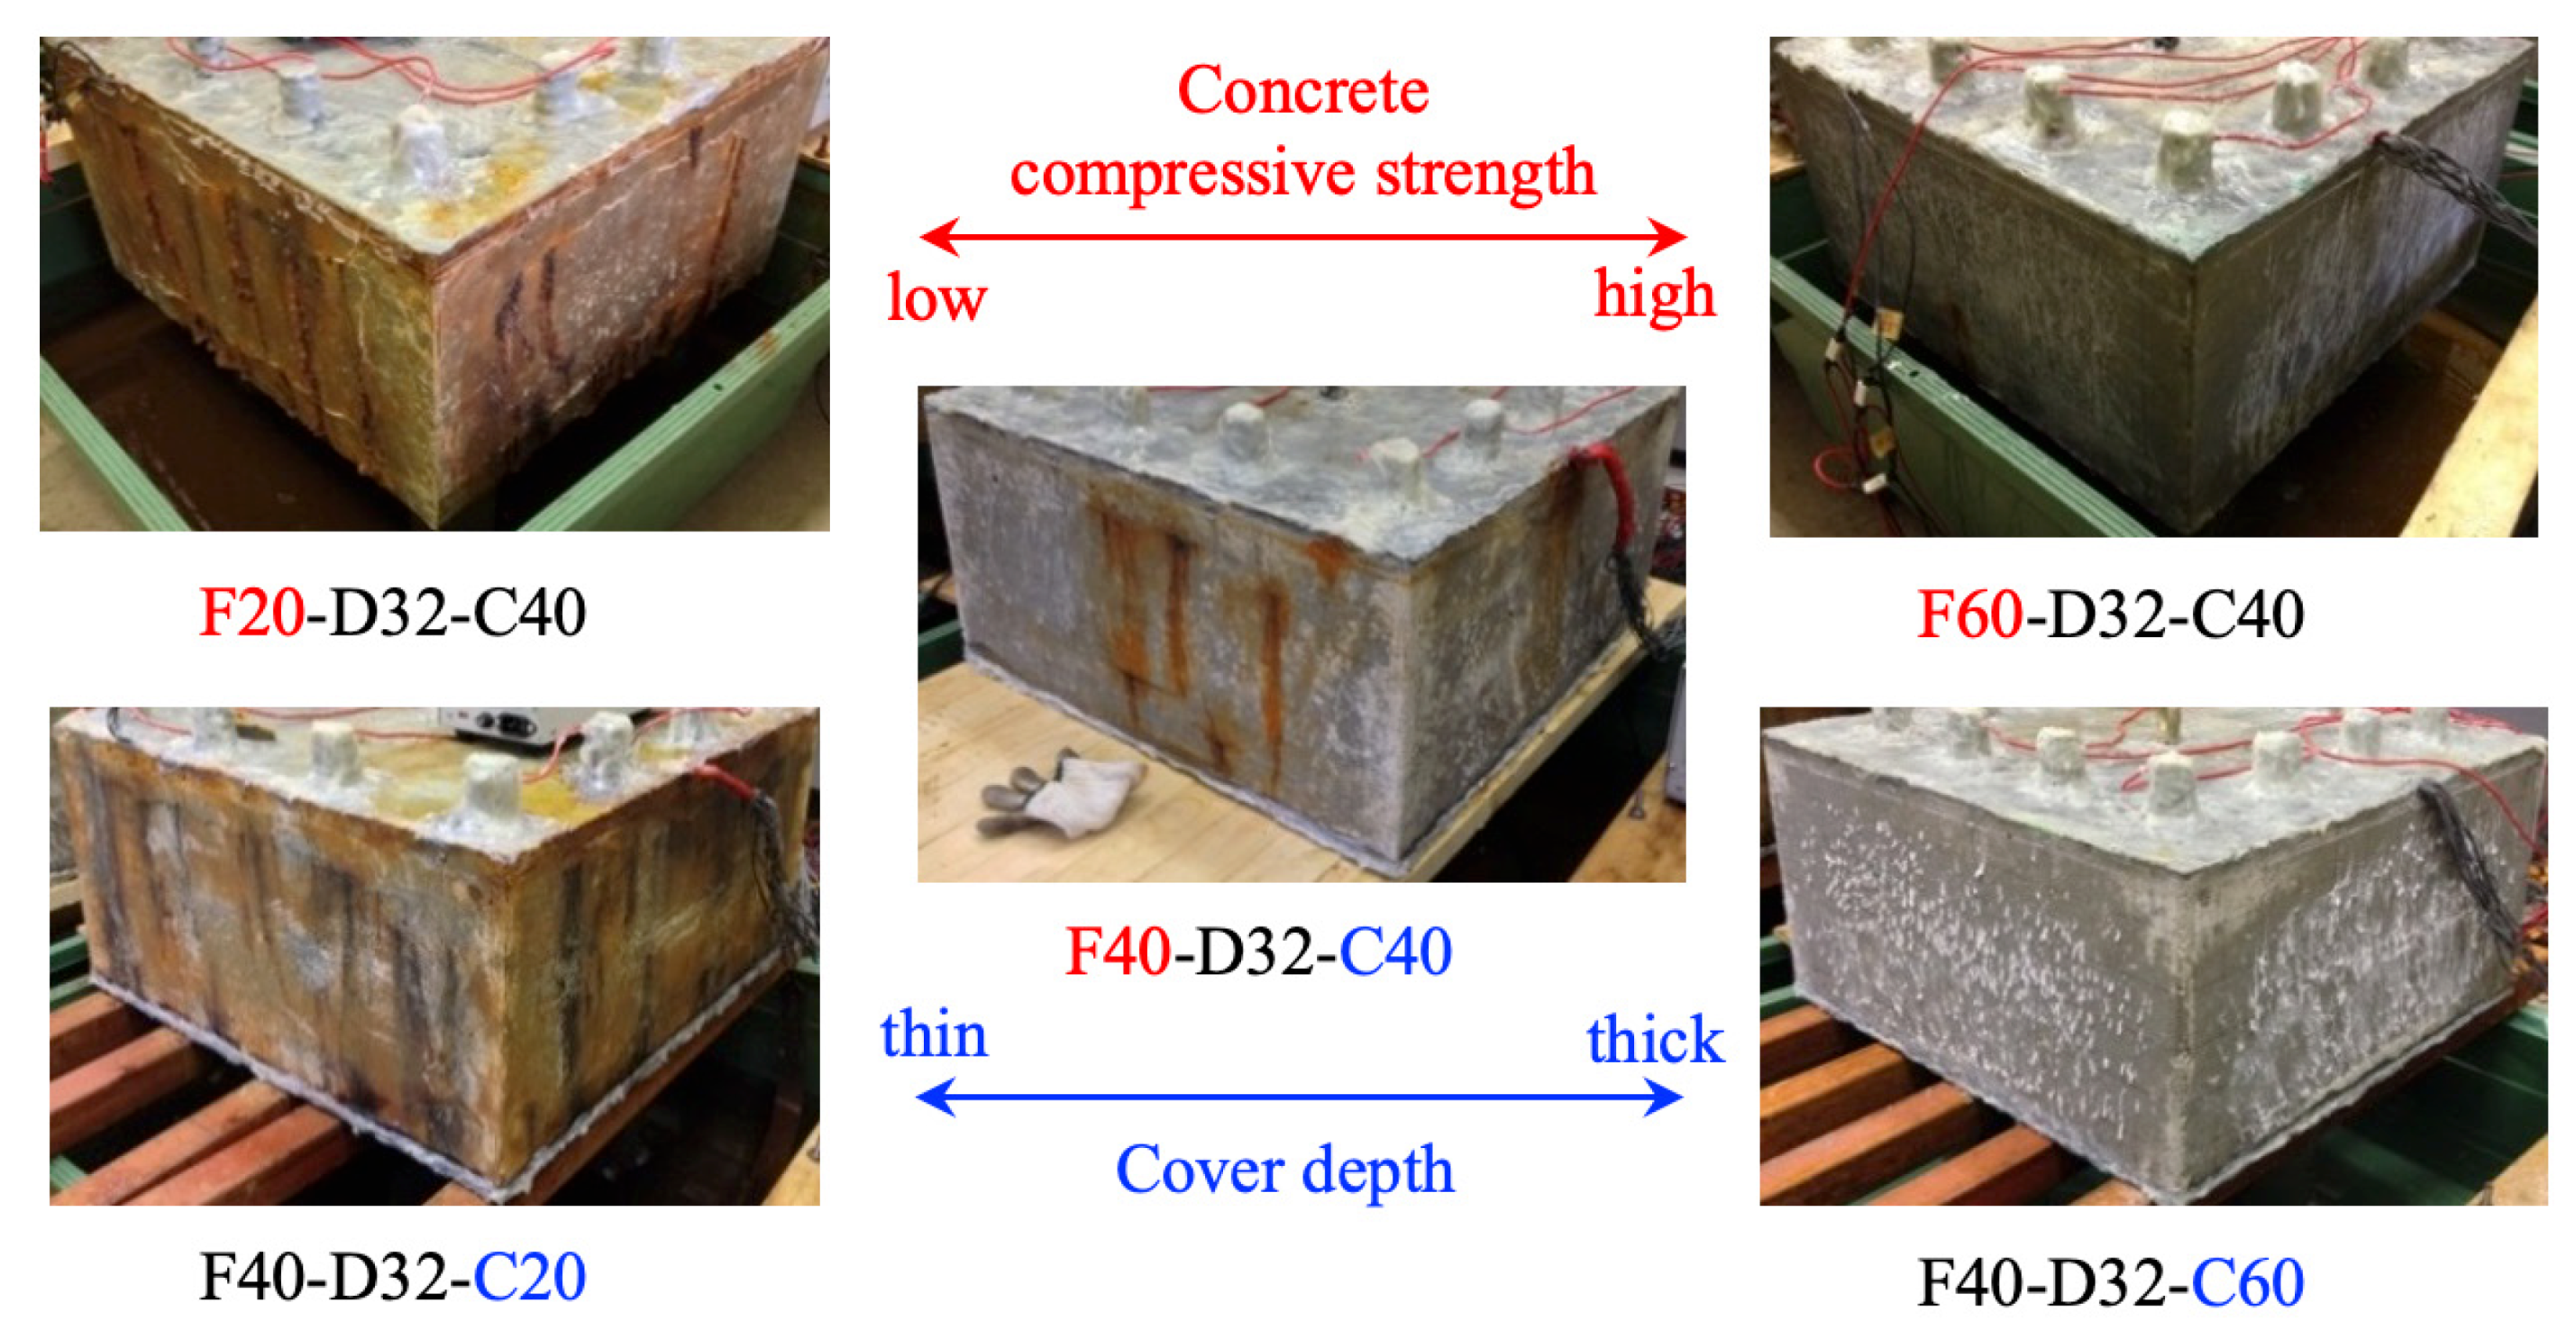
3.2. Corrosion-Induced Concrete Cracking
3.3. Development of Corrosion-Induced Concrete Cracking
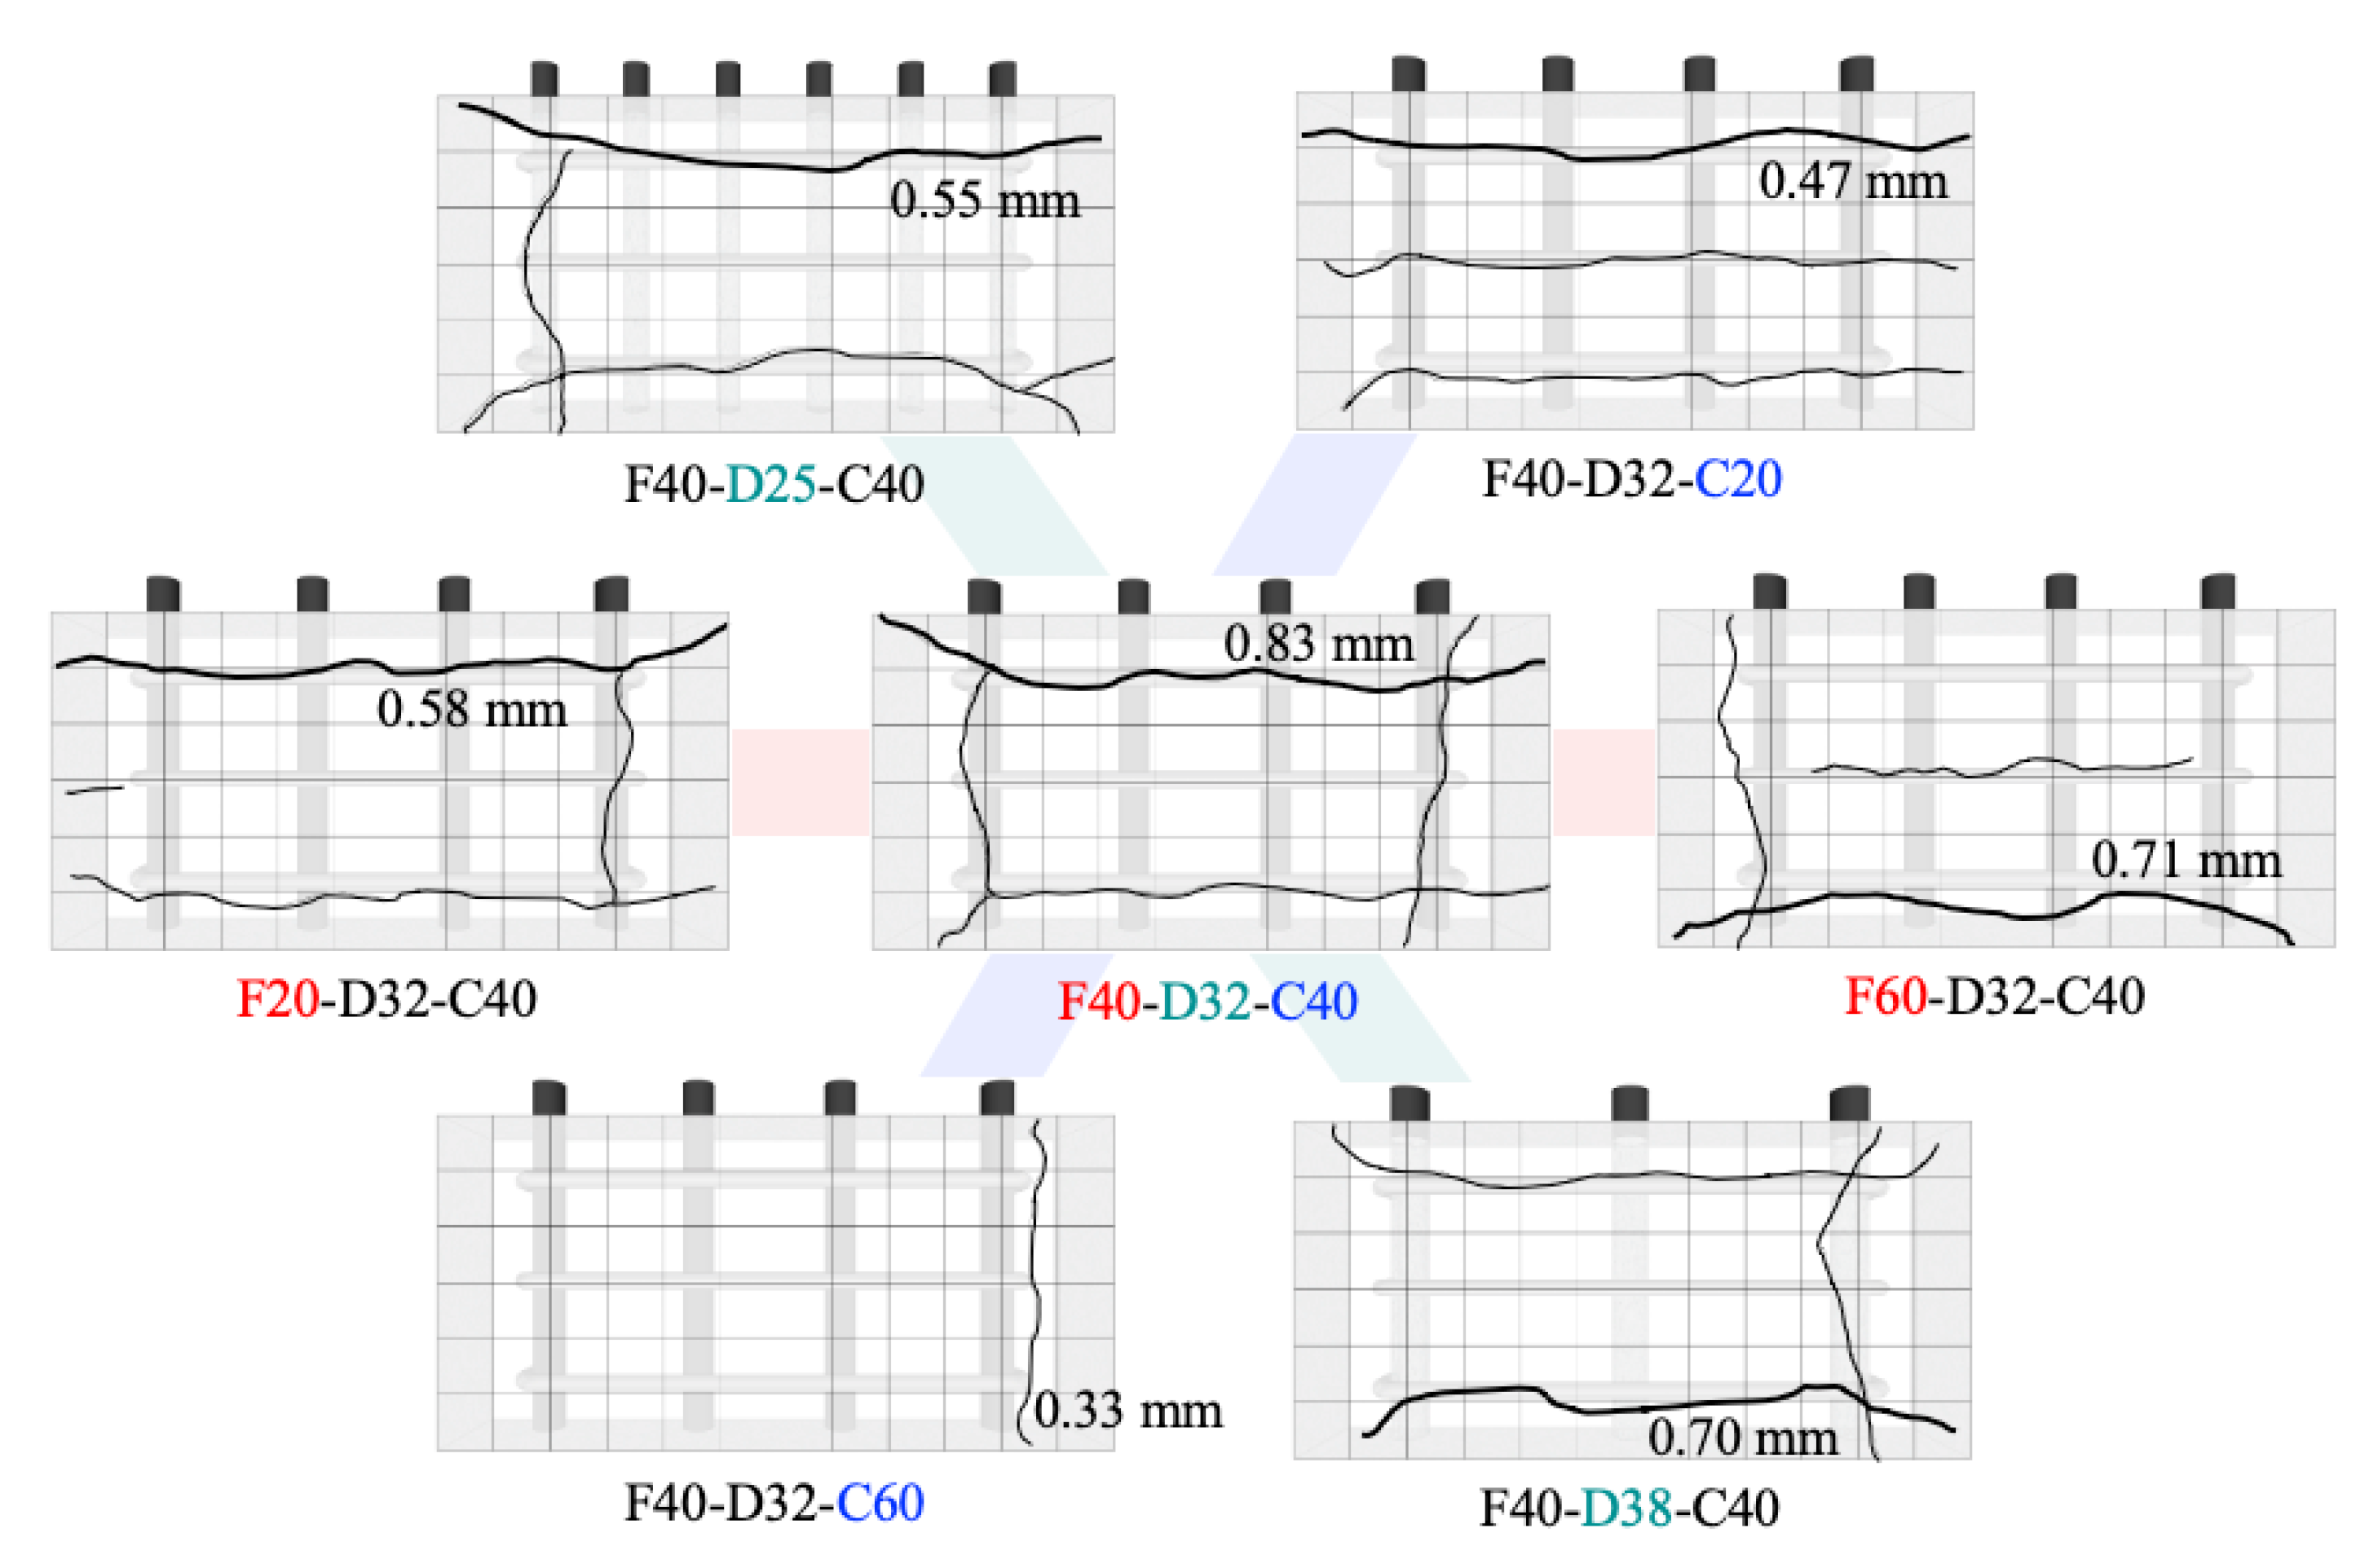
3.4. Crack Widths According to the Corrosion of Transverse Bar
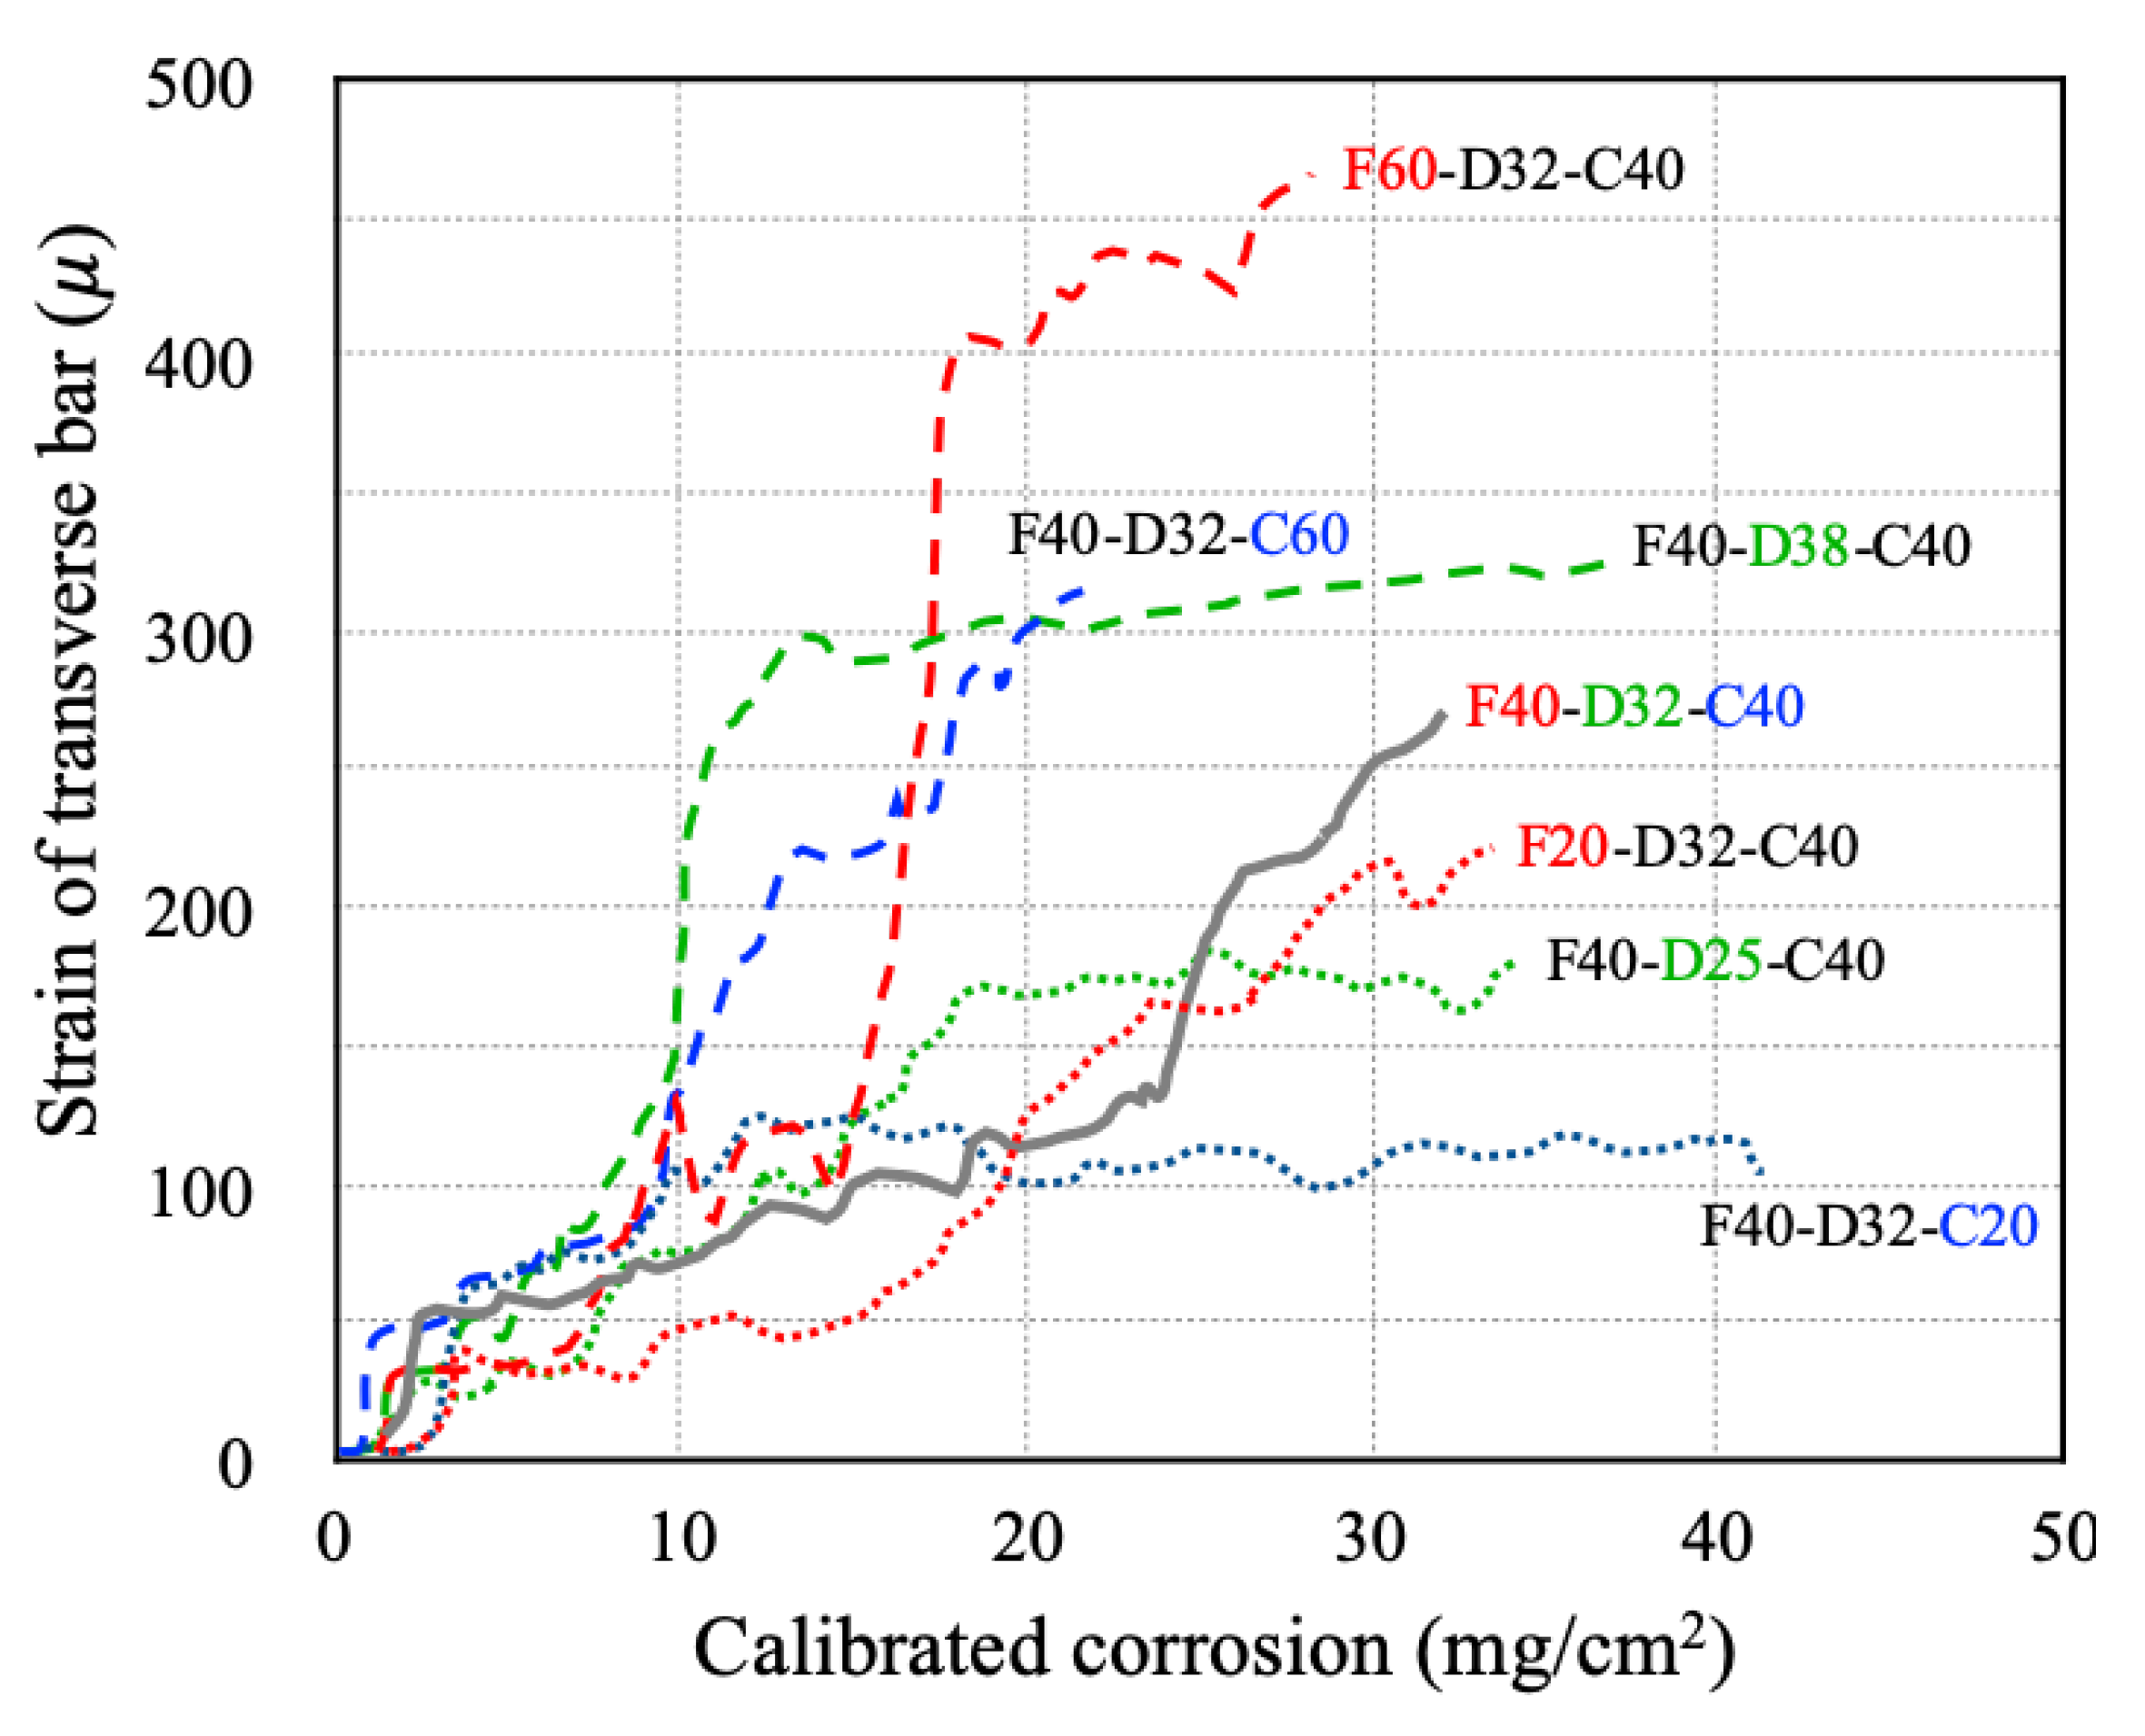
3.5. Strain Behavior of Transverse Bar Resulting from the Corrosion of Longitudinal Bar
4. Conclusions
- (1)
- This study performed accelerated corrosion tests on RC column specimens with transverse and longitudinal rebar and under marine-like conditions. The specimens were set-up so that current flowed through the longitudinal and transverse bar independently, and the current application time was controlled to create an environment with an uneven chloride ion distribution representative of in-situ RC columns.
- (2)
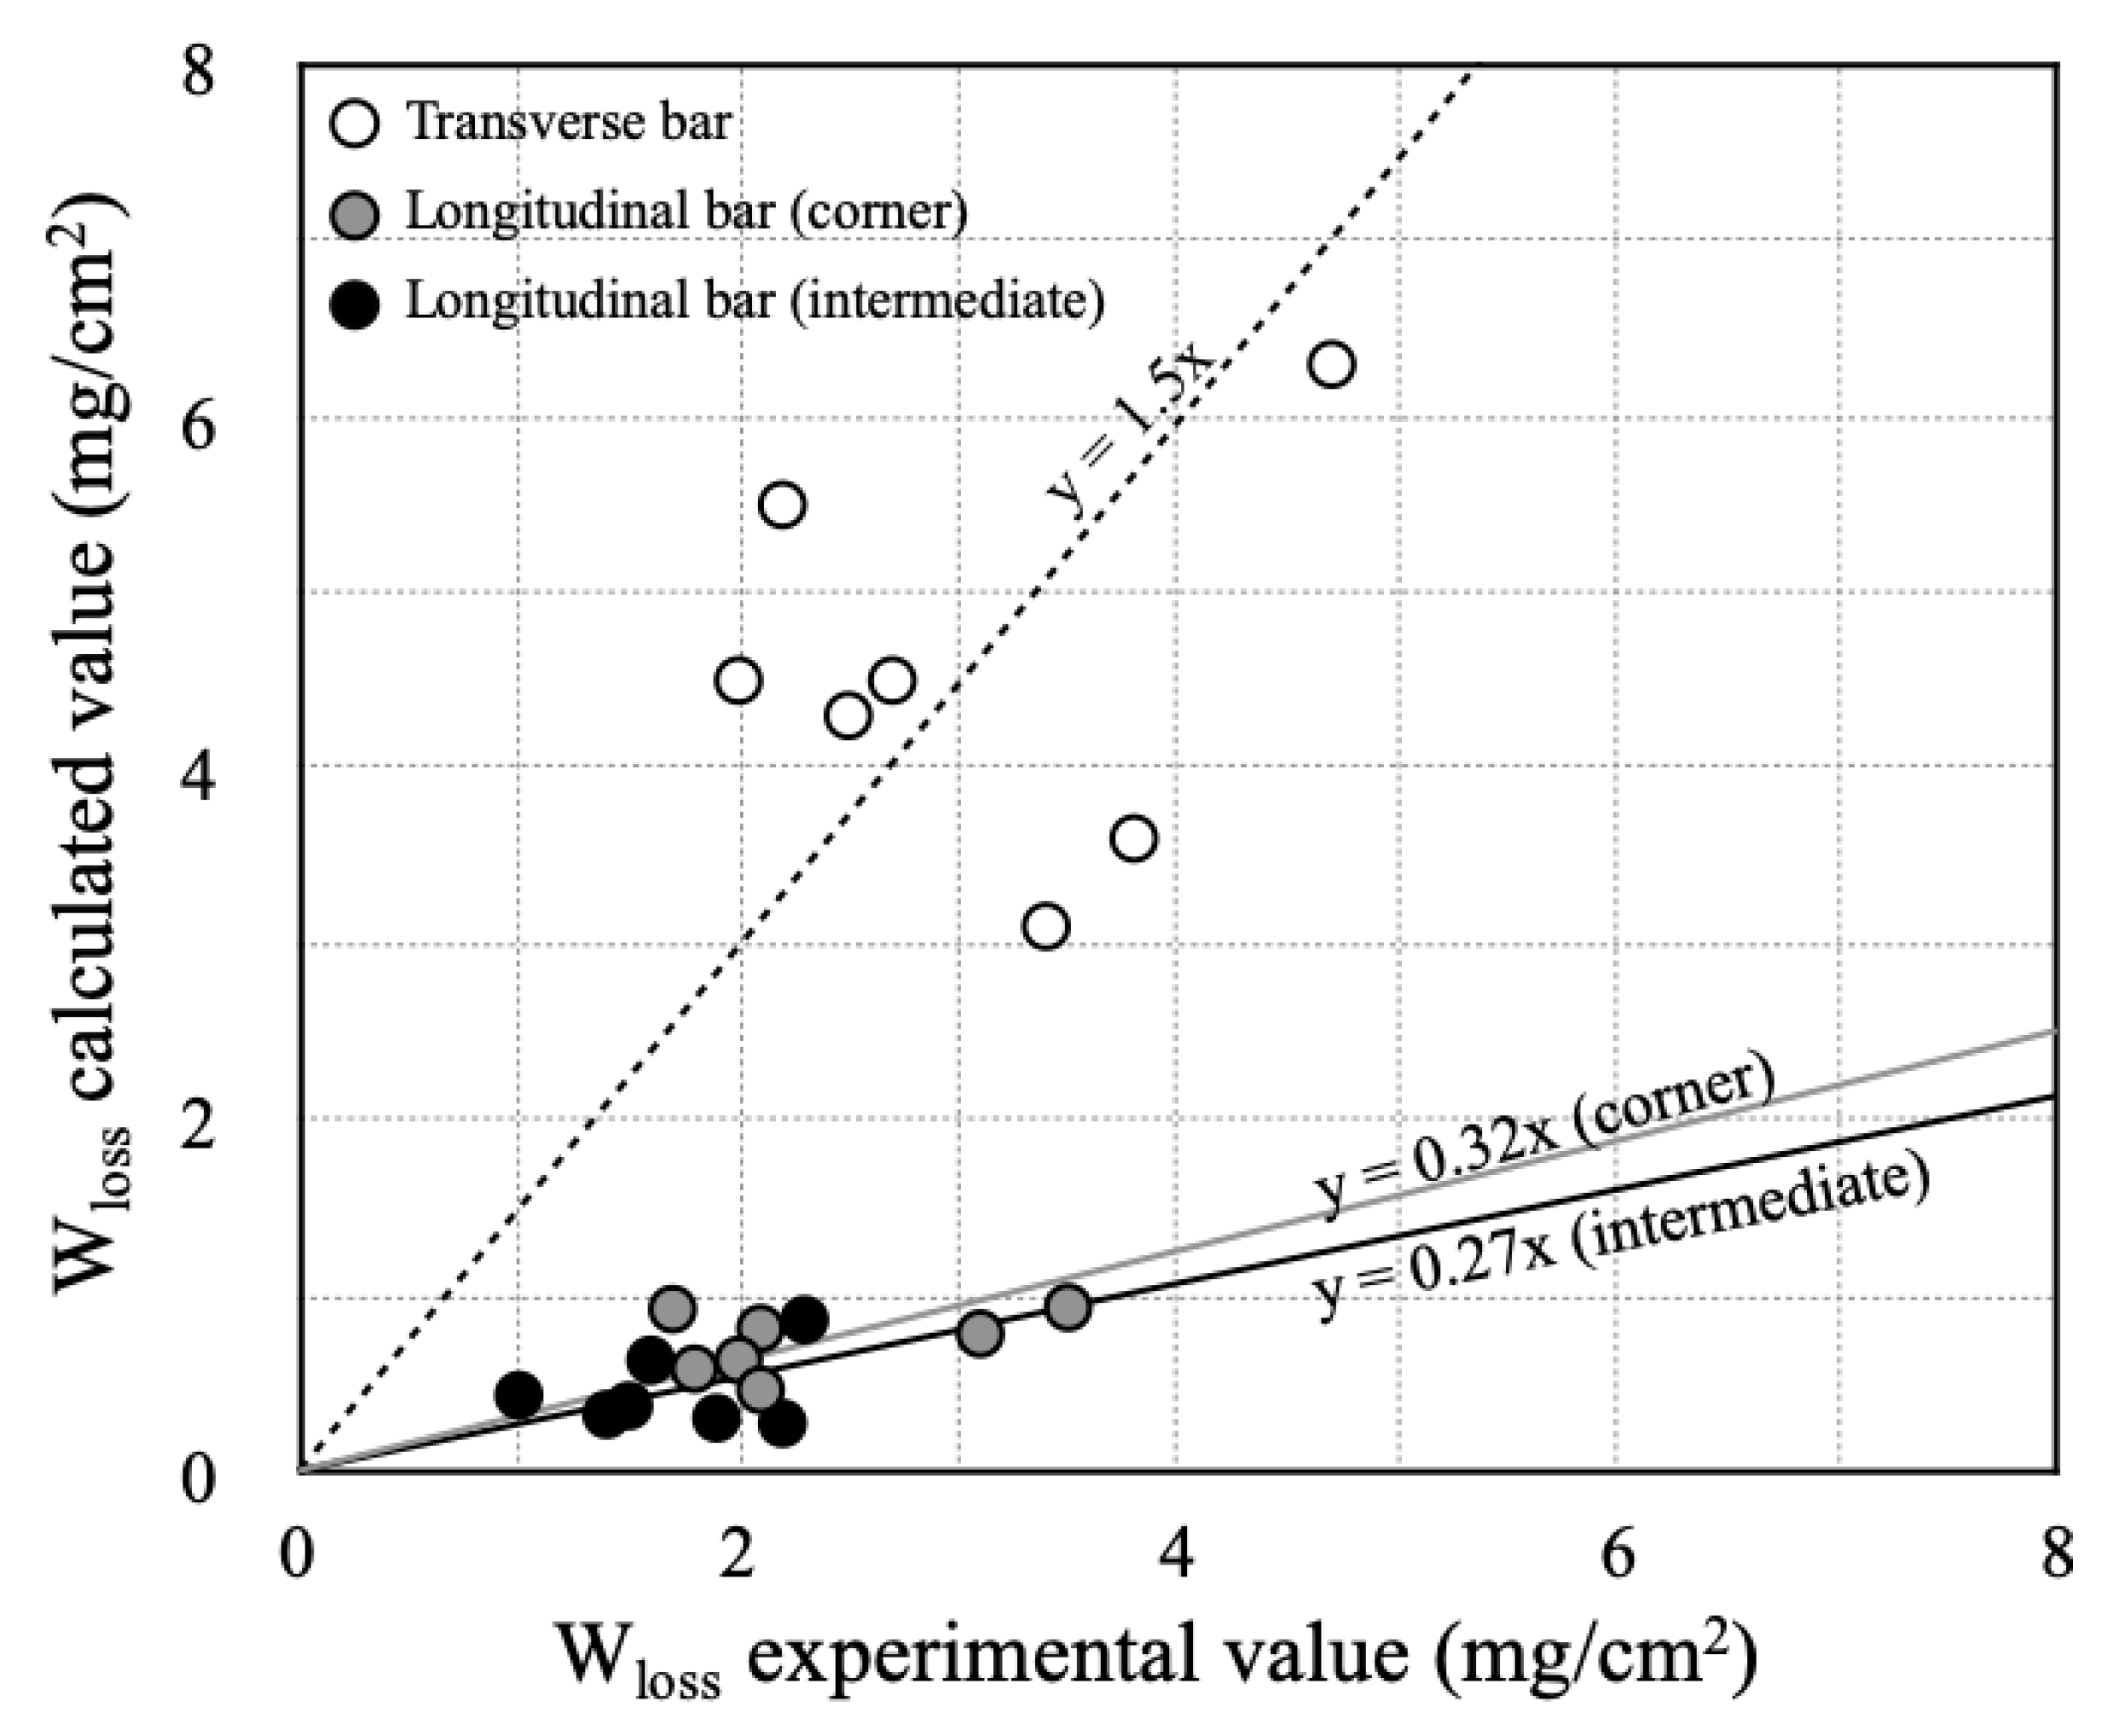
- The rebar was removed from the RC column specimens after the accelerated corrosion tests and the rebar weights were measured. The extent of longitudinal bar corrosion varied according to the direction of chloride ions permeation, and the corner rebar corroded 1.5 times more than the centrally embedded rebar. Macro cells also formed due to the uneven chloride distribution, and more transverse bar corrosion occurred than longitudinal bar corrosion.
- (3)
- Cracks occurred first in the concrete around the transverse bar in the RC specimens with a low concrete compressive strength and thin cover. It was confirmed that concrete corrosion cracking and rebar strain are greatly affected by the behavior of rebar corrosion by-products and their interaction with pores in the cement paste.
- (4)
- In RC column specimens with high-dimeter longitudinal rebars or thick concrete cover, the inability of corrosion products to flow out resulted in a sharp increase in transverse bar strain, even with relatively low amounts of corrosion. Therefore, it is necessary to be cautious of reduced durability resulting from the accumulation of chlorides in RC columns that have rebar with large longitudinal bar diameters or thick concrete covers.
- (5)
- The weight reduction of rebar after the accelerated corrosion experiments was determined and a calibrated corrosion amount was calculated, assuming that this was proportional to the ampere-hours. However, under field conditions, rebar corrosion may vary due to environmental conditions, including chloride ion concentrations, oxygen supply, and humidity. Therefore, further experiments are needed to examine the progression of rebar corrosion and to evaluate the effect of rebar corrosion on concrete cover cracking behavior.
Author Contributions
Funding
Conflicts of Interest
References
- Bažant, Z.P. Physical model for steel corrosion in concrete sea structures—Application. J. Struct. Div. 1979, 105, 1155–1166. [Google Scholar]
- Hartt, W.H. Service life projection for chloride-exposed concrete reinforced with black and corrosion-resistant bars. Corrosion 2012, 68, 754–761. [Google Scholar] [CrossRef]
- Zhao, Y.; Ren, H.; Dai, H.; Jin, W. Composition and expansion coefficient of rust based on X-ray diffraction and thermal analysis. Corros. Sci. 2011, 53, 1646–1658. [Google Scholar] [CrossRef]
- Zhao, Y.; Dong, J.; Wu, Y.; Jin, W. Corrosion-induced concrete cracking model considering corrosion product-filled paste at the concrete/steel interface. Constr. Build. Mater. 2016, 116, 273–280. [Google Scholar] [CrossRef]
- Aryanto, A.; Shinohara, Y. Effect of Confinement and Concrete Strength upon Crack Behaviors Induced by Corrosion-Product Expansion for Reinforced Concrete Members. J. Struct. Constr. Eng. (Trans. Aij) 2014, 79, 305–313. [Google Scholar] [CrossRef] [Green Version]
- Shinohara, Y. Effect of Confinement upon Crack Behaviors caused by Corrosion-Product Expansion around Corroding Bars. In Proceedings of the 12nd International Conference on Durability of Building Materials and Components, Porto, Portugal, 12–15 April 2011; Volume 3, pp. 1577–1584. [Google Scholar]
- Lin, C.-C.; Wang, C.-X. Correlation between accelerated corrosion tests and atmospheric corrosion tests on steel. J. Appl. Electrochem. 2005, 35, 837–843. [Google Scholar] [CrossRef]
- Andrade, C.; Alonso, C.; Molina, F.J. Cover cracking as a function of bar corrosion: Part I-Experimental test. Mater. Struct. 1993, 26, 453–464. [Google Scholar] [CrossRef]
- Vu, K.; Stewart, M.G.; Mullard, J. Corrosion-induced cracking: Experimental data and predictive models. Aci Struct. J. 2005, 102, 719–726. [Google Scholar]
- Toongoenthong, K.; Maekawa, K. Simulation of Coupled Corrosive Product Formation, Migration into Crack and Propagation in Reinforced Concrete Sections. J. Adv. Concr. Technol. 2005, 3, 253–265. [Google Scholar] [CrossRef] [Green Version]
- Val, D.V.; Chernin, L.; Stewart, M.G. Experimental and Numerical Investigation of Corrosion-Induced Cover Cracking in Reinforced Concrete Structures. J. Struct. Eng. 2009, 135, 376–385. [Google Scholar] [CrossRef]
- Ormellese, M.; Berra, M.; Bolzoni, F.; Pastore, T. Corrosion inhibitors for chlorides induced corrosion in reinforced concrete structures. Cem. Concr. Res. 2006, 36, 536–547. [Google Scholar] [CrossRef]
- Standard specification for concrete structure (maintenance). Available online: http://www.jsce-int.org/system/files/JGC17_Standard_Specifications_Maintenance_1.1.pdf (accessed on 3 February 2020).
- Zhao, Y.; Karimi, A.R.; Wong, H.S.; Hu, B.; Buenfeld, N.R.; Jin, W. Comparison of uniform and non-uniform corrosion induced damage in reinforced concrete based on a Gaussian description of the corrosion layer. Corros. Sci. 2011, 53, 2803–2814. [Google Scholar] [CrossRef] [Green Version]
- Jang, B.S.; Oh, B.H. Effects of non-uniform corrosion on the cracking and service life of reinforced concrete structures. Cem. Concr. Res. 2010, 40, 1441–1450. [Google Scholar] [CrossRef]
- Du, Y.G.; Chan, A.H.C.; Clark, L.A. Finite element analysis of the effects of radial expansion of corroded reinforcement. Comput. Struct. 2006, 84, 917–929. [Google Scholar] [CrossRef]
- Šavija, B.; Luković, M.; Pacheco, J.; Schlangen, E. Cracking of the concrete cover due to reinforcement corrosion: A two-dimensional lattice model study. Constr. Build. Mater. 2013, 44, 626–638. [Google Scholar] [CrossRef]
- Du, X.; Jin, L.; Zhang, R. Modeling the cracking of cover concrete due to non-uniform corrosion of reinforcement. Corros. Sci. 2014, 89, 189–202. [Google Scholar] [CrossRef]
- Soylev, T.A.; François, R. Quality of steel–concrete interface and corrosion of reinforcing steel. Cem. Concr. Res. 2003, 33, 1407–1415. [Google Scholar] [CrossRef]
- Chernin, L.; Val, D.V.; Volokh, K.Y. Analytical modelling of concrete cover cracking caused by corrosion of reinforcement. Mater. Struct. 2009, 43, 543–556. [Google Scholar] [CrossRef]
- Zhao, Y.; Yu, J.; Jin, W. Damage analysis and cracking model of reinforced concrete structures with rebar corrosion. Corros. Sci. 2011, 53, 3388–3397. [Google Scholar] [CrossRef]
- Beeby, A.W. Cracking, Cover, and Corrostion of Reinforcement. Concr. Int. 1983, 5, 35–40. [Google Scholar]


| fck (MPa) | W/C (%) | Slump (mm) | Air (%) | S/a (%) | Water (kg/m3) | Unit Weight (kg/m3) | ||
|---|---|---|---|---|---|---|---|---|
| C | S | G | ||||||
| 20 | 63.4 | 180 ± 30 | 4 ± 2 | 49.7 | 184 | 290 | 891 | 901 |
| 40 | 43.7 | 47.1 | 170 | 389 | 822 | 923 | ||
| 60 | 34.1 | 47.4 | 170 | 499 | 804 | 891 | ||
| Mechanical Properties | Concrete | Steel Bar | |||||
|---|---|---|---|---|---|---|---|
| F20 | F40 | F60 | D16 | D25 | D32 | D38 | |
| Comp. strength (MPa) | 22.3 | 44.7 | 59.0 | - | - | - | - |
| Tensile strength (MPa) | 2.83 | 3.96 | 4.06 | 493 | 553 | 611 | 641 |
| Yield strength (MPa) | - | - | - | 340 | 380 | 439 | 447 |
| Young’s modulus (GPa) | 24.1 | 29.7 | 36.4 | 182 | 191 | 189 | 191 |
| Specimen ID | fck (MPa) | Longitudinal Bar | Transverse Bar | Cover Depth (mm) |
|---|---|---|---|---|
| F20-D32-C40 | 20 | 12-D32 | D16@100 | 40 |
| F40-D32-C40 | 40 | |||
| F60-D32-C40 | 60 | |||
| F40-D38-C40 | 40 | 8-D38 | ||
| F40-D25-C40 | 20-D25 | |||
| F40-D32-C20 | 40 | 12-D32 | 20 | |
| F40-D32-C60 | 60 |
| Specimen ID | Corrosion Rate (mg/cm2) | |
|---|---|---|
| Longitudinal Bar | Transverse Bar (Crack Location) | |
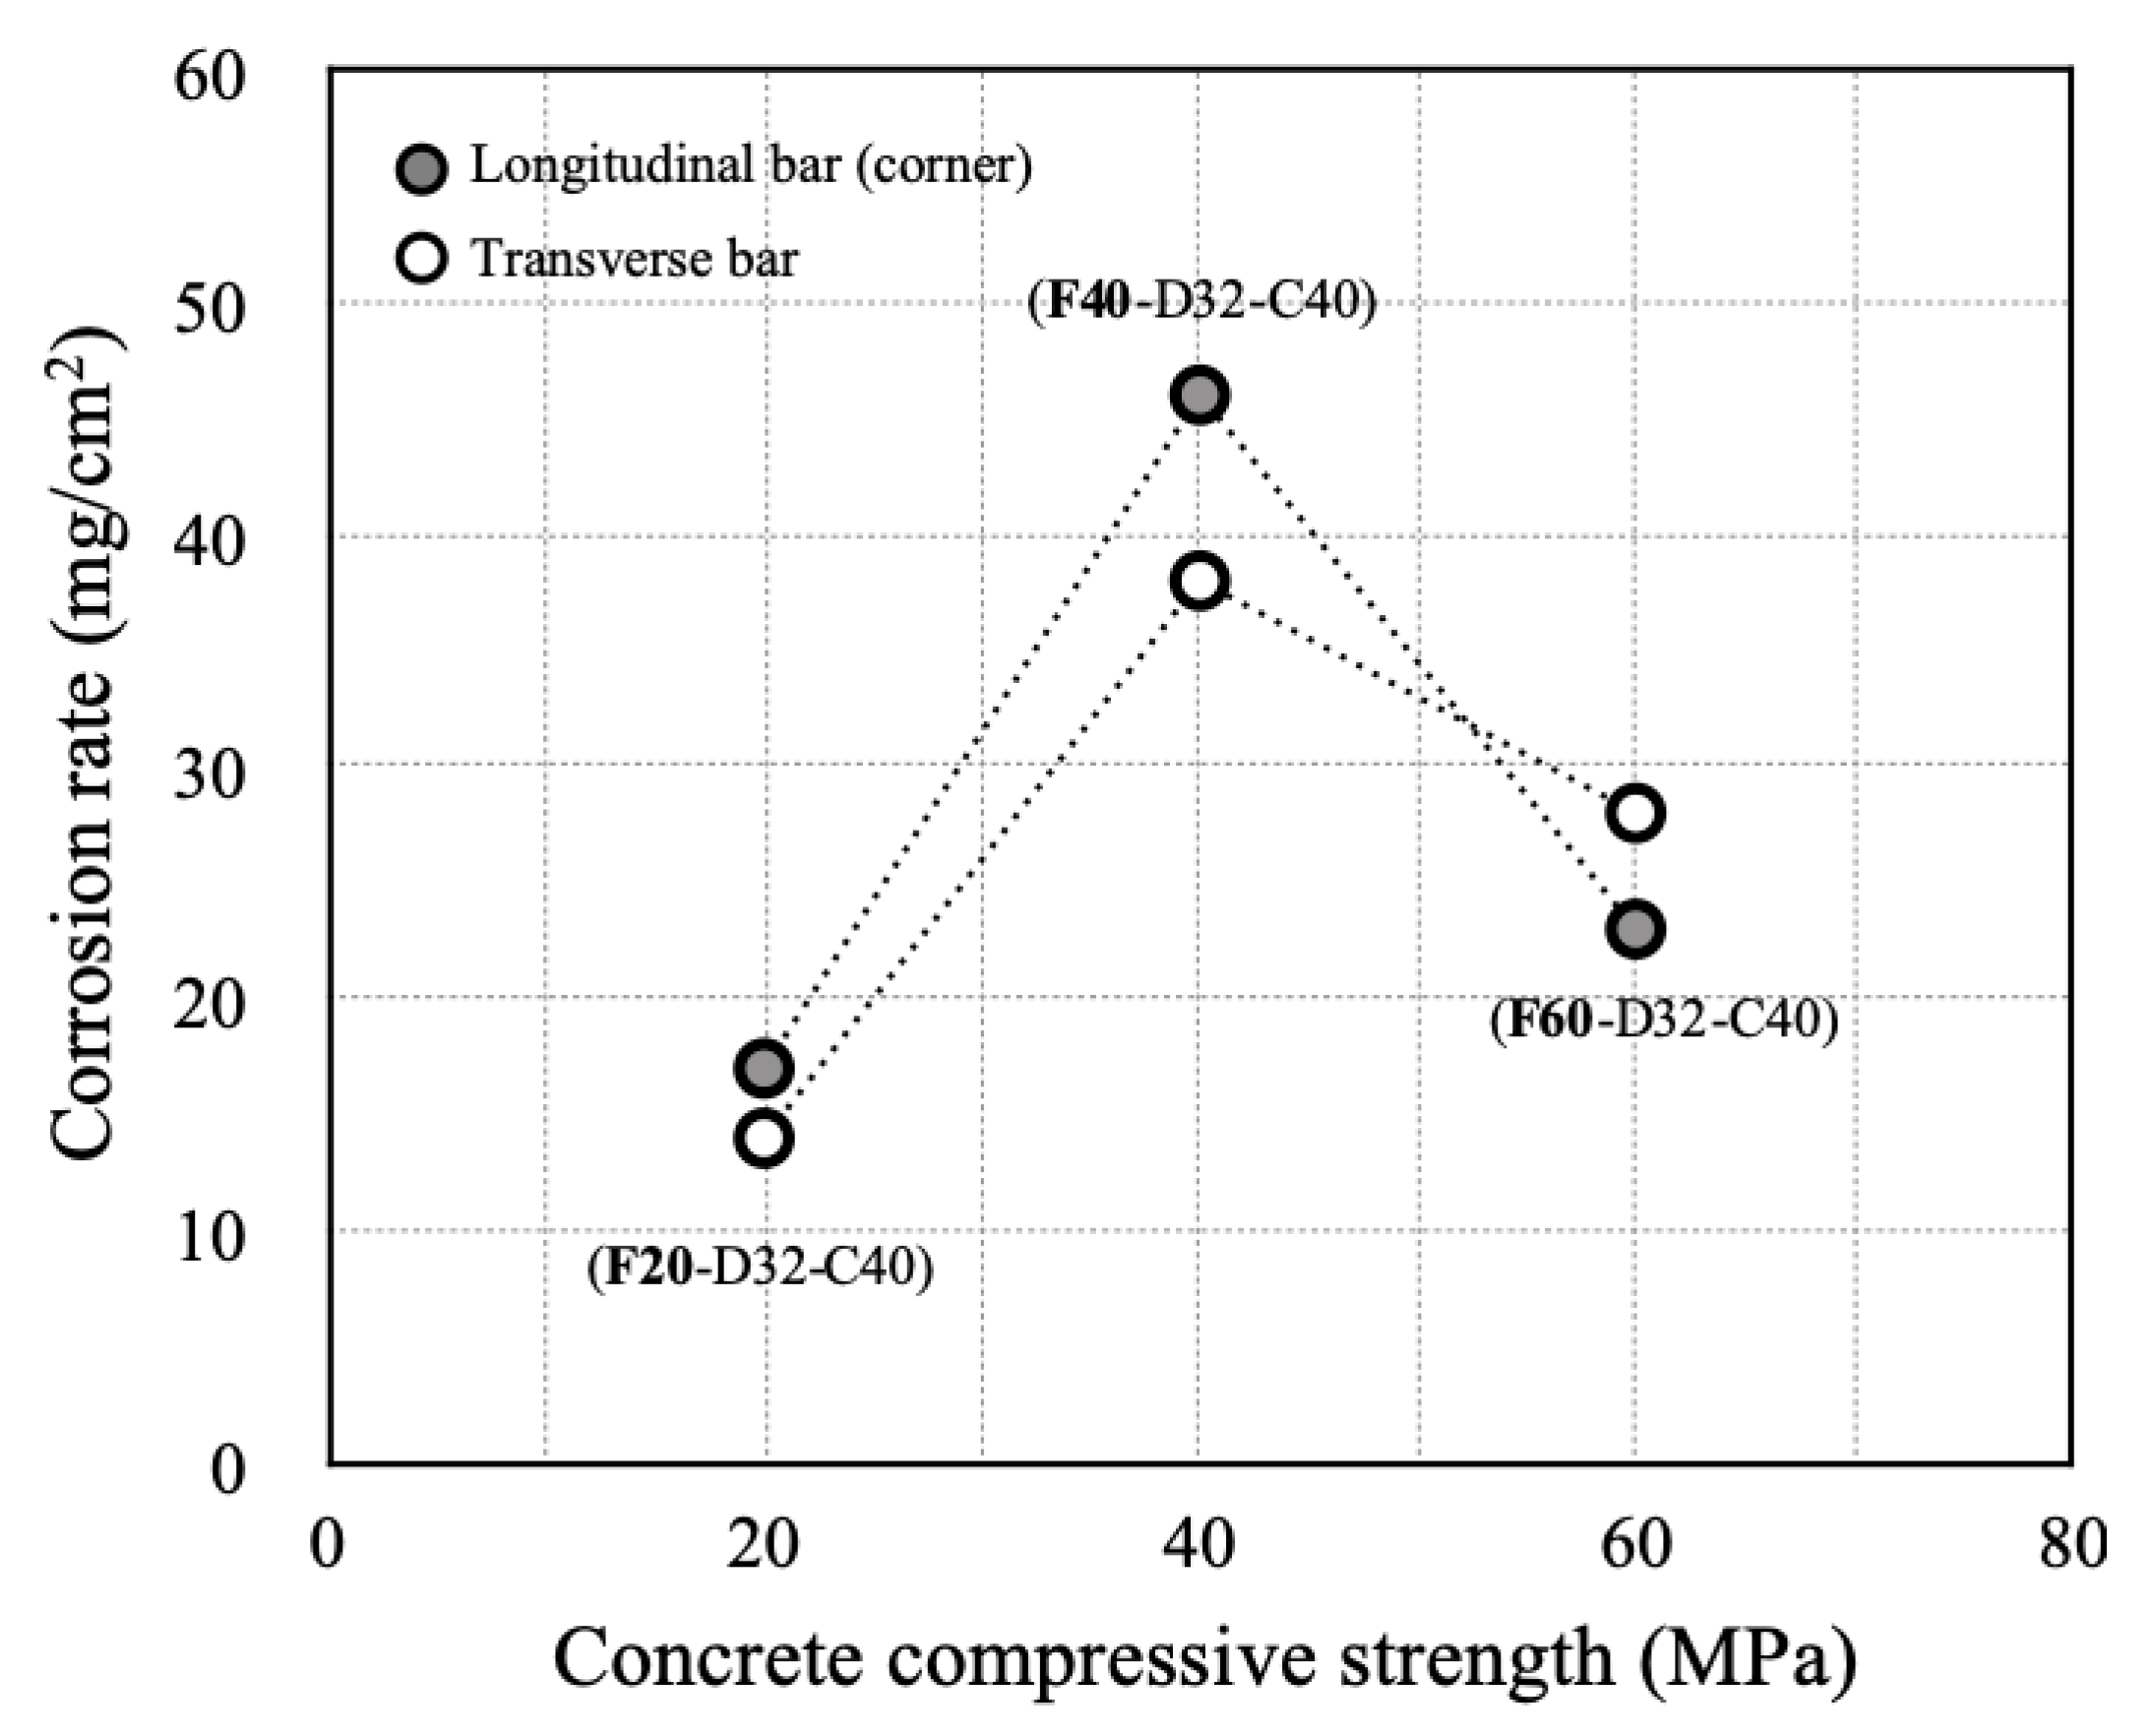
| F20-D32-C40 | 17 | 14 (top) |
| F40-D32-C40 | 46 | 38 (bottom) |
| F60-D32-C40 | 23 | 28 (bottom) |
| F40-D38-C40 | 17 | 61(top) |
| F40-D25-C40 | 33 | 49 (bottom) |
| F40-D32-C20 | 18 | 18 (top) |
| F40-D32-C60 | 23 | 75 (top) |
| Specimen ID (30 Days Passed) | Average Calibrated Corrosion Amount (mg/cm2) | |
|---|---|---|
| Longitudinal Bar | Transverse Bar | |
| F20-D32-C40 | 45 | 150 |
| F40-D32-C40 | 21 | 61 |
| F60-D32-C40 | 12 | 39 |
| F40-D32-C20 | 33 | 170 |
| F40-D32-C60 | 8 | 29 |
© 2020 by the authors. Licensee MDPI, Basel, Switzerland. This article is an open access article distributed under the terms and conditions of the Creative Commons Attribution (CC BY) license (http://creativecommons.org/licenses/by/4.0/).
Share and Cite
Choe, G.; Shinohara, Y.; Kim, G.; Lee, S.; Lee, E.; Nam, J. Concrete Corrosion Cracking and Transverse Bar Strain Behavior in a Reinforced Concrete Column under Simulated Marine Conditions. Appl. Sci. 2020, 10, 1794. https://doi.org/10.3390/app10051794
Choe G, Shinohara Y, Kim G, Lee S, Lee E, Nam J. Concrete Corrosion Cracking and Transverse Bar Strain Behavior in a Reinforced Concrete Column under Simulated Marine Conditions. Applied Sciences. 2020; 10(5):1794. https://doi.org/10.3390/app10051794
Chicago/Turabian StyleChoe, Gyeongcheol, Yasuji Shinohara, Gyuyong Kim, Sangkyu Lee, Euibae Lee, and Jeongsoo Nam. 2020. "Concrete Corrosion Cracking and Transverse Bar Strain Behavior in a Reinforced Concrete Column under Simulated Marine Conditions" Applied Sciences 10, no. 5: 1794. https://doi.org/10.3390/app10051794