Computer-Assisted Screening for Cervical Cancer Using Digital Image Processing of Pap Smear Images


Abstract
1. Introduction
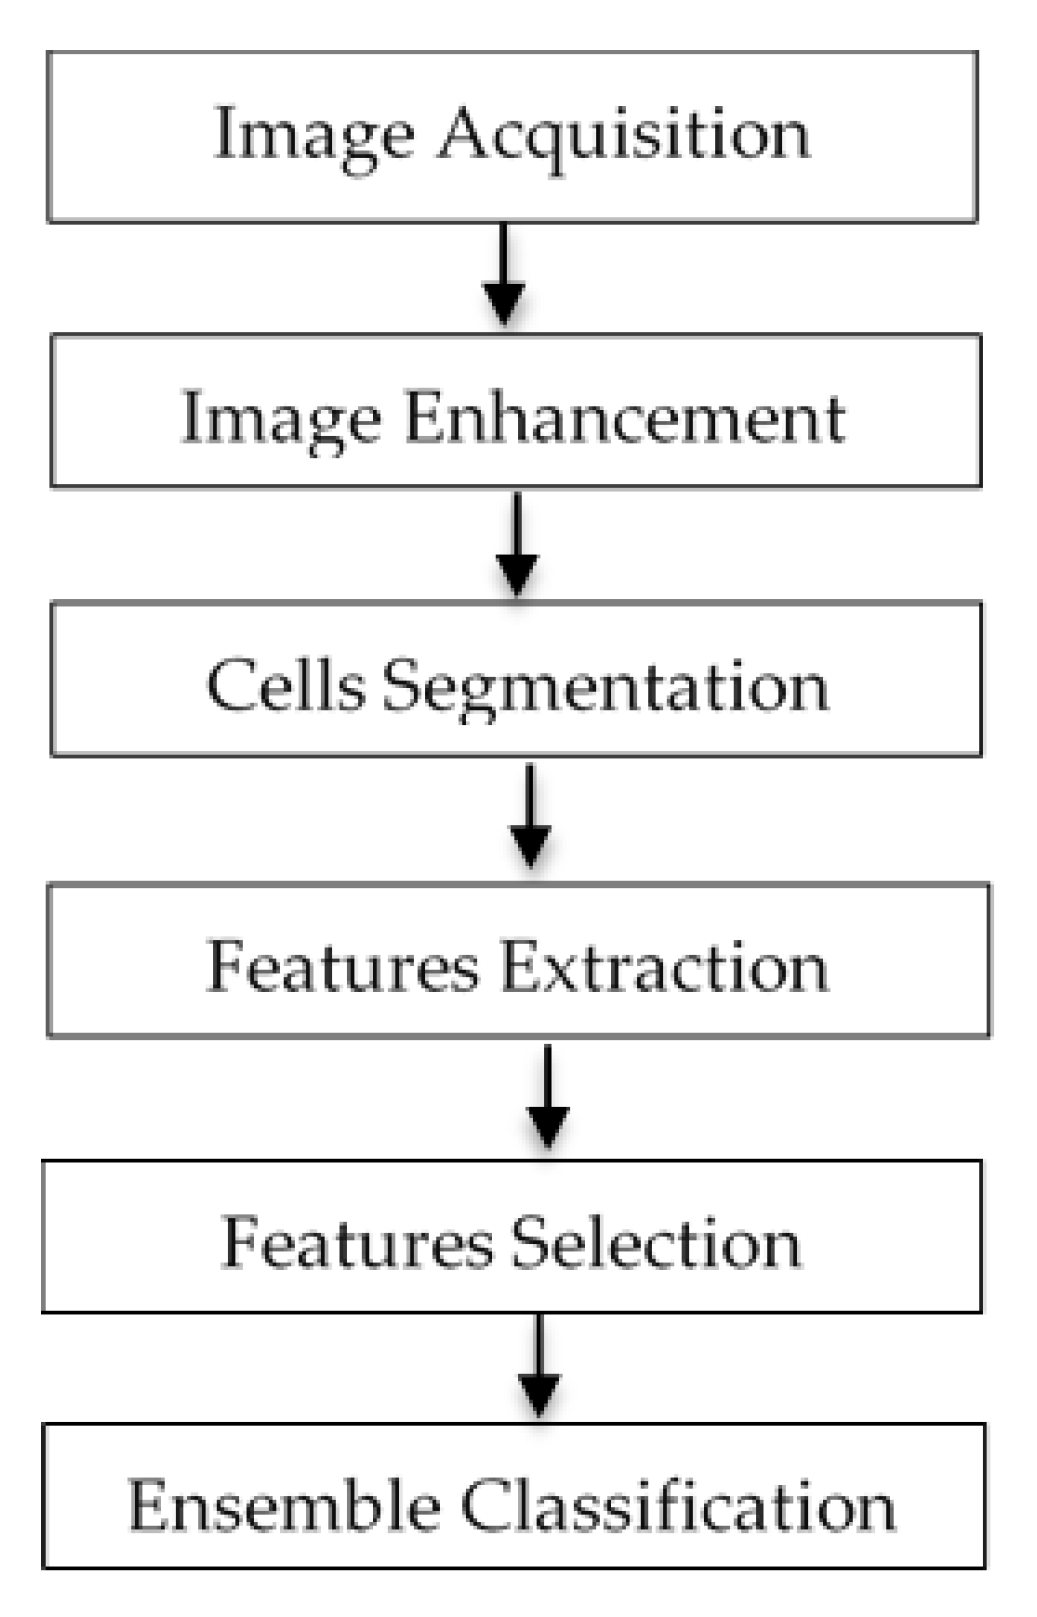
2. Materials and Methods
2.1. Image Acquisition
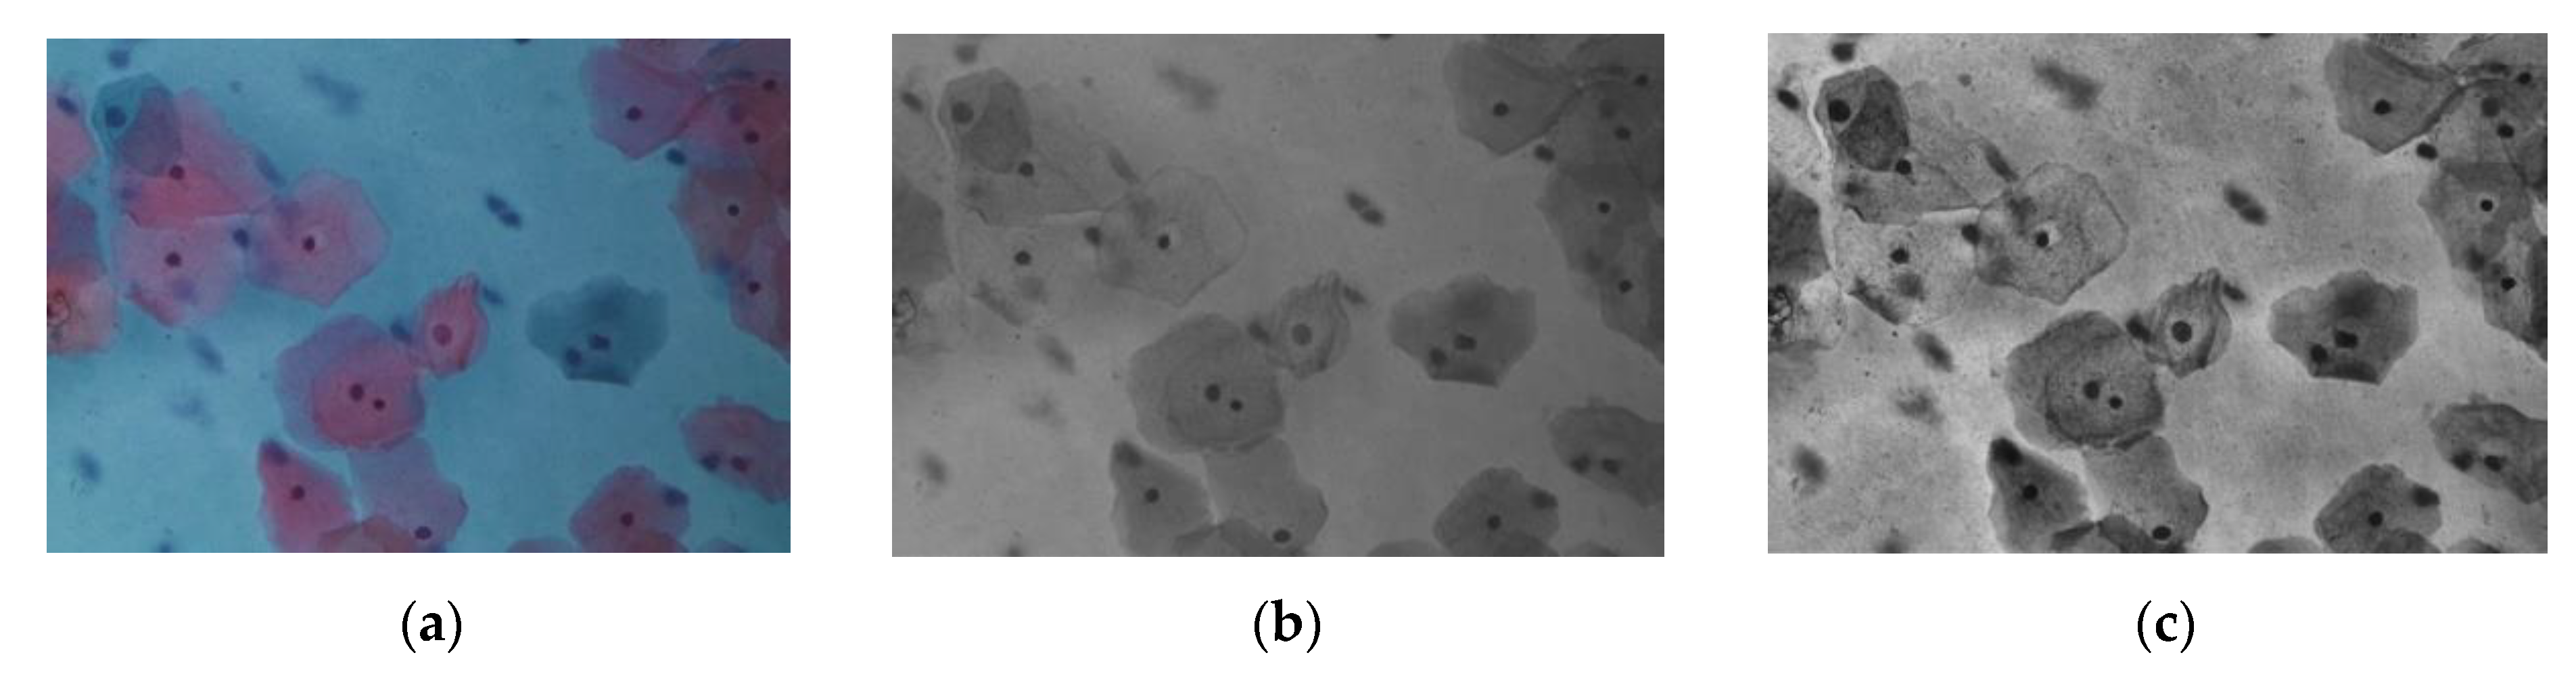
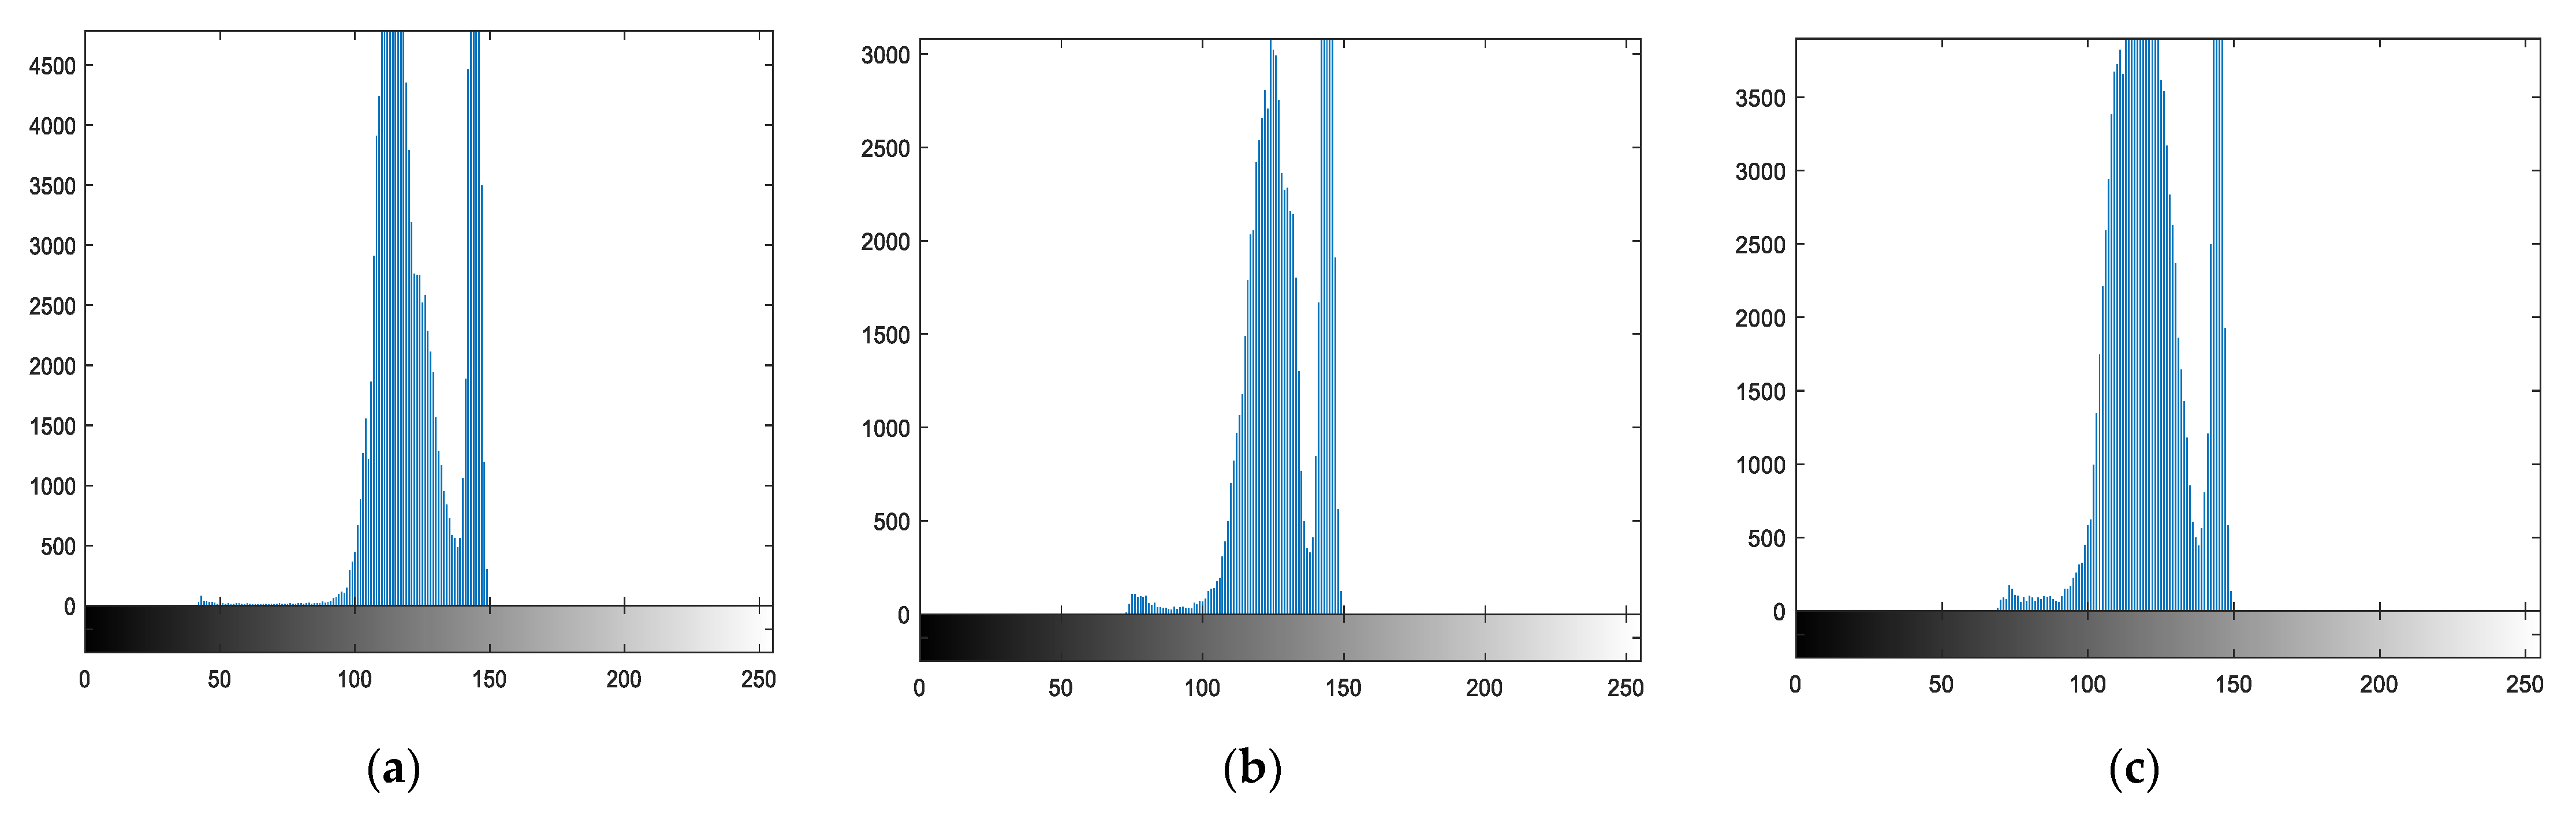
2.2. Image Enhancement
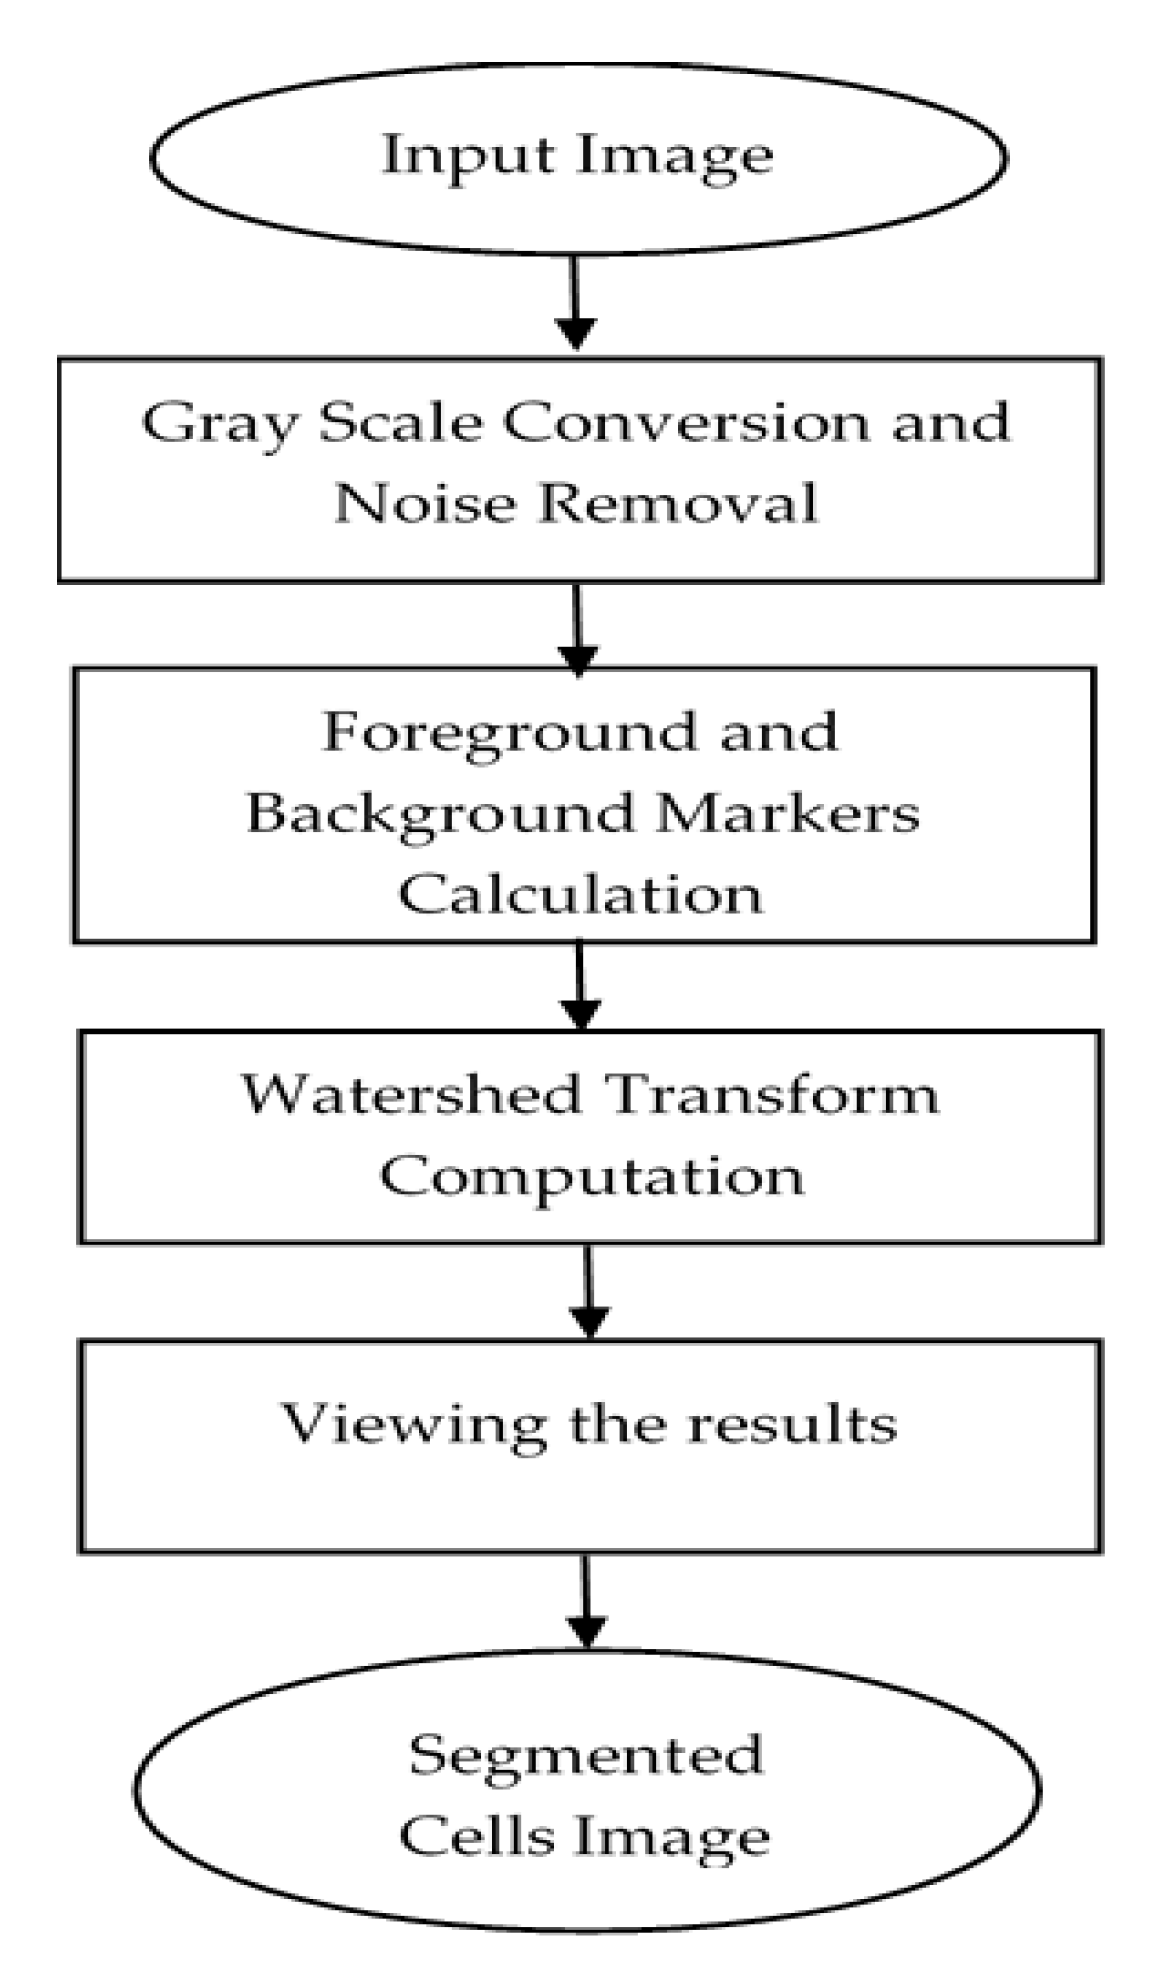
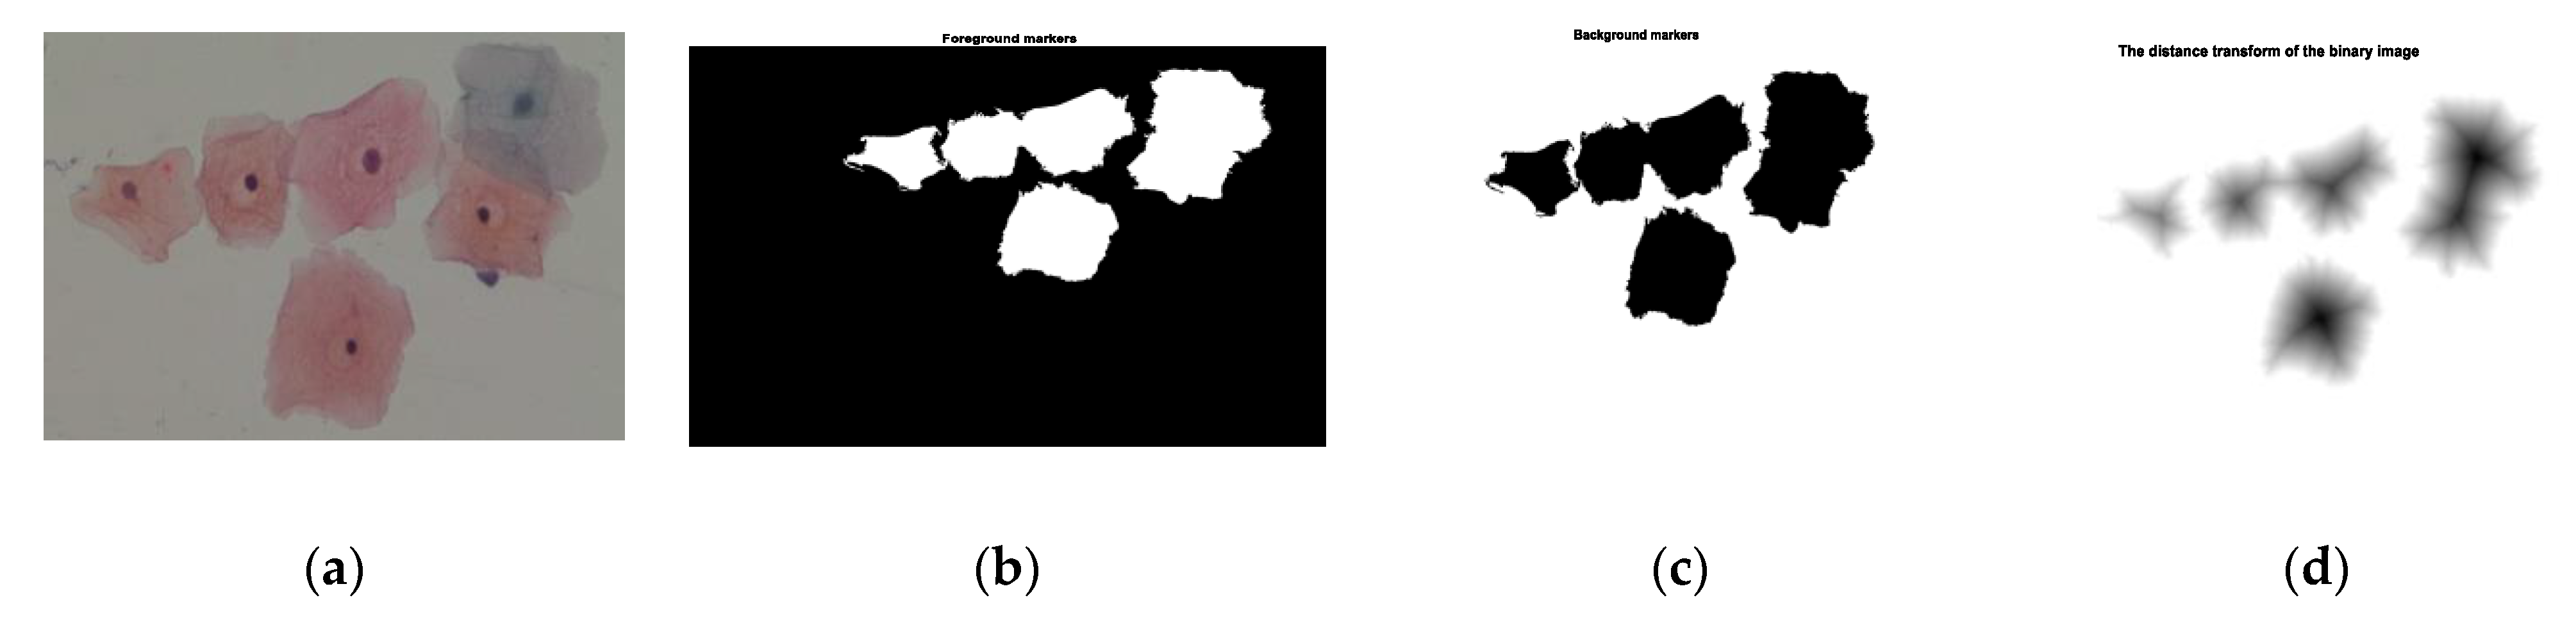
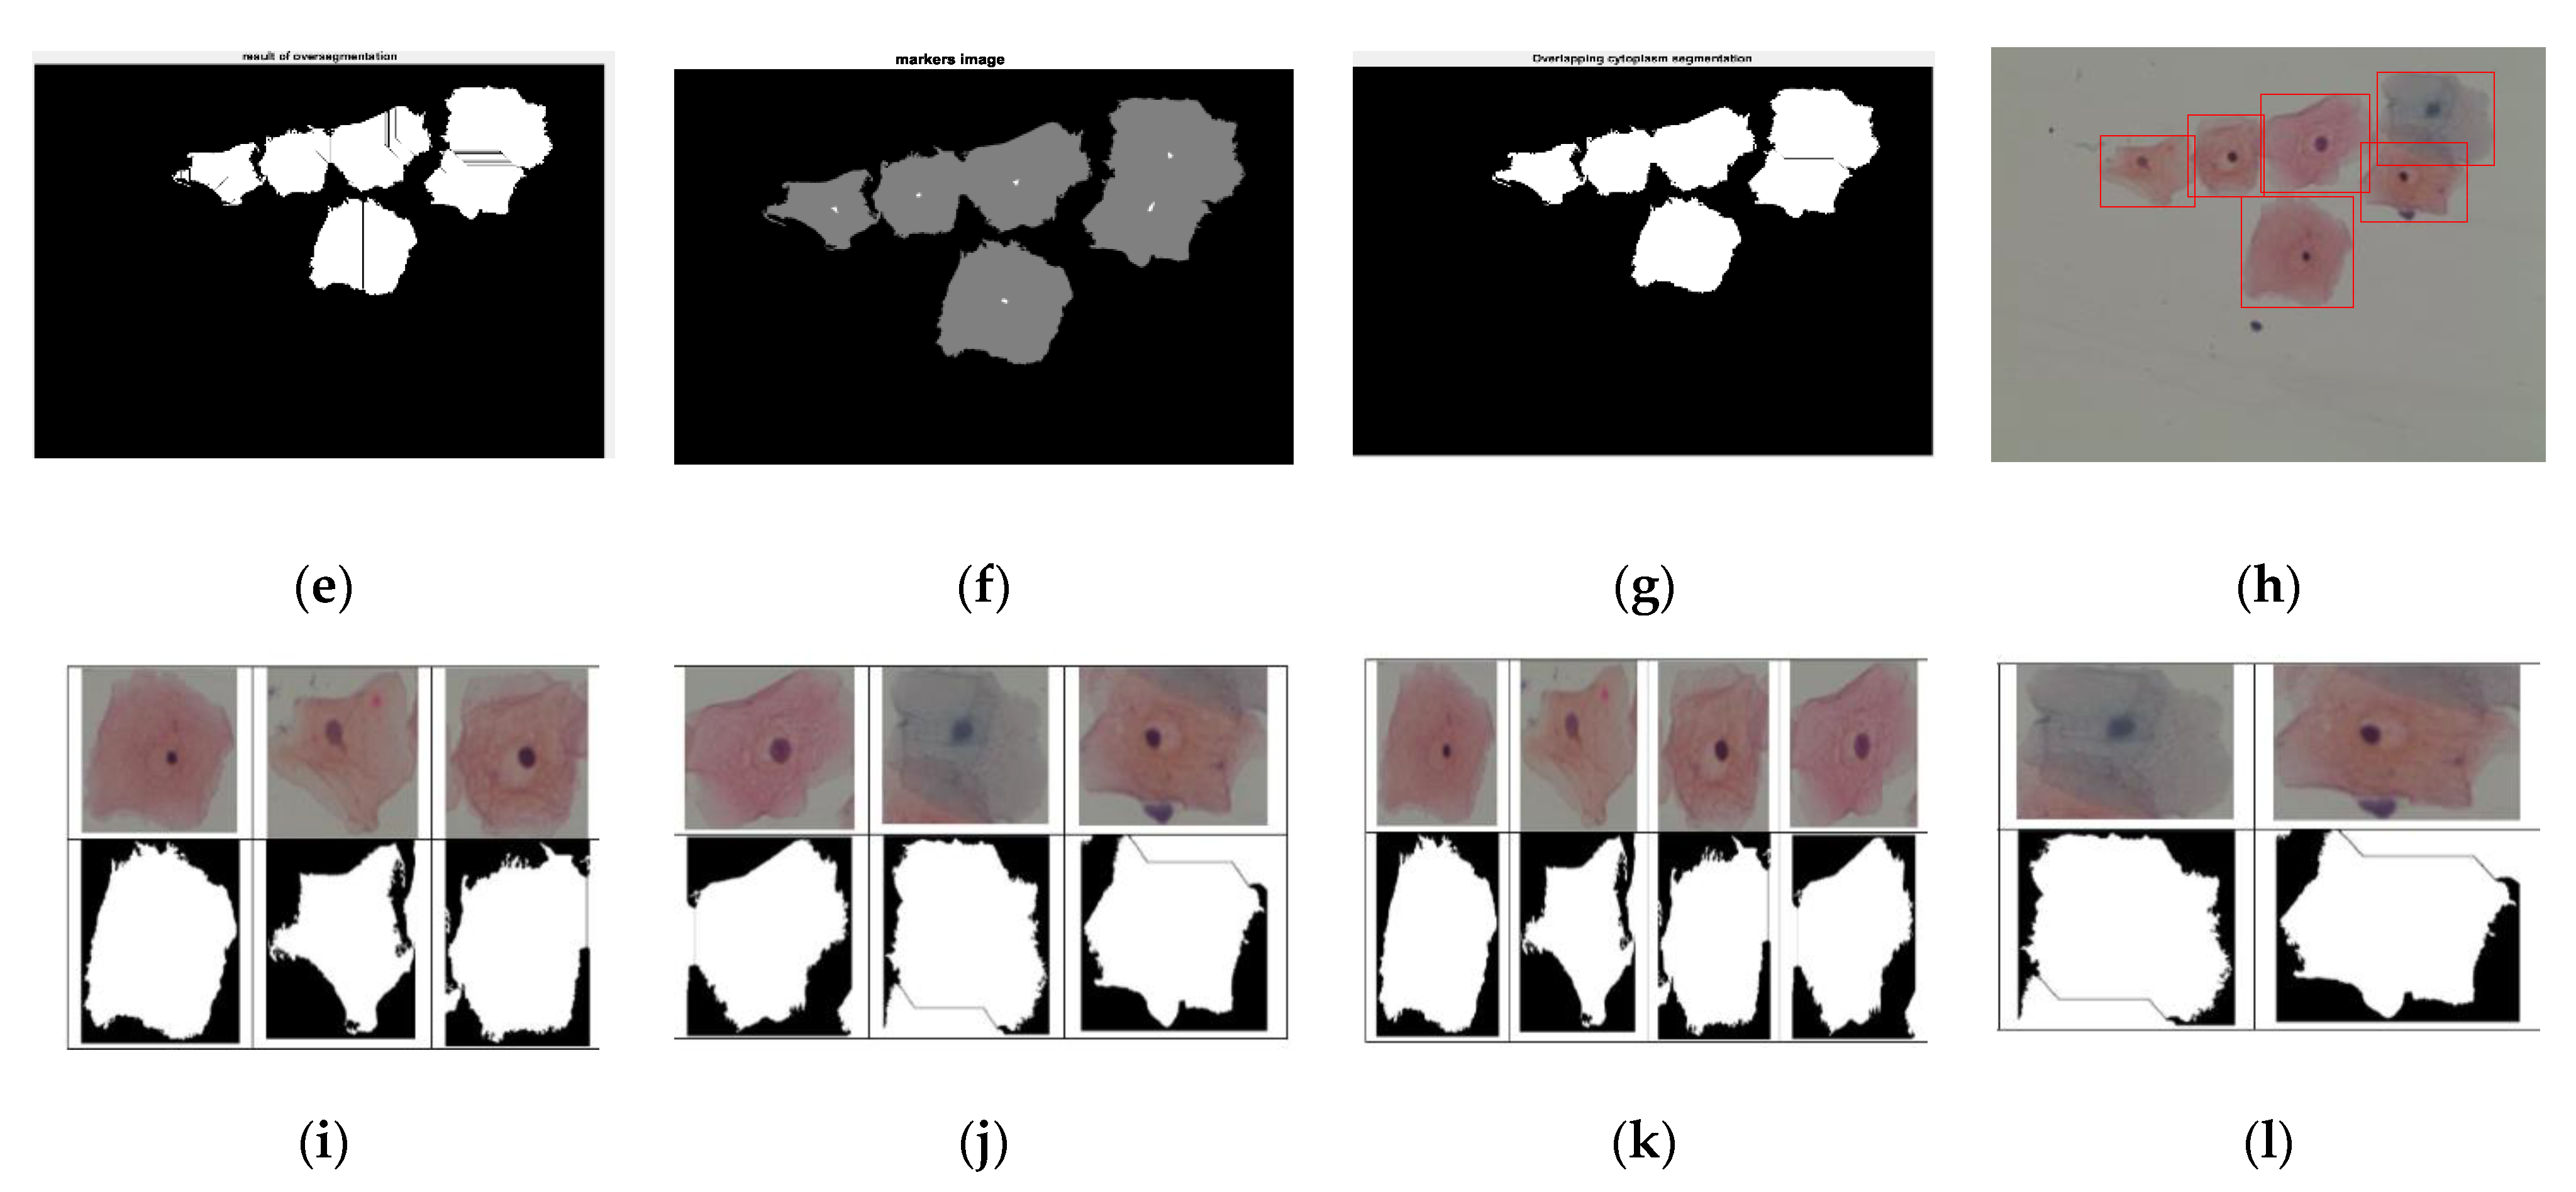
2.3. Cells Segmentation
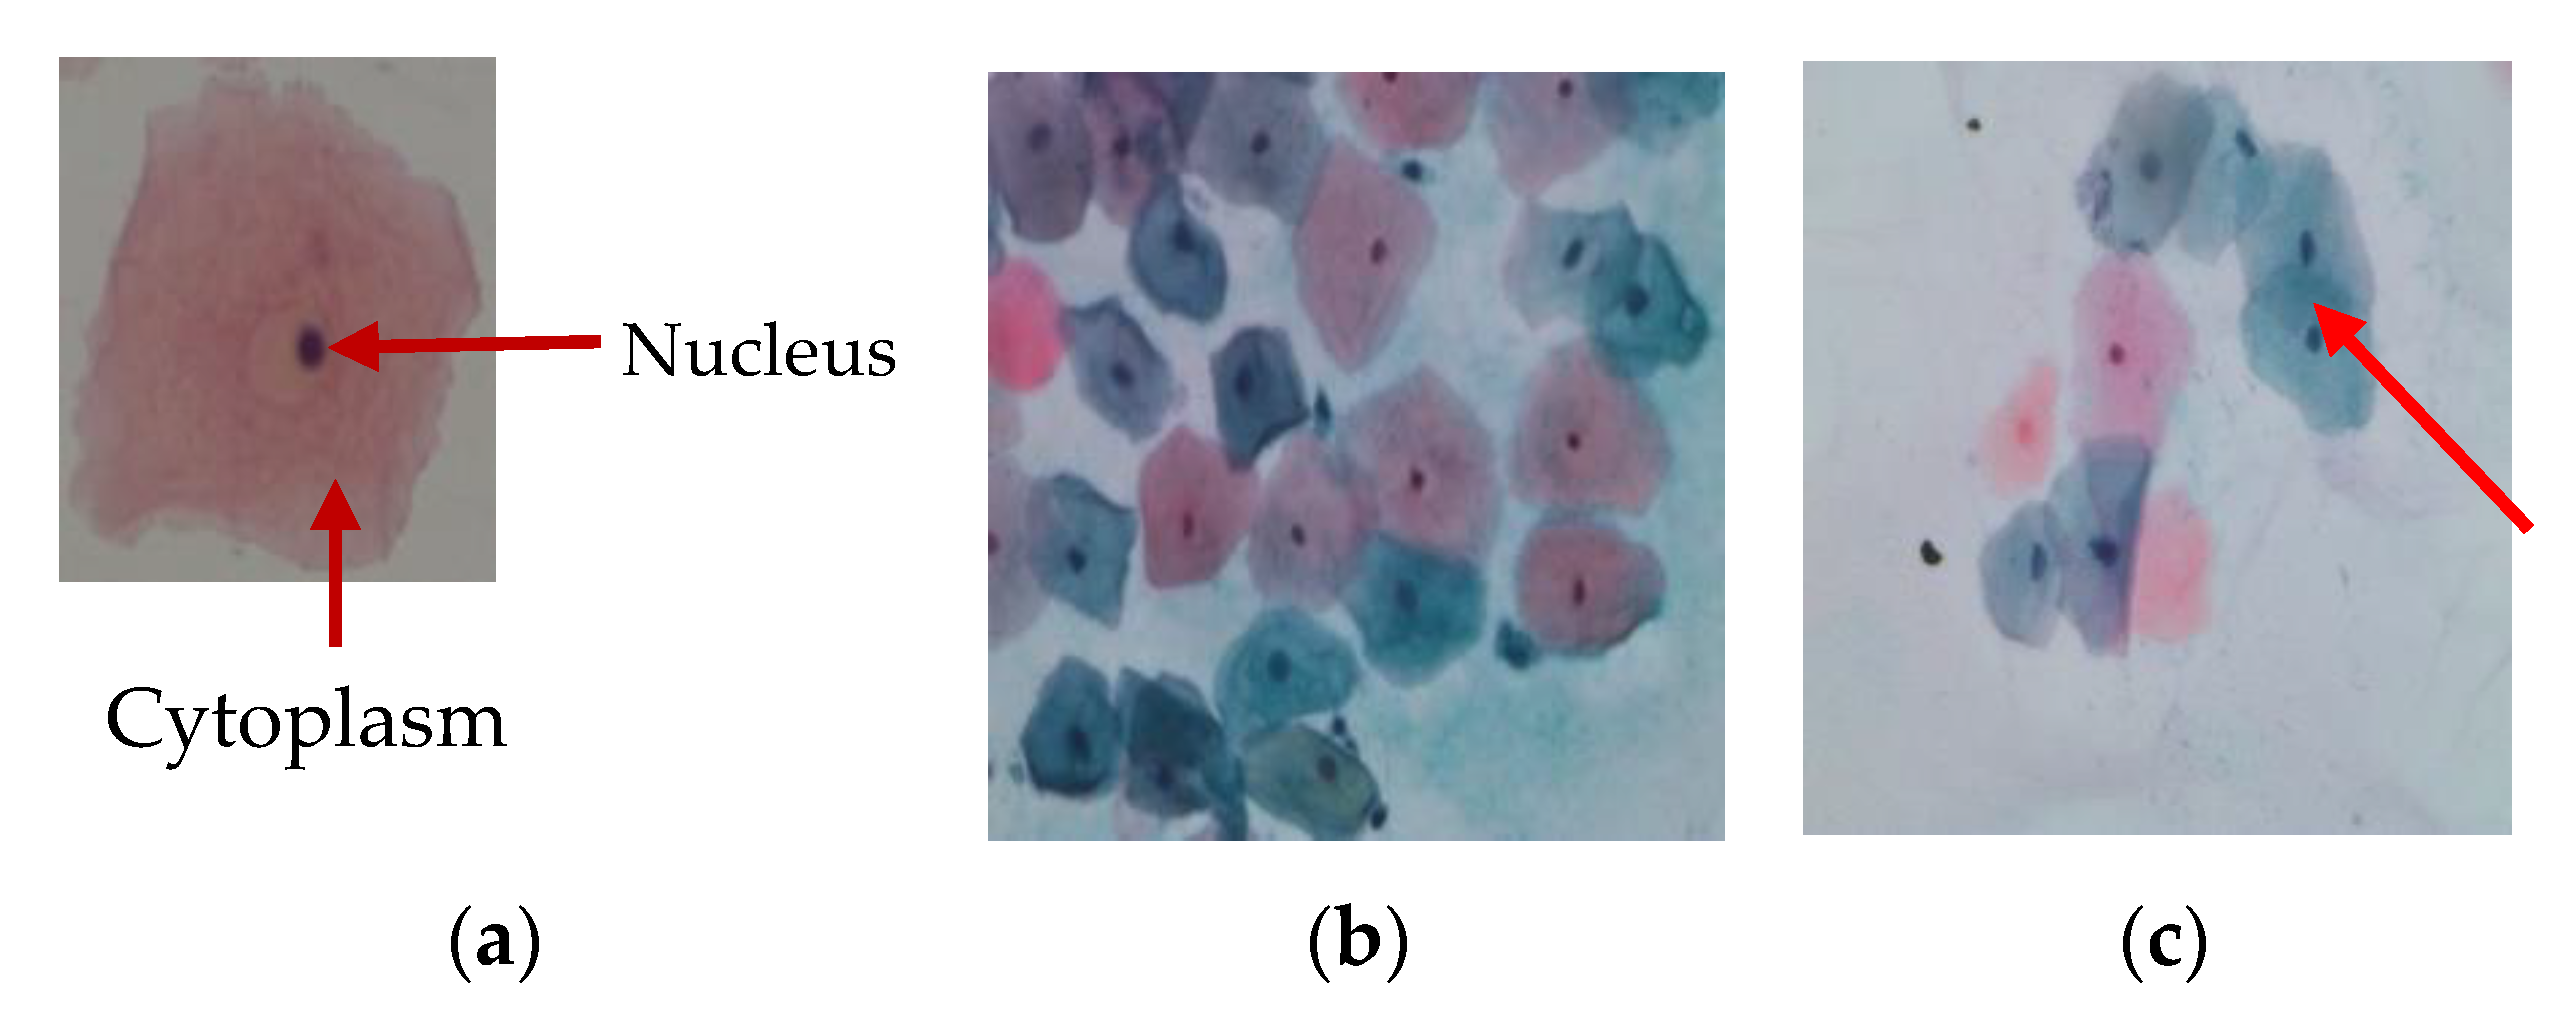
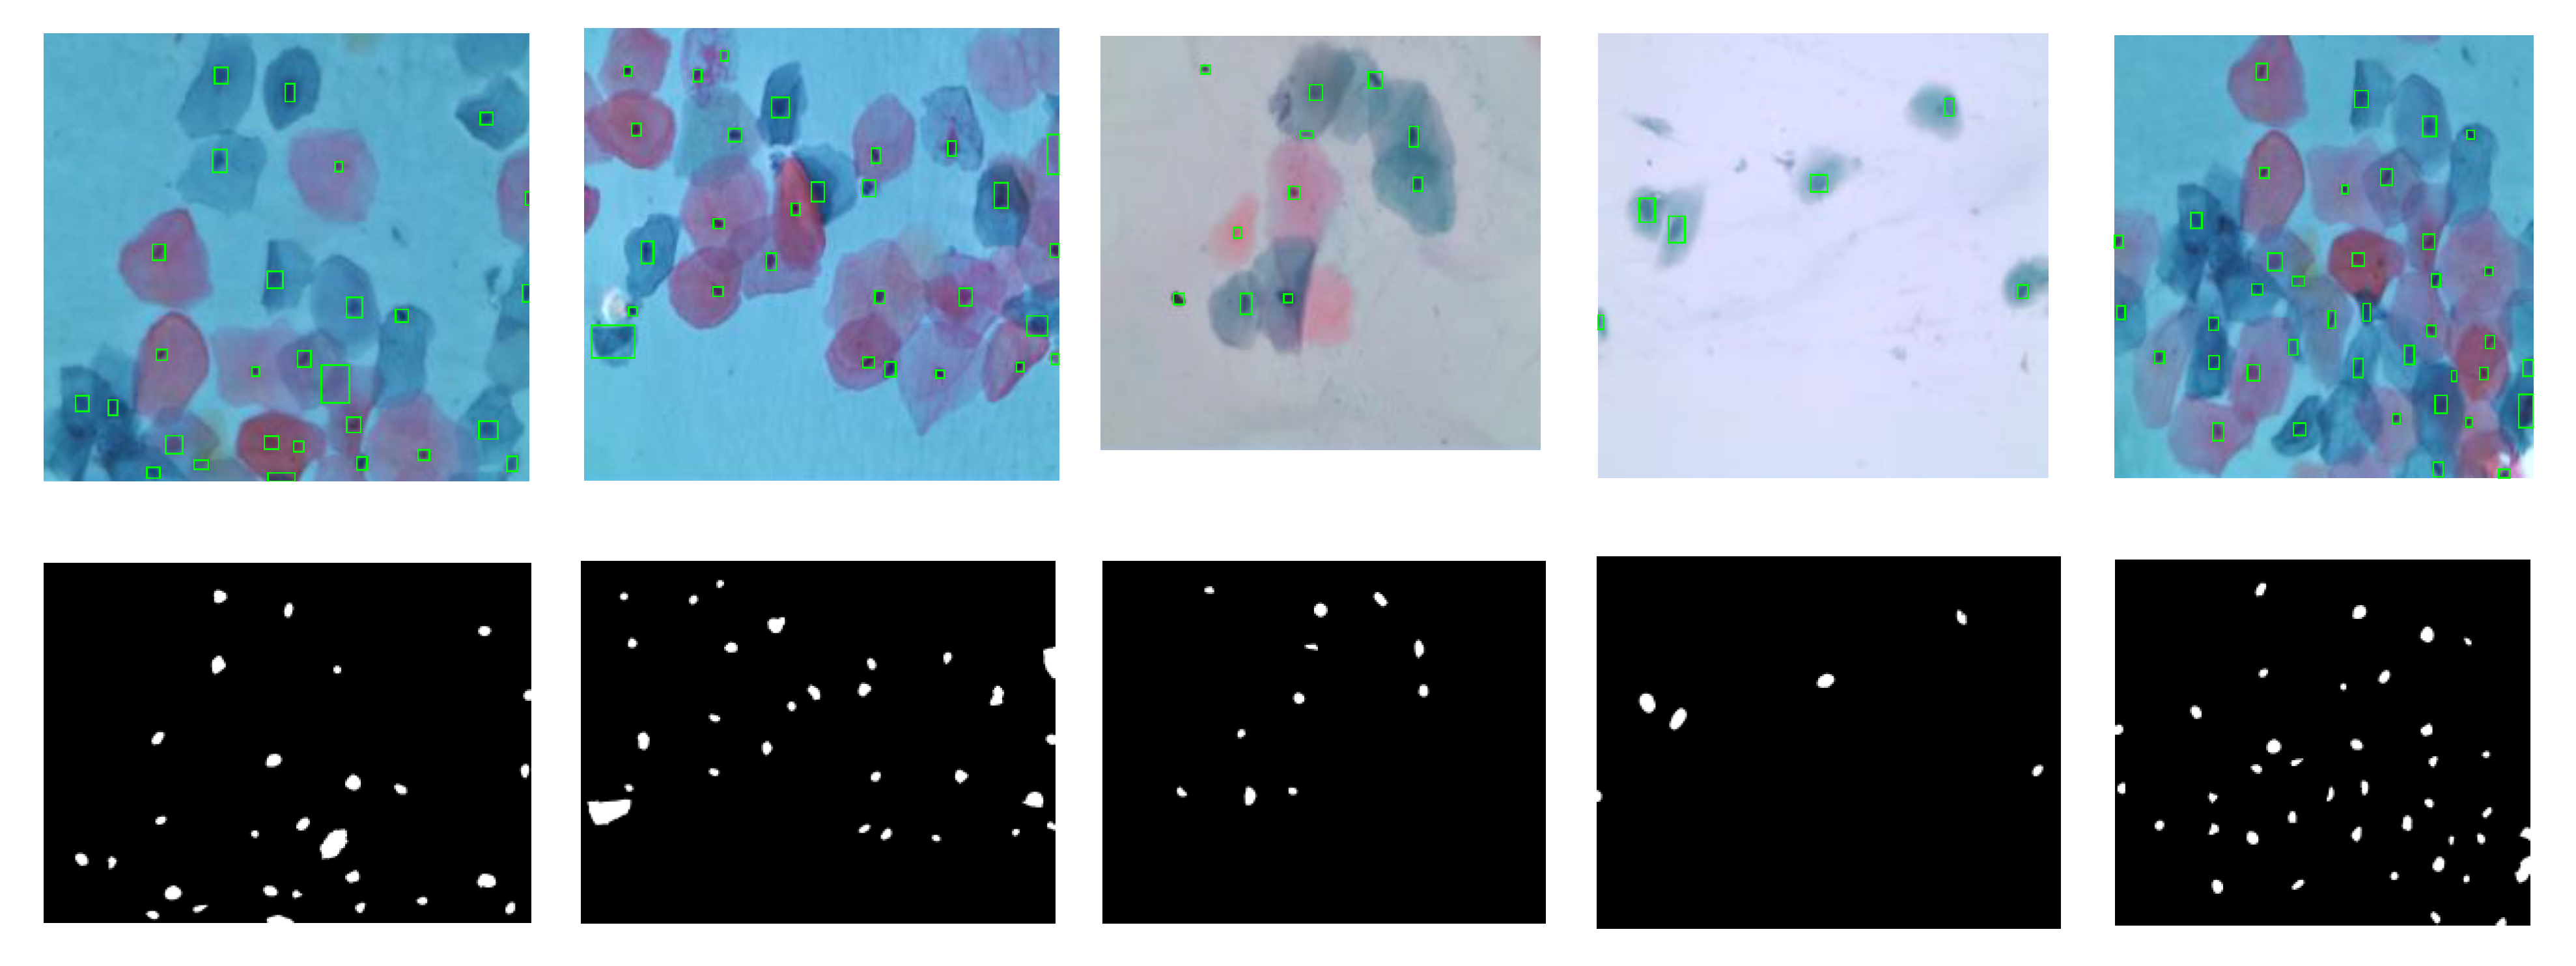
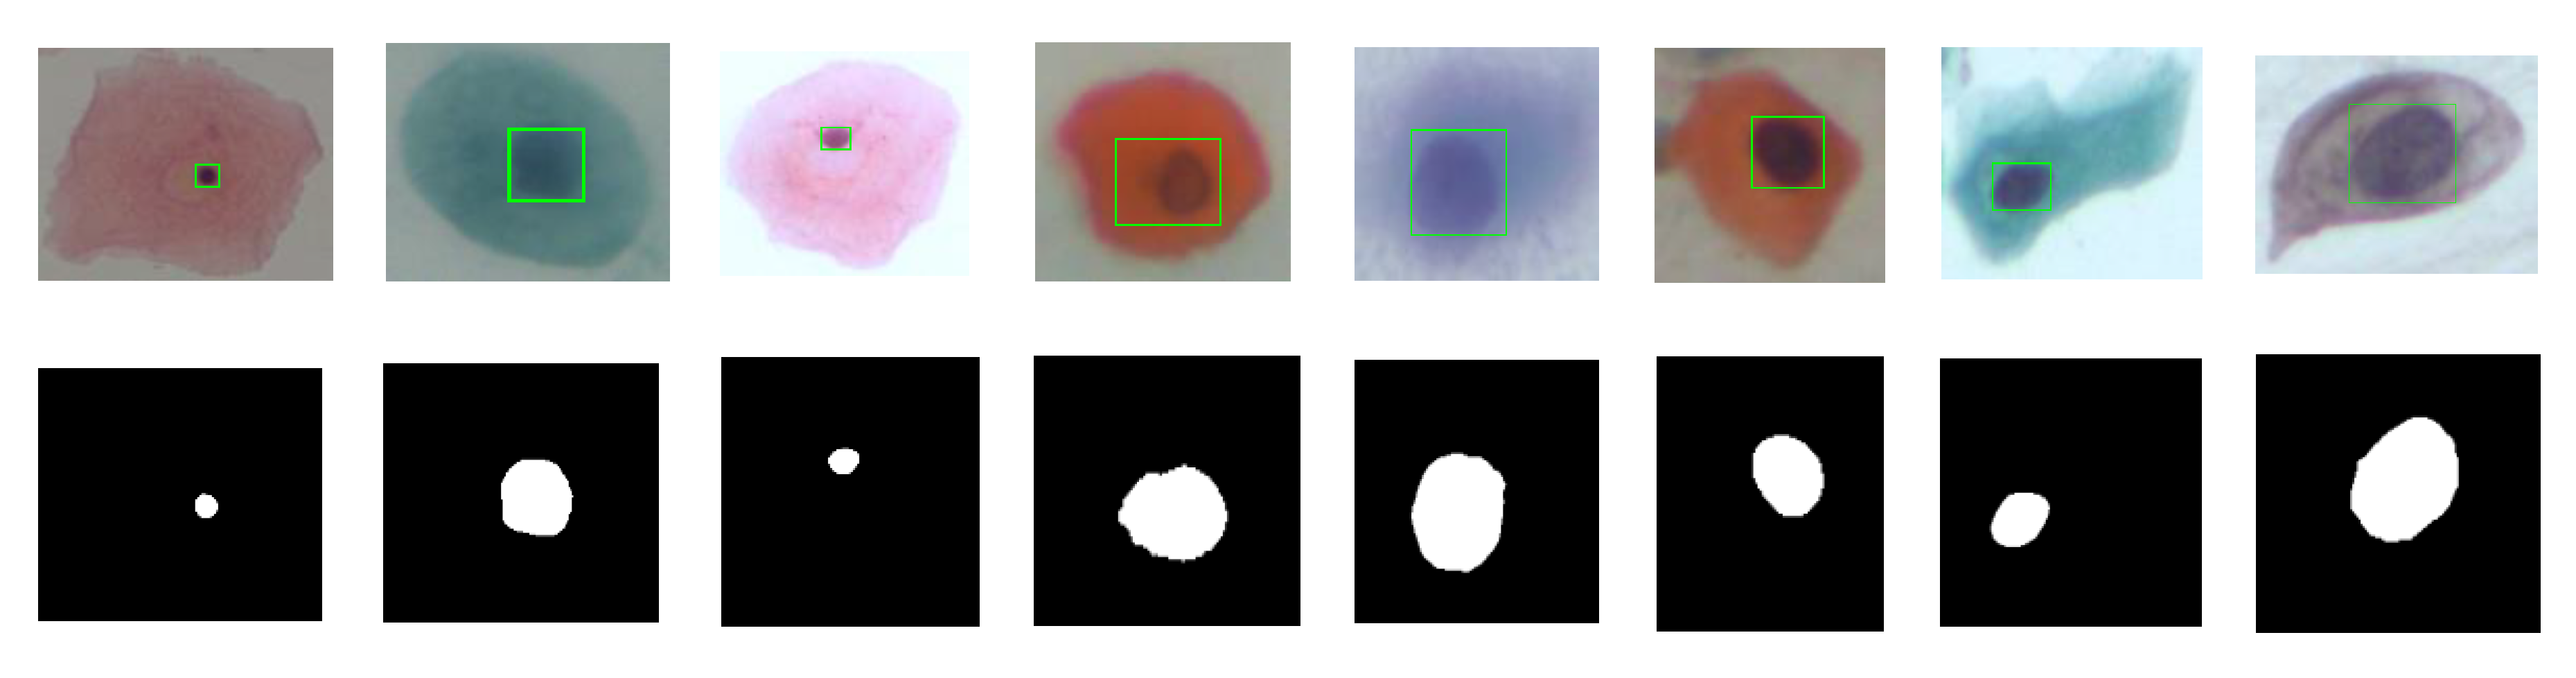
2.4. Nuclei and Cytoplasm Segmentation
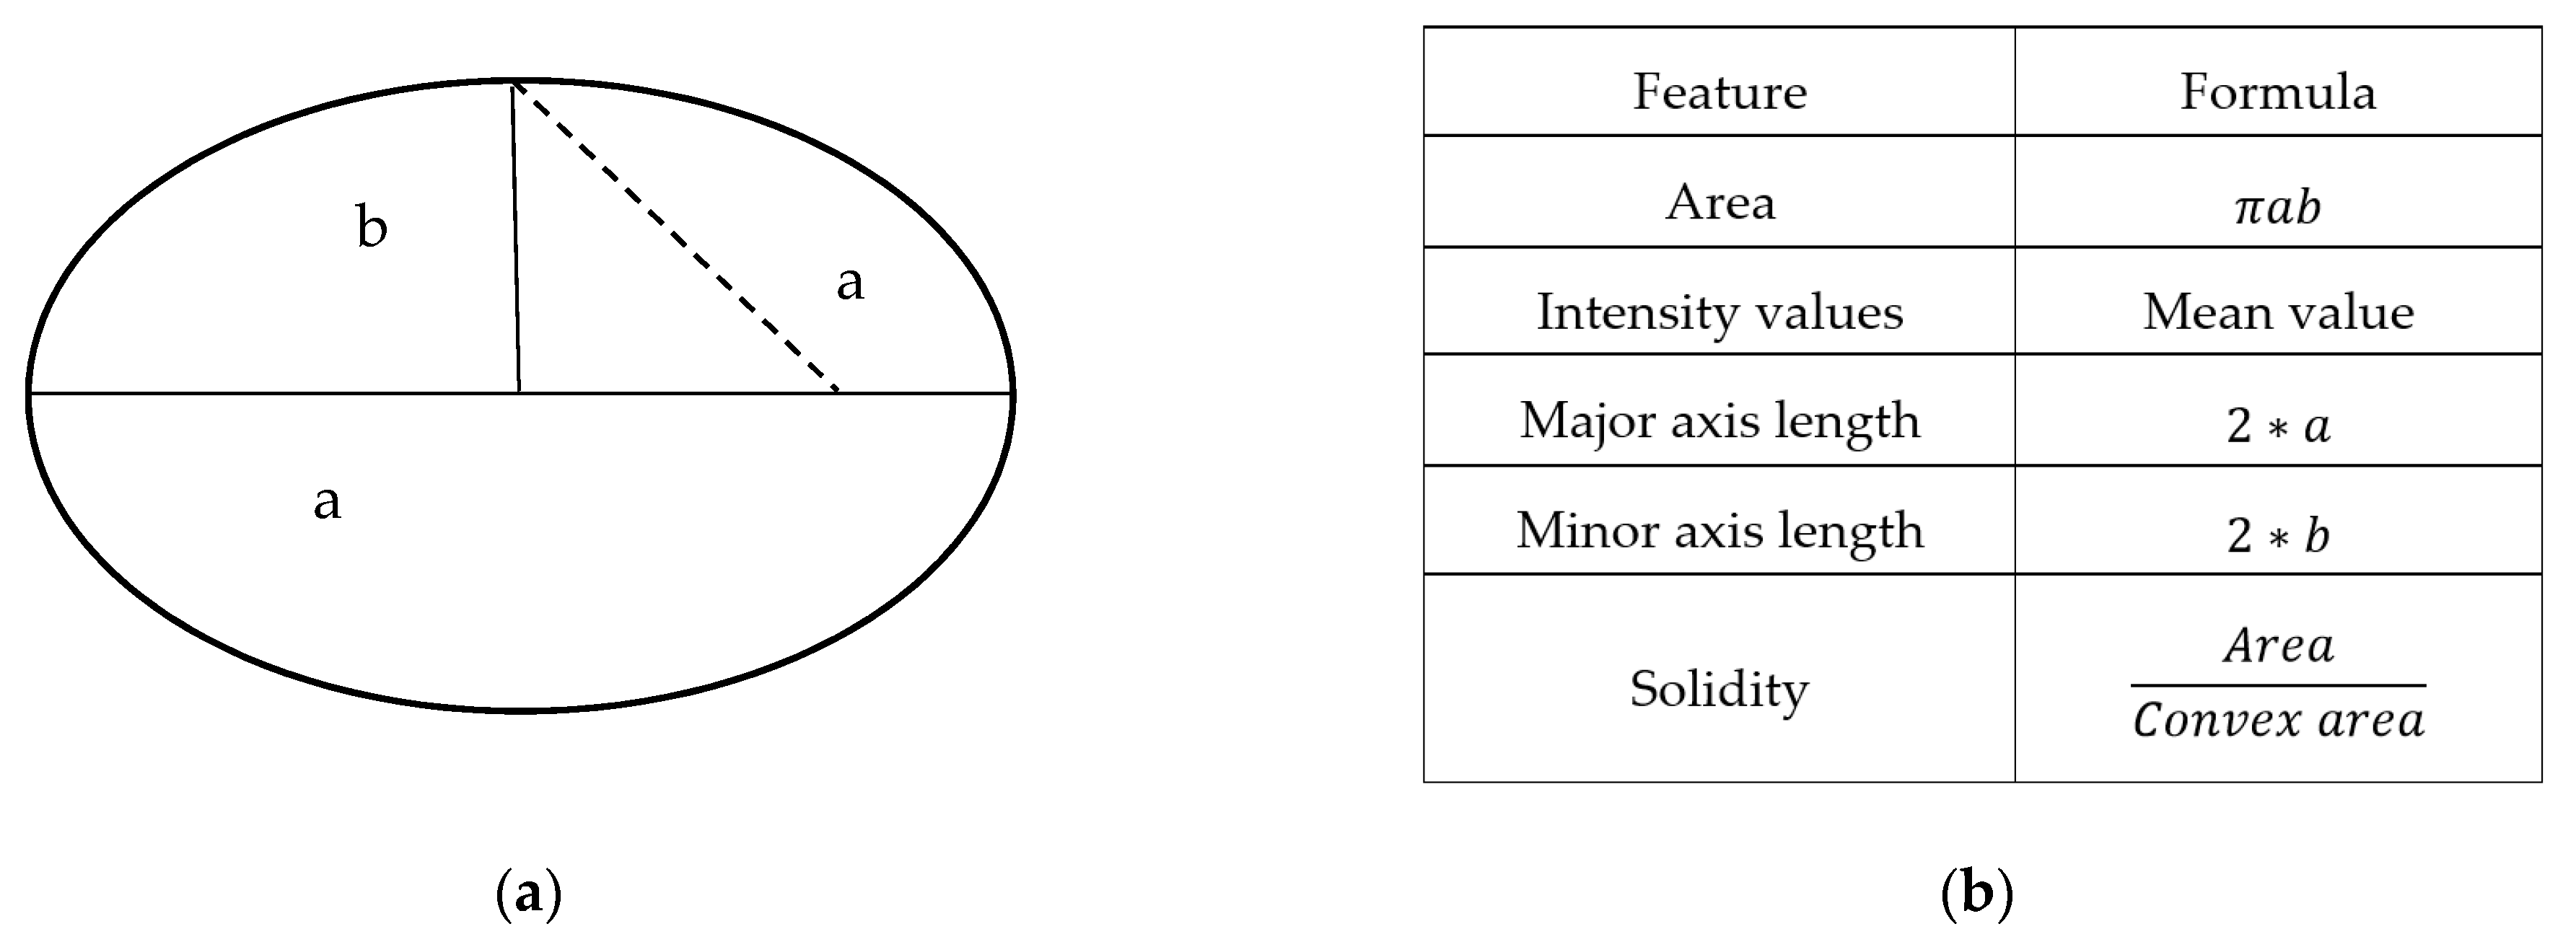
2.5. Features Extraction
2.6. Features Selection
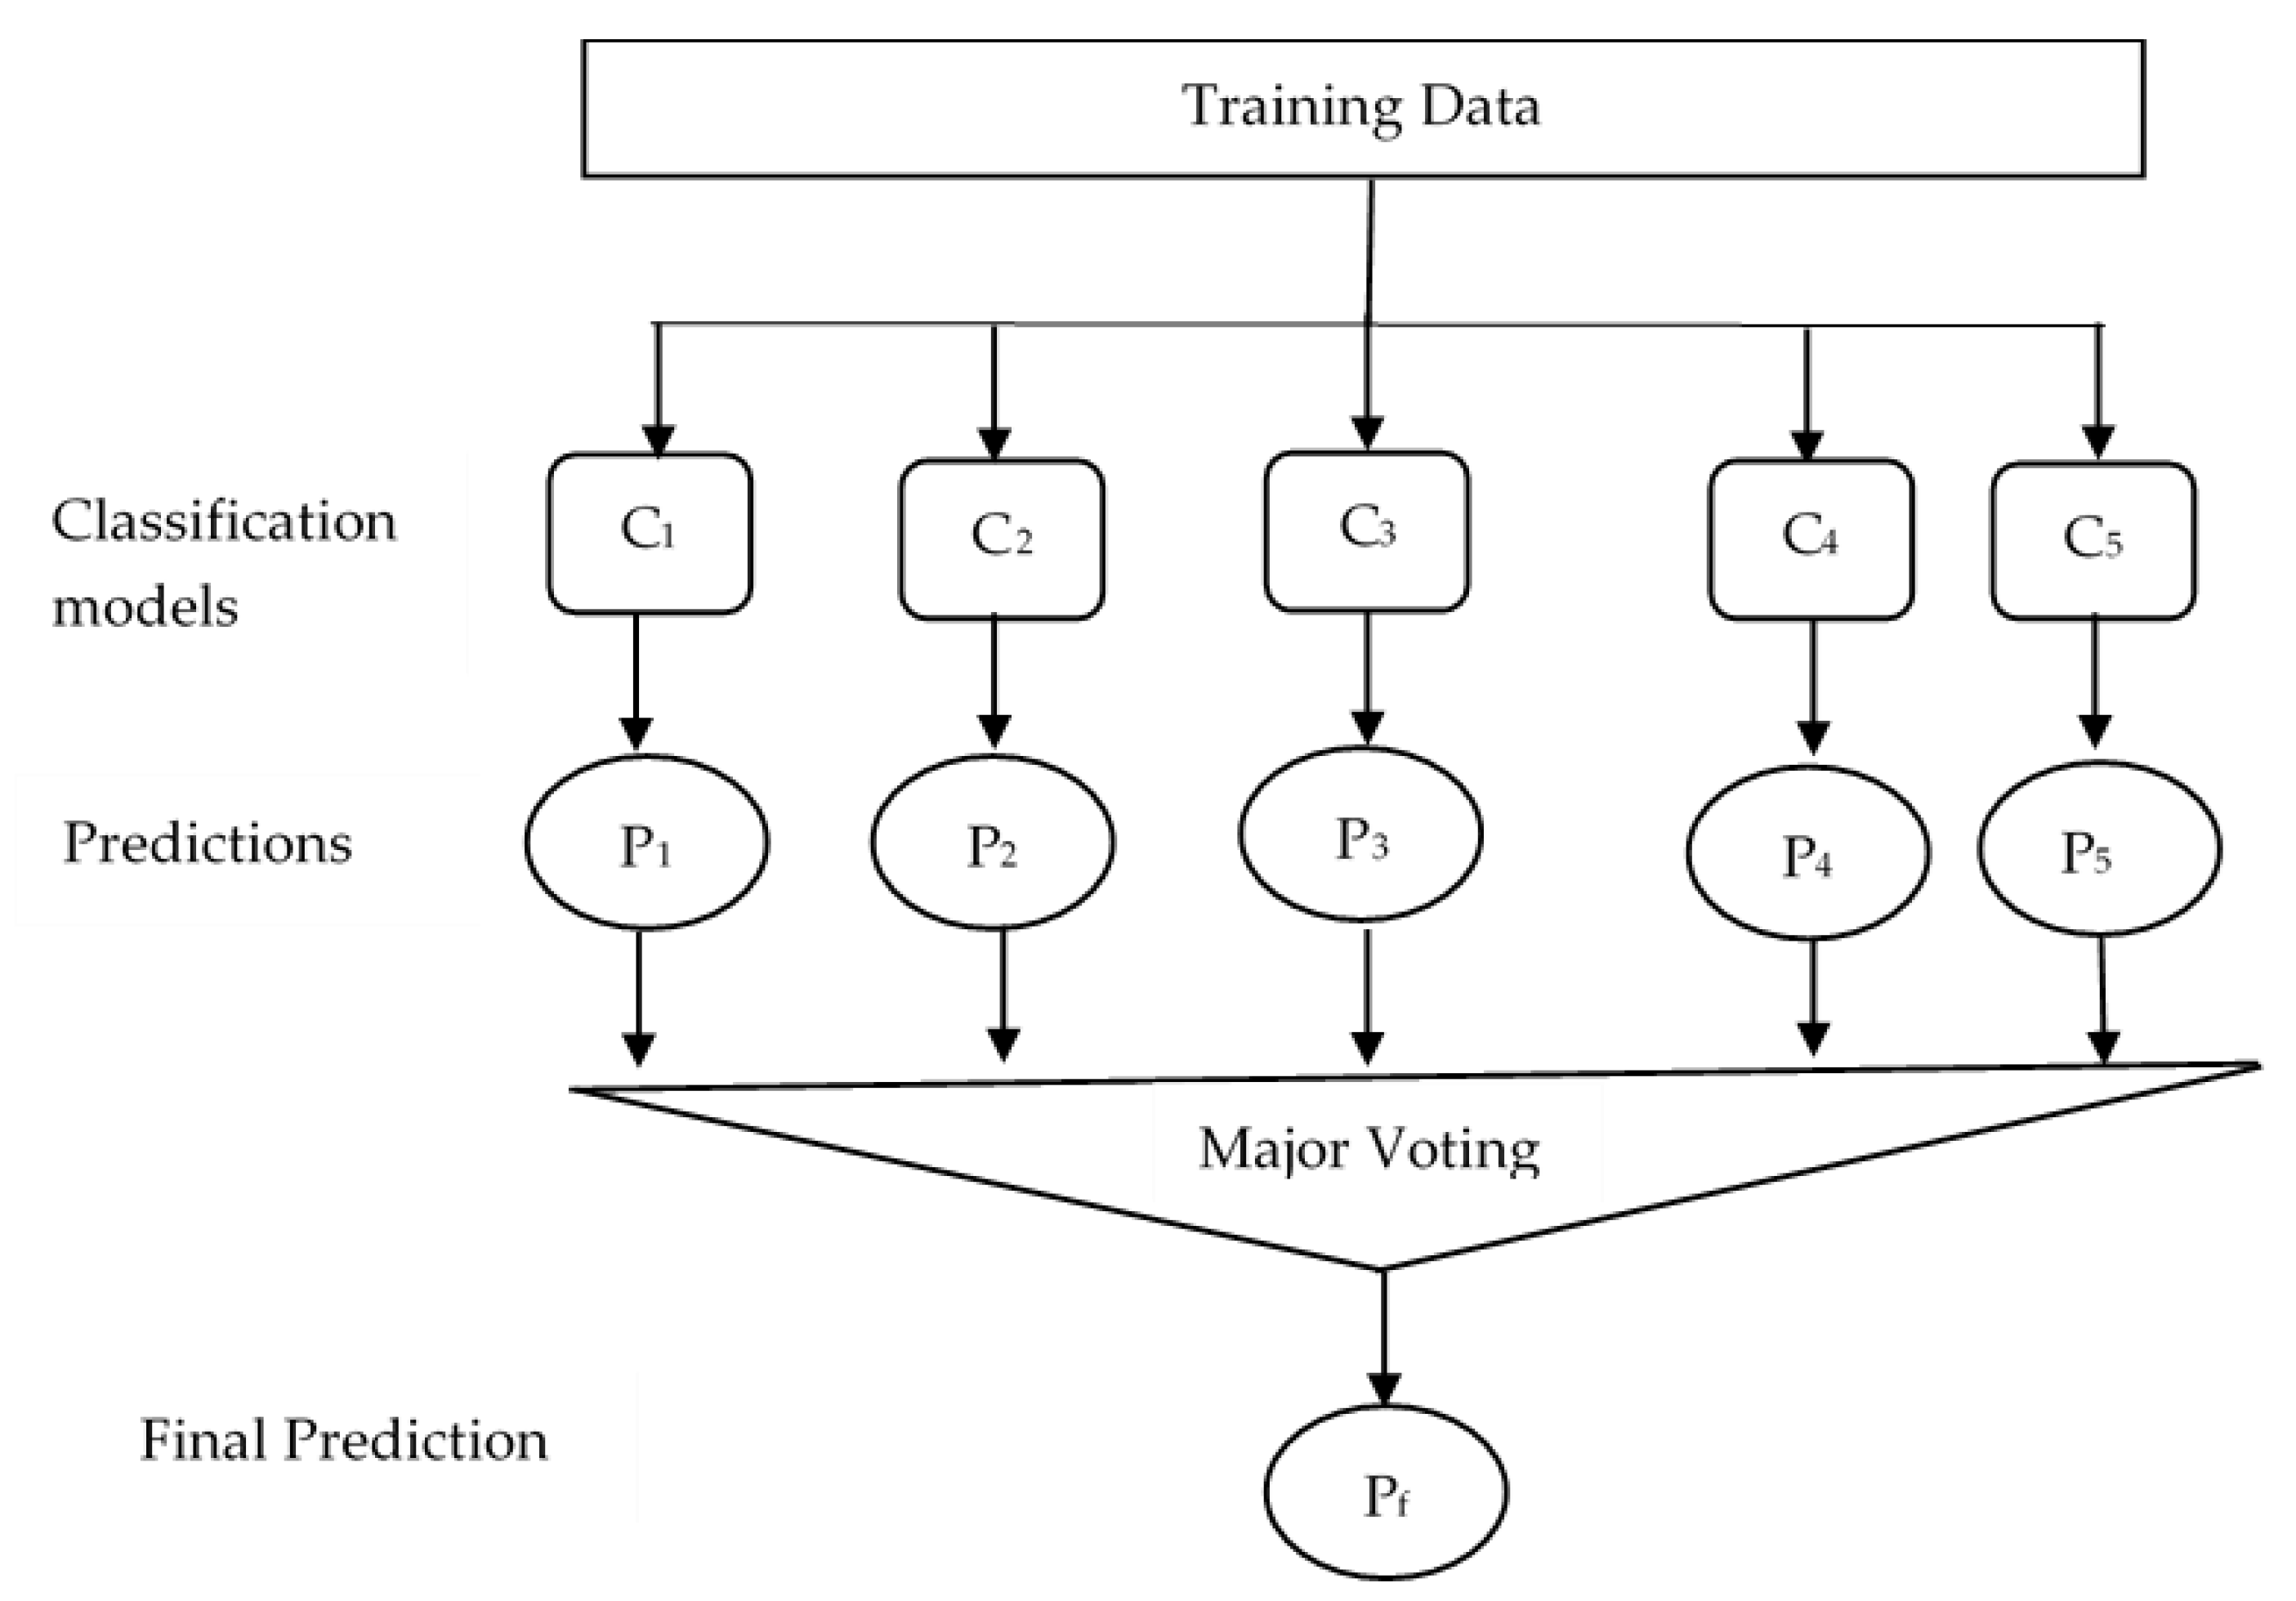
2.7. Classification
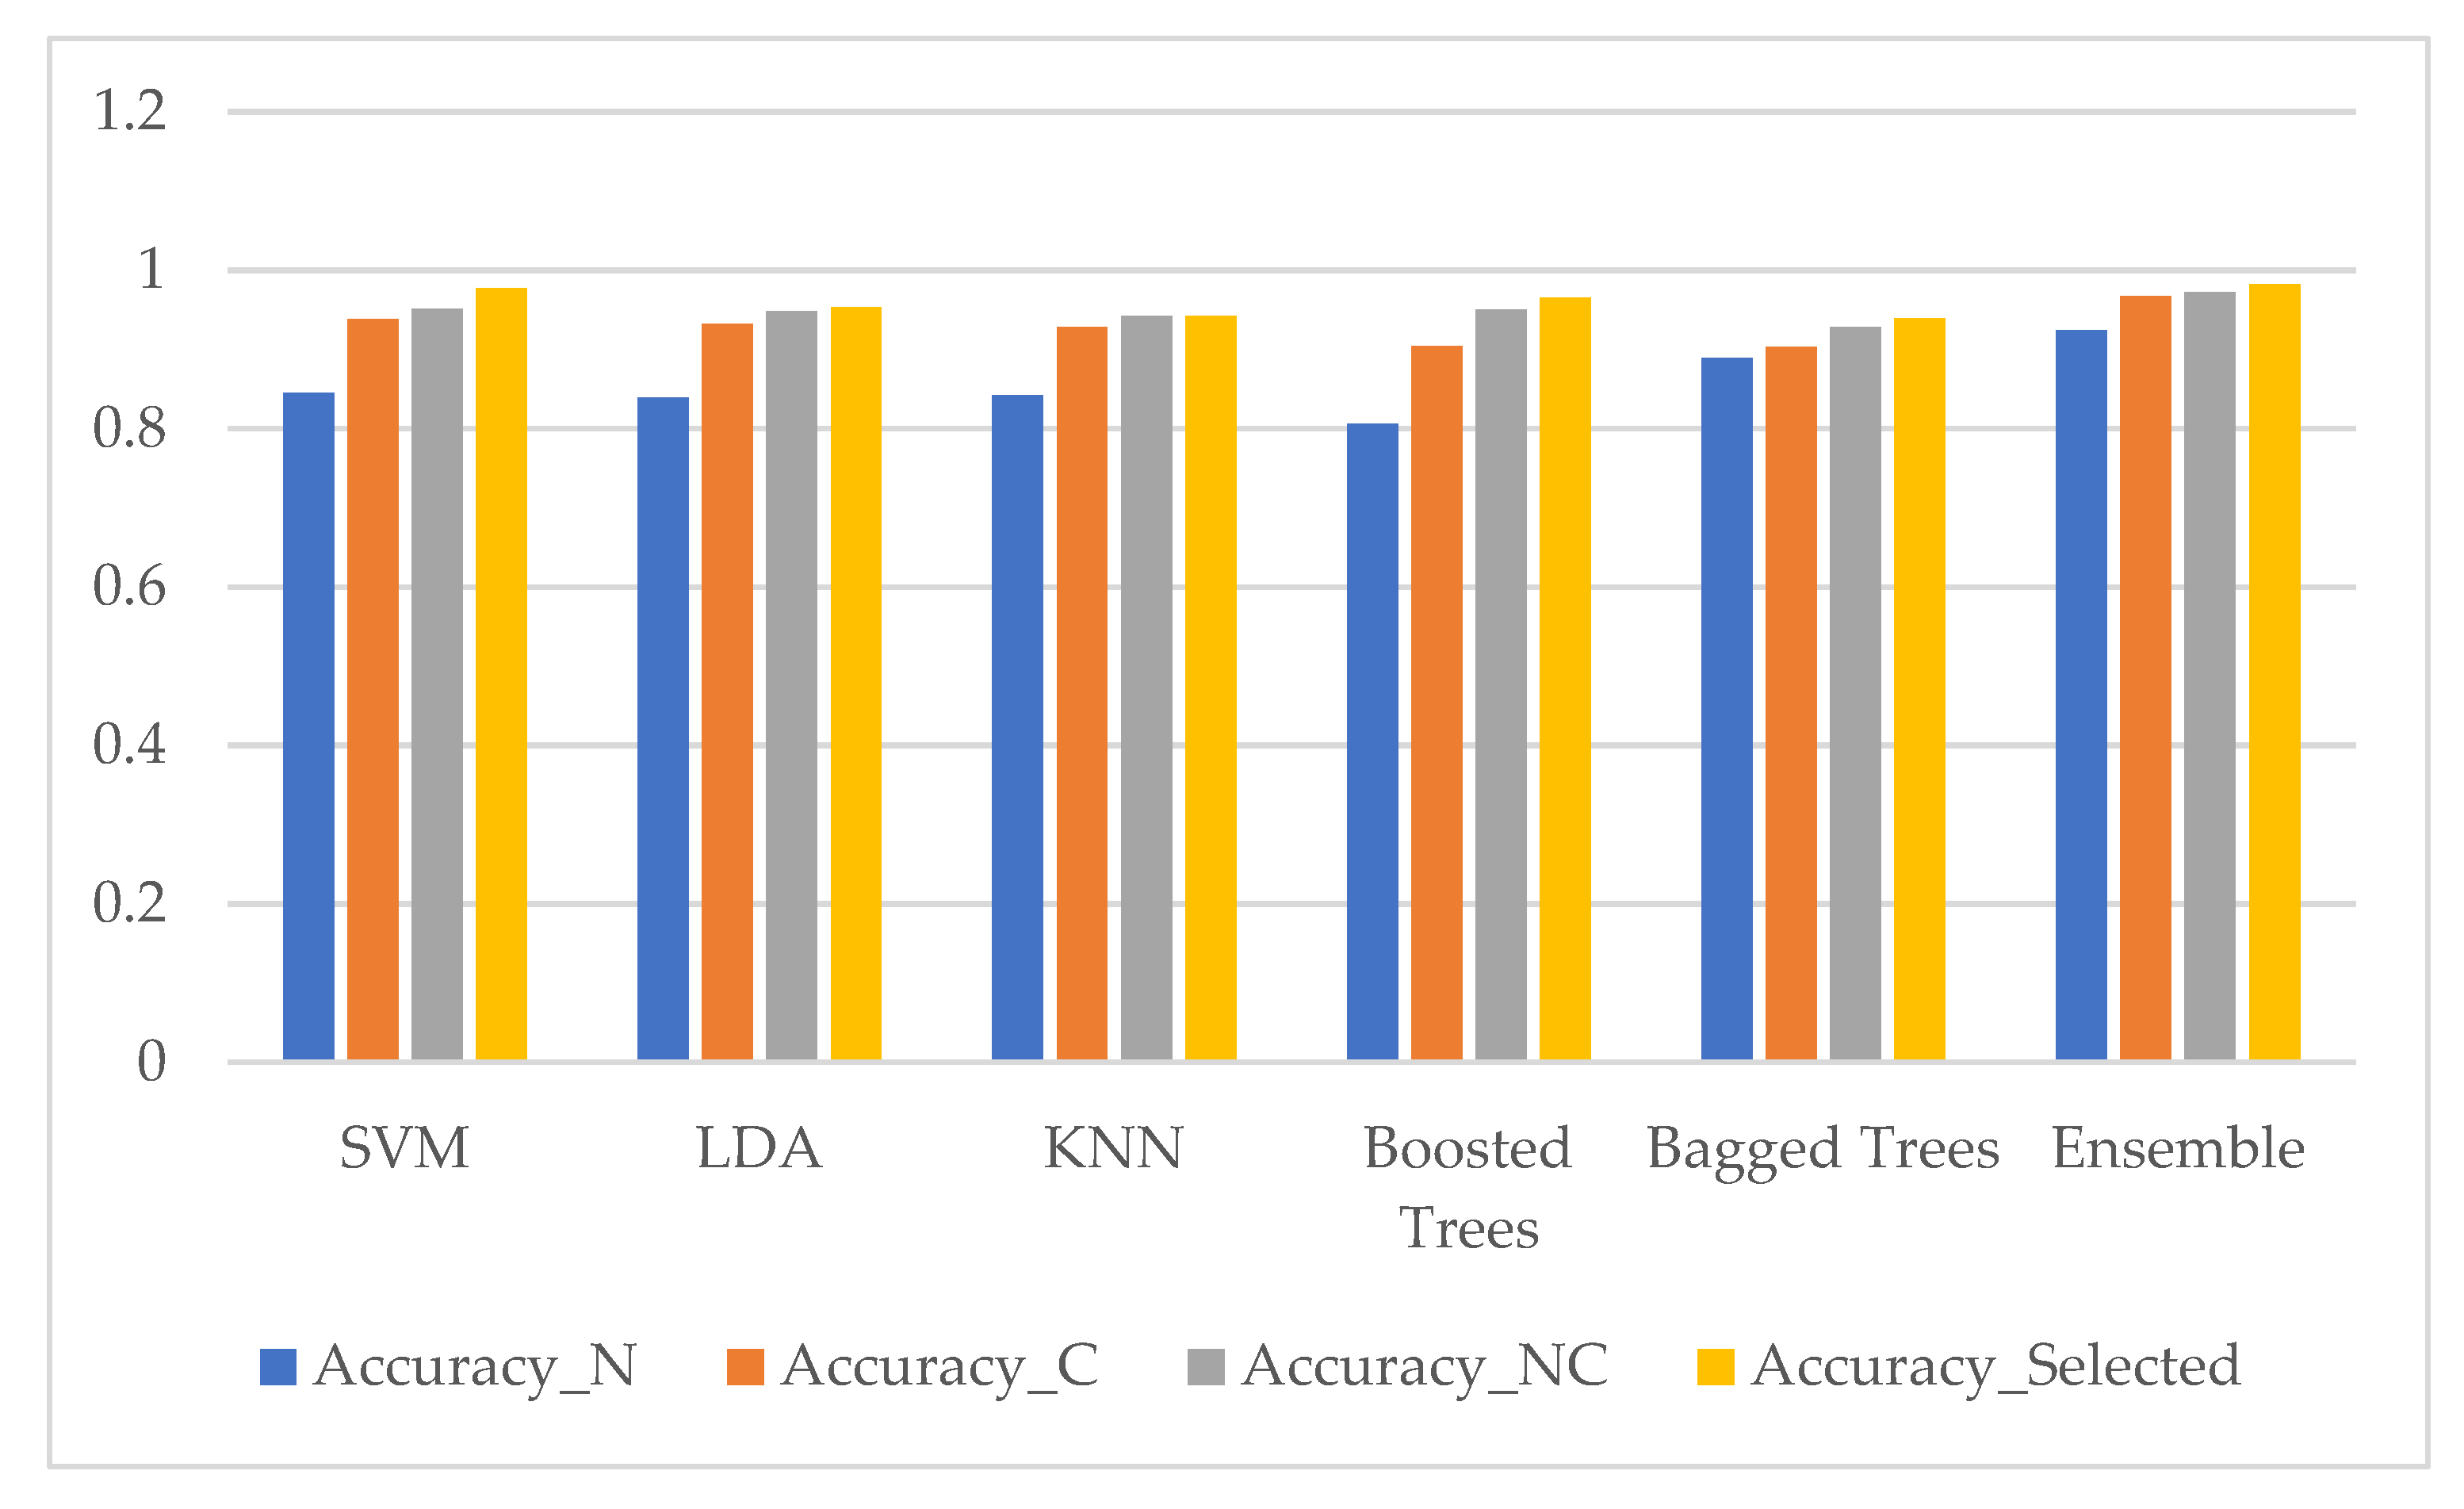
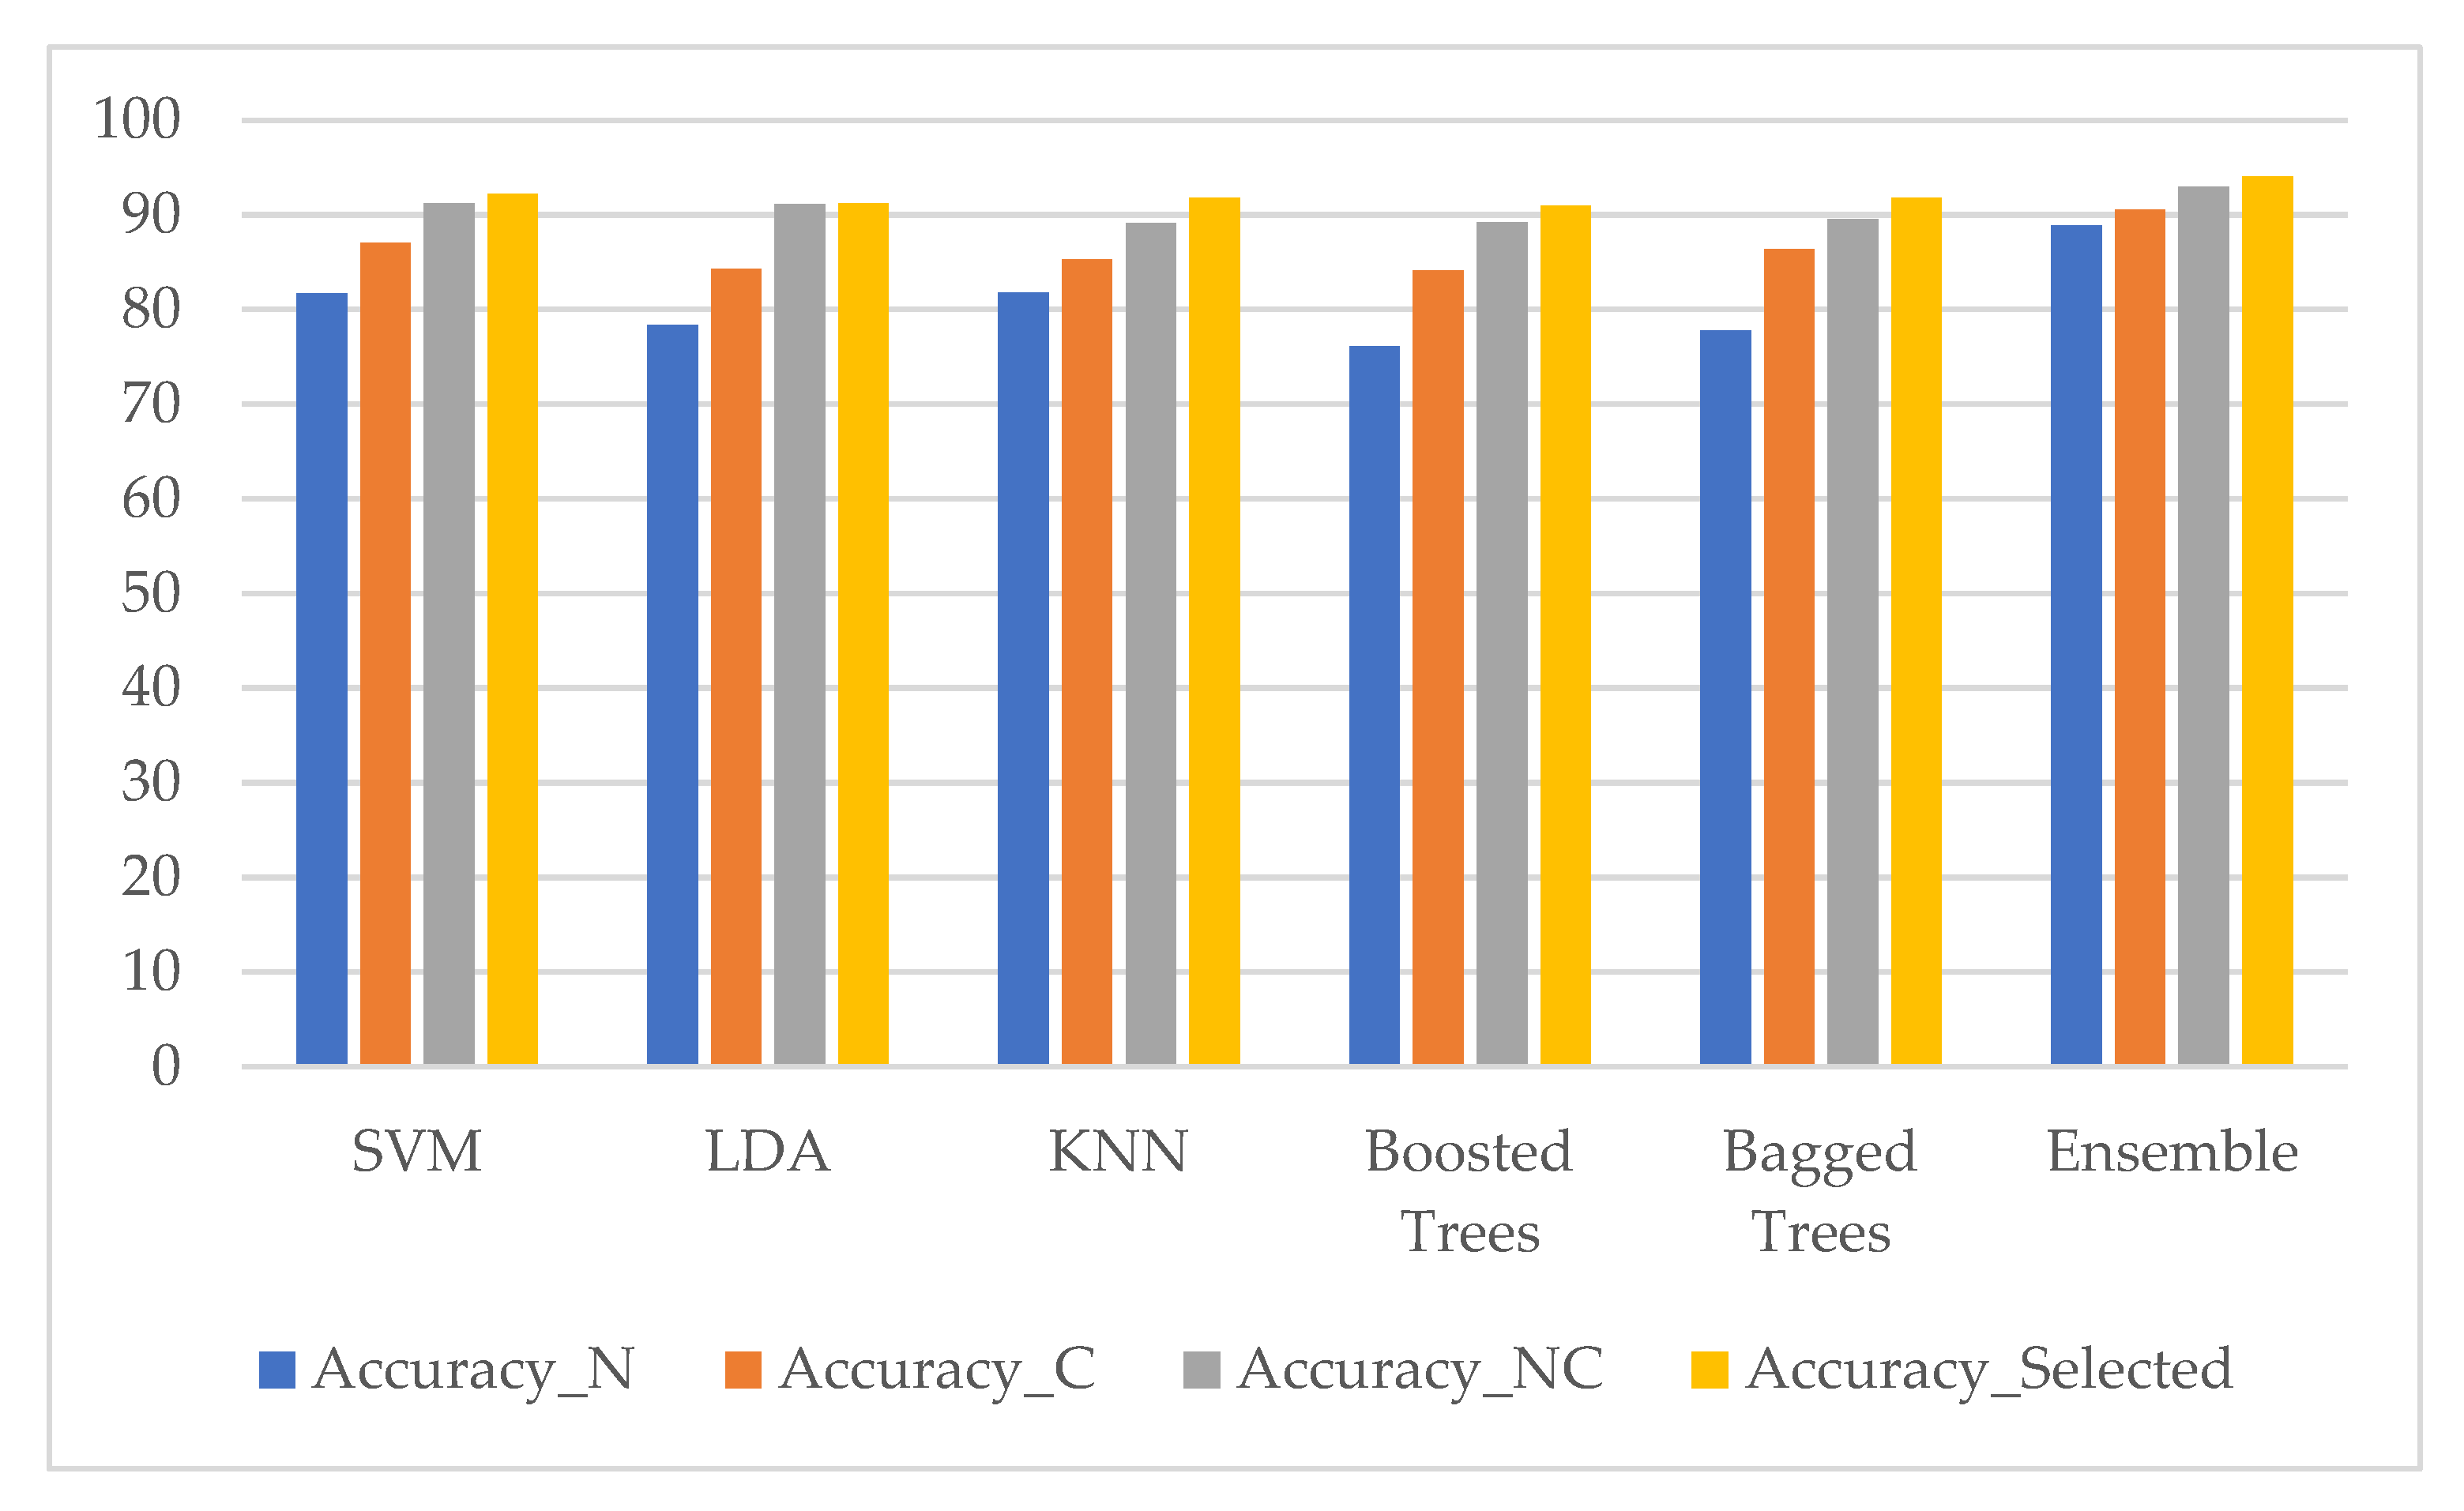
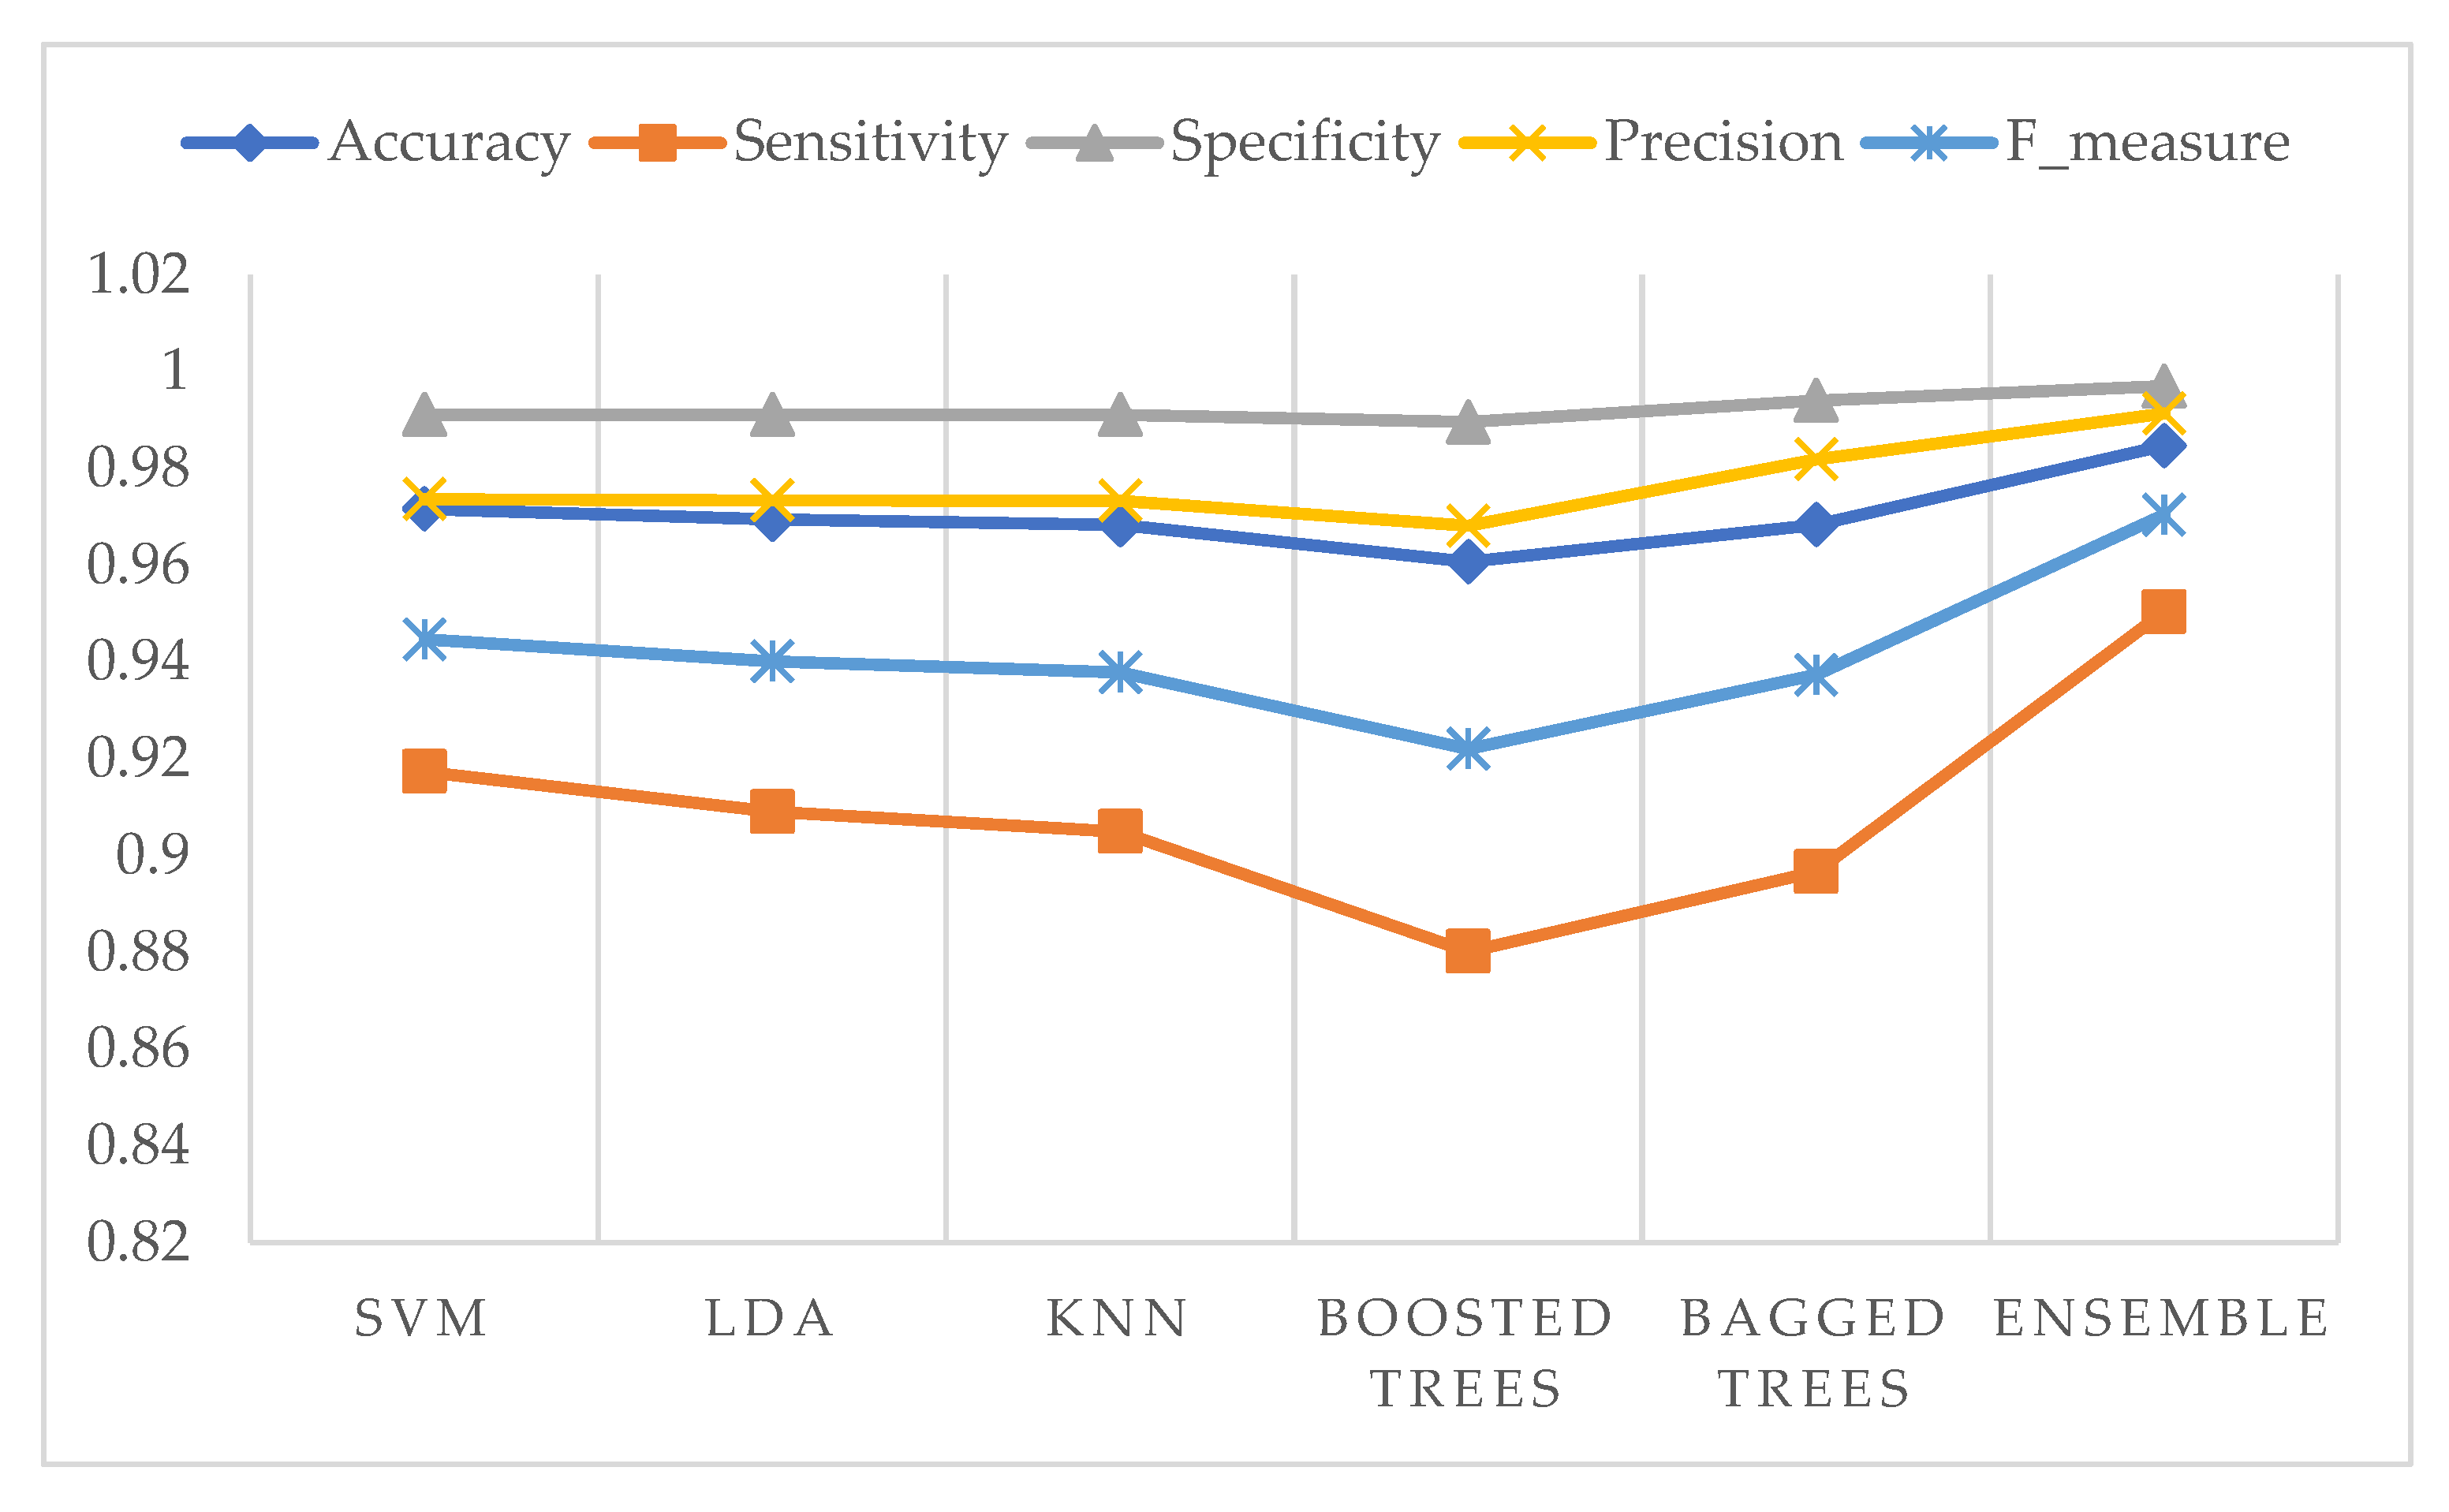
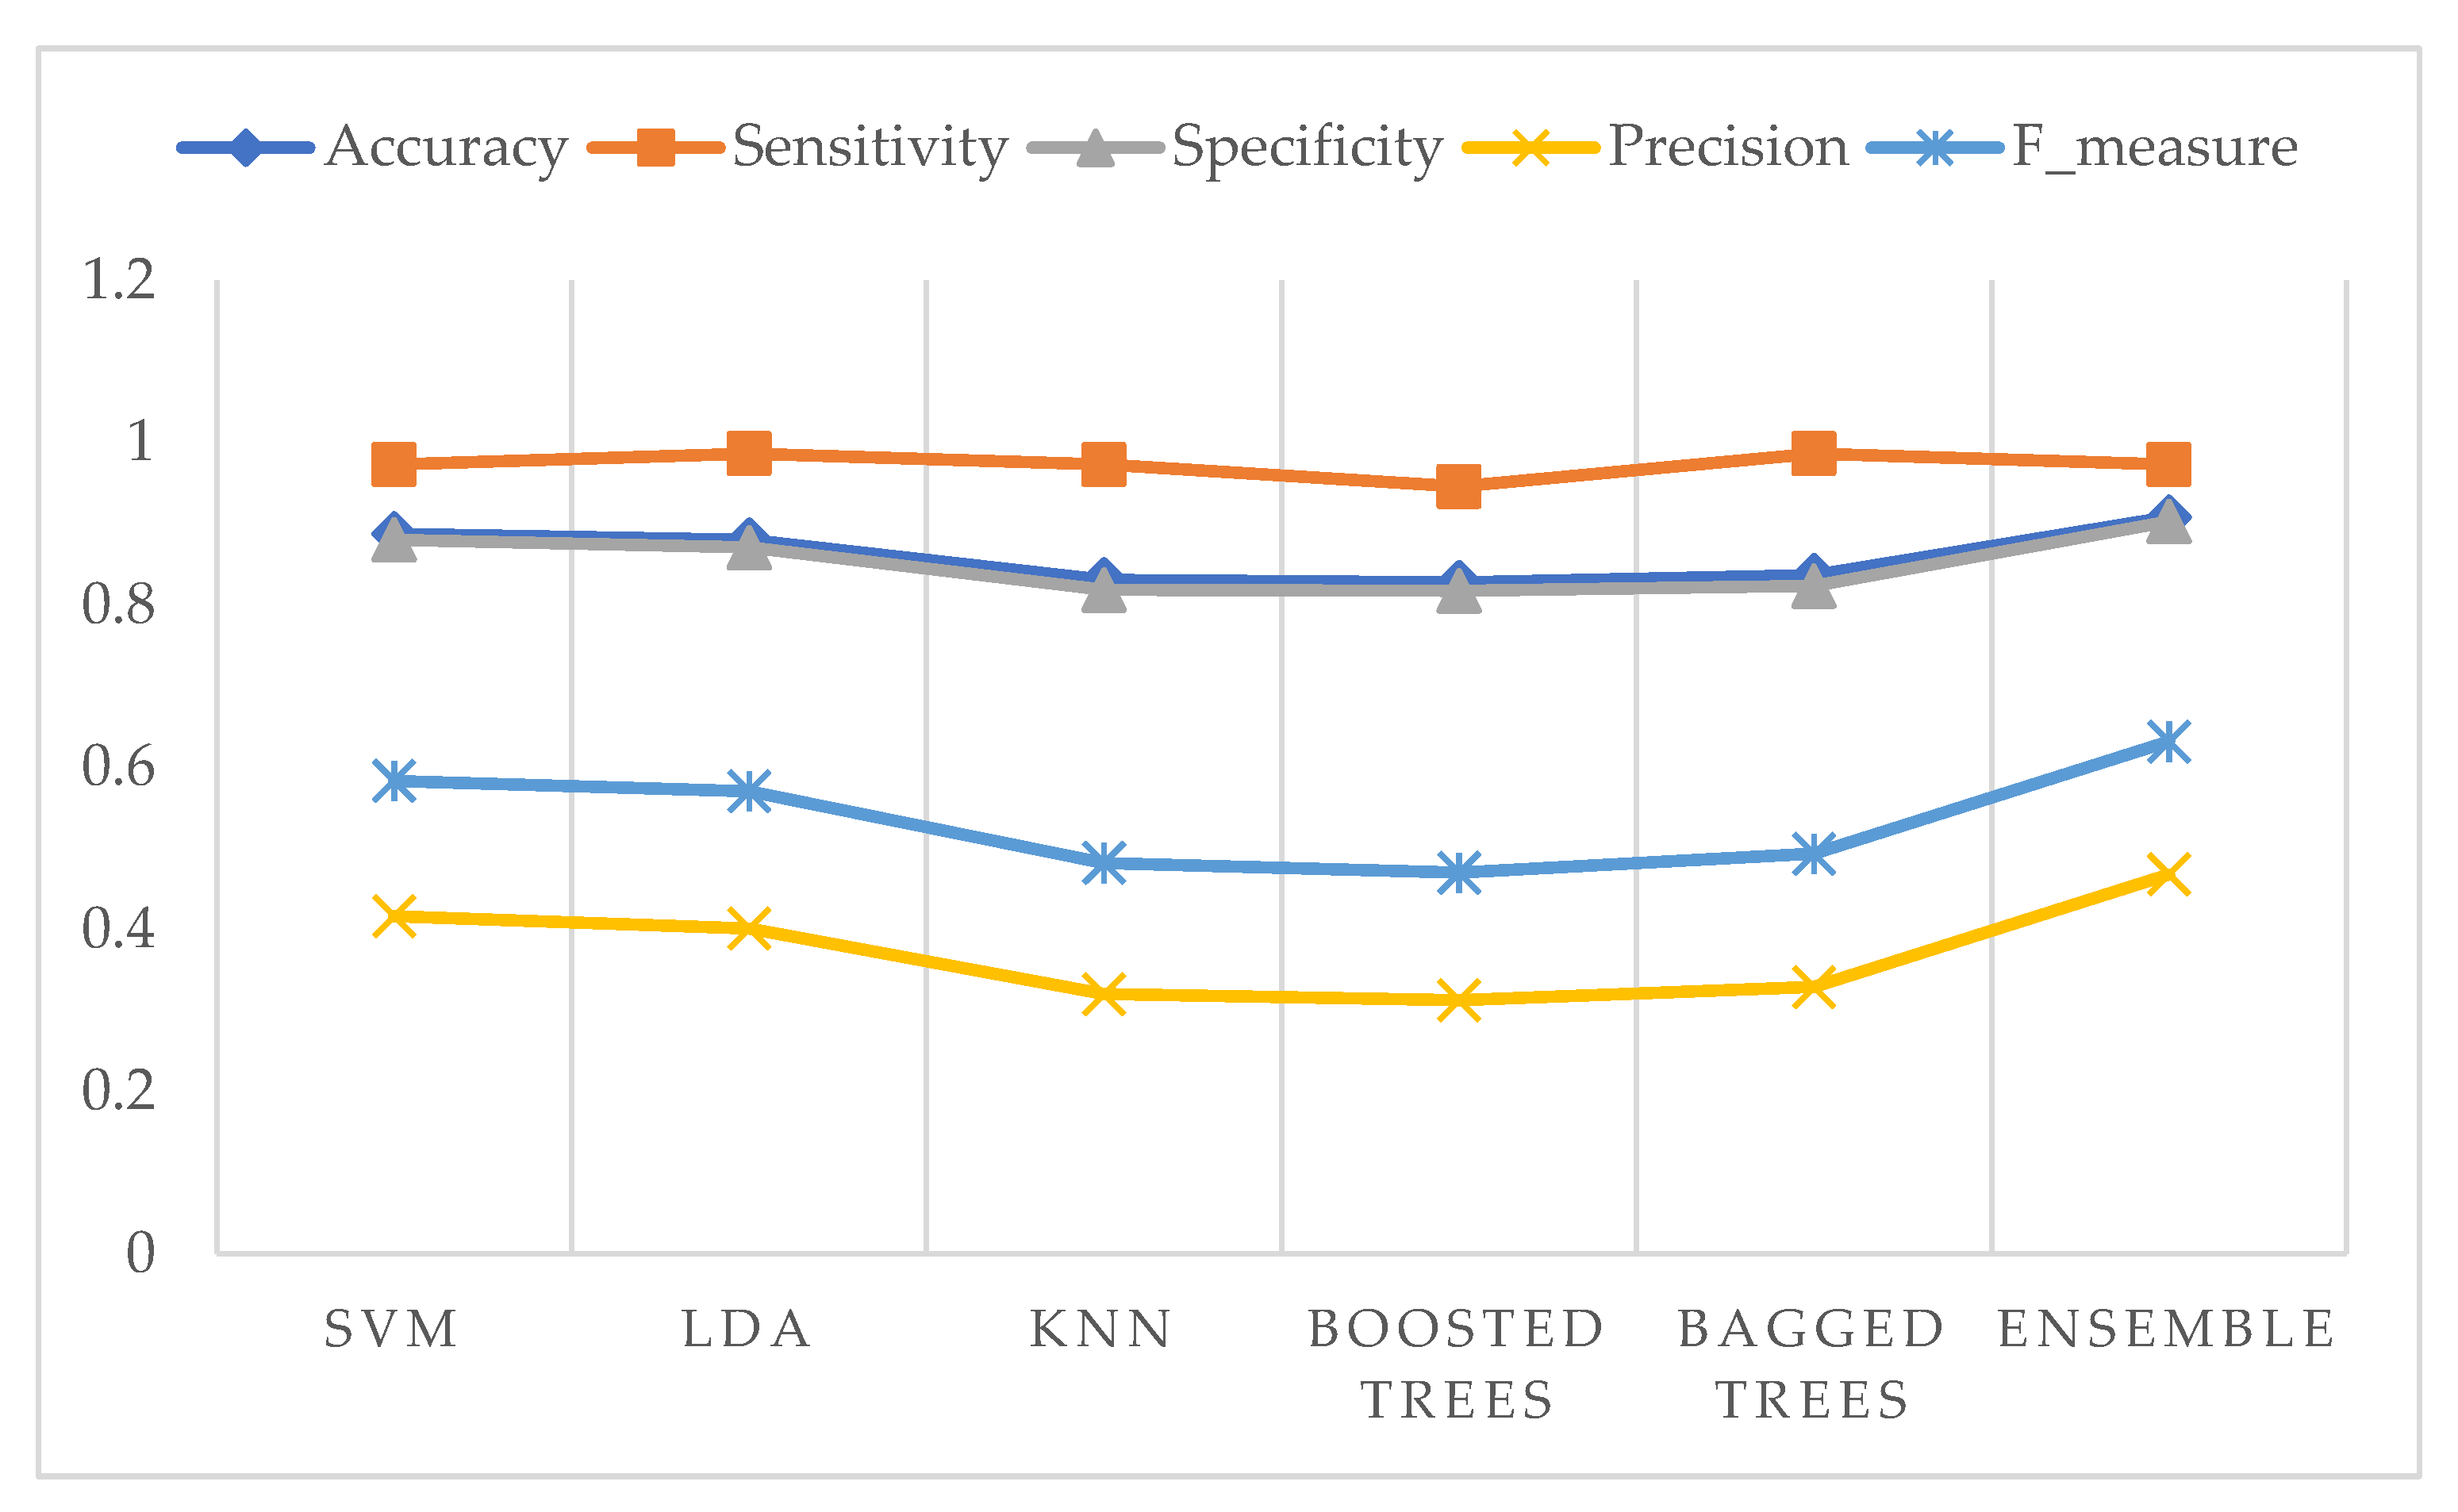
3. Results
4. Conclusions
Author Contributions
Funding
Acknowledgments
Conflicts of Interest
References
- Torre, L.A.; Bray, F.; Siegel, R.L.; Ferlay, J.; Lortet-Tieulent, J.; Jemal, A. Global cancer statistics, 2012: Global Cancer Statistics, 2012. CA. Cancer J. Clin. 2015, 65, 87–108. [Google Scholar] [CrossRef] [PubMed]
- Mishra, G.; Shastri, S.; Pimple, S. An overview of prevention and early detection of cervical cancers. Indian J. Med. Paediatr. Oncol. 2011, 32, 125. [Google Scholar] [CrossRef] [PubMed]
- Malm, P. Automated cervical cancer screening through image analysis. Int. J. Cancer 2008, 957–962. [Google Scholar]
- Balkin, M.S. Cervical Cancer Prevention and Treatment: Science, Public Health and Policy Overview. In Proceedings of the Challenges and Opportunities for Women’s Right to Health, Brussels, Belgium, 27–28 September 2007. [Google Scholar]
- Kurniawan, R.; Muhimmah, I.; Kurniawardhani, A.; Indrayanti, I. Segmentation of Overlapping Cervical Cells in Normal Pap Smear Images Using Distance-Metric and Morphological Operation. Commun. Inf. Technol. J. 2017, 11, 25–31. [Google Scholar] [CrossRef][Green Version]
- Mbaga, A.H.; ZhiJun, P. Pap Smear Images Classification for Early Detection of Cervical Cancer. Int. J. Comput. Appl. 2015, 118, 10–16. [Google Scholar]
- Plissiti, M.E.; Vrigkas, M.; Nikou, C. Segmentation of cell clusters in Pap smear images using intensity variation between superpixels. In Proceedings of the 2015 International Conference on Systems, Signals and Image Processing (IWSSIP), London, UK, 10–12 September 2015; pp. 184–187. [Google Scholar]
- Sulaiman, S.N.; Isa, N.A.M.; Yusoff, I.A.; Othman, N.H. “Overlapping cells separation method for cervical cell images. In Proceedings of the 2010 10th International Conference on Intelligent Systems Design and Applications, Cairo, Egypt, 29 November–1 December 2010; pp. 1218–1222. [Google Scholar]
- Plissiti, M.E.; Nikou, C.; Charchanti, A. Automated Detection of Cell Nuclei in Pap Smear Images Using Morphological Reconstruction and Clustering. IEEE Trans. Inf. Technol. Biomed. 2011, 15, 233–241. [Google Scholar] [CrossRef]
- Muhimmah, I.; Kurniawan, R. Overlapping Cervical Nuclei Separation using Watershed Transformation and Elliptical Approach in Pap Smear Images. J. ICT Res. Appl. 2017, 11, 213–229. [Google Scholar] [CrossRef]
- Taneja, A.; Ranjan, P.; Ujlayan, A. Multi-cell nuclei segmentation in cervical cancer images by integrated feature vectors. Multimed. Tools Appl. 2018, 77, 9271–9290. [Google Scholar] [CrossRef]
- Gautam, S.; Jith, N.; Sao, A.K.; Bhavsar, A.; Natarajan, A. Considerations for a PAP Smear Image Analysis System with CNN Features. arXiv 2018, arXiv:1806.09025. [Google Scholar]
- William, W.; Ware, A.; Basaza-Ejiri, A.H.; Obungoloch, J. A pap-smear analysis tool (PAT) for detection of cervical cancer from pap-smear images. Biomed. Eng. OnLine 2019, 18, 16. [Google Scholar] [CrossRef]
- Guven, M.; Cengizler, C. Data cluster analysis-based classification of overlapping nuclei in Pap smear samples. Biomed. Eng. OnLine 2014, 13, 159. [Google Scholar] [CrossRef] [PubMed]
- Ashok, B.; Aruna, D.P. Comparison of Feature selection methods for diagnosis of cervical cancer using SVM classifier. Int. J. Eng. Res. Appl. 2016, 6, 94–99. [Google Scholar]
- Tareef, A.; Song, Y.; Cai, W.; Feng, D.D.; Chen, M. Automated three-stage nucleus and cytoplasm segmentation of overlapping cells. In Proceedings of the 2014 13th International Conference on Control Automation Robotics & Vision (ICARCV), Singapore, 10–12 December 2014; pp. 865–870. [Google Scholar]
- Solar, M.; Gonzalez, J.P.P. Computational Detection of Cervical Uterine Cancer. In Proceedings of the 2019 Sixth International Conference on eDemocracy & eGovernment (ICEDEG), Quito, Ecuador, 24–26 April 2019; pp. 213–217. [Google Scholar]
- Cloppet, F.; Boucher, A. Segmentation of overlapping/aggregating nuclei cells in biological images. In Proceedings of the 2008 19th International Conference on Pattern Recognition, Tampa, FL, USA, 8–11 December 2008; pp. 1–4. [Google Scholar]
- Vincent, L.; Soille, P. Watersheds in digital spaces: An efficient algorithm based on immersion simulations. IEEE Trans. Pattern Anal. Mach. Intell. 1991, 13, 583–598. [Google Scholar] [CrossRef]
- Orozco-Monteagudo, M.; Mihai, C.; Sahli, H.; Taboada-Crispi, A. Combined Hierarchical Watershed Segmentation and SVM Classification for Pap Smear Cell Nucleus Extraction. Comp. Sist. 2012, 16, 133–145. [Google Scholar]
- Chuanyun, X.; Yang, Z.; Sen, W. Cell Segmentation in Cervical Smear Images using Polar Coordinates GVF Snake with Radiating Edge Map. J. Multimed. 2013, 8, 213–219. [Google Scholar] [CrossRef]
- Bengtsson, E.; Malm, P. Screening for Cervical Cancer Using Automated Analysis of PAP-Smears. Comput. Math. Methods Med. 2014, 2014, 1–12. [Google Scholar] [CrossRef]
- Lu, Z.; Carneiro, G.; Bradley, A.P. Automated Nucleus and Cytoplasm Segmentation of Overlapping Cervical Cells. In Advanced Information Systems Engineering; Salinesi, C., Norrie, M.C., Pastor, Ó., Eds.; Springer: Berlin/Heidelberg, Germany, 2013; pp. 452–460. [Google Scholar]
- Song, Y.; Zhu, L.; Qin, J.; Lei, B.; Sheng, B.; Choi, K.-S. Segmentation of Overlapping Cytoplasm in Cervical Smear Images via Adaptive Shape Priors Extracted from Contour Fragments. IEEE Trans. Med. Imaging 2019, 38, 2849–2862. [Google Scholar] [CrossRef]
- Tang, J.R. Pleomorphism in Cervical Nucleus: A Review. Int. J. Comput. Sci. Inf. Secur. 2018, 16, 5. [Google Scholar]
- Wei, L.; Gan, Q.; Ji, T. Cervical cancer histology image identification method based on texture and lesion area features. Comput. Assist. Surg. 2017, 22, 186–199. [Google Scholar] [CrossRef]
- Alam, T.M.; Milhan, M.; Atif, M.; Wahab, A.; Mushtaq, M. Cervical Cancer Prediction through Different Screening Methods using Data Mining. Int. J. Adv. Comput. Sci. Appl. 2019. [Google Scholar] [CrossRef]
- Bouveyron, C.; Brunet, C.; Vigneron, V. Classification of high-dimensional data for cervical cancer detection. In Proceedings of the 17th European Symposium on Artificial Neural Networks, Bruges, Belgium, 22–24 April 2009. [Google Scholar]
- Sharma, M.; Singh, S.K.; Agrawal, P.; Madaan, V. Classification of Clinical Dataset of Cervical Cancer using KNN. Indian J. Sci. Technol. 2016, 9, 1–5. [Google Scholar] [CrossRef]
- Devi, M.A.; Ravi, S.; Vaishnavi, J.; Punitha, S. Classification of Cervical Cancer Using Artificial Neural Networks. Procedia Comput. Sci. 2016, 89, 465–472. [Google Scholar] [CrossRef]
- Arya, M.; Mittal, N.; Singh, G. Cervical Cancer Detection Using Segmentation on Pap smear Images. In Proceedings of the Proceedings of the International Conference on Informatics and Analytics-ICIA-16, Pondicherry, India, 25–26 August 2016; pp. 1–5. [Google Scholar]
- Song, Y.; Qin, J.; Lei, B.; He, S.; Choi, K.-S. Joint Shape Matching for Overlapping Cytoplasm Segmentation in Cervical Smear Images. In Proceedings of the 2019 IEEE 16th International Symposium on Biomedical Imaging (ISBI 2019), Venice, Italy, 8–11 April 2019; pp. 191–194. [Google Scholar]
- Win, K.P.; Kitjaidure, Y.; Phyu, M.; Hamamoto, K. Cervical Cancer Detection and Classification from Pap Smear Images. In Proceedings of the 2019 International Conference on Biomedical Imaging, Signal Processing, Nagoya, Japan, 17–19 October 2019. [Google Scholar]
- Plissiti, M.E.; Dimitrakopoulos, P.; Sfikas, G.; Nikou, C.; Krikoni, O.; Charchanti, A. Sipakmed: A New Dataset for Feature and Image Based Classification of Normal and Pathological Cervical Cells in Pap Smear Images. In Proceedings of the 2018 25th IEEE International Conference on Image Processing (ICIP), Athens, Greece, 7–10 October 2018; pp. 3144–3148. [Google Scholar]
- Jantzen, J.; Norup, J.; Dounias, G.; Bjerregaard, B. Pap-smear Benchmark Data for Pattern Classification. Nature Inspired Smart Information Systems (NiSIS). Available online: http://mde-lab.aegean.gr/index.php/downloads (accessed on 23 July 2008).
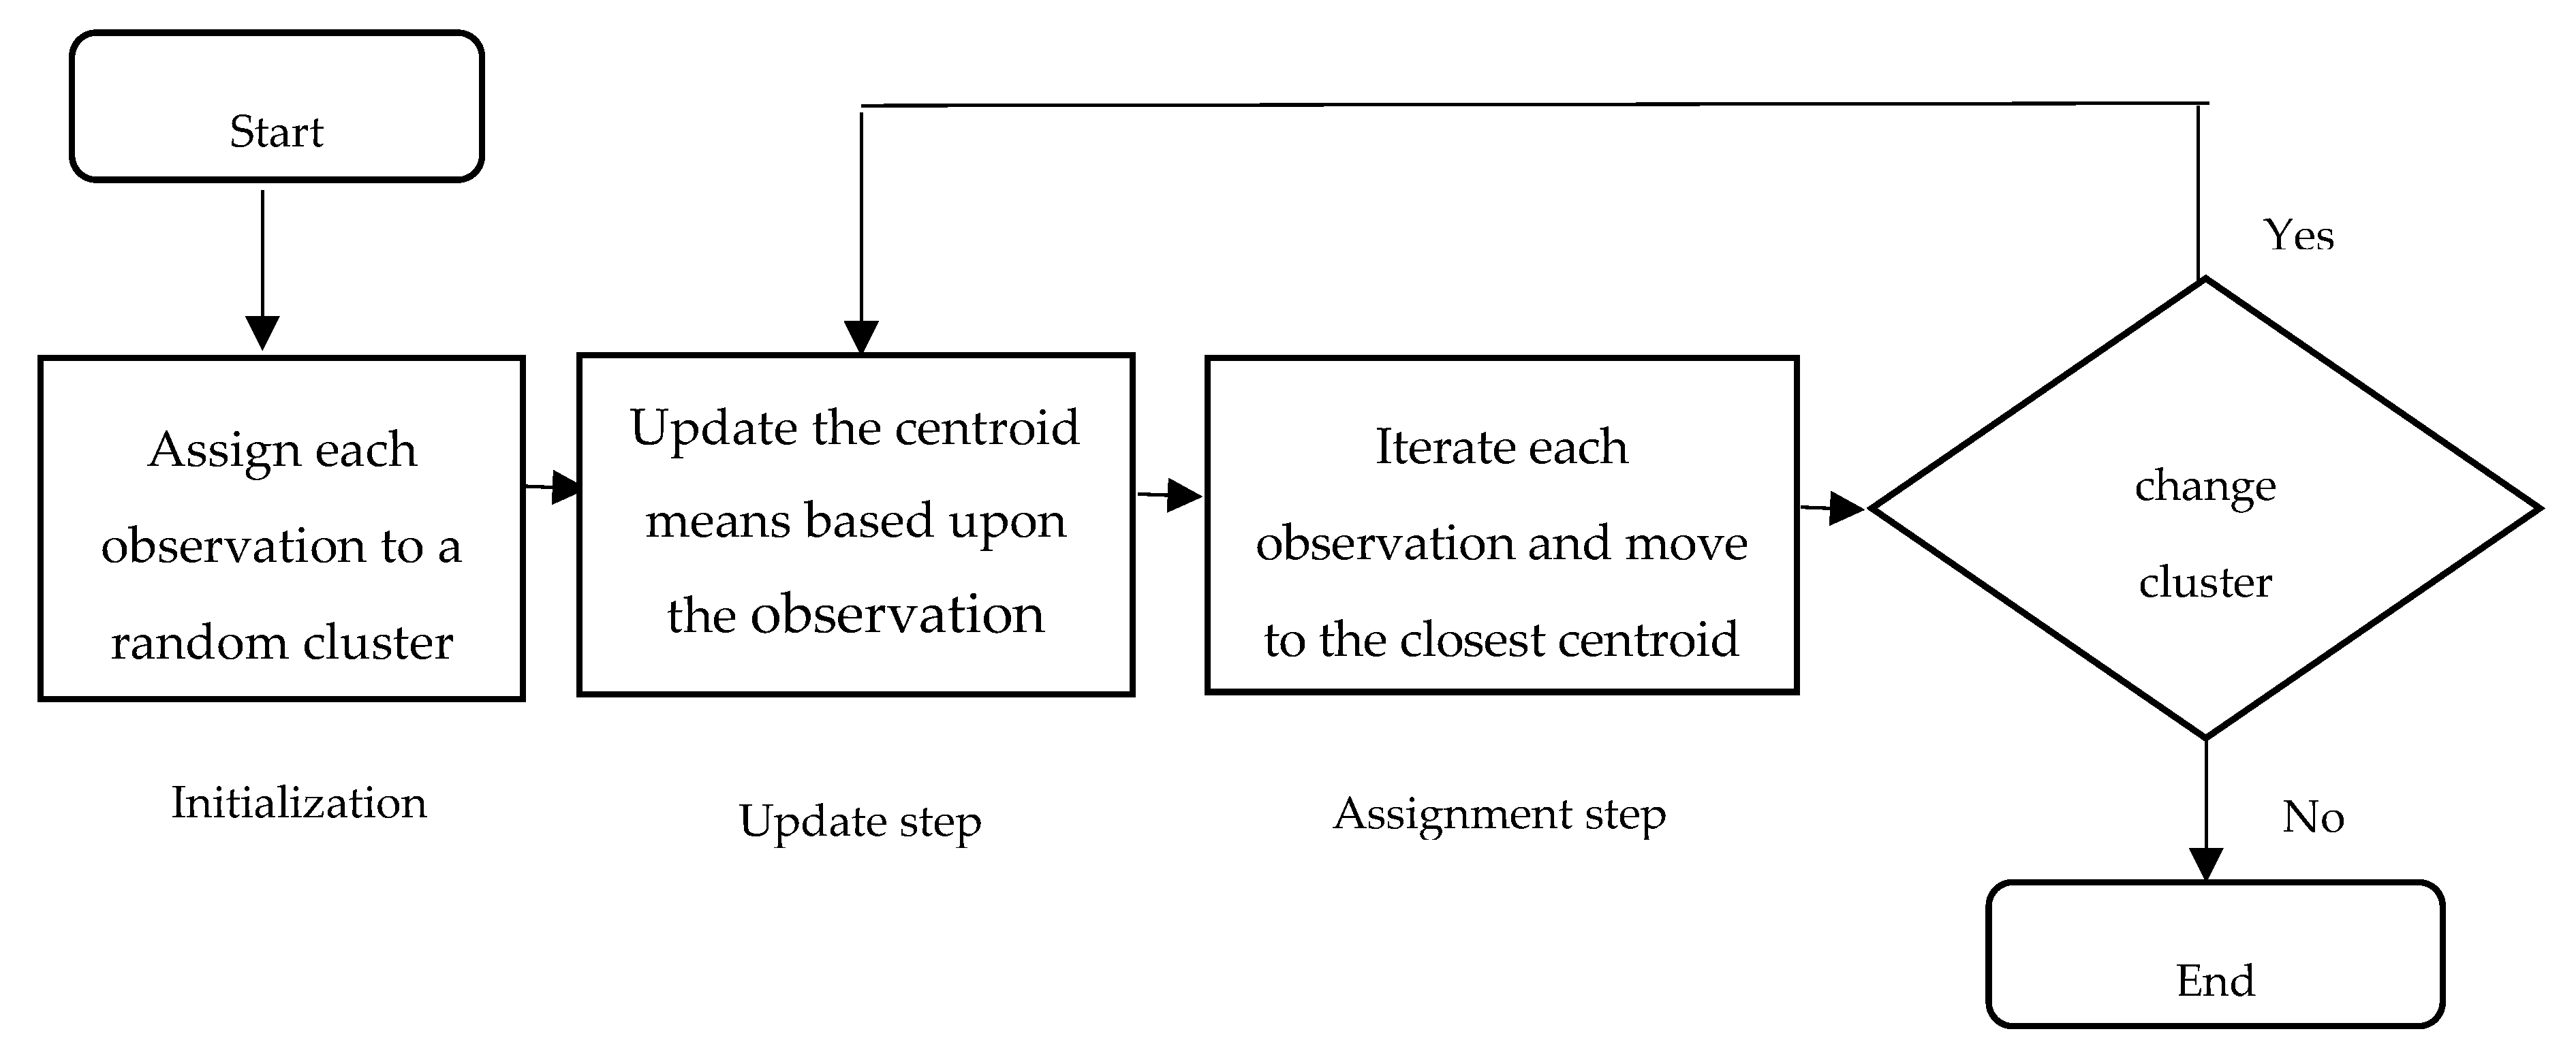
- Macqueen, J. Some Methods for Classification and Analysis of Multivariate Observations. In Proceedings of the 5th Berkeley Symposium on Mathematical Statistics and Probability; University of California Press: Berkeley, NY, USA, 1967; pp. 281–297. [Google Scholar]
- Kumar, P.; Happy, S.L.; Chatterjee, S.; Sheet, D.; Routray, A. An Unsupervised Approach for Overlapping Cervical Cell Cytoplasm Segmentation. In Proceedings of the 2016 IEEE EMBS Conference on Biomedical Engineering and Sciences (IECBES), 4–8 December 2016; pp. 106–109. [Google Scholar]
- Fernández-Carrobles, M.M.; Serrano, I.; Bueno, G.; Déniz, O. Bagging Tree Classifier and Texture Features for Tumor Identification in Histological Images. Procedia Comput. Sci. 2016, 90, 99–106. [Google Scholar] [CrossRef][Green Version]
- Chang, C.-C.; Lin, C.-J. LIBSVM: A library for support vector machines. ACM Trans. Intell. Syst. Technol. 2011, 2, 1–27. [Google Scholar] [CrossRef]
- Kaur, R.; Ginige, J.A. Comparative Evaluation of Accuracy of Selected Machine Learning Classification Techniques for Diagnosis of Cancer: A Data Mining Approach. Int. J. Biomed. Biol. Eng. 2018, 12, 19–25. [Google Scholar]


| Class | Number of Cells |
|---|---|
| Normal Cells | |
| 1. Normal superficial cells | 74 |
| 2. Normal intermediate cells | 70 |
| 3. Normal columnar cells | 98 |
| Abnormal Cells | |
| 4. Mild dysplastic cells | 182 |
| 5. Moderate dysplastic cells | 146 |
| 6. Severe dysplastic cells | 197 |
| 7. Carcinoma in situ | 150 |
| Total | 917 |
| Class | Number of Images | Number of Cells |
|---|---|---|
| Normal Cells | ||
| 1. Superficial-Intermediate cells | 126 | 831 |
| 2. Parabasal cells | 108 | 787 |
| Benign Cells | ||
| 3. Metaplastic cells | 271 | 793 |
| Abnormal Cells | ||
| 4. Dyskeratotic cells | 223 | 813 |
| 5. Koilocytotic cells | 238 | 825 |
| Total | 966 | 4049 |
| Step 1: Read color image and convert gray image Step 2: Mark the foreground objects Step 3: Compute background objects Step 4: Use markers’ image that is roughly in the middle of the cells to be segmented Step 5: Compute the watershed transform of makers’ image Step 6: Show the result of detected overlapping cells’ regions Step 7: Calculate the boundaries of detected regions in the image Step 8: Detect areas between the minimum and maximum values for cells regions Step 9: Cropping the regions Step 10: Classify the regions of the cell into isolated, touching, or overlapped cells |
| Step 1: Read grayscale image and convert binary image Step 2: Extract the largest blob only Step 3: Crop-off the frame on the left and top Step 4: Fill holes Step 5: Blur the image Step 6: Threshold again Step 7: Show the smoothed binary image |
| Step 1: Read the input color image and invert the grayscale image Step 2: Remove noise using the median filter Step 3: Predefine minimum area, major and minor axis lengths, minimum and maximum intensity values, and solidity Step 4: Binarize the image using the lowest and highest thresholds Step 5: Remove the regions under limited shape and intensity values Step 6: Segment nuclei |
| DSC | FNR | TPR |
|---|---|---|
| 0.862 | 0.500 | 0.945 |
| Class | Isolated Cell | Segmented Cytoplasm | Smooth Boundary | Segmented Nuclei |
|---|---|---|---|---|
| Class1 |  |  |  |  |
| Class2 |  |  |  |  |
| Class3 |  |  |  |  |
| Class4 |  |  |  |  |
| Class5 |  |  |  |  |
| Class | Touching Cell | Segmented Cytoplasm | Clean Boundary | Smooth Boundary | Segmented Nuclei |
|---|---|---|---|---|---|
| Class1 |  |  |  |  |  |
| Class2 |  |  |  |  |  |
| Class3 |  |  |  |  |  |
| Class4 |  |  |  |  |  |
| Class5 |  |  |  |  |  |
| Class | Overlapping Cell | Segmented Cytoplasm | Clean Boundary | Smooth Boundary | Segmented Nuclei |
|---|---|---|---|---|---|
| Class1 |  |  |  |  |  |
| Class2 |  |  |  |  |  |
| Class3 |  |  |  |  |  |
| Class4 |  |  |  |  |  |
| Class5 |  |  |  |  |  |
| Isolated Cytoplasm | Touching Cytoplasm | Overlapping Cytoplasm | Total |
|---|---|---|---|
| 262 | 1428 | 2359 | 4049 |
| 100% | 95.85% | 77.59% | 95.94% |
| No. | Nuclei Features (35) | No. | Cytoplasm Features (35) |
|---|---|---|---|
| N1 | Nucleus’s area | C1 | Cytoplasm’s area |
| N2 | Nucleus’s major axis length | C2 | Cytoplasm’s major axis length |
| N3 | Nucleus’s minor axis length | C3 | Cytoplasm’s minor axis length |
| N4 | Nucleus’s eccentricity | C4 | Cytoplasm’s eccentricity |
| N5 | Nucleus’s orientation | C5 | Cytoplasm’s orientation |
| N6 | Nucleus’s equivalent diameter | C6 | Cytoplasm’s equivalent diameter |
| N7 | Nucleus’s solidity | C7 | Cytoplasm’s solidity |
| N8 | Nucleus’s extent | C8 | Cytoplasm’s extent |
| N9 | Nucleus’s compactness | C9 | Cytoplasm’s compactness |
| N10 | Nucleus’s short diameter | C10 | Cytoplasm’s short diameter |
| N11 | Nucleus’s long diameter | C11 | Cytoplasm’s long diameter |
| N12 | Nucleus’s elongation | C12 | Cytoplasm’s elongation |
| N13 | Nucleus’s roundness | C13 | Cytoplasm’s roundness |
| N14 | Nucleus’s perimeter | C14 | Cytoplasm’s perimeter |
| N15 | Nucleus’s position | C15 | Nucleus to cytoplasm ratio |
| N16 | Nucleus’s maximum number | C16 | Cytoplasm’s maximum number |
| N17 | Nucleus’s minimum number | C17 | Cytoplasm’s minimum number |
| N18 | Nucleus’s average intensity in R | C18 | Cytoplasm’s average intensity in R |
| N19 | Nucleus’s average intensity in G | C19 | Cytoplasm’s average intensity in G |
| N20 | Nucleus’s average intensity in B | C20 | Cytoplasm’s average intensity in B |
| N21 | Nucleus’s average intensity in H | C21 | Cytoplasm’s third moment in H |
| N22 | Nucleus’s average intensity in S | C22 | Cytoplasm’s uniformity in S |
| N23 | Nucleus’s average intensity in V | C23 | Cytoplasm’s entropy in V |
| N24 | Nucleus’s contrast | C24 | Cytoplasm’s contrast |
| N25 | Nucleus’s local homogeneity | C25 | Cytoplasm’s local homogeneity |
| N26 | Nucleus’s correlation | C26 | Cytoplasm’s correlation |
| N27 | Nucleus’s cluster shape | C27 | Cytoplasm’s cluster shape |
| N28 | Nucleus’s cluster prominence | C28 | Cytoplasm’s cluster prominence |
| N29 | Nucleus’s maximum probability | C29 | Cytoplasm’s maximum probability |
| N30 | Nucleus’s energy | C30 | Cytoplasm’s energy |
| N31 | Nucleus’s variance | C31 | Cytoplasm’s variance |
| N32 | Nucleus’s uniformity | C32 | Cytoplasm’s uniformity |
| N33 | Nucleus’s entropy | C33 | Cytoplasm’s entropy |
| N34 | Nucleus’s sum entropy | C34 | Cytoplasm’s sum entropy |
| N35 | Nucleus’s difference entropy | C35 | Cytoplasm’s difference entropy |
| No. | Selected Features Name | Ranked Values |
|---|---|---|
| 1 | Nucleus to cytoplasm ratio | 0.67559 |
| 2 | Nucleus’s average intensity in G | 0.58192 |
| 3 | Cytoplasm’s average intensity in R | 0.56378 |
| 4 | Nucleus’s average intensity in R | 0.5015 |
| 5 | Cytoplasm’s average intensity in G | 0.48555 |
| 6 | Nucleus’s entropy | 0.39472 |
| 7 | Nucleus’s average intensity in B | 0.38415 |
| 8 | Nucleus’s uniformity | 0.32821 |
| 9 | Cytoplasm’s contrast | 0.27581 |
| 10 | Nucleus’s long diameter | 0.25963 |
| 11 | Cytoplasm’s average intensity in B | 0.24524 |
| 12 | Cytoplasm’s long diameter | 0.23685 |
| 13 | Cytoplasm’s uniformity | 0.23395 |
| 14 | Nucleus’s perimeter | 0.21901 |
| 15 | Cytoplasm’s major axis length | 0.19202 |
| 16 | Cytoplasm’s equivalent diameter | 0.18936 |
| 17 | Nucleus’s area | 0.17126 |
| 18 | Cytoplasm’s perimeter | 0.16393 |
| 19 | Nucleus’s minimum number | 0.16279 |
| 20 | Nucleus’s minor axis length | 0.15295 |
© 2020 by the authors. Licensee MDPI, Basel, Switzerland. This article is an open access article distributed under the terms and conditions of the Creative Commons Attribution (CC BY) license (http://creativecommons.org/licenses/by/4.0/).
Share and Cite
Win, K.P.; Kitjaidure, Y.; Hamamoto, K.; Myo Aung, T. Computer-Assisted Screening for Cervical Cancer Using Digital Image Processing of Pap Smear Images. Appl. Sci. 2020, 10, 1800. https://doi.org/10.3390/app10051800
Win KP, Kitjaidure Y, Hamamoto K, Myo Aung T. Computer-Assisted Screening for Cervical Cancer Using Digital Image Processing of Pap Smear Images. Applied Sciences. 2020; 10(5):1800. https://doi.org/10.3390/app10051800
Chicago/Turabian StyleWin, Kyi Pyar, Yuttana Kitjaidure, Kazuhiko Hamamoto, and Thet Myo Aung. 2020. "Computer-Assisted Screening for Cervical Cancer Using Digital Image Processing of Pap Smear Images" Applied Sciences 10, no. 5: 1800. https://doi.org/10.3390/app10051800
APA StyleWin, K. P., Kitjaidure, Y., Hamamoto, K., & Myo Aung, T. (2020). Computer-Assisted Screening for Cervical Cancer Using Digital Image Processing of Pap Smear Images. Applied Sciences, 10(5), 1800. https://doi.org/10.3390/app10051800