Article

The Influence of the Load Term of the Strain Energy Sensitivity in the Shell Shape Optimization

1
School of Civil Engineering and Architecture, Hainan University, Haikou 570228, China
2
School of Civil Engineering, Harbin Institute of Technology, Harbin 150090, China
*
Author to whom correspondence should be addressed.
Appl. Sci. 2020, 10(6), 1947; https://doi.org/10.3390/app10061947
Submission received: 2 February 2020 / Revised: 27 February 2020 / Accepted: 9 March 2020 / Published: 12 March 2020
(This article belongs to the Section Civil Engineering)

Abstract

:

Featured Application

The strain energy sensitivity should be with the load term if the shell thickness is very thin or a higher performance of the structure is required in the shape optimization of the shell structure when the objective function is the strain energy.

Abstract

The sensitivity method is a type of effective shape optimization method and the strain energy is a frequently used objective function. The change of a surface shape inevitably causes a change in its quality. However, the influence of the load term on strain energy sensitivity has not been considered in many studies. In order to make the influence clear, the formula of the strain energy sensitivity including the load term was first derived. Secondly, the influence of the sensitivity load term on the structural evolution was studied by using different optimization schemes. The results showed that the load term of strain energy sensitivity accounts for a small proportion of the whole strain energy sensitivity, but it still has a cumulative impact on the structural evolution, and the shell thickness has an impact on the role of the load term of the strain energy sensitivity. The load term could influence the rate of increase in the structural weight and had an impact on the shape change to some extent. Therefore, for general construction projects, the strain energy sensitivity should be with the load term if the shell thickness is very thin or a higher performance of the structure is required.

1. Introduction

Shape optimization is an approach for finding the optimal geometry of a structure to capture a desired structural performance, subject to some given constraints [1]. The shape optimization of structures, especially the free-form surface structure, has gained significant attention in the last few decades, because shape optimization is an effective tool to generate a free-form shell structure, and the architecture form and structure form of the free-form surface structure are very close and architecturally pristine [2,3,4,5,6,7]. Many shape optimization methods have been developed by researchers, such as the sensitivity method [7,8,9,10,11,12,13], firefly algorithm [4], genetic algorithm [14], and so on. The objective functions are usually one or several among the structural behaviors, such as the compliance [11,12,13], the buckling load [15,16], the plastic collapse load [17], the Eigen frequency, or the dynamic response [18,19], etc.
Shape optimization based on the strain energy sensitivity method [8,9,10] has been applied in engineering projects. M. Sasaki [10] chose strain energy as an objective function and used the sensitivity method to design the free-form surface reinforced concrete shell structure. These projects have attracted scholars’ attention, and strengthen the research on the free-form shell structures. Minimizing the strain energy is equivalent to maximizing the stiffness. The strain energy is considered to be a very promising objective for shells because it minimizes bending, yielding a membrane-oriented design [20]. Evolutionary speed based on the strain energy sensitivity method is faster than the optimization methods which are not used the gradient information, for instance, the genetic algorithm, and the optimization result can be controlled by the initial structural shape, as it is a kind of local optimization method.
Such methods based on strain energy sensitivity [7,8,9,10,11,12,13] assume that the load does not change with the design variables when deducing the sensitivity information of the structure. In the traditional optimization method, the structural weight is only considered as the external load, and its influence on strain energy sensitivity is not considered. However, the structural self-weight and surface load are a kind of design dependent load, which will change with the structural shape [21]. Sensitivity analysis and evolutionary procedure need to accommodate the load variation condition.
S. Chen et al. [22] concluded that the influence of the load term on the sensitivity of optimization should be taken into account for the engineering structures with self-weight and inertia as the main load, and took the displacement sensitivity of the truss structure as an example to provide an explanation. Moreover, some scholars, K. Bandara and F. Cirak [23], and C. Ding etc. [24], considered that the load is a function of the design variables, but they did not show the difference between these two situations.
In this paper, we focus on the method based on strain energy sensitivity to optimize the shape of a free-form shell, which was named the height adjusting method [8] of curved surfaces. In this method, the height of the curved surface is adjusted gradually according to the differential of the strain energy around the height of the curved surface, calculated by the finite element approach. It is appropriate to approximate the load, as it is evenly distributed, and approximate the loading on each node. This loading will be proportional to the horizontal projection of the surface area carried by the node and is therefore a function of the geometrical positions of the nodes, which are variable. The structural self-weight is also a function of the geometrical positions of the nodes.
The paper is organized as follows. In Section 2, the formula of the surface shape optimization is shown. In Section 3, we show the derivation process of the strain energy sensitivity with and without the load term. The load term of the strain energy sensitivity was divided into the external load term and structural weight term to analyze the influence of the external load and weight on the load term of the strain energy sensitivity. The strain energy sensitivity including the effect of the load is derived, and the vector length of the load term, the stiffness term, and the whole value of the strain energy sensitivity are defined to measure their macroscopic size. In Section 4, the effect of the load term on the strain energy sensitivity is discussed. In Section 5, the structure iteration process is shown. In Section 6, two numerical examples are given to discuss the role of the load term of strain energy sensitivity in shape optimization. We find that the thickness of the shell has a great impact on the effect of the load term on the strain energy sensitivity. At last, we gave the conclusions in Section 7.

2. Formula of Surface Shape Optimization Problem

Suppose the free surface structure shape can be expressed by the nodes’ coordinates after the surface meshes, and the structural strain energy C can be regarded as the function of the nodes’ z-coordinate vector Z, namely C(Z), and the morphogenesis problem of a free surface structure can be expressed as:
{ C ( Z ) m i n i m u m s . t . σ m a x σ 0 δ m a x δ 0
where, C represents the objective function; δmax and σmax represent the maximum displacement and maximum stress, respectively. δ0 and σ0 represent allowable displacement and allowable stress, respectively.
Formula (1) indicates that the shape of the surface can be adjusted to minimize the strain energy, and the stress and displacement of the structure should meet the requirements. With the evolution of the structure, the stiffness of the structure increases gradually, and the maximum displacement and maximum stress decrease gradually. The problem eventually becomes an unconstrained optimization problem.

3. The Derivation of the Strain Energy Sensitivity

3.1. The Sensitivity Derivation by the Traditional Way

It is assumed in literature [8,9] that the change of design variables does not affect the nodal load vector F of the structure. For the problem shown in Equation (1), the strain energy (Equation (2)) and the finite element equation (Equation (3)) can be used to deduce the expression of the strain energy sensitivity to the coordinate zj of the jth node, as shown in equation (4).
C = 1 2 F T U
K U = F
where K is the structural stiffness matrix of the curved shell, U is the displacement vector of the structure, and F is the load vector.
C z j = 1 2 U T K z j U
where, zj represents the z-coordinate of node j.

3.2. The Derivation of the Strain Energy Sensitivity Including the Load Term

Taking into account the derivative of Equations (2) and (3), the difference between Section 3.2 and Section 3.1 is that the load vector F is a function of the nodal z-coordinates.
Equations (5) and (6) were obtained, and the new strain energy sensitivity expression, i.e., Equation (7) was obtained after the derivation.
C z j = 1 2 F T z j U + 1 2 F T U z j
K U z j + K z j U = F z j
C z j = F T z j U 1 2 U T K z j U
Because the sensitivity value of one node may be positive or negative, it is difficult to compare the influence of the load term on the strain energy sensitivity. In order to facilitate the comparison, the first term F T z j U on the right-hand side of Equation (7) is called as the load term, and a vector is made up of the value of the load term of all nodes (the same below), and the vector length value is denoted as SF; similarly, the second term 1 2 U T K z j U on the right-hand side is called the stiffness term, and its vector length value as SG, the result on the left-hand side of Equation (7) is called the whole value, its vector length value as ST.
Their vector length, as shown in Equations (8) to (10), is used to measure the macroscopic size of structural sensitivity and its components.
S F = j = 1 n ( α j F ) 2 ,   α j F = F T z j U
S G = j = 1 n ( α j G ) 2 ,   α j G = 1 2 U T K z j U
S T = j = 1 n ( α j T ) 2 ,   α j T = C z j
where n is the number of all the nodes as the design variables.

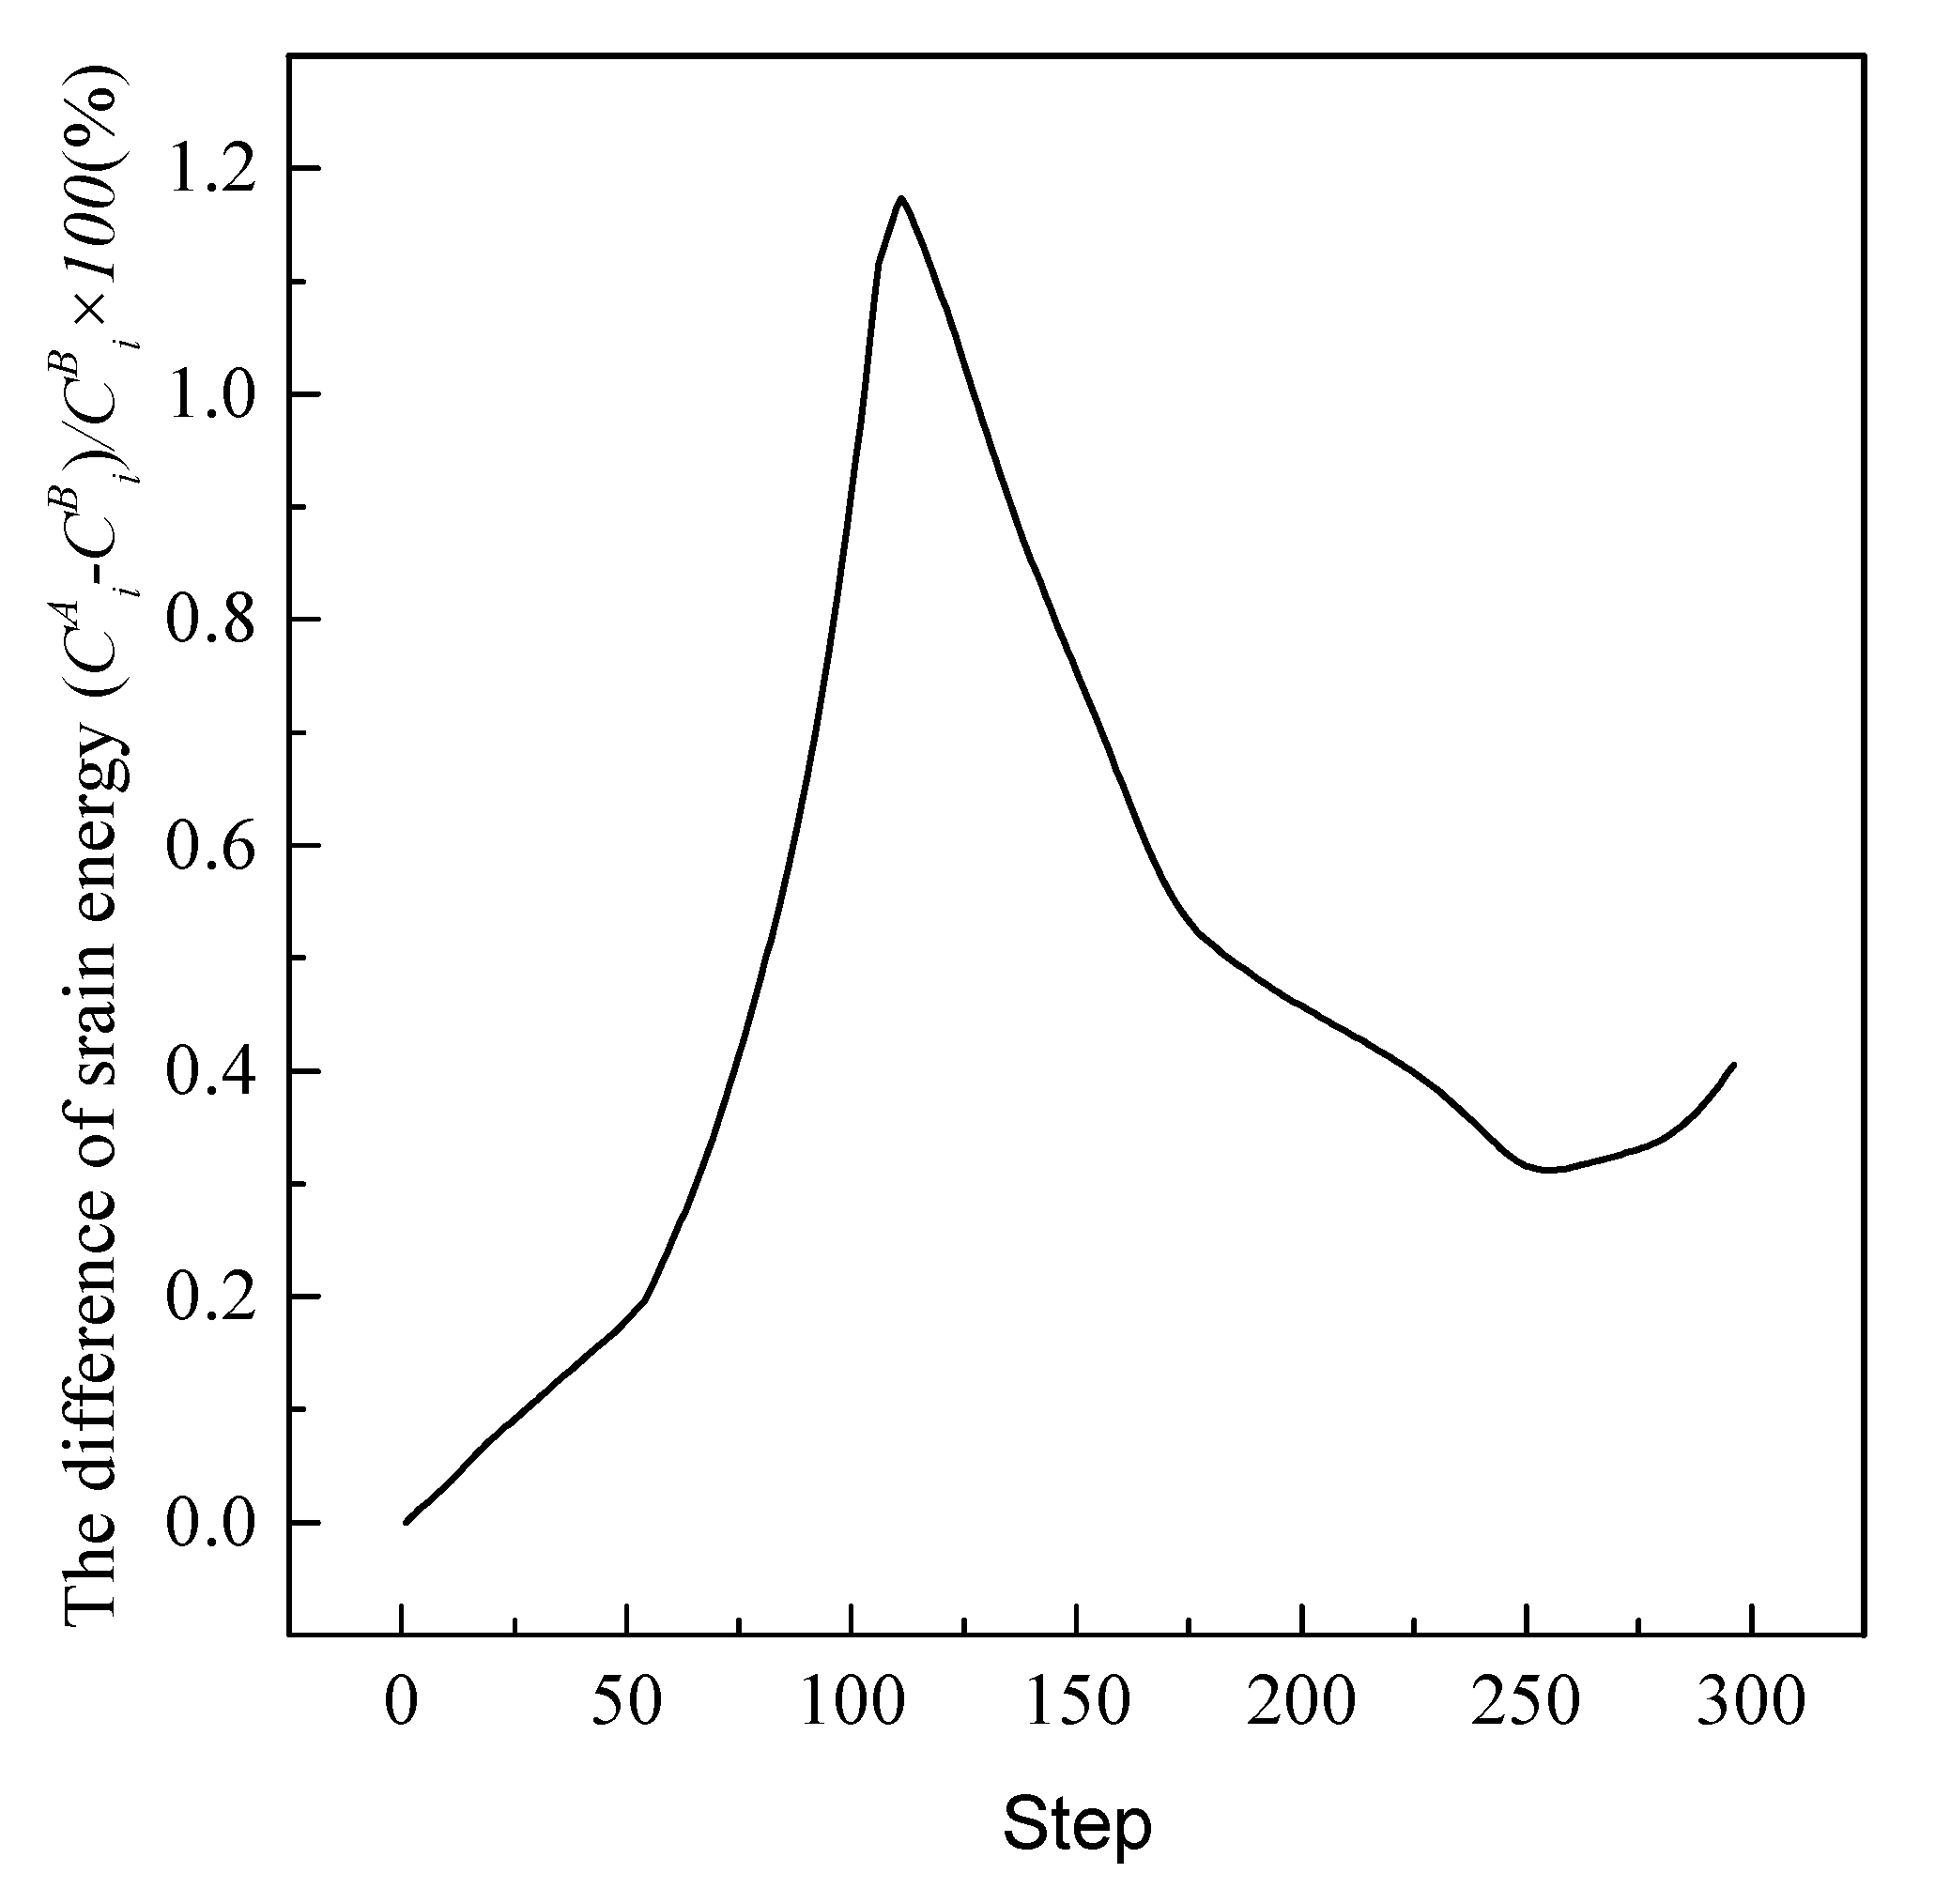
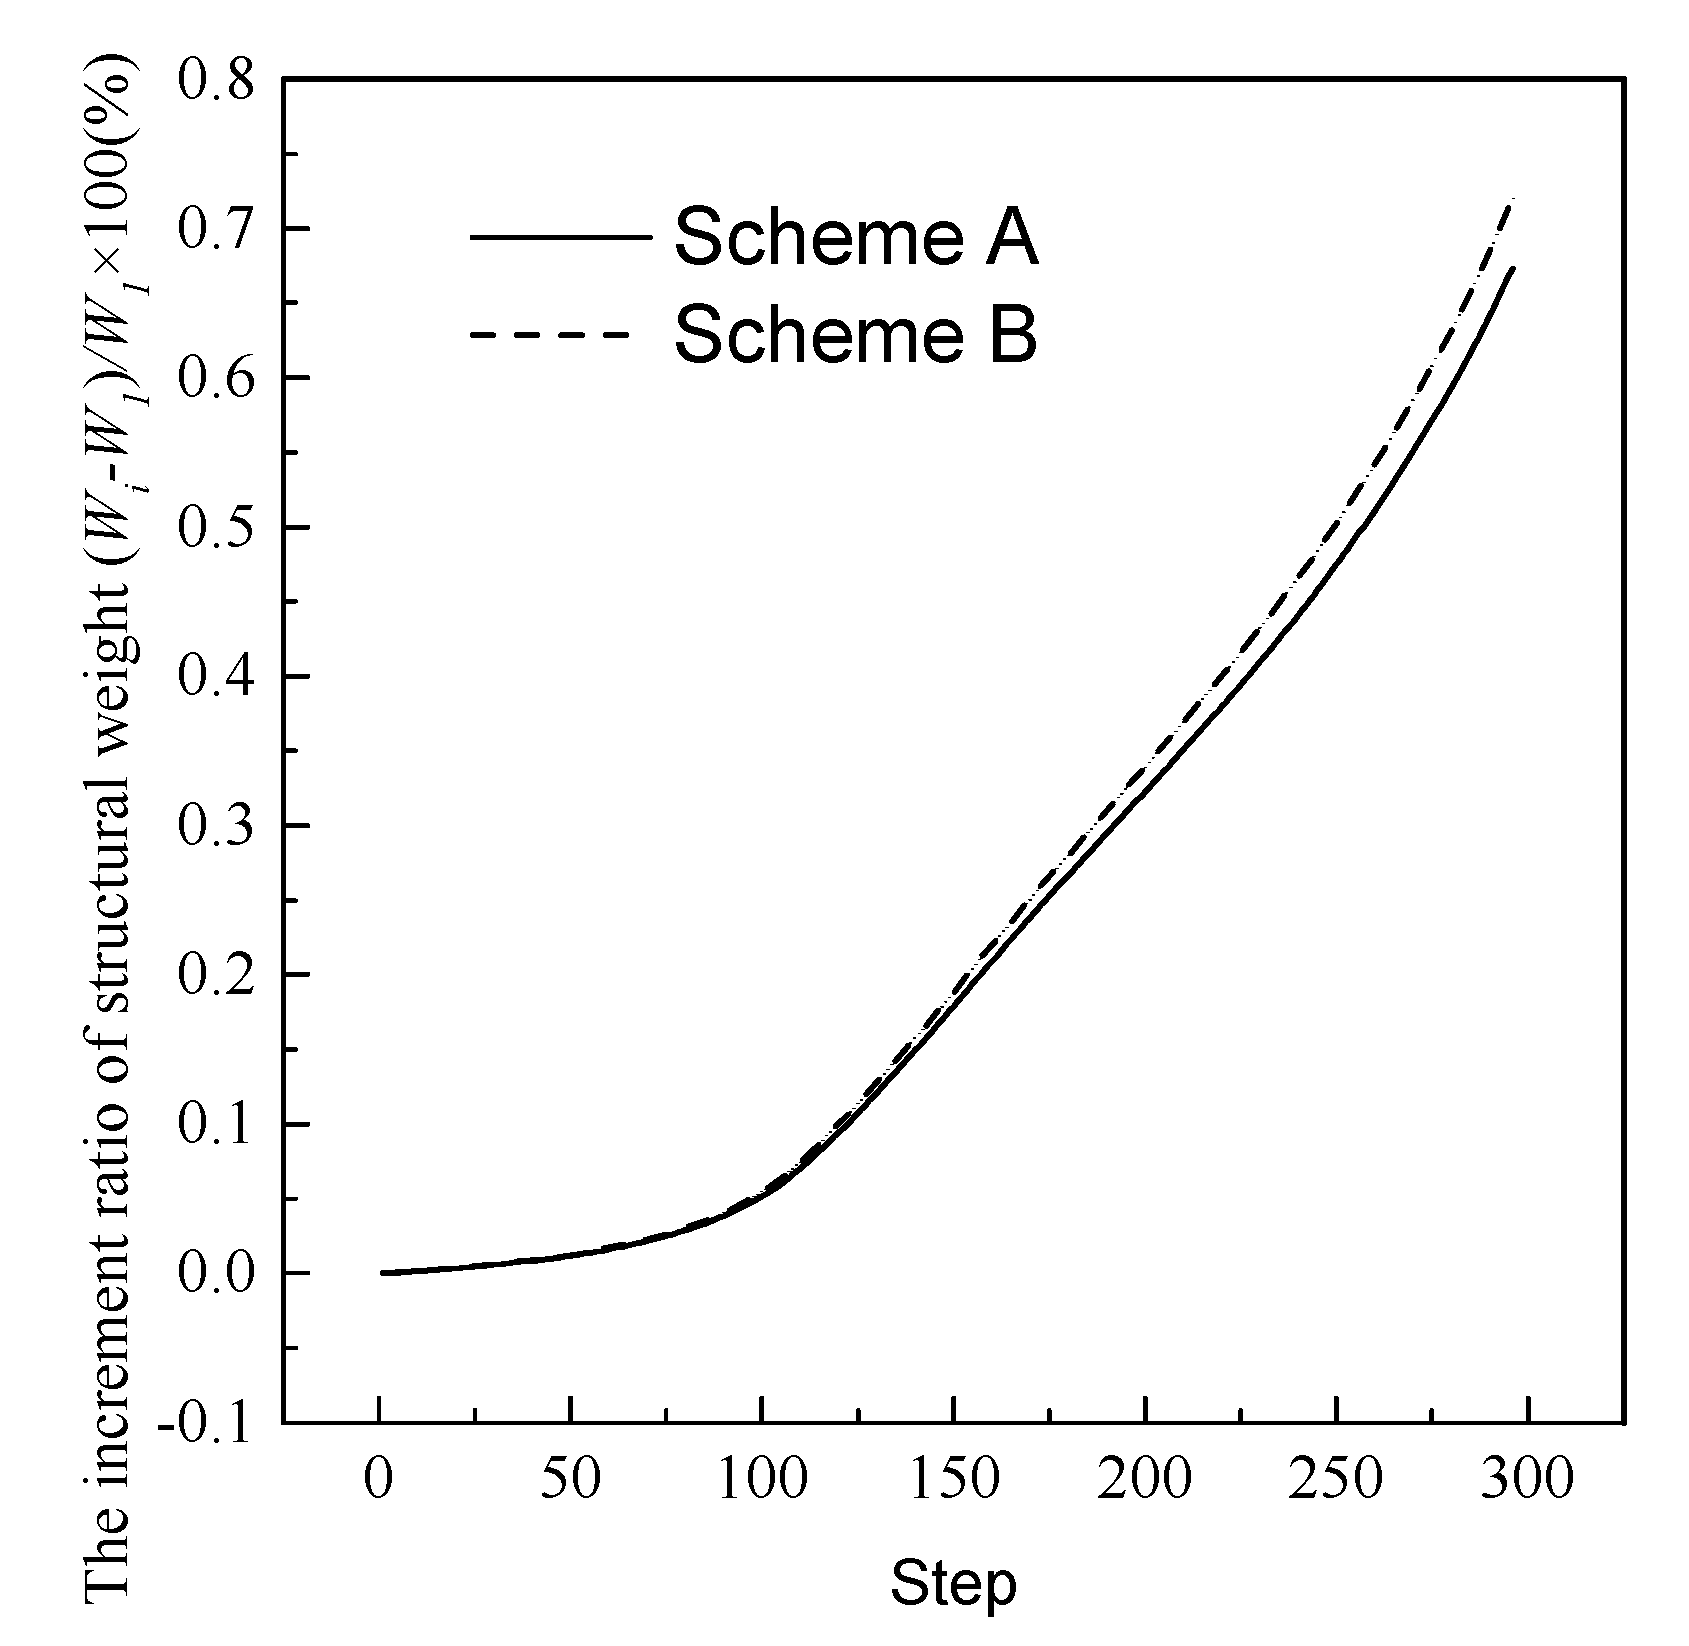
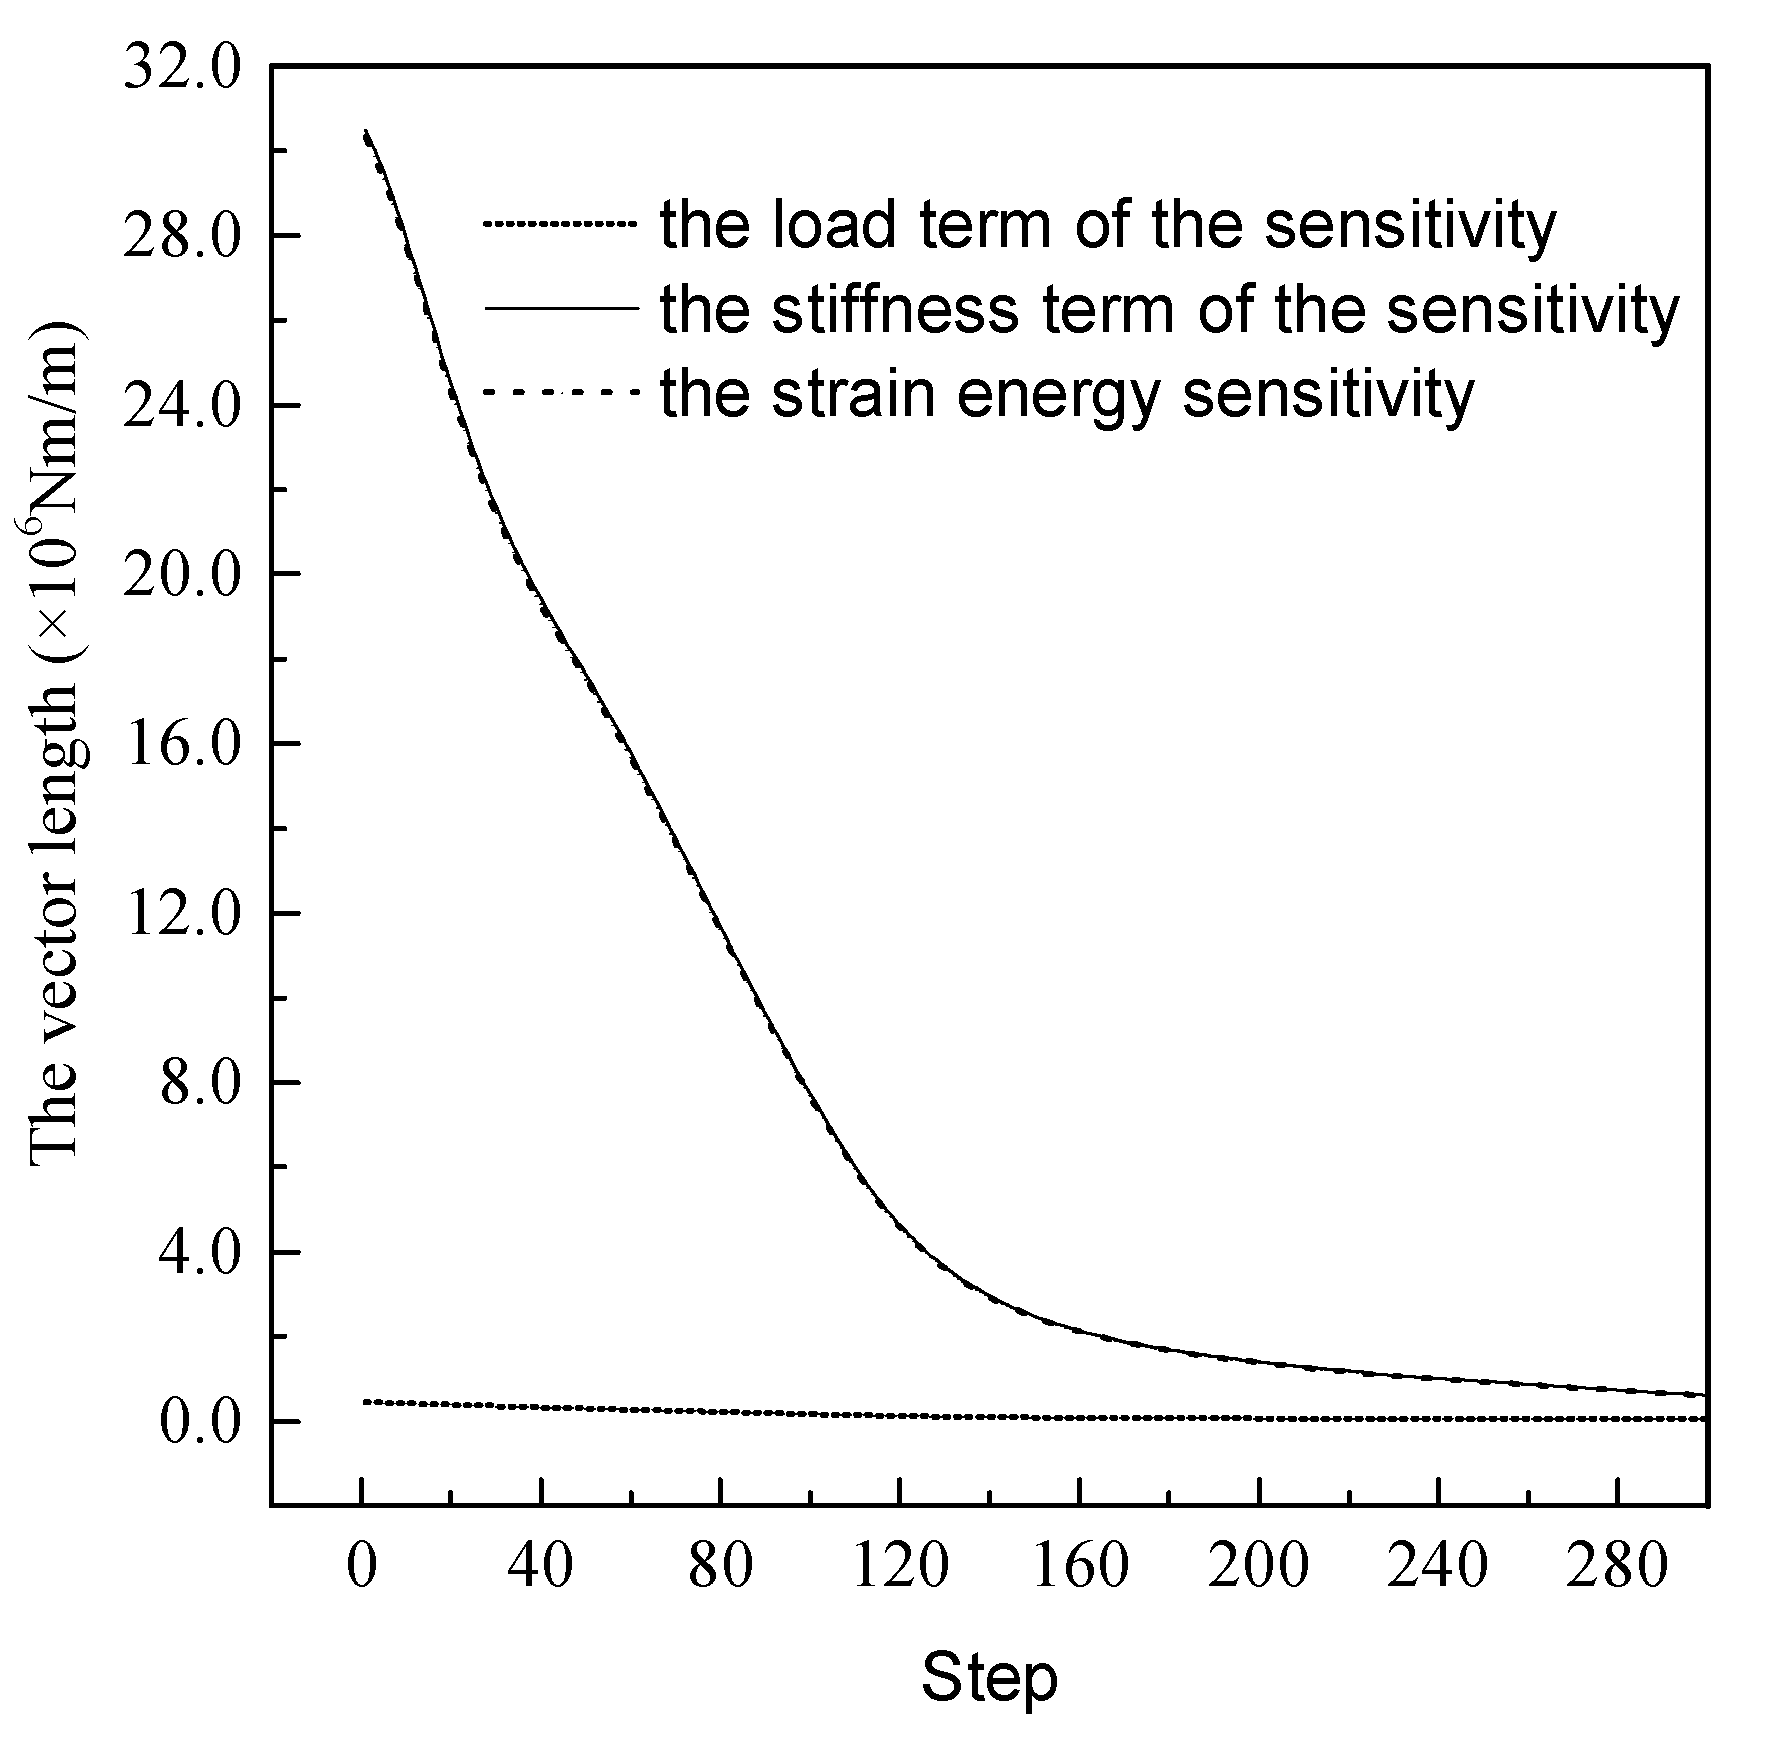
4. Effect of the Load Term on Strain Energy Sensitivity

The load vector F in the global coordinate system can be divided into components of the external load and the self-weight load, which can be expressed by formula (11).
F = F e + F m
Fe and Fm respectively represent the load vector in the global coordinate system formed by external load and self-weight weight. The load vector Fe of the vertical distribution load is the function of the element area and the load vector Fm of the self-weight is a linear function of the thickness t and the element area.
For F = T T F L , Equation (12), the partial derivatives of the load vector in the global coordinate system with respect to zj which is the coordinate of node j, can be obtained as follows.
F z j = ( T T z j F L + T T F L z j )
where T represents the coordinate transformation matrix of the element, and FL represents the load vector in the local coordinate system of the element. means the sum of all nodes.
Correspondingly, the load vector for each element is composed of two parts, as shown in Equation (13).
F L = F Le + F Lm
F Le is the element load vector produced by the external load of the element; F Lm is the element load vector produced by the element weight.
Thus, the Equation (12) can be rewritten as Equation (14),
F z j = ( T T z j F Le + T T F Le z j ) + ( T T F Lm z j + T T z j F Lm )
In the above Equation, the first term is the external load term, and the second term is the structural weight term. When the external load is vertically uniformly distributed qz and the external load remains unchanged in the evolution process, the vertical load vector produced by the element in the global coordinate system is [ 0 0 q z Δ ¯ ] , in which Δ ¯ is the area of the triangular element enclosed by the horizontal projection coordinate of the three nodes. Correspondingly, the self-weight of the element is [ 0 0 q z ] = [ 0 0 Δ ] t ρ . Here, Δ is the area of the triangle element. When the thickness of the shell structure is constant, the role of self-weight and the vertically uniformly distributed qz will play the same role because the relationship between them is fixed.
When the external load forms the load vector, the load of a node is determined according to 1/3 of the sum of the area of the element containing the node. Then, since the curved surface node only changes in z coordinate, the horizontal projection area Δ ¯ remains unchanged. Although the element size changes, the external load keeps constant, namely, F Le z j = 0 .
If the external load is a point load, the change of node position does not change the size of the load and the corresponding load vector. So, F Le z j = 0 . Equation (14) can be written as Equation (15).
F z j = ( T T z j F Le ) + ( T T F Lm z j + T T z j F Lm )
Obviously, the change of the height of the surface causes the change of the mass, which in turn causes the change of the load vector F Lm . It can be seen from Equation (15) that, even if the influence of node coordinates on the element area is ignored in evolution, that is, F Lm z j = 0 , there are still the terms T T z j F Lm and T T z j F Le to be considered.
The strain energy sensitivity is the movement direction of the node, and the accurate consideration of the load term or the omission of the term is expected to have an impact on the structural optimization direction of each evolution step. The structural iteration is expected to have a cumulative impact on the evolutionary results.

5. Structure Iteration

In this paper, the height adjustment method [8,9] is adopted for the shell shape optimization, and the iterative formula is shown in Equation (16).
z j k + 1 = z j k α j k δ
In the formula, k and k + 1 represent the iterative step of evolution, j represents the number of any node in the structure, and α j k represents the sensitivity corresponding to the jth node in the kth step. δ is a tiny positive iteration step size, and the golden section method was adopted to determine the optimal iteration size length.
Formulas (4) or (7) were adopted to calculate the nodal sensitivity according to the need of the comparative research. In the process of structural optimization, all structural weight loads should be updated for the height of the curved surface changes after optimization after every iteration.
Since the projection of the finite element on the xoy plane remained unchanged and the load vector generated by the vertical uniformly distributed load remained unchanged, no update was required. That is, in the height adjustment method, only the height of the surface is adjusted, and the load term of the strain energy sensitivity is expressed in Equation (15).
However, whether the effect of the load term on the strain energy sensitivity significantly depends on the ratio of the load term to stiffness term. The examples in Section 6 were based on triangular shell elements with three nodes for the finite element and sensitivity analysis. As we knew, the triangular shell element was composed of the triangular plane element and the plate element. According to the computational formula of the stiffness matrix of the triangular plane and plate element, the strain matrix is the function of the nodal coordinates and does not include the thickness t; the stiffness matrix of the plane element is a linear function of the thickness t; and the stiffness matrix of the plate element as shown in Equations (17) and (18) is a cubic function of the thickness t. On the other hand, the load term under the vertical load is not related with the thickness and is the function of the element area and the load term under self-weight is a linear function of the thickness t and the element area. So the thickness of the shell was expected to have a great impact on the proportion between the load term and the stiffness term in the nodal strain energy sensitivity.
[ k B ] = [ B ] T [ D ] [ B ] d x d y
[ D ] = E t 3 12 ( 1 υ 2 ) [ 1 υ 0 υ 1 0 0 0 1 υ 2 ]
where [kB] and [B] are the stiffness matrix and the strain matrix of the plate element, respectively; [D] is the elastic matrix; t is the thickness of the shell, ν is the Poisson ratio.
In the following two typical examples, a variety of schemes were designed to investigate the relationship between the vector length values of the load term and the stiffness term on the strain energy sensitivity, and the changes in properties such as structural weight, strain energy, displacement, and shape, etc., to illustrate the influence of the load term of the strain energy sensitivity on structural evolution. The method in this paper was implemented by the Fortran programming language.

6. Case Study

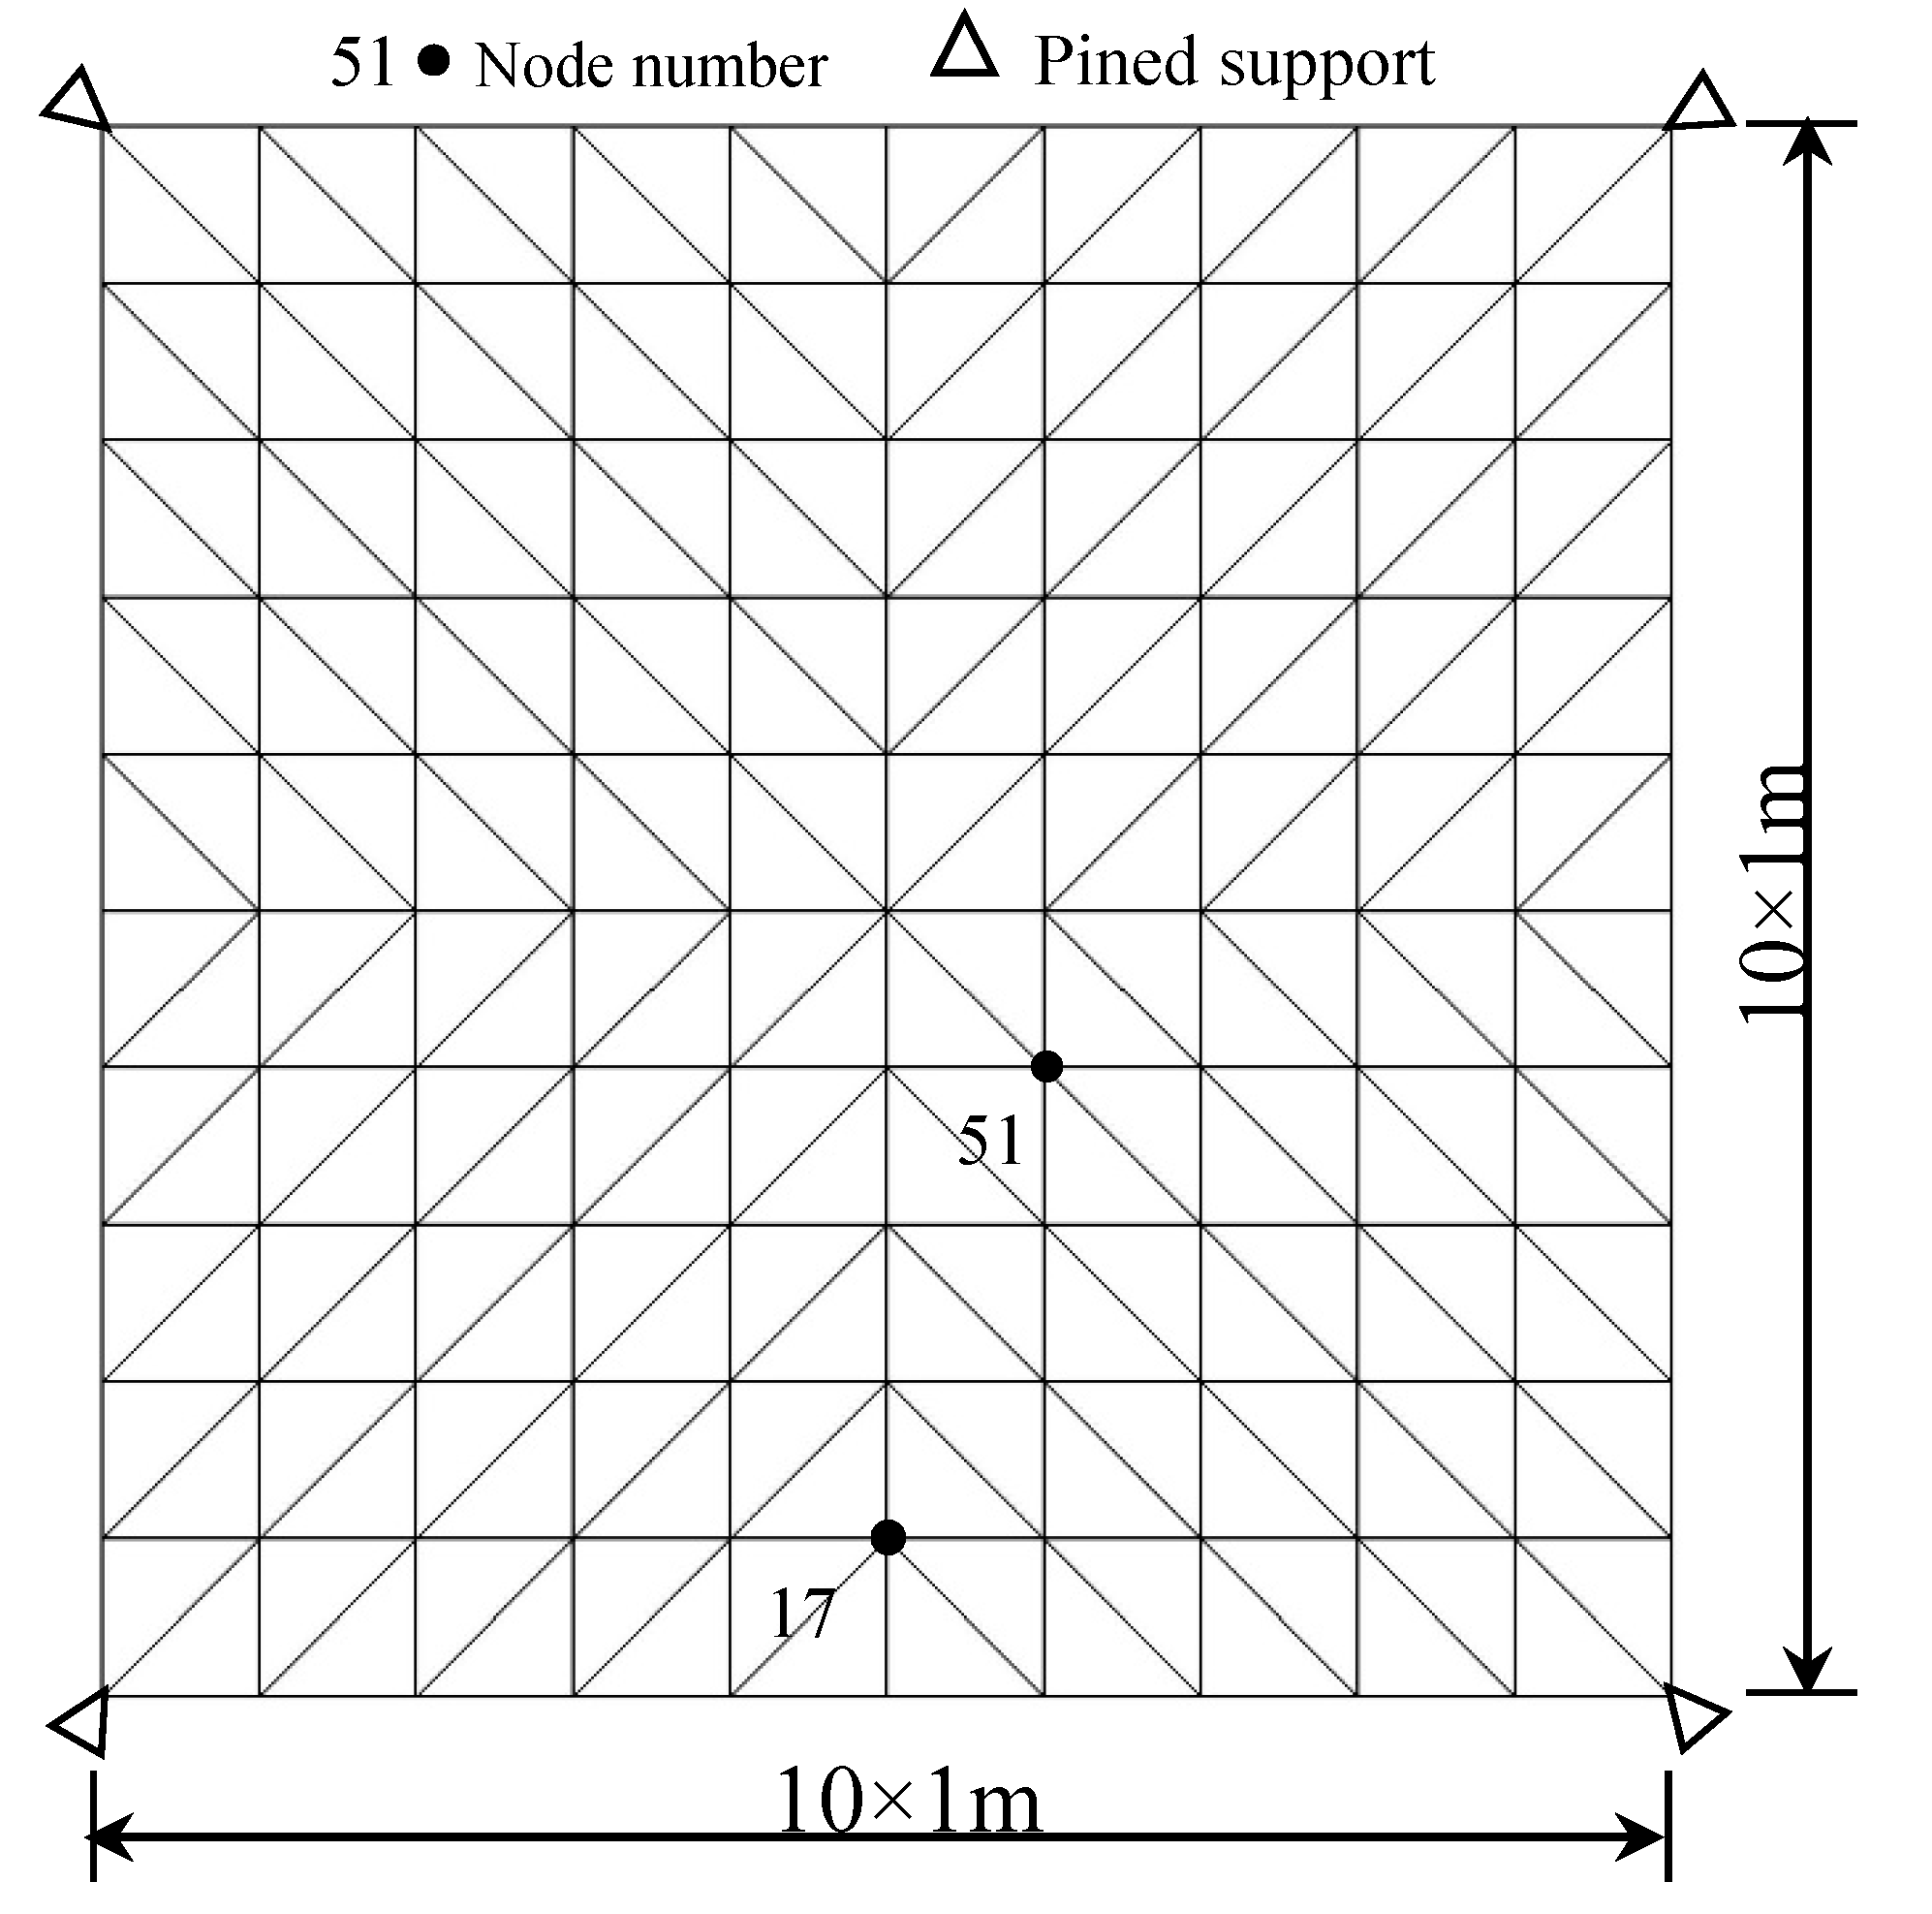
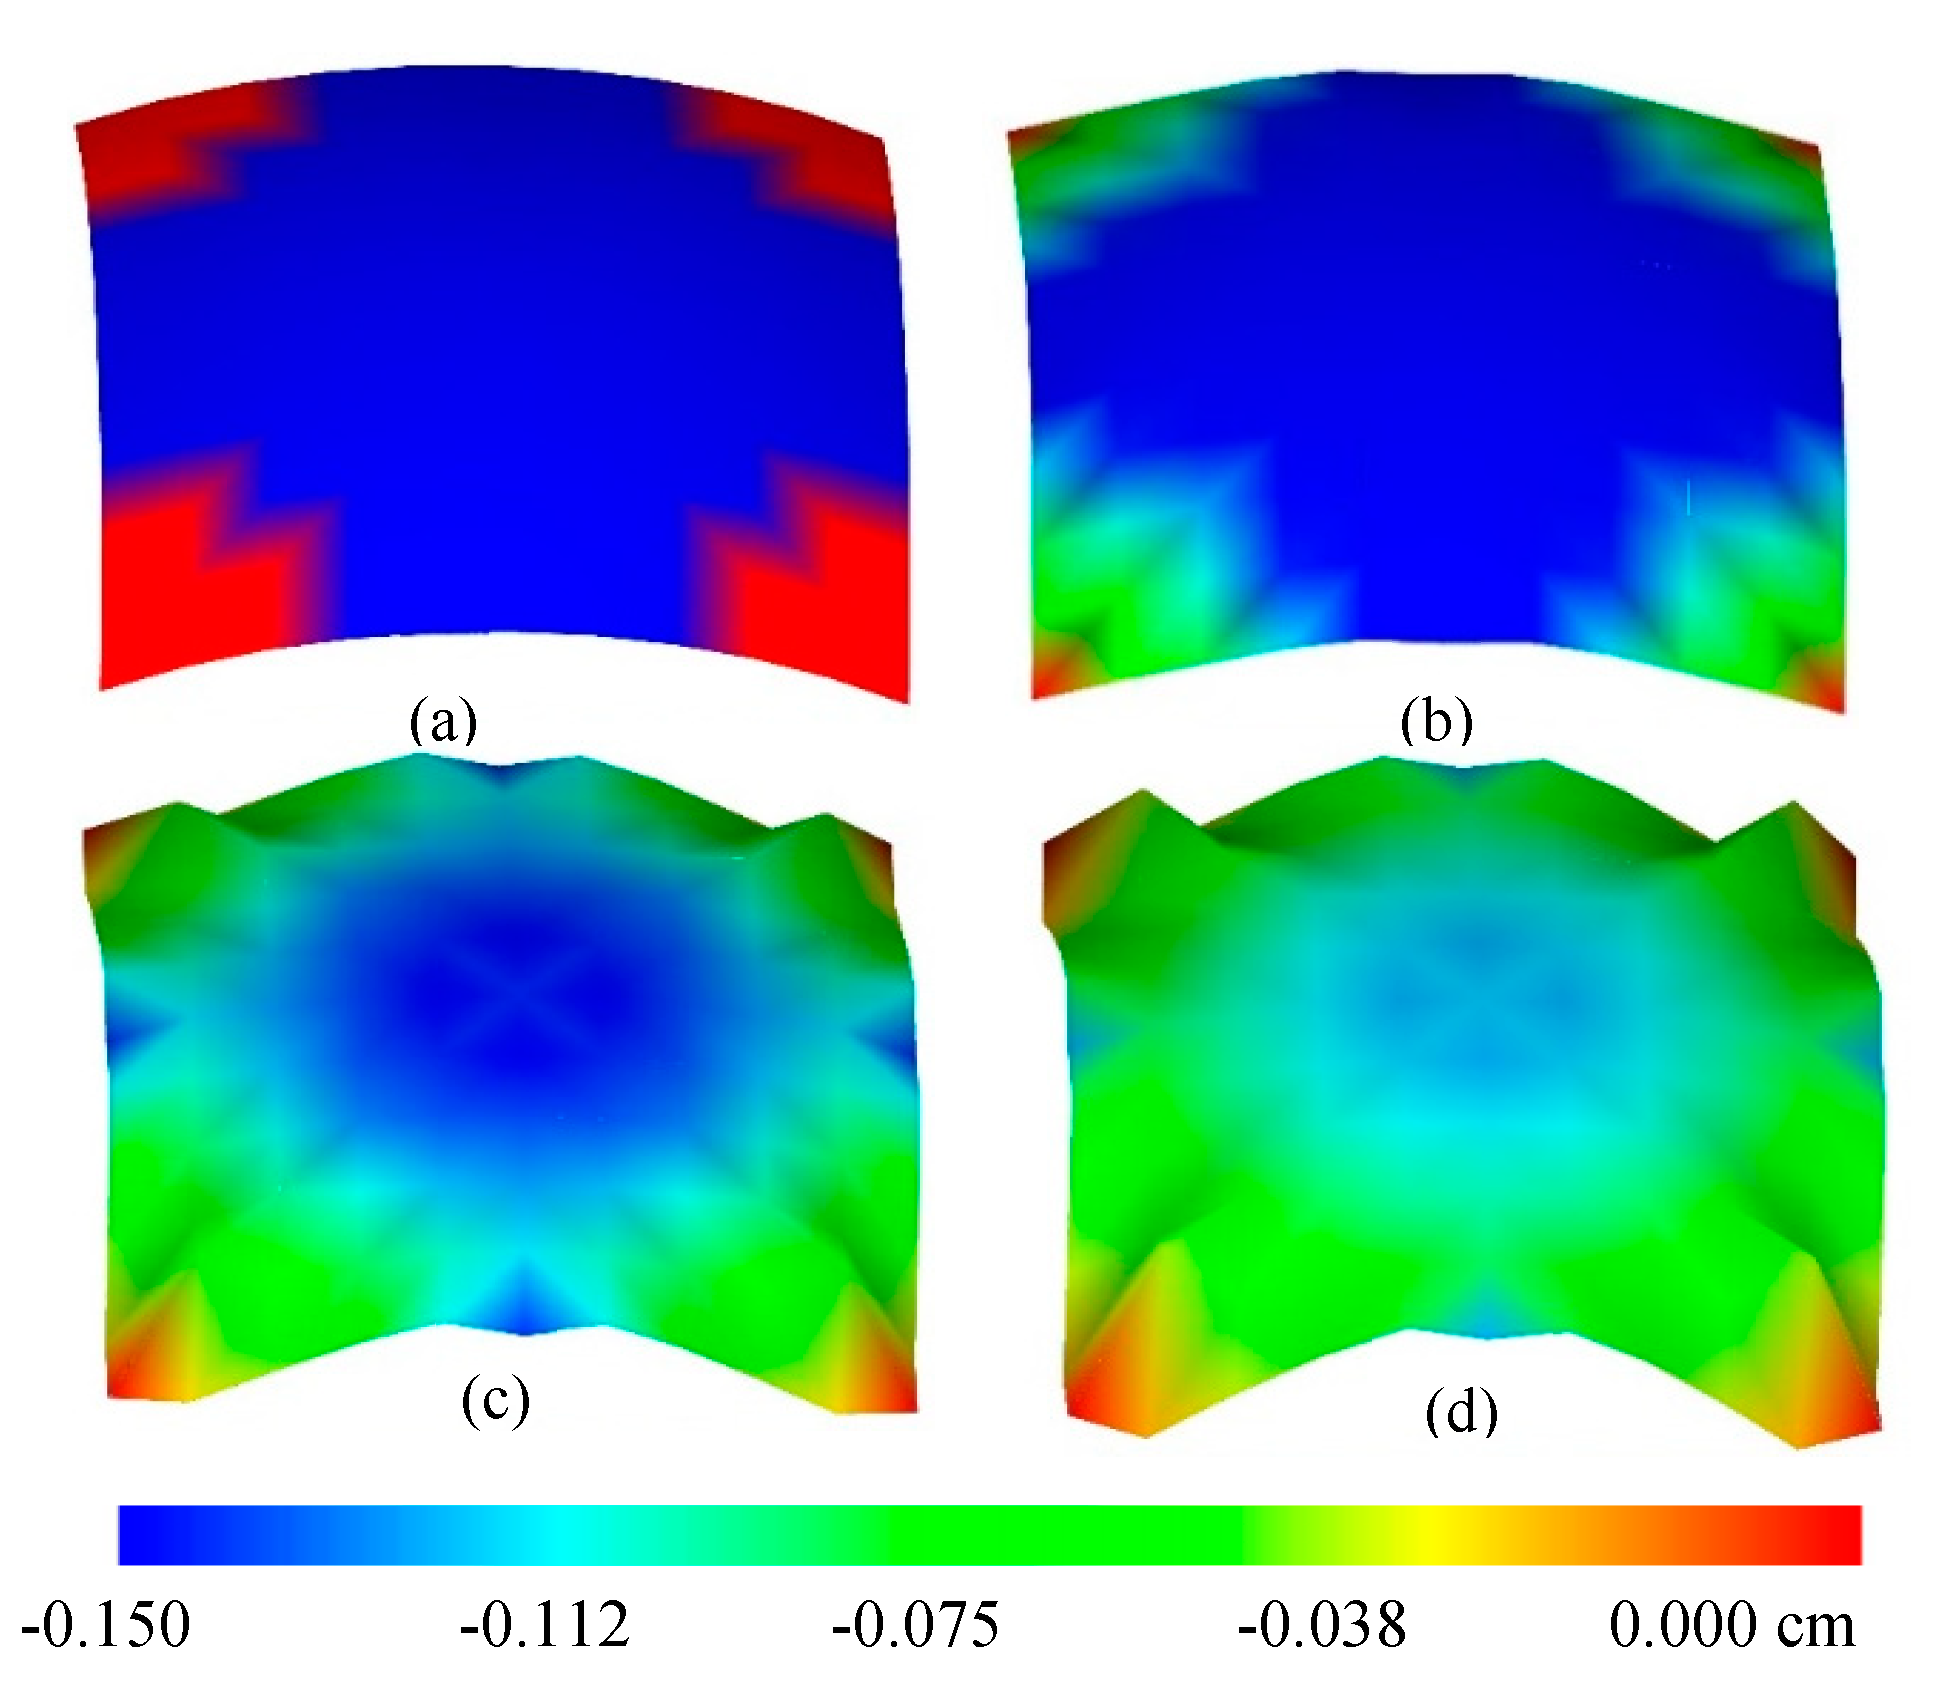
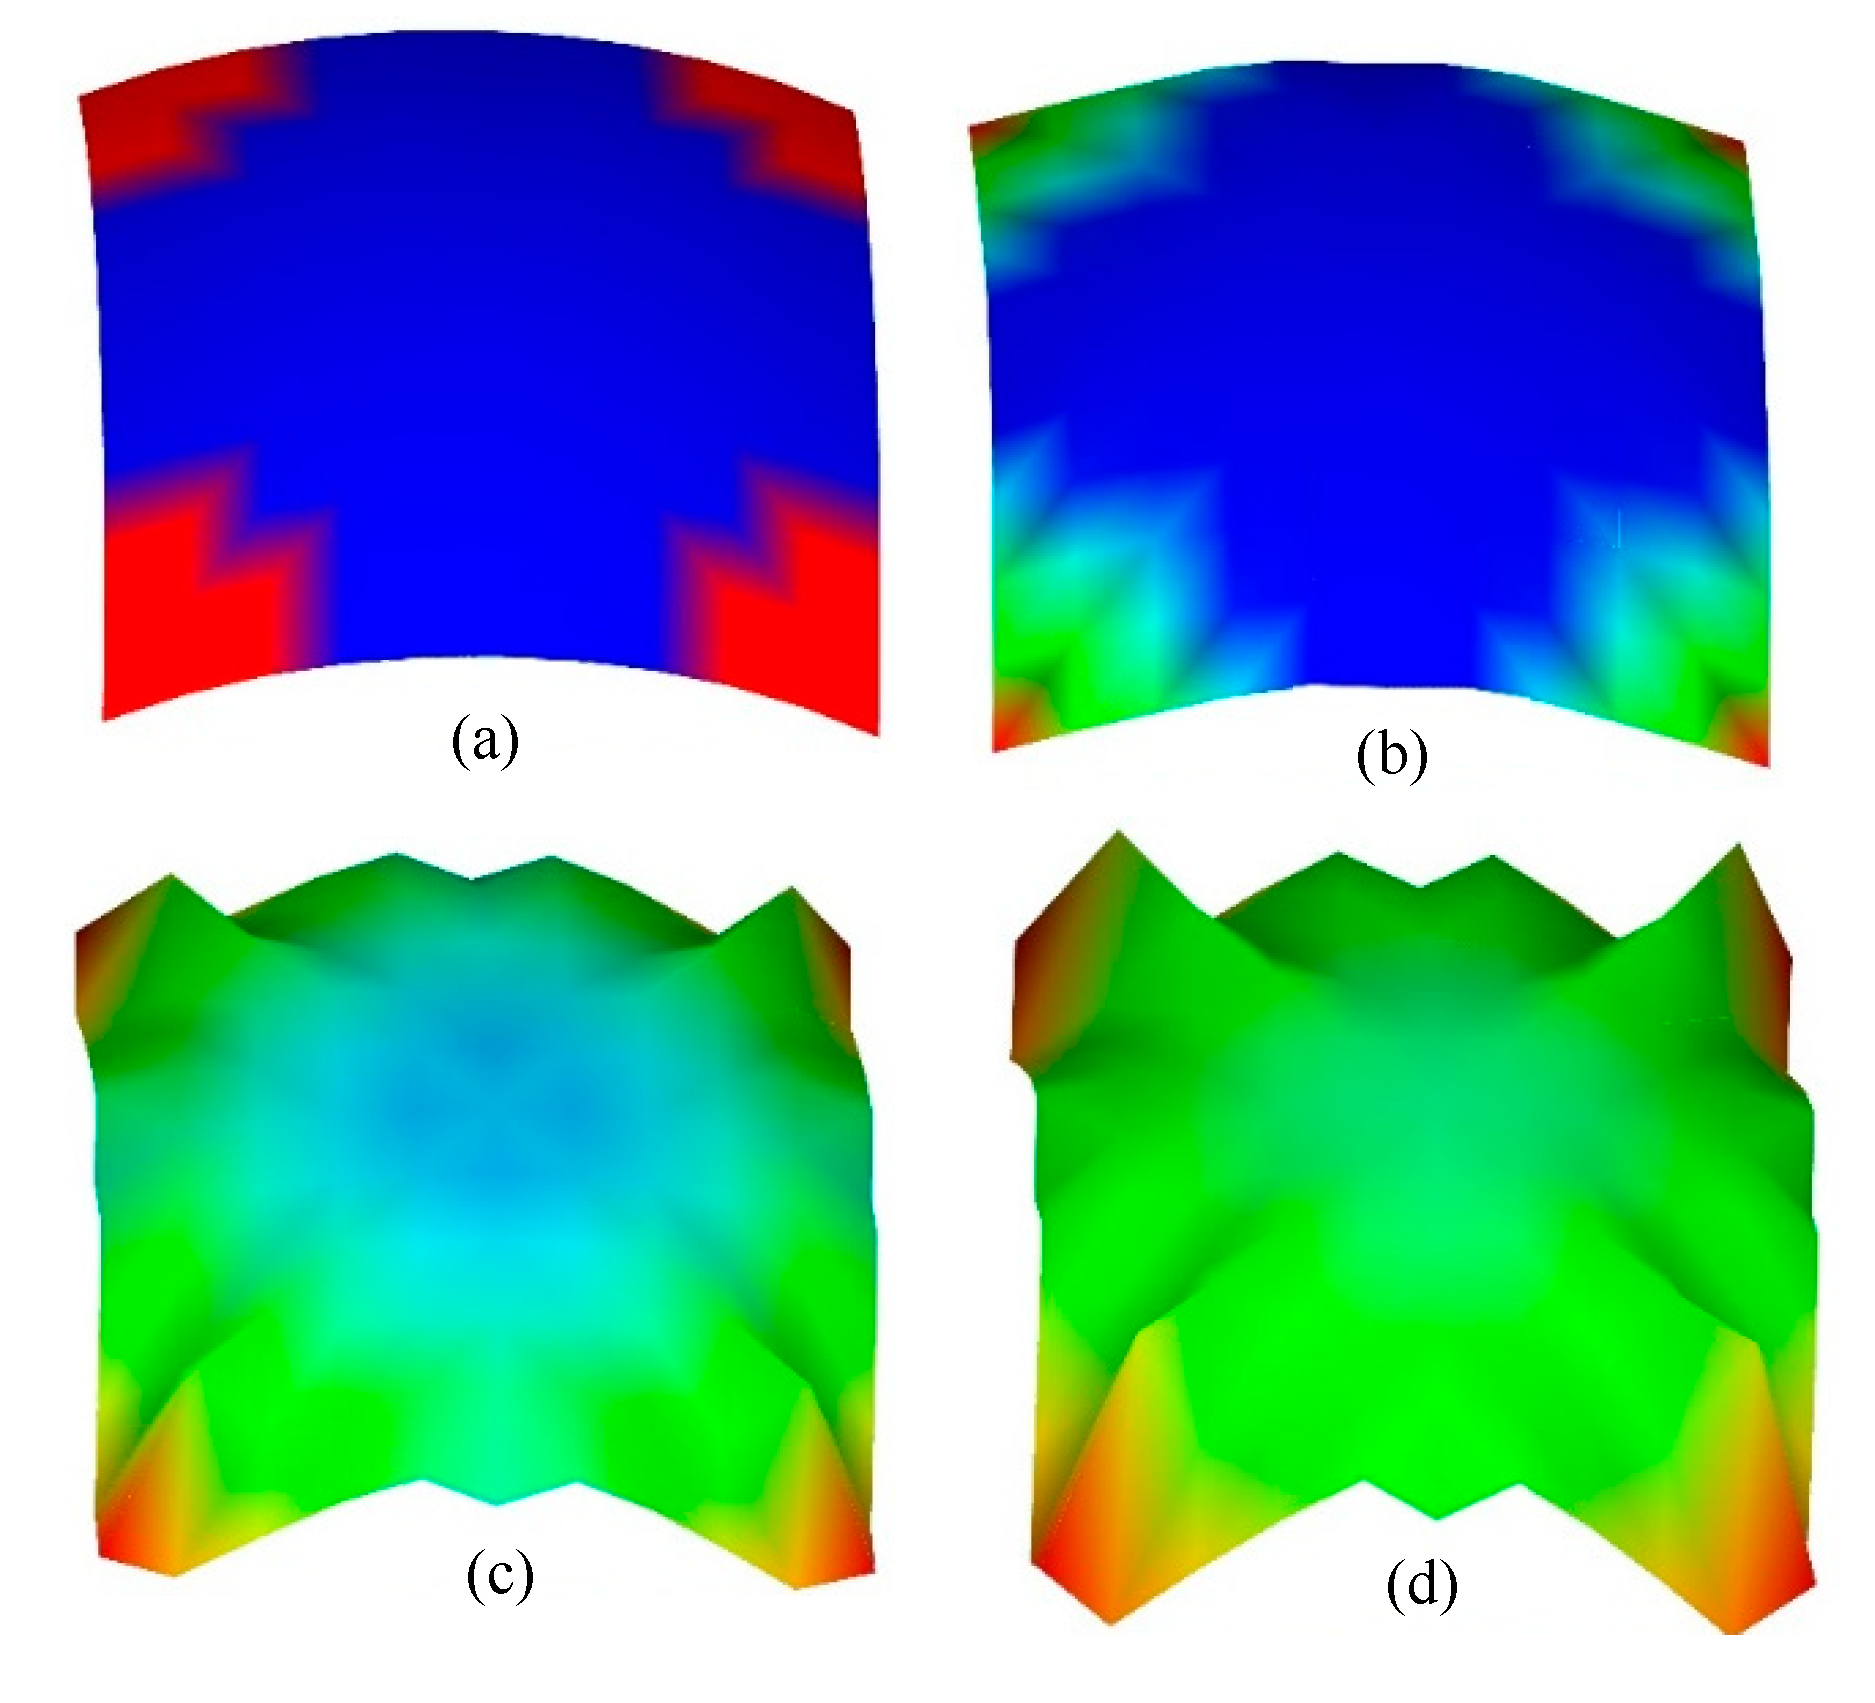
6.1. Example 1: the Shape Optimization of A Spherical Shell

The initial structure was a spherical shell, the spherical radius being R = 10 m, and the spherical equation is z = R 2 ( x 5 ) 2 ( y 5 ) 2 5 2 . The triangular mesh was divided on the 10 m × 10 m square plane and projected onto the surface, and the pinned supports were set at the four corners. The thickness of the sphere was 0.05 m, the Young’s modulus E = 3.0 × 10¹⁰ N/m2, the density was 2500 kg/m3, and the vertical uniformly distributed load was 10 kN/m2. The initial size and supports are shown in Figure 1.
First, three optimization schemes were designed to investigate the effect of the load term on the strain energy sensitivity.
Scheme A: the structural weight was included in the load vector, and the load term was considered in the sensitivity, that is, the structural evolution was carried out according to Equation (7);
Scheme B: the structural weight was included in the load vector, and the load term was not considered in the sensitivity, that is, structural evolution was carried out according to Equation (4), which means that the sensitivity was equal to the stiffness term value of the sensitivity in Scheme A;
Scheme C: the structural weight was not considered in the load, and the load term was not considered in the sensitivity. However, the structural weight was included in the calculation of structural performance at each step, that is, structural evolution was carried out according to Equation (4), which is equivalent to obtaining the strain energy sensitivity according to the calculation principle of structural mechanics when structural weight is not considered.
By comparison, the variation trend of the structural shape, the strain energy, the structural weight, and the displacement distribution of Schemes B and C were the same, and the corresponding values were also equal. This means that the optimization results would be the same whether or not the weight in the load is considered if the strain energy sensitivity does not include the load term. As such, only the results of Schemes A and B are provided here as shown in Figure 2 and Figure 3. As we can see, the displacement distribution gradually changed to a more uniform green (namely, the displacement is close to zero). Comparing the structural shape of Scheme B or C and Scheme A, the node’s coordinates Z of Scheme A subtracted that of Scheme B at the 120th and 248th steps to obtain the surface shape differences, and the results are shown in Figure 4 and Figure 5.
Figure 4 shows that the nodes on the middle and the diagonal line of the shell surface in Scheme A were slightly higher than that in Scheme B. The others in Scheme A were lower than that in Scheme B. The maximum height difference was up to −0.390 m and 0.580 m. The strain energy at Step 120 was equal to 12.2% of that at Step 1 in Scheme A, and 11.5% in Scheme B. The shape difference at Step 248 is shown in Figure 5. Only the nodes on the edge of the shell surface in Scheme A were higher than that of Scheme B. The maximum height difference was up to −1.110 m and 0.710 m. This was 7.1%~11.1% of the span, which was obvious.
Figure 6 shows the variation of strain energy in Schemes A and B. The strain energy of the structure at Step 248 was reduced to 10.6% of the initial structure in Scheme A, and 10.8% in Scheme B. The structural stiffness increased significantly, and the maximum vertical displacement of the structure at Step 248 was 3.0% of that at Step 1 in Scheme A, and 2.2% in Scheme B. The decline speed of the strain energy of the shell surface seemed to be similar whether or not the load term of the strain energy sensitivity was considered.
However, we found some different points. Firstly, Scheme B finished the optimization at Step 248, and Scheme A could continue to decrease the strain energy to 8.65% of the initial structure at Step 1000. Secondly, t he difference of the strain energy and the structural weight increase rate between Schemes A and B for the same step denoted the cumulative impact on the optimization. In Figure 7, the difference in strain energy between Schemes A and B was largest at Step 112, which accounted for 6.6% of the strain energy in Scheme B. It was noted that the shape difference became greater as shown in Figure 4 and Figure 5, although the difference in the strain energy between Schemes A and B was small at Step 248. Figure 8 shows the history of the structural weight increase rate of Schemes A and B. The rate of increase in the structural weight represents the increase percentage, which was equal to the value of the ratio between the structural weights at each evolutionary step, and that of the initial structure subtracts one. During the process of shape adjustment, the structure weight in Scheme A increased more slowly than that in Scheme B after Step 50. The structural weight increased by 24.8% of the initial structure in Scheme A, and 61.5% in Scheme B at Step 248. These cumulative impacts on the structural evolution were due to the load term of the strain energy sensitivity.
To investigate the numerical relationship between the load term, the stiffness term, and the whole value for the sensitivity, the vector length of each sensitivity component and the whole value were calculated according to Equations (8) to (10) for each iteration step, as shown in Figure 9. It can be seen that the load term vector lengths of the strain energy sensitivity were relatively small at the initial stage of evolution, and the stiffness term vector lengths and whole vector length values decreased sharply. The load term vector length and stiffness term vector length were getting closer and closer after Step 40. The influence of the load term on the whole sensitivity value gradually increased.
In order to further analyze the influence of the load term in the sensitivity, the sensitivity of the nodes located in the structural typical position, i.e., no. 17 and 51 shown in the Table 1 and Table 2, was selected for observation. Table 1 shows the 17th node’s load term value SNF of the sensitivity and the whole sensitivity value SNT for partial evolution steps in Scheme A. It can be seen from the table that the signs of the load term value and the whole value were always contrary, and the ratio of their vector length increased significantly after the 30th step. The whole value of sensitivity approached zero, and the load term value of sensitivity became small. The results show that the influence of the load term became obvious.
Table 2 shows the ratio of the load term SNF of strain sensitivity for node no. 51 compared to its whole value SNT, with positive and negative values. The ratio SNF/SNT is obviously larger than that 17th node. Combining the results of the analysis in Figure 9, during the convergence stage the load term of sensitivity would slightly offset the stiffness term, making the vector length of the strain energy sensitivity slightly smaller during the convergent phase.
In order to discuss the role of each item in the load item, another two schemes were designed.
Scheme D: the load term was considered in the sensitivity calculation, but the structure density was set as 0. In this scheme, the sensitivity load term was the first term of Equation (15) only, namely the external load term.
Scheme E: the load term was considered in the sensitivity calculation, but the external load was set as 1N/m2. In this scheme, the sensitivity load term can be approximately considered as containing only the weight, and the structural weight was the main load.
We found it interesting that the results of Schemes A, D, and E were completely the same, they had the same change in the strain energy ratio Ci/C1, the self-weight, and SNF/SNT. The results of Scheme D and E are not shown here. This means that the weight and vertical uniform load played the same role, and the sensitivity load term, the sensitivity stiffness term, and the strain energy sensitivity kept a constant ratio which was mainly determined by the thickness of the shell for the same initial structure. The ratio and size of the self-weight and the vertical load of the structure did not affect the structural evolution process.
In order to verify the role of the thickness of shell, we set the thickness of the shell as 0.02 m, 0.1 m, and 0.2 m, and recalculated the first example from Schemes A and B. The difference in the strain energy between Schemes A and B for the same step for different thickness t was shown in Figure 10. For the thickness t = 0.02 m, the maximum was 24.42% of the strain energy of Scheme B at Step 223; for the thickness t = 0.05 m, the maximum was 6.6% at Step 112; for the thickness t = 0.1 m, the maximum was −6.1% at Step 135; for the thickness t = 0.2 m, the maximum was −4.5 % at Step 47. Moreover, the optimization in Scheme B would terminate early compared to that of Scheme A when the convergence condition was the same. The above differences indicate that the thickness of the shell plays an important role in the relationship between the load term and the stiffness term in the nodal strain energy sensitivity, which was nonlinear and complex; the influence of the thickness on the optimization process would become small when the thickness becomes large.
In summary, the load term had an obvious influence on the strain energy sensitivity at the convergent stage. This produced a cumulative effect in the iteration process as a part of the structural evolutionary direction.

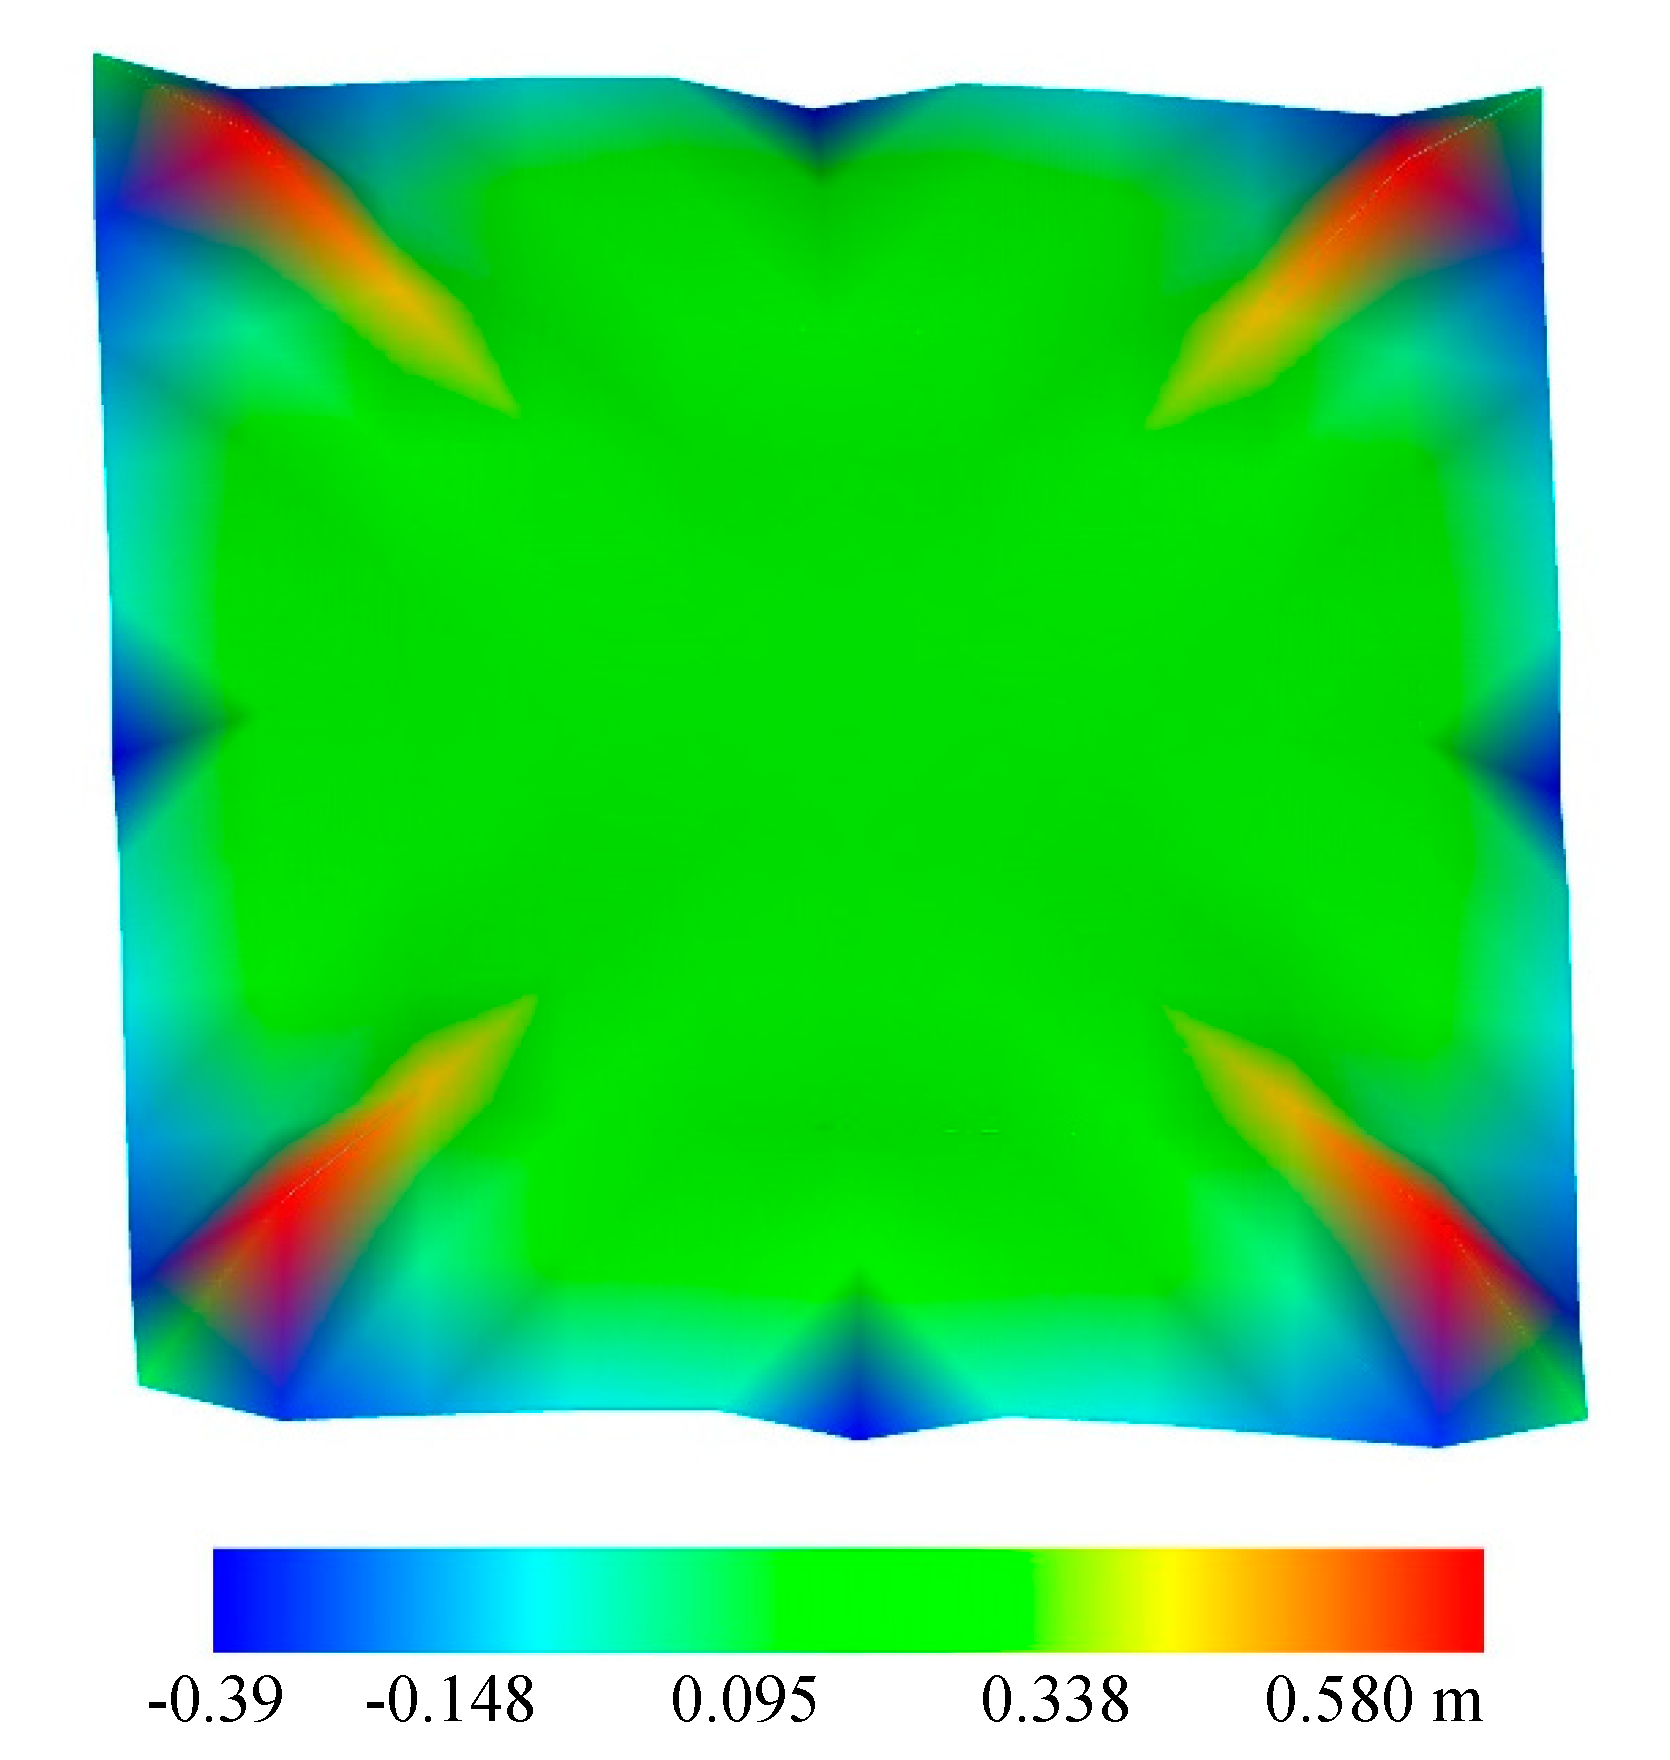
6.2. Example 2: The Shape Optimization of the Shell Roof In the Rolex Learning Center

The Rolex learning center free-form roof in Switzerland was simulated. The plane size was 120 m × 120 m, and a total of 42 key points (6 × 7 and 20 m in grid size) were selected to form the initial surface by B-spline surface technique. The supports were three-way hinge supports, and the key points of the grid and support positions are shown in Figure 11. The concrete elastic modulus was E = 3 × 10⁴ MPa, the Poisson’s ratio v = 0.2, the thickness was 0.2 m, and the uniform load q = 10 kN/m2. This example was consistent with the example in literature [7], but Equation (15) was used for the optimization. All the nodes on the mesh except the supporting points were design variables.
In order to investigate the effect of the load term on the strain energy sensitivity, the structural weight changes were compared for Schemes A and B. The displacement and the strain energy were close. Thus, only the results of the strain energy and the displacement in Scheme A are given here. Figure 12 shows the change of the structural strain energy. The strain energy of the final structure was 14.5% of the initial structure. In Figure 13, the difference in the strain energy between Schemes A and B was largest at Step 111, which accounts for 1.17% of the strain energy in Scheme B. Similar to the discussion in the first example, the thickness of the shell was thick, namely 0.2 m. The contribution of the plate element on the stiffness term was big, and the difference of the strain energy and structural weight between Schemes A and B at the same step was small. The role of the load term can be ignored.
In Figure 14, the vertical displacement of the structure gradually decreased, and the displacement tended to be homogeneous. The corresponding maximum vertical displacement was 4.3% of the initial structure. In Figure 15, the weight of the structures increased all the time, but the increment of the structural weight was slightly lower when the sensitivity load term was taken into account. It can be seen from Figure 16 that the vector length values of the stiffness term and that of the whole sensitivity were close to each other, gradually decreasing with evolution and approaching to the value of the load term, while the vector length value of the load term of the structural strain energy sensitivity was at a much smaller proportion of the whole strain energy sensitivity than that in the first example. This also denotes that the role of the load term is small.

7. Conclusions

The role of the load term on strain energy sensitivity was investigated by analysis of the components of strain energy sensitivity, including the load term and the comparison of various schemes, to study the effect of strain energy sensitive load term on structural evolution.
The results of the numerical examples showed that the load term of strain energy sensitivity accounts for a small proportion of the whole strain energy sensitivity, but it still has a cumulative impact on the structural evolution. The shell thickness had an obvious influence on the role of the load term of the strain energy sensitivity. When the thickness was thin, the load term showed its role in the optimization clearly. Conversely, when the thickness was thick, the role of the load term could be ignored. The load term could influence the increment rate of the structural weight and the strain energy and had an impact on the shape change to some extent. In addition, the numerical examples showed that self-weight had the same role with the external vertical load. The optimization using the strain energy sensitivity method without the load term would terminate early compared to that with the load term when the convergence condition was the same.
At last, for general construction projects, the shape optimization only by the stiffness term of strain energy sensitivity can meet the requirements of engineering, and the load term of strain energy sensitivity can be ignored. However, if the shell thickness is very thin or the higher performance of the structure is required, the strain energy sensitivity with the load term should be considered. This study can extend the results to the other shell elements optimized by the strain energy sensitivity method. The reason was the shell element bearing the force by the membrane stress and the bending stress.

Author Contributions

Conceptualization, B.J.; methodology, C.C. and B.J.; writing—original draft preparation, B.J.; writing—review and editing, B.J., C.C. and J.W. All authors have read and agreed to the published version of the manuscript.

Funding

This research was funded by the National Natural Science Foundation of China, grant number 51968018 and 51578185; and the Science and Technology Innovation Project of the Hainan Science and Technology Association for the Young Elite, grant number 201505.

Conflicts of Interest

The authors declare no conflict of interest.

References

  1. San, B.; Waisman, H.; Harari, I. Analytical and numerical shape optimization of a class of structures under mass constraints and self-weight. J. Eng. Mech. 2020, 146, 1–17. [Google Scholar] [CrossRef]
  2. Ramm, E.; Bletzinger, K.U.; Reitinger, R. Shape optimization of shell structures. Revue Européenne des Éléments Finis 1993, 2, 377–398. [Google Scholar] [CrossRef]
  3. Kiendl, J.; Schmidt, R.; Wüchner, R.; Bletzinger, K.U. Isogeometric shape optimization of shells using semi-analytical sensitivity analysis and sensitivity weighting. Comput. Methods Appl. Mech. Eng. 2014, 274, 148–167. [Google Scholar] [CrossRef]
  4. Tanaka, N.; Honma, T.; Yokosuka, Y. Structural shape optimization of free-form surface shell and property of solution search using firefly algorithm. J. Mech. Sci. Technol. 2015, 29, 1449–1455. [Google Scholar] [CrossRef]
  5. Su, Y.; Ohsaki, M.; Wu, Y.; Zhang, J. A numerical method for form finding and shape optimization of reciprocal structures. Eng. Struct. 2019, 198, 109510. [Google Scholar] [CrossRef]
  6. Xia, Y.; Wu, Y.; Hendriks, M.A.N. Simultaneous optimization of shape and topology of free-form shells based on uniform parameterization model. Autom. Constr. 2019, 102, 148–159. [Google Scholar] [CrossRef]
  7. Cui, C.; Cui, G.; Tu, G.; Chi, X. Structure morphogenesis of free-form surfaces based on B-spline. Jianzhu Jiegou Xuebao J. Build. Struct. 2017, 38, 164–172. [Google Scholar]
  8. Cui, C.; Yan, H. A morphosis technique for curved-surface structures of arbitrary geometries-height adjusting method and its engineering applications. China Civ. Eng. J. 2006, 39, 1–6. [Google Scholar]
  9. Cui, C.; Zheng, H.; Jiang, B. The engineering applications of free form curved-surface by the height adjusting method. In Proceedings of the International Association for Shell and Spatial Structures (IASS) Symposium, Shanghai, China, 10–12 December 2010. [Google Scholar]
  10. Sasaki, M. Structural design of free-curved RC shells—An overview of built works. In Shell Structures for Architecture; Adriaenssens, S., Block, P., Eds.; Routledge Taylor & Francis Group: London, UK; New York, NY, USA, 2014; pp. 259–270. [Google Scholar]
  11. Cui, C.; Jiang, B. A morphogenesis method for shape optimization of framed structures subject to spatial constraints. Eng. Struct. 2014, 77, 109–118. [Google Scholar] [CrossRef]
  12. Cui, C.; Jiang, B.; Wang, Y. Node shift method for stiffness-based optimization of single-layer reticulated shells. J. Zhejiang Univ. Sci. A 2014, 15, 97–107. [Google Scholar] [CrossRef] [Green Version]
  13. Wang, H.; Wu, M. Global shape optimization of free-form cable-stiffened latticed shell based on local optimal solutions. Eng. Struct. 2018, 168, 576–588. [Google Scholar] [CrossRef]
  14. Wei, L.; Zhao, M.; Wu, G.; Meng, G. Truss optimization on shape and sizing with frequency constraints based on genetic algorithm. Comput. Mech. 2005, 35, 361–368. [Google Scholar] [CrossRef]
  15. Papadopoulos, V.; Papadrakakis, M. The effect of material and thickness variability on the buckling load of shells with random initial imperfections. Comput. Methods Appl. Mech. Eng. 2005, 194, 1405–1426. [Google Scholar] [CrossRef]
  16. Shimoda, M.; Okada, T.; Nagano, T.; Shi, J.X. Free-form optimization method for buckling of shell structures under out-of-plane and in-plane shape variations. Struct. Multidiscip. Optim. 2016, 54, 275–288. [Google Scholar] [CrossRef]
  17. Falco, S.A.; Afonso, S.M.B.; Vaz, L.E. Analysis and optimal design of plates and shells under dynamic loads—II: Optimization. Struct. Multidiscip. Optim. 2004, 27, 197–209. [Google Scholar] [CrossRef]
  18. Mi, D.; Yang, R.; Zhou, L.; Liu, Y.; Guo, D. Optimal structural frequency design of stiffened shell. Appl. Mech. Mater. 2012, 157–158, 1636–1639. [Google Scholar] [CrossRef]
  19. Yang, X.; Li, Y. Structural topology optimization on dynamic compliance at resonance frequency in thermal environments. Struct. Multidiscip. Optim. 2014, 49, 81–91. [Google Scholar] [CrossRef]
  20. Bletzinger, K.; Ramm, E. Computational form finding and optimization. In Shell Structures for Architecture: Form Finding and Optimization; Adriaenssens, S., Block, P., Eds.; Routledge Taylor & Francis Group: London, UK; New York, NY, USA, 2014; pp. 45–55. [Google Scholar]
  21. Yang, X.Y.; Xie, Y.M.; Steven, G.P. Evolutionary methods for topology optimisation of continuous structures with design dependent loads. Comput. Struct. 2005, 83, 956–963. [Google Scholar] [CrossRef]
  22. Chen, S.; Wei, Q.; Huang, J. The influence of structural mass on optimization effect of rational criterion methods. Chin. J. Comput. Mech. 2015, 32, 33–40. [Google Scholar]
  23. Bandara, K.; Cirak, F. Isogeometric shape optimisation of shell structures using multiresolution subdivision surfaces. CAD Comput. Aided Des. 2018, 95, 62–71. [Google Scholar] [CrossRef] [Green Version]
  24. Ding, C.; Seifi, H.; Dong, S.; Xie, Y.M. A new node-shifting method for shape optimization of reticulated spatial structures. Eng. Struct. 2017, 152, 727–735. [Google Scholar] [CrossRef]
Figure 1. The initial structure and constraints.
Applsci 10 01947 g001
Figure 2. Z-displacement distribution of structures in Scheme A. The strain energy change ratio: (a) Step 1, 100%; (b) Step 40, 17.5%; (c) Step 120, 12.2%; (d) Step 248, 10.6%.
Applsci 10 01947 g002
Figure 3. Z-displacement distribution of structures in Scheme B. The color bar is the same as Figure 2. The strain energy change ratio: (a) Step 1, 100%; (b) Step 40, 17.6 %; (c) Step 120, 11.5%; (d) Step 248, 10.8%.
Applsci 10 01947 g003
Figure 4. The distribution of the surface height difference of Schemes A and B at Step 120.
Applsci 10 01947 g004
Figure 5. The distribution of the surface height differences of Schemes A and B at Step 248.
Applsci 10 01947 g005
Figure 6. The change ratio of the strain energy of Schemes A and B.
Applsci 10 01947 g006
Figure 7. The difference of the strain energy between Schemes A and B at the same step.
Applsci 10 01947 g007
Figure 8. The change ratio of the structural weight of Schemes A and B.
Applsci 10 01947 g008
Figure 9. The vector length of the load term, the stiffness term, and the whole value of the structural strain energy sensitivity in Scheme A.
Applsci 10 01947 g009
Figure 10. The difference of the strain energy between Schemes A and B at the same step for the different thickness t.
Applsci 10 01947 g010
Figure 11. The size of the initial structure and constraints.
Applsci 10 01947 g011
Figure 12. The change ratio of the strain energy.
Applsci 10 01947 g012
Figure 13. The difference of the strain energy between Schemes A and B at the same step.
Applsci 10 01947 g013
Figure 14. The z-displacement distribution of several structures in the evolution process. (a) Step1, 100%; (b) Step 50, 70.75%; (c) Step 111, 38.94%; (d) Step 296, 14.57%.
Applsci 10 01947 g014
Figure 15. The change ratio of the structural weight.
Applsci 10 01947 g015
Figure 16. The vector length of the load term, the stiffness term and the whole value of the structural strain energy in Scheme A.
Applsci 10 01947 g016
Table 1. Node 17’s strain energy sensitivity values for partial evolution steps.
StepLoad Term SNFStiffness Term SNGWhole Sensitivity SNTSNF/SNT × 100 (%)
1116.54−1486.47−1369.92−8.51
1055.22−555.56−500.34−11.04
2027.67−149.31−121.64−22.75
3016.18−31.12−14.94−108.30
409.68−26.25−16.57−58.41
1206.18−8.74−2.56−241.40
2485.18−6.37−1.19−435.29
Table 2. Node 51’s strain energy sensitivity values for partial evolution steps.
StepLoad Term SNFStiffness Term SNGWhole Sensitivity SNTSNF/SNT × 100 (%)
134.04−20.5913.45253.09
1011.94−6.575.37222.35
205.93−3.09−2.83−209.54
304.55−5.24−0.69−659.42
403.98−5.95−1.97−202.03
1203.35−1.995.3562.74
2482.97−1.311.66178.92

