Featured Application
Authors are encouraged to provide a concise description of the specific application or a potential application of the work. This section is not mandatory.
Abstract
The presence of lubricants on the surface of sheets favors the formation of pores in laser welded seams. This formation process was investigated by means of high-speed X-ray imaging of the full penetration laser beam welding process of two AA6016 aluminum sheets in overlap configuration. The measurement of the growth velocity of the bubbles indicated their sudden growth once they started to form. Further analysis of the X-ray images identified the point of origin of the pores: a few millimeters behind the capillary between the two aluminum sheets. The study shows that the lubricant does not affect the stability of the capillary, which evidences that the formation of these pores is not caused by the fluctuations of the capillary. These results explain for the first time why pore formation cannot be avoided by process strategies, which stabilize the capillary, when welding uncleaned sheets.
1. Introduction
Pores are a fatal defect in welding, as they reduce the strength of the joint. During laser beam welding, pores result from instabilities of the capillary [1,2,3,4,5,6]. Numerical studies [4,7] and experimental results [3,8,9] show that pores result from a collapse of the capillary. Based on this knowledge, there are several approaches to prevent the formation of pores by means of stabilization of the capillary: e.g., by means of power modulation [10], beam shaping [11,12], multi-spot applications [13], very high feed rates [3,14], or spatial beam oscillation [15,16].
Industrial sheet metals are often coated with oil or other lubricants, so-called pre-lubes, which are required for subsequent forming processes. It is generally known that these surface conditions lead to pores within the weld metal [17,18]. Figure 1a shows the cross section of a full penetration weld, welded in overlap configuration, of two uncleaned AA6016 sheets, which were coated in Drylube E1. Figure 1b shows the cross section of a full penetration weld in two AA6016 sheets, which were cleaned by etching the surface to ensure that no lubricants were present. The thickness of the two sheets was 1.2 mm.
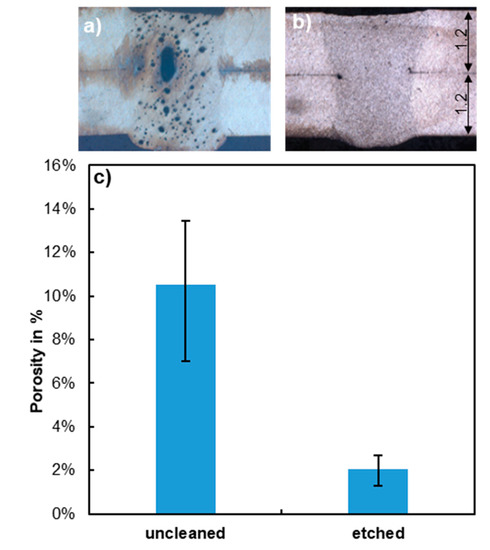
Figure 1.
Cross sections of full penetration welds, welded in overlap configuration with a feed rate of 6 m/min, a beam diameter of about 500 µm, and a laser power of 4.5 kW in two uncleaned sheets, (a), two sheets cleaned by etching, (b) their corresponding porosity, (c), measured from the ratio between the pores’ area and the total cross-sectional area.
The cross section in Figure 1a shows obvious pores. Almost no pores can be found in the cross section of Figure 1b, where no lubricants were present during welding. The ratio between the summarized area of pores in the cross section of the weld and the total area of the cross section of the weld yields the porosity, which quantifies the number of pores in welds. Figure 1b compares the porosity of welds in cleaned and uncleaned samples. The height of the bars represents the average porosity of the three analyzed welds, while the length of the error bars represents the range between the minimum and maximum measured values.
Figure 1c shows a decrease in porosity by about 80% when the surface of the samples is cleaned by etching before they are welded. This proves the significant influence of the presence of a lubricant on the formation of pores during welding of uncleaned sheet metals, which is generally accepted in laser beam welding. However, the formation process of the pores is not well investigated, as most studies cover the stability of the capillary [1,2,3,4,5,6,19]. It has yet to be proven whether the formation of pores during laser beam welding of pre-lube-coated sheets results directly from the evaporation of the lubricants or whether the evaporating lubricants lead to capillary fluctuations that result in the generation of pores in an indirect manner. This article reports on investigations of the formation of pores during full penetration welding of uncleaned pre-lube-coated metal sheets by means of in-situ X-ray imaging in order to identify the origin of the pore formation.
2. Materials and Methods
The process of pore formation was analyzed by means of an X-ray system for in-situ diagnostics during laser beam welding, as presented in [20,21].
The experiments were performed using a disk laser with a wavelength of 1.03 µm. Using an optical setup and an optical fiber with a core diameter of 200 µm, a beam diameter of approximately 500 µm was achieved on the surface of the sample. Two sheets were welded in overlap configuration by full penetration. The thickness of each sheet was 1.2 mm. In order to be suitable for X-ray imaging, the width of the samples (in the direction of the X-rays) was chosen as 6 mm. The length of the samples in the feed rate direction was 80 mm.
The videos were recorded at a frame rate of 1000 Hz and an exposure time of 1 ms. According to [19,20], this is a sufficient temporal resolution to capture the highly dynamic capillary fluctuations in laser beam welding. The acceleration voltage of the X-ray tube was 60 kV with a power of 50 W. The X-ray videos were post-processed with a Kalman filter [22] and a flat field correction. Figure 2 shows a single frame of the X-ray video of the pore formation process during a full penetration laser welding in two uncleaned AA6016 sheets, which is added in the Supplementary Materials. The feed direction of the laser beam in relation to the sample was in the positive x-direction as indicated by the black arrow. Green-, yellow-, and white-colored areas indicate locations of low density. Blue and black areas indicate locations of high density. The dash-dotted line represents the axis of the laser beam, which is surrounded by a region of low density. The extension of this area of low density indicates the geometry of the capillary [23,24], as sketched by the dashed lines. Two sheets were clamped in overlap configuration. In front of the capillary, i.e., on the right-hand side of Figure 2, the upper sheet was separated from the lower sheet by a technical zero gap at the position of the solid white line. Behind the capillary, i.e., on the left-hand side of the capillary in Figure 2, the two sheets were joined by the liquid weld pool. Local areas of low density can be seen in the weld pool on the left side of the capillary. These areas indicate bubbles that are filled with gas. If these bubbles remain in the weld pool until they reach the solidification zone at the rear of the weld pool, they solidify as pores in the resulting seam.
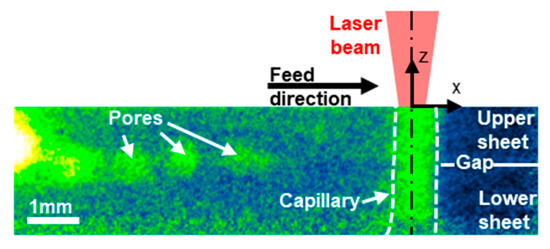
Figure 2.
Single frame of an X-ray video of the pore formation process during welding in overlap configuration of uncleaned AA6016 sheets with a feed rate of 12 m/min, a beam diameter of 500 µm, and a laser power of 8.5 kW. Green-, yellow-, and white-colored areas indicate zones of low density.
3. Results
The first step analyzed the point of origin and the growth rate of the pores by investigating single X-ray images. In order to investigate the interaction between the process of pore formation and the behavior of the capillary, the stability of the capillary was investigated in the second step.
3.1. Point of Origin and Growth Rate of the Pores
Figure 3 shows single frames of an X-ray video of the process of pore formation, which is added in the Supplementary Materials, in steps of 5 ms. The process of pore formation is particularly well visible in the single X-ray images of welds processed with a high laser power and a high feed rate. For the sake of visibility, the investigation of single X-ray images is presented through the results of experiments at a high laser power of P = 8.5 kW and a high feed rate of 12 m/min. The dotted white line represents the position of the gap between the two sheets. The feed resulted from the movement of the sample from right to left, as described above. The red dashed line represents this movement by the displacement of a fixed local position on the sample, which is highlighted by red triangles. The feed rate of 12 m/min and the time step of 5 ms lead to the displacement of the triangle by 1 mm per 5 ms. Three individual bubbles can be identified in each frame of Figure 3 for 450 ms ≤ t ≤ 465 ms and are highlighted with white dashed circles. In order to indicate the growth and movement of these bubbles, white dashed lines interpolate their positions in the single frames.
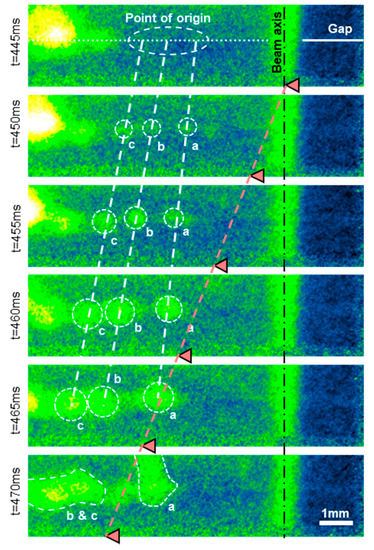
Figure 3.
Determination of the point of origin of the pores by extrapolation across single frames of an X-ray video showing the formation of pores. Two uncleaned AA6016 sheets were welded in overlap configuration with a feed rate of 12 m/min, a beam diameter of 500 µm, and a laser power of 8.5 kW.
The comparison between the inclination of the white dashed lines and the inclination of the red dashed line showed that the velocity of the movement of the bubbles in x-direction was lower than the welding feed rate. No significant movement in the z-direction was observed. The bubbles appeared at t = 450 ms in the weld pool a few millimeters behind the capillary (on the left-hand side of the capillary in Figure 3) at the gap level between the two sheets (the dotted line at t = 445 ms). From this, it can be concluded that the bubbles originate at the gap’s level (the dotted line at t = 445 ms) but form in the weld pool at the locations where the dashed white lines cross the dotted line, which is a few millimeters behind the capillary, as highlighted by the dashed ellipse.
During their movement in the weld pool, the bubbles grew until bubble “a” reached the surface of the weld pool at t = 470 ms, while bubbles “b” and “c” coalesced at the same time. Figure 4 shows the growth of the three bubbles with their average diameter and their growth velocity as a function of time. The data points represent the average diameter and average growth velocity of bubbles “a”, “b”, and “c”. The length of the error bars indicates the range between the minimum and maximum measured values within three measurements.
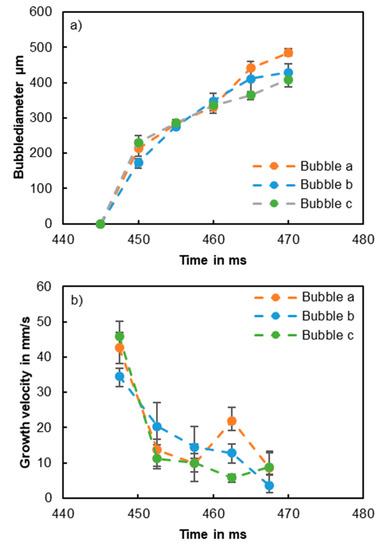
Figure 4.
Average diameter, (a), and average growth velocity, (b), of bubbles “a”, “b”, and “c” during welding in overlap configuration of uncleaned AA6016 sheets with a feed rate of 12 m/min, a beam diameter of about 500 µm, and a laser power of 8.5 kW.
Starting from a bubble diameter of 0 mm at t = 445 ms, Figure 4a shows that the bubbles grew continuously after they appeared. As shown in Figure 4b, the highest growth velocity of all observed bubbles was present at the beginning of their growing process. This indicated a sudden growth of the bubbles and confirmed the validity of the determined origin of the pores in Figure 3.
3.2. Stabillity of the capillary
As mentioned in the introduction, partial penetration welding of aluminum alloys leads to fluctuation and collapse of the capillary, which result in the formation of pores [1,2,3]. However, the single frames of the X-ray video shown in Figure 3 did not show any capillary collapse; pores, nevertheless, still formed. Different from Section 3.1, the entire image sequence of the X-ray videos had to be analyzed in order to quantify the stability of the capillary. Figure 5 shows the distribution of the average intensity and its corresponding temporal standard deviation of greyscale values of the X-ray video, which result from the same experiments as the cross sections shown in Figure 1.
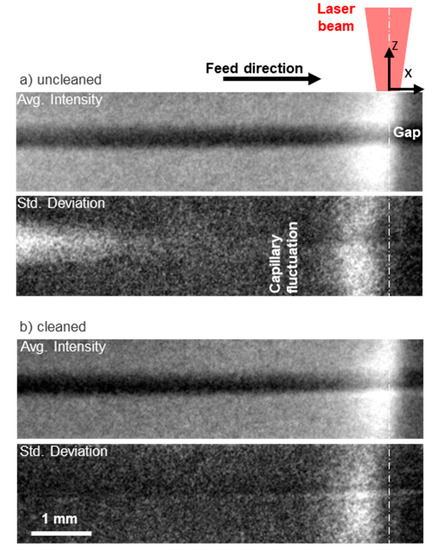
Figure 5.
Distribution of the standard deviation (std. deviation) of the greyscale of the X-ray videos of welds welded with a feed rate of 6 m/min, a beam diameter of about 500 µm, and a laser power of 4.5 kW in overlap configuration of uncleaned sheets, (a, and sheets cleaned by etching, b). Avg. intensity refers to the average intensity in both cases.
The vertical dash-dotted line represents the axis of the laser beam. The average intensity images (avg. intensity) represent the mean greyscale of each pixel averaged over all frames of the X-ray videos after the process reached steady-state condition. White areas highlight locations that exhibit a low density in the majority of the frames, like the capillary.
The standard deviation images (std. deviation) represent the temporal standard deviation of the greyscale of each pixel over all frames of the X-ray videos after the process reached steady-state condition. The greyscale of the standard deviation images quantifies the local fluctuations. White areas highlight locations with strong process fluctuations, like the fluctuations of the capillary or the moving pores.
The white areas, which surround the beam axis in the average intensity distribution images, show the average shape of the capillary in the x-z-plane. The distribution of the standard deviation showed that the majority of the capillary’s fluctuations were located at a significant distance behind the beam axis. The comparison between the average intensity images and their corresponding standard deviation images pointed out that this location coincided with the average position of the rear wall of the capillary. The standard deviation images further proved that the rear wall of the capillary was the only fluctuating part of the capillary, regardless of whether the samples that were welded were uncleaned (Figure 5a) or cleaned (Figure 5b). A comparison of these results with Figure 1 showed that porosity in a full penetration weld was not connected with the presence of the fluctuation in the rear wall of the capillary.
In the standard deviation images of Figure 5a, an additional region of strong fluctuations can be identified on the left-hand side, far behind the capillary. This resulted from a high number of moving and growing pores located in this position and was only observed when welding uncleaned sheets.
In order to quantitatively compare the fluctuations observed during welding sheets with different surface conditions, the average greyscale of each vertical pixel column was determined from the standard deviation images shown in Figure 5. Figure 6 shows the resulting mean standard deviation as a function of the distance x from the beam axis when welding sheets with cleaned (blue curve) or uncleaned (red curve) surfaces. The position of the beam axis, i.e., the position of the capillary, is represented by the vertical dash-dotted line at x = 0 mm. The curves represent the average of three values of the mean standard deviation of three investigated welds for each corresponding surface condition. Large values indicate locations with strong process fluctuations, like the fluctuations of the capillary or moving pores. The scatter band represents the minimum and maximum determined values of three investigated welds for each surface condition.
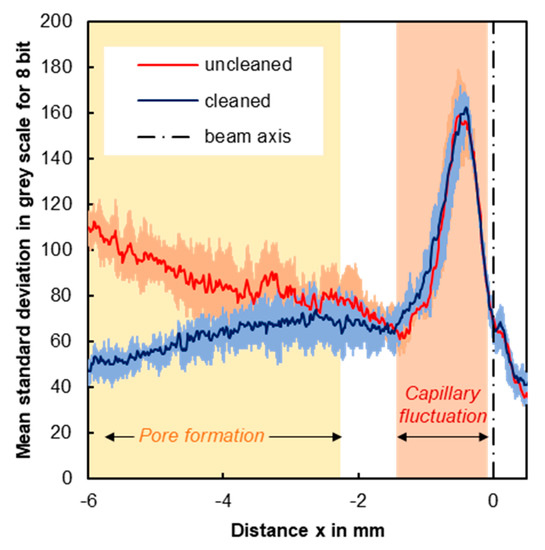
Figure 6.
Mean standard deviation of the greyscale of the X-ray videos of welds welded with a feed rate of 6 m/min, a beam diameter of about 500 µm, and a laser power of 4.5 kW in overlap configuration of uncleaned sheets (red) and of sheets cleaned by etching (blue).
The white area on the left-hand side of the standard deviation image of Figure 5a identifies the region of pore formation when welding uncleaned sheets with a feed rate of 6 m/min and a laser power of 4.5 kW. This region is represented by the yellow highlighted area in Figure 6. The red highlighted area represents the area where the fluctuations of the rear wall of the capillary are located, as determined in Figure 5a,b.
For both investigated surface conditions, the maximum deviation is found in the red highlighted area at x ≈ −0.5 mm on the rear wall of the capillary. Additionally, both curves were approximately congruent within this region. This proved that the fluctuation of the rear wall of the capillary was always present in the case of full penetration welding and was not influenced by the contamination of the sheets’ surface. As shown in Figure 1, no pores were formed when welding cleaned sheets despite the presence of this fluctuation of the rear wall of the capillary. This evidenced that the observed pore formation was not related to the fluctuations of the rear wall of the capillary.
When welding uncleaned sheets (red curve), a continuous increase in the mean standard deviation was found at a significant distance behind the capillary in the yellow highlighted area. This increase resulted from the growth and movement of the bubbles.
The results showed that the contamination of the surface did not affect the stability of the capillary and that pore formation was not connected with either a collapse or fluctuations of the capillary. In conclusion, pores formed in the weld pool through the evaporation of the lubricant, which was enclosed in the gap. These findings explained why these pores cannot be avoided by process strategies like high-speed welding or beam oscillation, which are known to impede the formation of process pores [3,15,16,25]. The effective range of these strategies is limited to the stabilization of the capillary; thus, these optimizations do not impede the formation and growth of pores in the weld pool behind the capillary.
4. Conclusions
The contamination of the surface of aluminum sheets with lubricants leads to a high porosity in the resulting welds. The formation of these pores was analyzed by means of high-speed X-ray imaging during full penetration welding of aluminum sheets with surfaces contaminated with Drylube E1 as a pre-lube. The comparison with the welding process of cleaned sheets showed that the stability of the capillary is not influenced by the contamination and pores do not form as a result of capillary instabilities. The analysis showed that the origin of the pores was located at a significant distance behind the capillary. This explains why pores cannot be avoided by process strategies, which stabilize the capillary, e.g., high-speed welding and beam oscillation.
Supplementary Materials
The following are available online at https://www.mdpi.com/2076-3417/10/6/2077/s1, Video S1: X-ray_Pore_Formation.
Author Contributions
Investigation, J.L.; Writing—original draft, C.H.; Writing—review & editing, R.W. and T.G. All authors have read and agreed to the published version of the manuscript.
Funding
This research was supported by Constellium.
Conflicts of Interest
The authors declare no conflicts of interest. The funders had no role in the design of the study; in the collection, analyses, or interpretation of data; in the writing of the manuscript, or in the decision to publish the results.
References
- Heider, A.; Sollinger, J.; Abt, F.; Boley, M.; Weber, R.; Graf, T. High-Speed X-Ray Analysis of Spatter Formation in Laser Welding of Copper. Phys. Procedia 2013, 41, 112–118. [Google Scholar] [CrossRef]
- Matsunawa, A.; Mizutani, M.; Katayama, S.; Seto, N. Porosity formation mechanism and its prevention in laser welding. Weld. Int. 2003, 17, 431–437. [Google Scholar] [CrossRef]
- Fetzer, F.; Hagenlocher, C.; Weber, R.; Graft, T. Geometry and stability of the capillary during deep-penetration laser welding of AlMgSi at high feed rates. J. Opt. Laser Technol. 2020. submitted. [Google Scholar]
- Lin, R.; Wang, H.-P.; Lu, F.; Solomon, J.; Carlson, B.E. Numerical study of keyhole dynamics and keyhole-induced porosity formation in remote laser welding of Al alloys. Int. J. Heat Mass Transf. 2017, 108, 244–256. [Google Scholar] [CrossRef]
- Otto, A.; Koch, H.; Leitz, K.-H.; Schmidt, M. Numerical Simulations—A Versatile Approach for Better Understanding Dynamics in Laser Material Processing. Phys. Procedia 2011, 12, 11–20. [Google Scholar] [CrossRef]
- Chang, B.; Allen, C.; Blackburn, J.; Hilton, P.; Du, D. Fluid Flow Characteristics and Porosity Behavior in Full Penetration Laser Welding of a Titanium Alloy. Met. Mater. Trans. A 2014, 46, 906–918. [Google Scholar] [CrossRef]
- Pang, S.; Chen, W.; Wang, W. A Quantitative Model of Keyhole Instability Induced Porosity in Laser Welding of Titanium Alloy. Met. Mater. Trans. A 2014, 45, 2808–2818. [Google Scholar] [CrossRef]
- Berger, P.; Hügel, H.; Graf, T. Understanding Pore Formation in Laser Beam Welding. Phys. Procedia 2011, 12, 241–247. [Google Scholar] [CrossRef]
- Xu, J.; Rong, Y.; Huang, Y.; Wang, P.; Wang, C. Keyhole-Induced Porosity Formation during Laser Welding. J. Mater. Process. Technol. 2018, 252, 720–727. [Google Scholar] [CrossRef]
- Heider, A.; Stritt, P.; Hess, A.; Weber, R.; Graf, T. Process Stabilization at welding Copper by Laser Power Modulation. Phys. Procedia 2011, 12, 81–87. [Google Scholar] [CrossRef]
- Volpp, J. Keyhole stability during laser welding—Part II: Process pores and spatters. Prod. Eng. 2016, 11, 9–18. [Google Scholar] [CrossRef]
- Schaefer, M.; Kessler, S.; Fetzer, F.; Graf, T. Influence of the focal position on the melt flow during laser welding of steel. J. Laser Appl. 2017, 29, 12010. [Google Scholar] [CrossRef]
- Hayashi, T.; Matsubayashi, K.; Katayama, S.; Abe, N.; Matsunawa, A.; Ohmori, A. Reduction mechanism of porosity in tandem twin-spot laser welding of stainless steel. Weld. Int. 2003, 17, 12–19. [Google Scholar] [CrossRef]
- Hagenlocher, C.; Fetzer, F.; Weber, R.; Graf, T. Benefits of very high feed rates for laser beam welding of AlMgSi aluminum alloys. J. Laser Appl. 2018, 30, 012015. [Google Scholar] [CrossRef]
- Fetzer, F.; Sommer, M.; Weber, R.; Weberpals, J.-P.; Graf, T. Reduction of pores by means of laser beam oscillation during remote welding of AlMgSi. Opt. Lasers Eng. 2018, 108, 68–77. [Google Scholar] [CrossRef]
- Zhang, C.; Yu, Y.; Chen, C.; Zeng, X.; Gao, M. Suppressing porosity of a laser keyhole welded Al-6Mg alloy via beam oscillation. J. Mater. Process. Technol. 2019. [Google Scholar] [CrossRef]
- Al Shaer, A.W.; Li, L.; Mistry, A. The effects of short pulse laser surface cleaning on porosity formation and reduction in laser welding of aluminium alloy for automotive component manufacture. Opt. Laser Technol. 2014, 64, 162–171. [Google Scholar] [CrossRef]
- Yang, G.; Ma, J.; Wang, H.-P.; Carlson, B.; Kovacevic, R. Studying the effect of lubricant on laser joining of AA 6111 panels with the addition of AA 4047 filler wire. Mater. Des. 2017, 116, 176–187. [Google Scholar] [CrossRef]
- Tsukamoto, S.; Kawaguchi, I.; Arakane, G.; Honda, H. Keyhole behavior in high power laser welding. In Proceedings of the First International Symposium on High-Power Laser Macroprocessing, Osaka, Japan, 27 May 2002; pp. 251–257. [Google Scholar]
- Abt, F.; Boley, M.; Weber, R.; Graf, T.; Popko, G.; Nau, S. Novel X-ray system for in-situ diagnostics of laser based processes—First experimental results. Phys. Procedia 2011, 12, 761–770. [Google Scholar] [CrossRef]
- Boley, M.; Fetzer, F.; Weber, R.; Graf, T. High-speed x-ray imaging system for the investigation of laser welding processes. J. Laser Appl. 2019, 31, 042004. [Google Scholar] [CrossRef]
- Kalman, R.E. A New Approach to Linear Filtering and Prediction Problems. J. Basic Eng. 1960, 82, 35–45. [Google Scholar] [CrossRef]
- Lind, J.; Fetzer, F.; Blazquez-Sanchez, D.; Weidensdörfer, J.; Weber, R.; Graf, T. High-speed X-ray Imaging of the Laser Cutting Process. In Proceedings of the ICALEO, Orlando, FL, USA, 7–10 October 2019. [Google Scholar]
- Lind, J.; Fetzer, F.; Blazquez-Sanchez, D.; Weidensdörfer, J.; Weber, R.; Graf, T. Geometry and Absorptance of the Cutting Fronts during Laser Beam Cutting. J. Laser Appl. 2020. submitted. [Google Scholar]
- Heinen, P.; Eichler, F.; Haeusler, A.; Olowinsky, A.; Aden, M.; Gillner, A.; Poprawe, R. Influence of spatial power modulation on pore and crack formation in laser beam welding of aluminum. J. Laser Appl. 2019, 31, 022013. [Google Scholar] [CrossRef]


© 2020 by the authors. Licensee MDPI, Basel, Switzerland. This article is an open access article distributed under the terms and conditions of the Creative Commons Attribution (CC BY) license (http://creativecommons.org/licenses/by/4.0/).