Abstract
Large-scale instability of a landslide body, sliding down a bank slope and entering water at a high speed, arouses landslide surges. Taking the water entry point as a source point, they spread rapidly to surrounding areas, increasing the danger risk of vessel passages in the water area. In this paper, adopting an orthogonal experimental design method, based on the test data, the Three Gorges Reservoir area was derived in order to calculate the height of the first wave of the bank landslide surge: to analyze the slope angle, the geological environment, the volume of the landslide surge, and the landslide surge wave steepness; to study the landslide volume effect on ship rolling and the swaying motion rule; and to explore the landslide surge in different ship rolling positions and transverse oscillation characteristics. This study can provide theoretical support for the navigation safety of ships in landslide surge waters.
1. Introduction
The Three Gorges Reservoir area along the Yangtze river is located in the Sichuan basin and the middle-lower Yangtze plain area. The length of the trunk is about 690 km. It is part of the city of Chongqing and extends down to the Hubei Yichang which includes 22 administrative areas and accounts for 175 m of water dispatching work. The reservoir area is a mountainous steep slope, rainfall is abundant, and it is a typical mountainous river reservoir. The terrain of the reservoir area is complex, and the soil or rock mass on the bank slope has been affected by river scour, groundwater erosion, water level fluctuation, wind and wave impact, crustal activity, dry and wet alternations, etc. for a long time. Due to gravity, the soil or rock mass will slide downward dispersing along the weak surface. After the potentially dangerous rock mass enters the river, the water level of the river, the velocity of water in the river, and the shape of the river section can change. There may be bad flow patterns, such as whirlpool and backflow, in the river, which will affect the normal navigation of a ship. Serious landslide and surge disaster accidents can make the ship capsize instantly, which will cause closure and navigation restriction of the accident area in the Three Gorges Reservoir.
Landslide-induced surge has the characteristics of a wide influence area, a large disaster area, and a high damage degree. Many studies have been conducted on landslide-induced surge physical model experiments, ship nonlinear motion, and wave steepness characteristics.
By means of numerical simulation, experts have simulated landslide-induced surge generated impulse waves and analyzed the deformation of the sliding mass in Newtonian and non-Newtonian fluids, Kun Guo [1], Ramshe [2], and Yeylaghi [3] applied the WC-MPS(Weakly Compressible Moving-Particle Semi-Implicit), rigorous finite volume and ISPH (Incompressible Smoothed Particle Hydrodynamics) modelling separately. Through orthogonal experiments with physical models, scholars have studied the wave parameters, propagation law, attenuation coefficient, and other parameters of landslide-induced surges, Huang [4], Wang [5], and Aaron [6] focused on shallow water, complex topography, and non-hydrostatic separately. Recent research efforts into 2D experiment trails. Fritz [7] performed preliminary experiments with a falling block and a wedge block with rollers to reduce friction on a 10° incline plane. The wave generation between the two methods differs because the sliding wedge does not produce the previously noted reverse separation vortex. Watts et al. [8] performed experiments on submarine landslides using a semi-ellipsoid and compared the experimental results to the depth-averaged nonlinear shallow water wave equations. Sue et al. [9] studied submarine landslides by sliding a rigid semi-ellipsoid down a 15° incline in a 14.67 m long, 0.25 m wide, and 0.505 m deep basin. Extensive efforts have been made to investigate 3D experiment trails. Panizzo et al. [10] performed a 3D block slide that was released at the end of the basin adjacent to the side wall assuming symmetry of the wave propagation. Heller et al. [11] performed a 3D block landslide experiment to compare the wave characteristics. The 3D experiment trails were conducted in a 2.1 m long, 2.0 m wide, and 0.2–0.4 deep basin.
Some experts, such as Lan Kang [12], Sakakibara [13], and John Grue [14], have studied the movement of ships on the earthquake-induced tsunami flow by writing programs and model tests. Some experts have studied the nonlinear motion and load changes of the ship, such as Xia [15], Jelena [16], Wu [17], Alain [18], Kim [19], and Jiao [20]. Fonseca [21] compared numerical and experimental results of nonlinear wave-induced vertical ship motions and loads. Daniel [22], Soares [23], Rocha [24], and Antao [25] studied the characteristics of the steep wave, spectral bandwidth, beach slope, its variation law, the joint distributions of wave steepness in narrow band sea states. Ruiz et al. [26] performed the wave effects in six DOF (Degree of Freedom) on a ship in shallow water, the model was systematically tested in both calm water and in regular waves with different combinations of wave amplitudes, headings, and periods. At the same time, extensive research has been conducted on the behavior of ships using physical experiments [27,28], especially in short and long waves.
In order to effectively evaluate the safety of navigable ships in landslide-induced surge waters, a risk analysis of landslide disasters was carried out to predict the influence of landslide surge on a ship’s roll and roll motion characteristics. Based on an orthogonal test with a physical model of a landslide-induced surge, we studied the characteristics of the height of the first wave and the steepness of the wave, and discuss here the influence of landslide surges on ship roll and heave. The research results can provide a theoretical reference for the rational division of waterway warning areas and further improve the navigation safety of ships.
2. Model Test
2.1. Model Scale Ratio
Three similar conditions—geometric similarity, similarity in motion, and similar dynamics—must be met to obtain a similar physical phenomenon between a prototype and model [29].
Geometric similarity requires that all equivalent lengths at prototype and model scale have the same ratio and all equivalent angles are identical. The ratio of a corresponding length at prototype scale to model scale is defined as the length scale factor [30].
Besides velocity, kinematic similarity requires time-dependent quantities including acceleration and discharge to have constant ratios between prototype and model [31]. To attain dynamic similarity, all corresponding forces are constant with a force scale ratio [30].
In free surface hydraulics, the most often applied force ratio is between inertial force and gravitational force [31], which is defined as the general Froude number [30].
2.2. The Carriage Design
The carriage design uses angle steel as the raw material. The material has good bending resistance. In the physical model test, it can support the weight of 3 tons, providing safety guarantee for the successful completion of the test. The length of the slide is 2 m, and the width of the slide varies from 0.5 to 1.5 m. The bottom of the chute is a smooth iron plate, and the left and right sides of the chute are equipped with a fixed pulley with the same lifting capacity, and this pulley is used to control the angle of the chute tilt. According to the survey results in the early stage of the experiment, the slope surface of the soil landslide in the reservoir area is mainly 20–50 degrees. The probability of landslide occurs at a 40-degree inclination, which is relatively high. Therefore, a slope inclination of 40 degrees was selected for this experiment.
After the completion of each working condition, the sliding body was cleared away from the river through the fixed pulley and from the support plate at the front of the sliding frame, which was ventilated and dried for the next test. The test model of slide frame and groove is shown in Figure 1.
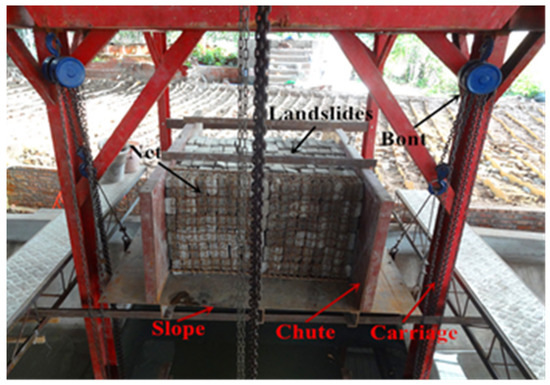
Figure 1.
Model of the sliding frame and chute.
2.3. River Model Design
The research object of the channel is Tuokou wharf section of Wanzhou, Chongqing, China. The length of the prototype is 6 km. And the physical model is generalized into linear channel and curved channel, and the scale ratio of the channel model is 1:70. According to the measures for safe navigation in the water traffic control area of the Three Gorges Water Control Project of the Yangtze river (2016), ships sailing in the Three Gorges Reservoir area each rely on the starboard side of the ship. Combined with the actual test conditions, ships in the landslide waters may have some accidents such as turning, yawing, and collision. In order to ensure the smooth completion of the test, the final course was determined to be 0.5 m from the right of the center line of the channel, 3.5 m away from the right shore. During the test, parameters such as the height of the first wave of the landslide-induced surge and the movement rule of the ship were monitored. The river channel model and the position of each monitoring point are shown in Figure 2.
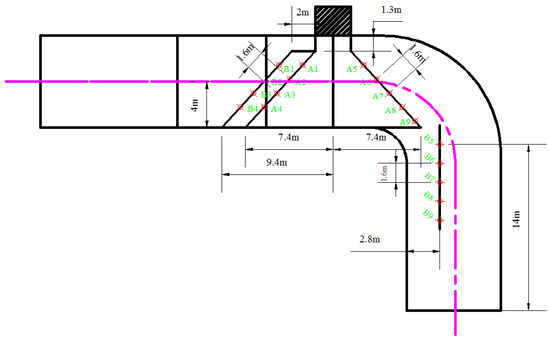
Figure 2.
Layout of monitoring sites in the channel river.
2.4. Ship Experimental Design
With the rapid development of global trade, container ships, with their low cost and high efficiency, are widely favored by the water transport industry and have become an important part of the ship transport network. According to the preliminary research results on the types and volumes of shipping vessels in the Three Gorges Reservoir area, a common 3500 t container ship was selected as the research object. The ship model is shown in Figure 3.
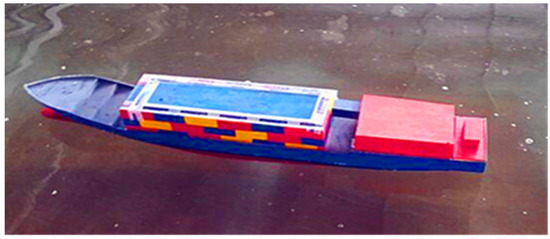
Figure 3.
Ship model.
According to the principles of geometric similarity, gravity similarity, and motion similarity, the scale of the model was 1:70. During the test, it was necessary to have a fixed counterweight on the ship, so that the draft, weight, position of the center of gravity, the mass inertia moment, and the natural vibration period of the ship model were consistent with the prototype. Ship parameters are shown in Table 1.

Table 1.
Parameters of ship.
3. Condition Analysis and Measuring Instruments
3.1. Typical Working Condition Analysis
Using the width and thickness of the landslide body and the navigation position of the ship as variables, we studied the variation of the height of the first wave of the landslide-induced surge, the motion rules of the ship’s roll, and the roll. Shallow channels are more likely to form higher head wave heights. Through the extensive collection of domestic and foreign data, combined with the test conditions, we found that larger landslide surges occurred in shallow water conditions, and its impact on hydraulic structures was more pronounced [32]. In the process of analyzing the propagation characteristics of land-slide surge, the entry Angle of landslide body and the experimental water depth are taken as the research objects. After the same landslide body enters the water, a large landslide surge occurs in the shallow water area. Under the test condition that the landslide angle is 20°, 40°, and 60°, when the slope angle is 40°, the horizontal partial velocity of the landslide body into water is the maximum, and the greater the horizontal kinetic energy of the landslide body, the more fully the energy exchange with the water body. This paper mainly studies the influence of land-slide surge on ship’s nonlinear motion characteristics, that is, selecting the most dangerous test condition.
The test water depth was 0.74 m, and the landslide dip angle was 40°. The larger the horizontal velocity component of the landslide, the faster the propagation speed of the landslide surge. Typical working conditions are shown in Table 2.
Table 2.
Typical working conditions.
3.2. Measuring Instrument
For the acquisition of ship motion characteristic data, and to obtain the motion amplitude of each degree of freedom by wireless data transmission, a ship motion attitude acquisition device designed independently was selected. To monitor the height of the first wave of the landslide-induced surge, we used an ultrasonic wave acquisition analyzer of the National Waterway Regulation Engineering Research Center of Chongqing Jiao Tong University. It is equipped with seven sets of sensors to monitor the propagation law of swell waves in channel models of landslides. The data acquisition system mainly collects the data of wave height, wavelength, wave period, and relevant data of ship movement in different regions, with the collection time of 200 s and the acquisition frequency of 50 Hz.
4. The Propagation Law of Landslide-Induced Surges
In order to verify the accuracy of the water entry slamming model, the more classical Henrich [33] test results in this field were selected as the reference standard, and the same physical parameters were selected as the test model. The slide diagram of the slope block was shown in Figure 4.
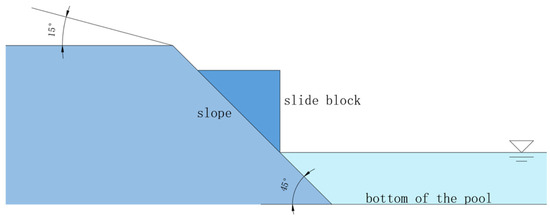
Figure 4.
The schematic drawing of the experimental model.
During the test, the slider was set as an isosceles triangle with the length of right Angle as 0.5 m, the slope inclination was set as 45°, the bank slope inclination on the slope was set as 15°, the test water depth was set as 0.4 m, and the entry point of the landslide before sliding was 0.01 m below the water surface. During the test, the slide slides along the set slope by its own gravity.
The comparison in Figure 5 shows that the land-slide surge model test established in this paper is basically consistent with the results of Henrich. Therefore, the physical model test established in this paper can accurately reflect the water surface changes caused by sliding block sliding down the slope. However, the experimental results in this paper are relatively large, mainly due to the following reasons: firstly, this paper is about the water entry of the bulk landslide, and the energy loss of the water entry of the landslide is small; secondly, this river model has a large slope on the opposite side of the water entry point of the landslide.
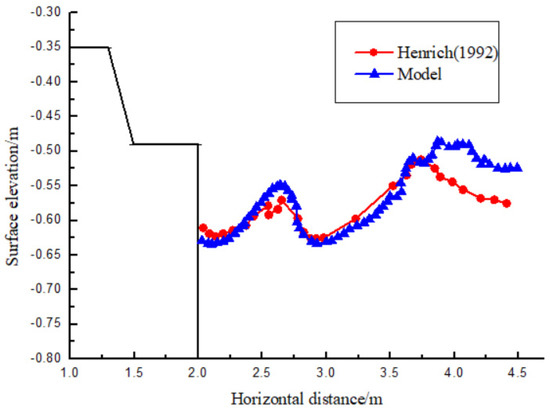
Figure 5.
Comparison the free surface between Henrich and model at t = 1.0 s.
4.1. The Test Study of First Wave Height
When a bank slope is unstable, the landslide body will slide into water at a high speed and exchange energy with the water body, and the water quality points in the free surface will implicate with each other. The water level in the river course will also fluctuate. Therefore, the movement of a landslide into water is a process of energy transfer, transformation, and dissipation. This paper explores the influence law of the volume amount of a landslide and the ratio of the thickness of a landslide to the height of the first wave, thus revealing the morphological characteristics of the initial movement of landslide surges.
During the test, it was observed that the slide body was sliding at high speed and had instantaneous interaction with the water body. The landslide-induced surge expanded naturally in a fan shape. The propagation of the landslide-induced surge is mainly divided into two stages. The first stage is the occurrence stage of the landslide surge. In this stage, the wave parameters of the landslide surge change in a complex manner, and the regularity is not strong. This is related to the shape of the channel, the sliding speed of the landslide, and the property of the landslide. The second stage is the expansion and development stage of the landslide-induced surge. As the energy of the surge gradually decreases during its propagation, it gradually tends toward a stable state. The stable wave height is less than the maximum initial wave height, accompanied by certain obstruction and climbing phenomena.
As can be seen in Figure 6, the free liquid level of the landslide presents a static state before entering the water. As the landslide body enters water at high speed, it generates a three-dimensional nonlinear landslide-induced surge, which occurs on one side of the bank and gradually spreads to the other side. The wave generation is messy, and the development process is complex and random. The landslide-induced surge then reaches its peak in a very short time, with a steep peak and asymmetrical wave axis. Moreover, the first peak energy of the landslide-induced surge is relatively large. With the increase of time, the peak of the landslide-induced surge declines exponentially, the amplitude decreases, and the wavelength increases. The wave period gradually increases in the case of 1 m × 1.5 m × 0.4 m. In the others, the change of wave period is not obvious at the back of the curve.
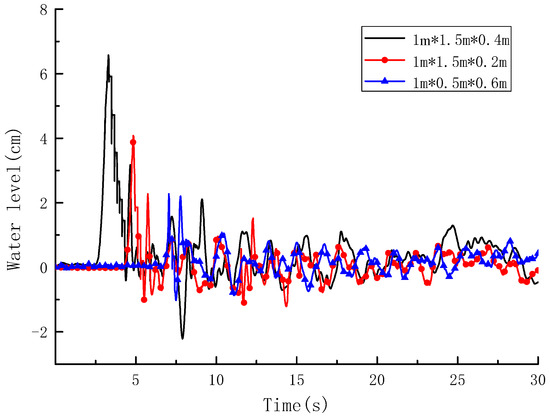
Figure 6.
The curve of the water level at monitoring points.
The comparison between Working Condition 4 and Working Condition 5 shows that, with the same test water depth and landslide inclination, the larger the landslide volume, the faster the landslide-induced surge propagation speed, and the shorter the propagation time required for the same distance. In other words, the peak value appeared first in Working Condition 5 compared with Working Condition 4, and the height of the first wave in Working Condition 5 was also higher than that in Working Condition 4.
The comparison between Working Condition 2 and Working Condition 4 shows that, with the same landslide volume, the larger the ratio of width to thickness of the landslide, the larger the effective contact area between the landslide and water, the more sufficient the energy transfer, and the faster the landslide-induced surge propagation speed. That is, the peak appeared earlier in Working Condition 4, and the height of the first wave in this condition was higher than that in Working Condition 2.
4.2. The Formula of Landslide-Induced Wave Height
In this paper, by means of a large-scale physical model test, multiple regression analysis is carried out on the relevant parameters that affect the height of the first surge. The main parameters of the landslide are the width b of the landslide, the angle β of the slip surface, the thickness c of the landslide, and the depth h of the reservoir area. In this test, by changing the width of the landslide (0.5–1.5 m) and the thickness of the landslide (0.2–0.6 m), a dimensionless calculation was conducted on the height H of the landslide surge and its influencing parameters, respectively, obtaining H/b, h/b, c/b, and β.
The calculation formula of the landslide-induced surge height is as follows [34]:
This formula is applicable to the calculation of the first wave height of a landslide-induced surge generated by a large amount of landslide body entering water in the Three Gorges Reservoir area. This formula can reasonably estimate the height of the landslide-induced surge and effectively analyze the risk of such a surge.
4.3. The Wave Steepness Characteristics of Landslide-Induced Surge Waves
Based on the basic definition of landslide-induced surge wave steepness, theoretical derivation was carried out in this experiment. By measuring the period and wave height of the landslide surge wave, the basic expression of the landslide-induced surge wave steepness and its variation rule were derived. During the test, the instrument was calibrated by a zero crossings method, which takes the average value of the wave water level as the zero line to make a graph of the wave shape and the average water level. When the wave curve rises and intersects with the zero line as the first point, the next wave curve rises and intersects with the zero line as the second point. If the horizontal axis is the time axis, the interval between the first and second points is the period, and the difference between the maximum and minimum values on the vertical axis is the wave value of the cycle. The research has shown that wave steepness is defined as the ratio of wave height to wavelength. Because the wave length is difficult to measure directly in practical engineering, it is difficult to determine the magnitude of wave steepness. In practical engineering, the wavelength is always estimated by the period with the help of the dispersion relation of the linear water wave theory. The dispersion relation is for each component wave, and it is reasonable to use it to convert the period and wavelength. The estimated value of wave steepness that has been proposed is mainly based on Longuet-Higgins [35] or Cavanie et al. [36], which is estimated by period in literature.
where, g is the gravitational acceleration, H is the wave height, T is the period, and the subscript represents the wave steepness estimated by the period.
4.3.1. The Wave Steepness Characteristics of Landslide Sections
During the test, according to the definition of a characteristic wave, the wave number, maximum wave height, maximum period, meaningful wave height, and meaningful period of the landslide-induced surge wave were measured by the wave monitor. Parameters are given in Table 3.
Table 3.
The statistical table of wave height and period in the landslide profile.
During the test, Monitoring Points #1, #2, and #3 were, respectively, 1.5, 4.4, and 5.9 m away from the landslide entry point. The maximum wave height of the landslide-induced surge decreased with the increase in propagation distance, and the average wave height and significant wave height of landslide-induced surge increased with the increase in distance. The main reason for this is that Monitoring Point #1 was close to the water entry point of the landslide, and the water surface fluctuates more violently with higher wave height. However, the wave steepness at the landslide section was different from the maximum wave height and the significant wave height. When the landslide body entered the water, the steepness of the surge wave tended to increase first and then decrease, and the steepness of the surge wave was larger at the center line of the river. The curve of the wave steepness with propagation distance at the landslide section is shown in Figure 7.
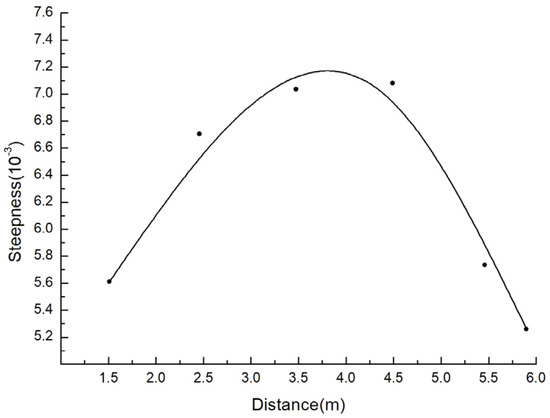
Figure 7.
Variation curve showing that wave steepness of landslide surge changes with propagation distance.
4.3.2. The Wave Steepness Characteristics of the Straight Channel
During the test, in order to study the variation rule of landslide-induced surge wave steepness in linear channels, the wave number, maximum wave height, maximum period, significant wave height, significant period, average wave height, and periodic average of landslide surge wave steepness in the linear channel were measured. Parameters are shown in Table 4.
Table 4.
The statistical table of wave height and the period of monitoring points in the straight channel.
As can be seen in Table 4, the maximum wave height values of different monitoring positions are different. Points #1, #4, and #5 are on the same line. During the propagation of the landslide surge, the wave height of the landslide surge decreases with the increase in propagation distance. B1, B2, B3, and B4 are also on the same straight line, on which B4 is closer to the shore. After the landslide surge spreads to the shore wall, it launches, and the waves superimpose, resulting in the maximum wave at B4 being higher than B3. It can also be seen in Table 4 that B2, B3, and B4 are on the same straight line, and the maximum period of the landslide-induced surge increases with the increase in propagation distance. The steepness variation curve of the landslide surge wave in the straight channel region under typical working conditions is shown in Figure 8.
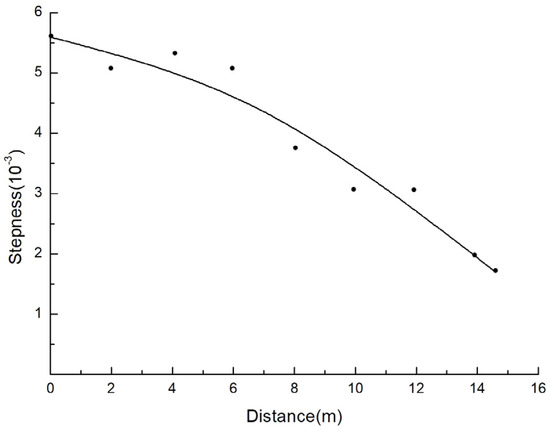
Figure 8.
The weave steepness variation curve of the landslide surge in the straight line area under typical working conditions.
4.3.3. The Wave Steepness Characteristics of the Curved Channel
During the test, two working conditions were selected to study the variation rule of the landslide surge wave in the curved section of the river. Respectively, for observation points of the first group of Working Conditions #1, #6, and #7 of the wave steepness test, the wave number, maximum wave height, maximum period, significant wave height, significant period, wave height mean, and periodic mean in Working Conditions A5, A6, A7, A8, and A9 of the second group of the wave steepness test were found and are shown in Table 5.
Table 5.
Statistical table of wave height and period of monitoring points in the tortuous channel.
As can be seen in Table 5, with the same landslide volume amount, landslide dip angle, and water depth, after the landslide body enters the water, Points #1, #6, and #7 are on the same line. The maximum wave height decreases first and then increases. The same is true for A5, A6, A7, A8, and A9. This is because, during the propagation of the landslide surge in the curved channel, it is affected by a right-angle bend, which hinders the scattering propagation of the landslide surge. At the same time, during the propagation of the landslide surge, the landslide-induced surge impinges on the river bank and reflects, causing it to overlap and the wave height to increase. The steep variation curve of the landslide-induced surge wave in the straight line of the river channel under typical curved channel conditions is shown in Figure 9.
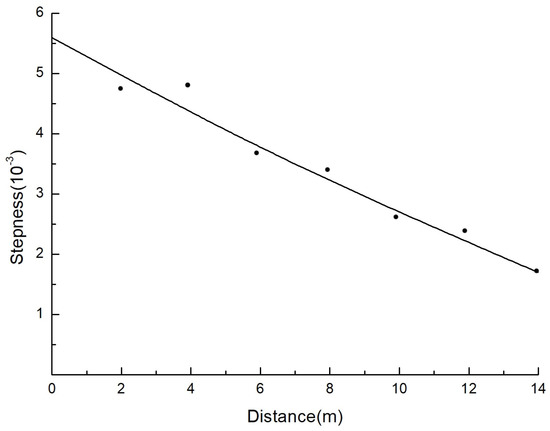
Figure 9.
The wave steepness variation curve of the landslide surge in the curved area under typical working conditions.
5. The Ship Motion Characteristics Caused by Landslide Surges
When a ship is sailing in a landslide surge water area, only the rolling motion and the swaying motion needs to be considered for navigation safety. During the model test, it was observed that the propagation process of the landslide surge can be divided into four stages. The first stage was the swashing stage, that is, a large number of water leaped out of the water in the form of a splash. The second stage was the forerunner state, that is, the water body moved forward after being elevated. The third stage was the posterior collapse state, that is, the water body was elevated and dumped into the impact pit. The fourth stage was the forward propagation of the landslide-induced surge, which was coupled with the ship. The propagation wave steepness of land-slide surge is diverse in different regions. And the following are the nonlinear motion characteristics of ships under different wave steepness.
5.1. The Influence of the Landslide Volume on Ship Roll Characteristics
By studying the influence of landslide volume on ship rolling motion characteristics the amplitude of the ship rolling motion was determined, and some theoretical guidance for the safe binding of shipping containers was provided. It can be seen in Figure 10 that the sliding mass with different dimensions slides into the water at high speeds and carries out an energy exchange with the water body. During the course of high speed sailing, the ship roll nonlinearity is obvious.
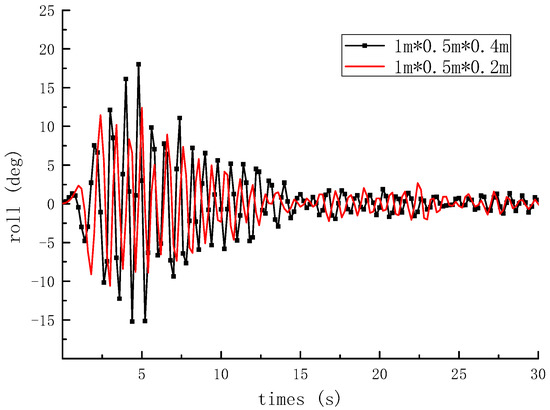
Figure 10.
Rolling motion of the ship by different volumes of landslide.
The water mass particles implicate each other. The water body on the right side of the landslide rises rapidly and forms a reverse entrapment wave. Part of the energy of the landslide-induced surge causes the water quality point to oscillate around the equilibrium position, and the other part of the energy spreads forward and interacts with the ships in the channel. The rolling motion of the ship shows obvious non-linear, large-scale, and high-frequency motion. The amplitude of the rolling motion of the ship increases rapidly. With the attenuation of the surge energy along the landslide, the amplitude of the rolling motion of the ship also decreases gradually. It gradually reaches a stable and safe state by its own restoring moment. Additionally, the sliding mass with different magnitudes sliding into the water has different influences on the ship’s rolling motion. The larger the amount of the landslide, the faster the propagation speed of the landslide surge, the earlier the ship’s rolling motion, and the larger the amplitude of the ship’s rolling motion. For actual engineering disaster prevention, slopes should be strengthened properly to prevent unstable, large-area slope slides that threaten the navigation safety of passing ships.
When the landslide volume is 1 × 1.5 × 0.4 m (length × width × thickness), the maximum roll value of the ship is about 17 degrees, which is within the range of large dip rolls and meets the specification requirements of the technical rules for the legal inspection of ships. With the increase of time, the energy of the landslide-induced surge gradually dissipates, the rolling motion turns into a slight oscillation motion, and the ship is in a relatively safe sailing state. At this point, the ship should pay attention to the change in external forces on the side of the ship in the navigation process, to prevent an impact load that is too large and that would result in a large roll movement of the ship, affecting the navigation safety of the ship. In the actual process, the height of the center of gravity should be lowered to increase the ship’s initial stability.
5.2. The Influence of the Navigation Position on Ship Roll Characteristics
The width of the channel determines the energy dissipation degree of the landslide-induced surge, which has different effects on the motion characteristics of ships in areas of steep attenuation and gentle attenuation. In this part, 1 × 0.5 × 0.6 m (length × width × height) sliding bodies were selected for water entry to study the influence of the navigation position on the rolling characteristics of ships.
As can be seen in Figure 11, the rolling motion of the ship has many nonlinear effects. When the ship’s zero speed is at three positions in the curved channel, the landslide-induced surge has different effects on the roll motion of the ship. Because the water entry point of the landslide is close to the second position, the landslide-induced surge spreads to the ship first and interacts with it. In other words, during a period of 0–20 s, the ship in Position #2 had a large roll motion first, followed by Position #1 and Position #3. When the period of the landslide-induced surge is close to the natural period of the roll, the roll motion of the ship has a peak value. As shown in Figure 9, the period and wavelength of the landslide-induced surge change at different times during the propagation process. When the ship is in Positions #1, #2, and #3, the maximum rolling motion of the ship occurs at different times.
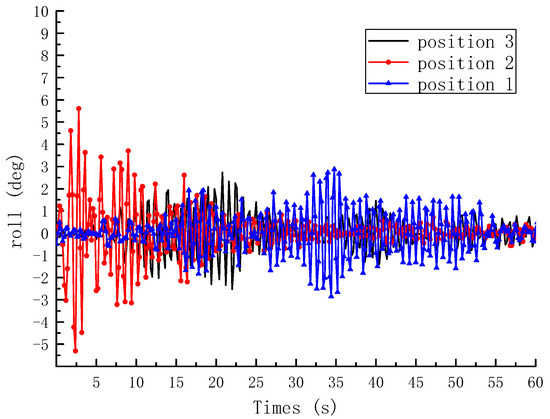
Figure 11.
Rolling motion of the ship by different positions in the landslide-induced wave region.
The propagation of the landslide-induced surge is irregular and random. When the period of the landslide-induced surge is an integral multiple of the natural period of ship rolling, a larger peak of rolling occur. When the ship’s zero speed is at Position #3, the landslide-induced surge spreads to the vicinity of the ship. The ship has its first large roll movement within a period of 10–30 s. With the increase of time, the landslide-induced surge energy gradually decreases. When the landslide-induced surge is transmitted to the other side, the ship is subjected to the reflection effect of the shore wall, the wave is superimposed, and the composite wave acts upon the ship. The second large rolling amplitude occurs in the 70–85 s period. The rolling amplitude decreases gradually, and the ship does not lose its stability due to its self-restoring moment. At the same time, the ship’s motion in the large wave surge shows obvious nonlinearity. Combining with the propagation characteristics of the wave surge in the cross-section of the river, it can be seen that the rise and change of the wave surge cause the ship’s roll nonlinearity, which also indirectly reflects the ship’s transverse motion nonlinearity. When the ship sails at different positions in the river, the wave steepness at #2 is the largest, resulting in the ship’s roll value at #2 being the largest.
The outside environment of the channel and the sudden change should be considered in water level. When a ship sails into a curved river channel, it should pay special attention to any secondary damage to the ship caused by the external load. When a ship is sailing in a high-wave and steep region, it shall pay attention to the submerged bow and the waves on the deck to ensure the safety of the ship’s navigation.
5.3. The Effect of Landslide Volume on the Ship’s Swaying Characteristics
This section is used on the physical model test to study the effect of the landslide surge generated, after the landslide body enters the water, on the ship’s transverse motion characteristics.
It can be seen in Figure 12 that the ship was in a static equilibrium position before the landslide entered the water. When the landslide body entered the water, it was accompanied by a landslide-induced surge. The surge gravity wave spread to the ship’s side, and the ship experienced significant transverse movement displacement. When the landslide-induced surge interacted with the ship, the ship’s transverse displacement decreased gradually depending on its own restoring moment. When the landslide-induced surge again acted upon the ship’s side structure, the ship’s transverse displacement continued to increase and further deviated from the original static equilibrium position. With the gradual decrease of landslide-induced surge energy, the increment of yaw motion gradually decreased, and the amplitude of the ship heave increased successively. When the landslide surge acted upon the hull, the ship’s transverse displacement increased to about 30 cm. During the test, it was observed that the interaction between landslide surges and ships led to a complex vortex flow field around the ship, especially in the middle of the ship. The interaction between landslide-induced surges and ships had the greatest impact strength near the water level.
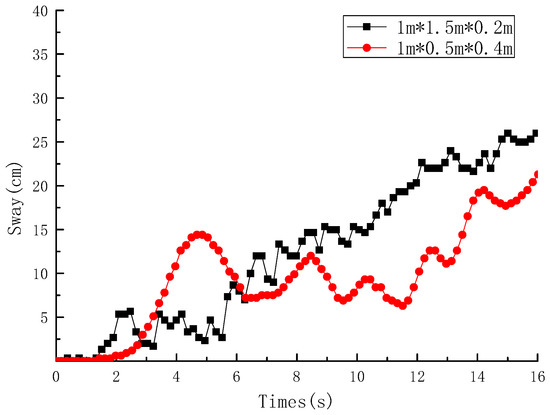
Figure 12.
Sway motion of the ship by different volumes of landslide.
The landslide body entered the water at high speed and generated a landslide-induced surge with a certain amount of energy. The larger the landslide volume, the larger the landslide-induced surge energy, and the larger the amplitude of the transverse motion. The smaller the landslide volume, the smaller the landslide-induced surge energy, and the smaller the influence of the surge formation on the ship’s heave. During a voyage, a ship navigator should pay attention to the sudden transverse load so as to reasonably control the distance between ships and prevent collisions between the ship and the shore and between the ship and the dock.
5.4. The Influence of Navigation Position on Ship’s Transverse Motion Characteristics
A situation in which a ship is sailing is analyzed in a river course and encounters a landslide-induced surge. The influence of the navigation position is analyzed on the ship’s transverse motion.
It can be seen in Figure 13 that the water entry of the landslide body has different effects on the ship’s transverse motion characteristics at different positions. The ship transverse curvature changes the fastest at Position #2 of the landslide section. During the 0–20 s period, the landslide-induced surge continues to act on the ship, and the ship’s lateral displacement increases from 0 to 16 cm. During the increase, the displacement first increases, then decreases, and then continues to increase. The ship experiences positive relative displacement and negative relative displacement in this period. The ship’s transverse curvature is slow, and continuity is strong in Position #1 of the landslide section and Position #3 of the river course, and the high head pressure of the landslide-induced surge increases the risk of ship stability failure. The ship travels in different positions in the river, and the landslide-induced surge interacts with the ship. The ship’s yaw motion direction is consistent with the propagation direction of the landslide-induced surge and the ship’s own recovery moment causes the ship to move in the opposite direction, which makes the ship’s yaw motion change slightly and increase continuously. When the ship stays in the river, the farther the distance between the water entry point of the landslide and the ship, the greater the energy loss of the landslide-induced surge in the process of propagation, and the smaller the damage of the landslide surge to the ship. Because of the steepness of the wave at position #2, the ship has the maximum transverse oscillation at this position.
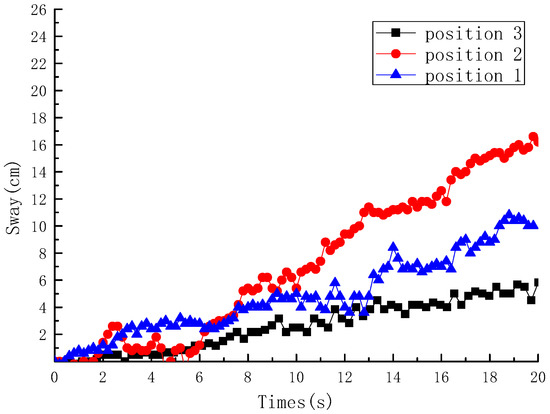
Figure 13.
Sway motion of the ship by different positions in the landslide-induced wave region.
By changing the speed and direction of the ship in the Three Gorges Reservoir area, the collision between the ship and the shore in the curved section can be prevented effectively, and the course stability of the ship in the random waves can be further controlled. When passing near the prone geological disaster point, ships in the river should pass quickly along the predetermined route to prevent any capsizing due to sudden landslide or surge. If passing ships release disaster information, ships should cast one or two anchors to further stabilize their position.
6. Conclusions
Slope instability in the Three Gorges Reservoir area induces landslide surges in the reservoir water area. In this paper, the generation stage and propagation characteristics of landslide-induced surges are analyzed. By means of an orthogonal test with physical models and regression analysis, height and steepness characteristics of landslide-induced surges as well as their influence on a ship’s motion are studied. The main conclusions are as follows:
- (1)
- A landslide-induced surge is clearly non-linear. The first wave peak reaches the maximum value in a very short time. The larger the landslide square, the earlier the maximum crest of the generated water appears.
- (2)
- The greater the amount of water entering the landslide, the earlier the maximum crest of the generated water appears. When a ship is coupled with a landslide surge, the amplitude of the ship’s roll and heave motion increases.
- (3)
- A landslide-induced surge has a great influence on the rolling and swinging motion of ships in the landslide section, and has an effect on ships in straight rivers. In the process of ship design, the center of gravity of the ship should be lowered, the inherent period of the ship should be improved, and the roll performance of the ship should be improved.
- (4)
- When a ship is sailing into the curved section of a river, if it encounters the external load of impulse, it should pay attention to any initial damage of the ship’s rolling motion and take reasonable measures to ensure the ship’s safe navigation.
Author Contributions
Conceptualization, Y.Z.; Data curation, P.Y. and Y.Z.; Formal analysis, P.W. and P.Y.; Methodology, P.W.; Investigation, P.Y.; Writing-original draft, P.Y. All authors have read and agreed to the published version of the manuscript.
Funding
This study was financially supported by the National Natural Science Foundation (51479015), Social Science and Technology Innovation Program for People’s Livelihood in Chongqing (cstc2017jcyjBX0070, cstc2019jscx-msxmX0302, cstc2018jscx-msybX0233, and cstc2019jscx-lyjsAX0008), the Science and Technology Program of Chongqing Education Commission (KJQN201900735, KJ1600517).
Conflicts of Interest
The authors declare that there is no conflict of interest.
References
- Kun, G. Numerical Simulation of Landslide Impulsive Waves by WC-MPS Method; University of Regina: Regina, SK, Canada, 2016. [Google Scholar]
- Yavari-Ramshe, S. A rigorous finite volume model to simulate subaerial and submarine landslide-generated waves. Landslides 2015, 14, 203–221. [Google Scholar] [CrossRef]
- Yeylaghi, S.; Moa, B.; Buckham, B. ISPH modelling of landslide generated waves for rigid and deformable slides in Newtonian and Non-Newtonian reservoirfluids. Adv. Water Resour. 2017, 107, 212–232. [Google Scholar] [CrossRef]
- Huang, B.; Wang, S.C.; Zhao, Y.B. Impulse waves in reservoirs generated by landslides into shallow water. Coast. Eng. 2017, 123, 52–61. [Google Scholar] [CrossRef]
- Wang, W.; Kunlong, Y. Modeling of landslide generated impulsive waves considering complex topography in reservoir area. Environ. Earth Sci. 2016, 75, 372. [Google Scholar] [CrossRef]
- Si, P.; Aaron, J.; Lu, J.; Yu, X.; Roberts, N.J.; Clague, J.J. A non-hydrostatic model for the numerical study of landslide-generated waves. Landslides 2018, 15, 711–726. [Google Scholar] [CrossRef]
- Fritz, H.M. Initial Phase of Landslide Generated Impulse Waves. Ph.D. Thesis, Eidgenössische Technischen Hochschule Zürich, Zürich, Switzerland, 2002. [Google Scholar]
- Walder, J.S.; Watts, P.; Sorensen, O.E.; Janssen, K. Tsunamis generated by subaerial mass flows. J. Geophys. Res. 2003, 108, 2236. [Google Scholar] [CrossRef]
- Sue, L.P.; Nokes, R.I.; Davidson, M.J. Tsunami generation by submarine landslides: Comparison of physical and numerical models. Environ. Fluid Mech. 2011, 11, 133–165. [Google Scholar] [CrossRef]
- Panizzo, A.; De Girolamo, P.; Petaccia, A. Forecasting impulse waves generated by subaerial landslides. J. Geophys. Res. 2005, 110, C12025. [Google Scholar] [CrossRef]
- Heller, V.; Moalemi, M.; Kinnear, R.D.; Adams, R.A. Geometrical effects on landslide-generated tsunamis. J. Waterw. Port Coast. Ocean Eng. 2012, 138, 286–298. [Google Scholar] [CrossRef]
- Kang, L.; Magoshi, K.; Ge, H. Accumulative response of large offshore steel bridge under severe earthquake and ship impact due to earthquake-induced tsunami flow. Eng. Struct. 2017, 134, 190–204. [Google Scholar] [CrossRef]
- Sakakibara, S.; Abe, I.; Tsugane, M. Disaster survey and emergency ship handling procedures aboard a MOORED VLCC during the 2011 Tohoku earthquake and tsunami. Ocean Eng. 2014, 92, 198–211. [Google Scholar] [CrossRef]
- Grue, J. Ship generated mini-tsunamis. J. Fluid Mech. 2017, 816, 142–166. [Google Scholar] [CrossRef]
- Xia, J.; Wang, Z.; Jensen, J.J. Non-linear wave loads and ship responses by a time-domain strip theory. Mar. Struct. 1998, 11, 101–123. [Google Scholar] [CrossRef]
- Perunovic, J.V.; Jensen, J.J. Wave loads on ships sailing in restricted water depth. Mar. Struct. 2003, 16, 469–485. [Google Scholar] [CrossRef]
- Wu, M.; Hermundstad, O.A. Time-domain simulation of wave-induced nonlinear motions and load and its applications in ship design. Mar. Struct. 2002, 15, 561–597. [Google Scholar] [CrossRef]
- Cariou, A.; Jancart, F. Influence of modelling on calculated sea loads on ships. Mar. Struct. 2003, 16, 149–173. [Google Scholar] [CrossRef]
- Song, M.; Kim, K.; Kim, Y. Numerical analysis and validation of weakly nonlinear ship motion and structural loads on a modern containership. Ocean Eng. 2011, 38, 77–87. [Google Scholar] [CrossRef]
- Jiao, J.; Yu, H.; Chen, C.; Ren, H. Time-domain numerical and segemented model experimental study on ship hydroelastic responses and whipping loads in harsh irregular seaways. Ocean Eng. 2019, 185, 59–81. [Google Scholar] [CrossRef]
- Fonseca, N.; Soares, C.G. Comparison of numerical and experimental results of nonlinear wave-induced vertical ship motions and loads. J. Mar. Sci. Technol. 2002, 6, 193–204. [Google Scholar] [CrossRef]
- Wang, Y.; Wu, W.; Soares, C.G. Experimental and numerical studies of the wave-induced response of a river-wo-sea ship. J. Mar. Sci. Appl. 2018, 17, 360–368. [Google Scholar] [CrossRef]
- Wu, W.; Cox, D.T. Effects of wave steepness and relative water depth on wave attenuation by emergent vegetation. Estuar. Coast. Shelf Sci. 2015, 164, 443–450. [Google Scholar] [CrossRef]
- Rocha, M.V.L.; Michallet, H.; Silva, P.A. Improving the parameterization of wave nonlinearities-The importance of waves steepness, spectral bandwidth and beach slope. Coast. Eng. 2017, 121, 77–89. [Google Scholar] [CrossRef]
- Antao, E.M.; Soares, C.G. Joint distributions of wave steepness in narrow band sea states. Ocean Eng. 2015, 101, 201–210. [Google Scholar] [CrossRef]
- Ruiz, M.T.; de Caluwe, S.; van Zwijnsvooorde, T.; Delefortrie, G.; Vantorre, M. Wave Effects in 6DOF on a Ship in Shallow Water; Newcastle University: Newcastle upon Tyne, Tyne and Wear, UK, 2015. [Google Scholar]
- Pethiyagoda, R.; Moroney, T.J. Time-frequency analysis of ship wave patterns in shallow water: Modelling and experiments. Ocean Eng. 2018, 158, 123–131. [Google Scholar] [CrossRef]
- Sigmund, S.; El Moctar, O. Numerical and experimental investigation of added resistance of different ship types in short and long waves. Ocean Eng. 2018, 147, 51–67. [Google Scholar] [CrossRef]
- Yuan, P.; Wang, P.; Zhao, Y. Model Test Research on the Propagation of Tsunamis and Their Interaction with Navigating Ships. Appl. Sci. 2019, 9, 475. [Google Scholar] [CrossRef]
- Evers, F. Spatial Propagation of Landslide Generated Impulse Waves; ETH: Zurich, Switzerland, 2017. [Google Scholar]
- Heller, V.; Hager, W.H. Wave types of landslide generated impulse waves. Ocean Eng. 2011, 38, 630–640. [Google Scholar] [CrossRef]
- McFall, B.C. Physical Modelling of Landslide Generated Tsunamis in Various Scenarios from Fjords to Conical Islands; Georgia Institute of Technology: Atlanta, GA, USA, 2014. [Google Scholar]
- Heinrich, P. Nonlinear water waves generated by submarine and aerial landslides. J. Waterw. Port Coast. Ocean Eng. 1992, 118, 223–238. [Google Scholar] [CrossRef]
- Chen, L. Experimental Study on Characteristics of Rock-Type Landslide Surge and Impact for Navigable Conditions of the River-Channel Type Reservoir in Mountainous Area; Chongqing Jiaotong University: Chongqing, China, 2014. [Google Scholar]
- Longuet-Higgins, M.S. On the joint distribution of periods and amplitudes of sea waves. J. Geophys. Res. 1975, 80, 2688–2694. [Google Scholar] [CrossRef]
- Cavanie, A.; Ahran, M.; Ezraty, R. A statistical relationship between individual heights and periods of storm waves. In Proceedings of the Conference on Behavior of Offshore Structures, Trondheim, Norway, 2–5 August 1976. [Google Scholar]


© 2020 by the authors. Licensee MDPI, Basel, Switzerland. This article is an open access article distributed under the terms and conditions of the Creative Commons Attribution (CC BY) license (http://creativecommons.org/licenses/by/4.0/).