1. Introduction
Water scarcity is becoming one of the most challenging issues worldwide, especially with the rapid increase of the population. Nowadays, about 25% of the world’s population does not have access to a satisfactory quality and quantity of potable water, and around 70 countries had medium to extremely high water stress levels by 2019 [
1,
2]. Increasing water demand, either domestic or industrial, along with the raising of voices to solve water issues, are pushing the growth of water desalination technologies forward in technology and penetration.
Desalination of brackish or sea water now represents a consolidated system to resolve the water scarcity emergency. The main drawbacks of this solution, however, remains the high energy consumption, and also the high amount of greenhouse gases (GHG) produced in the case of traditional water desalination plants powered by conventional fuels.
Reverse osmosis (RO) is a membrane separation process and is considered one of the physical/chemical processes. Dissolved organic and inorganic substances such as viruses or ions can be removed from water by the reverse osmosis procedure. The RO process remains one of the most widespread water desalination technologies deployed, highlighted by its low energy demand compared to other commercial technologies. RO technology became a competitive water desalination technology due to several of its properties, like low energy consumption and operation flexibility. However, pretreatment processing of the brackish or sea water is necessary, like filtration and anti-scalant addition [
3].
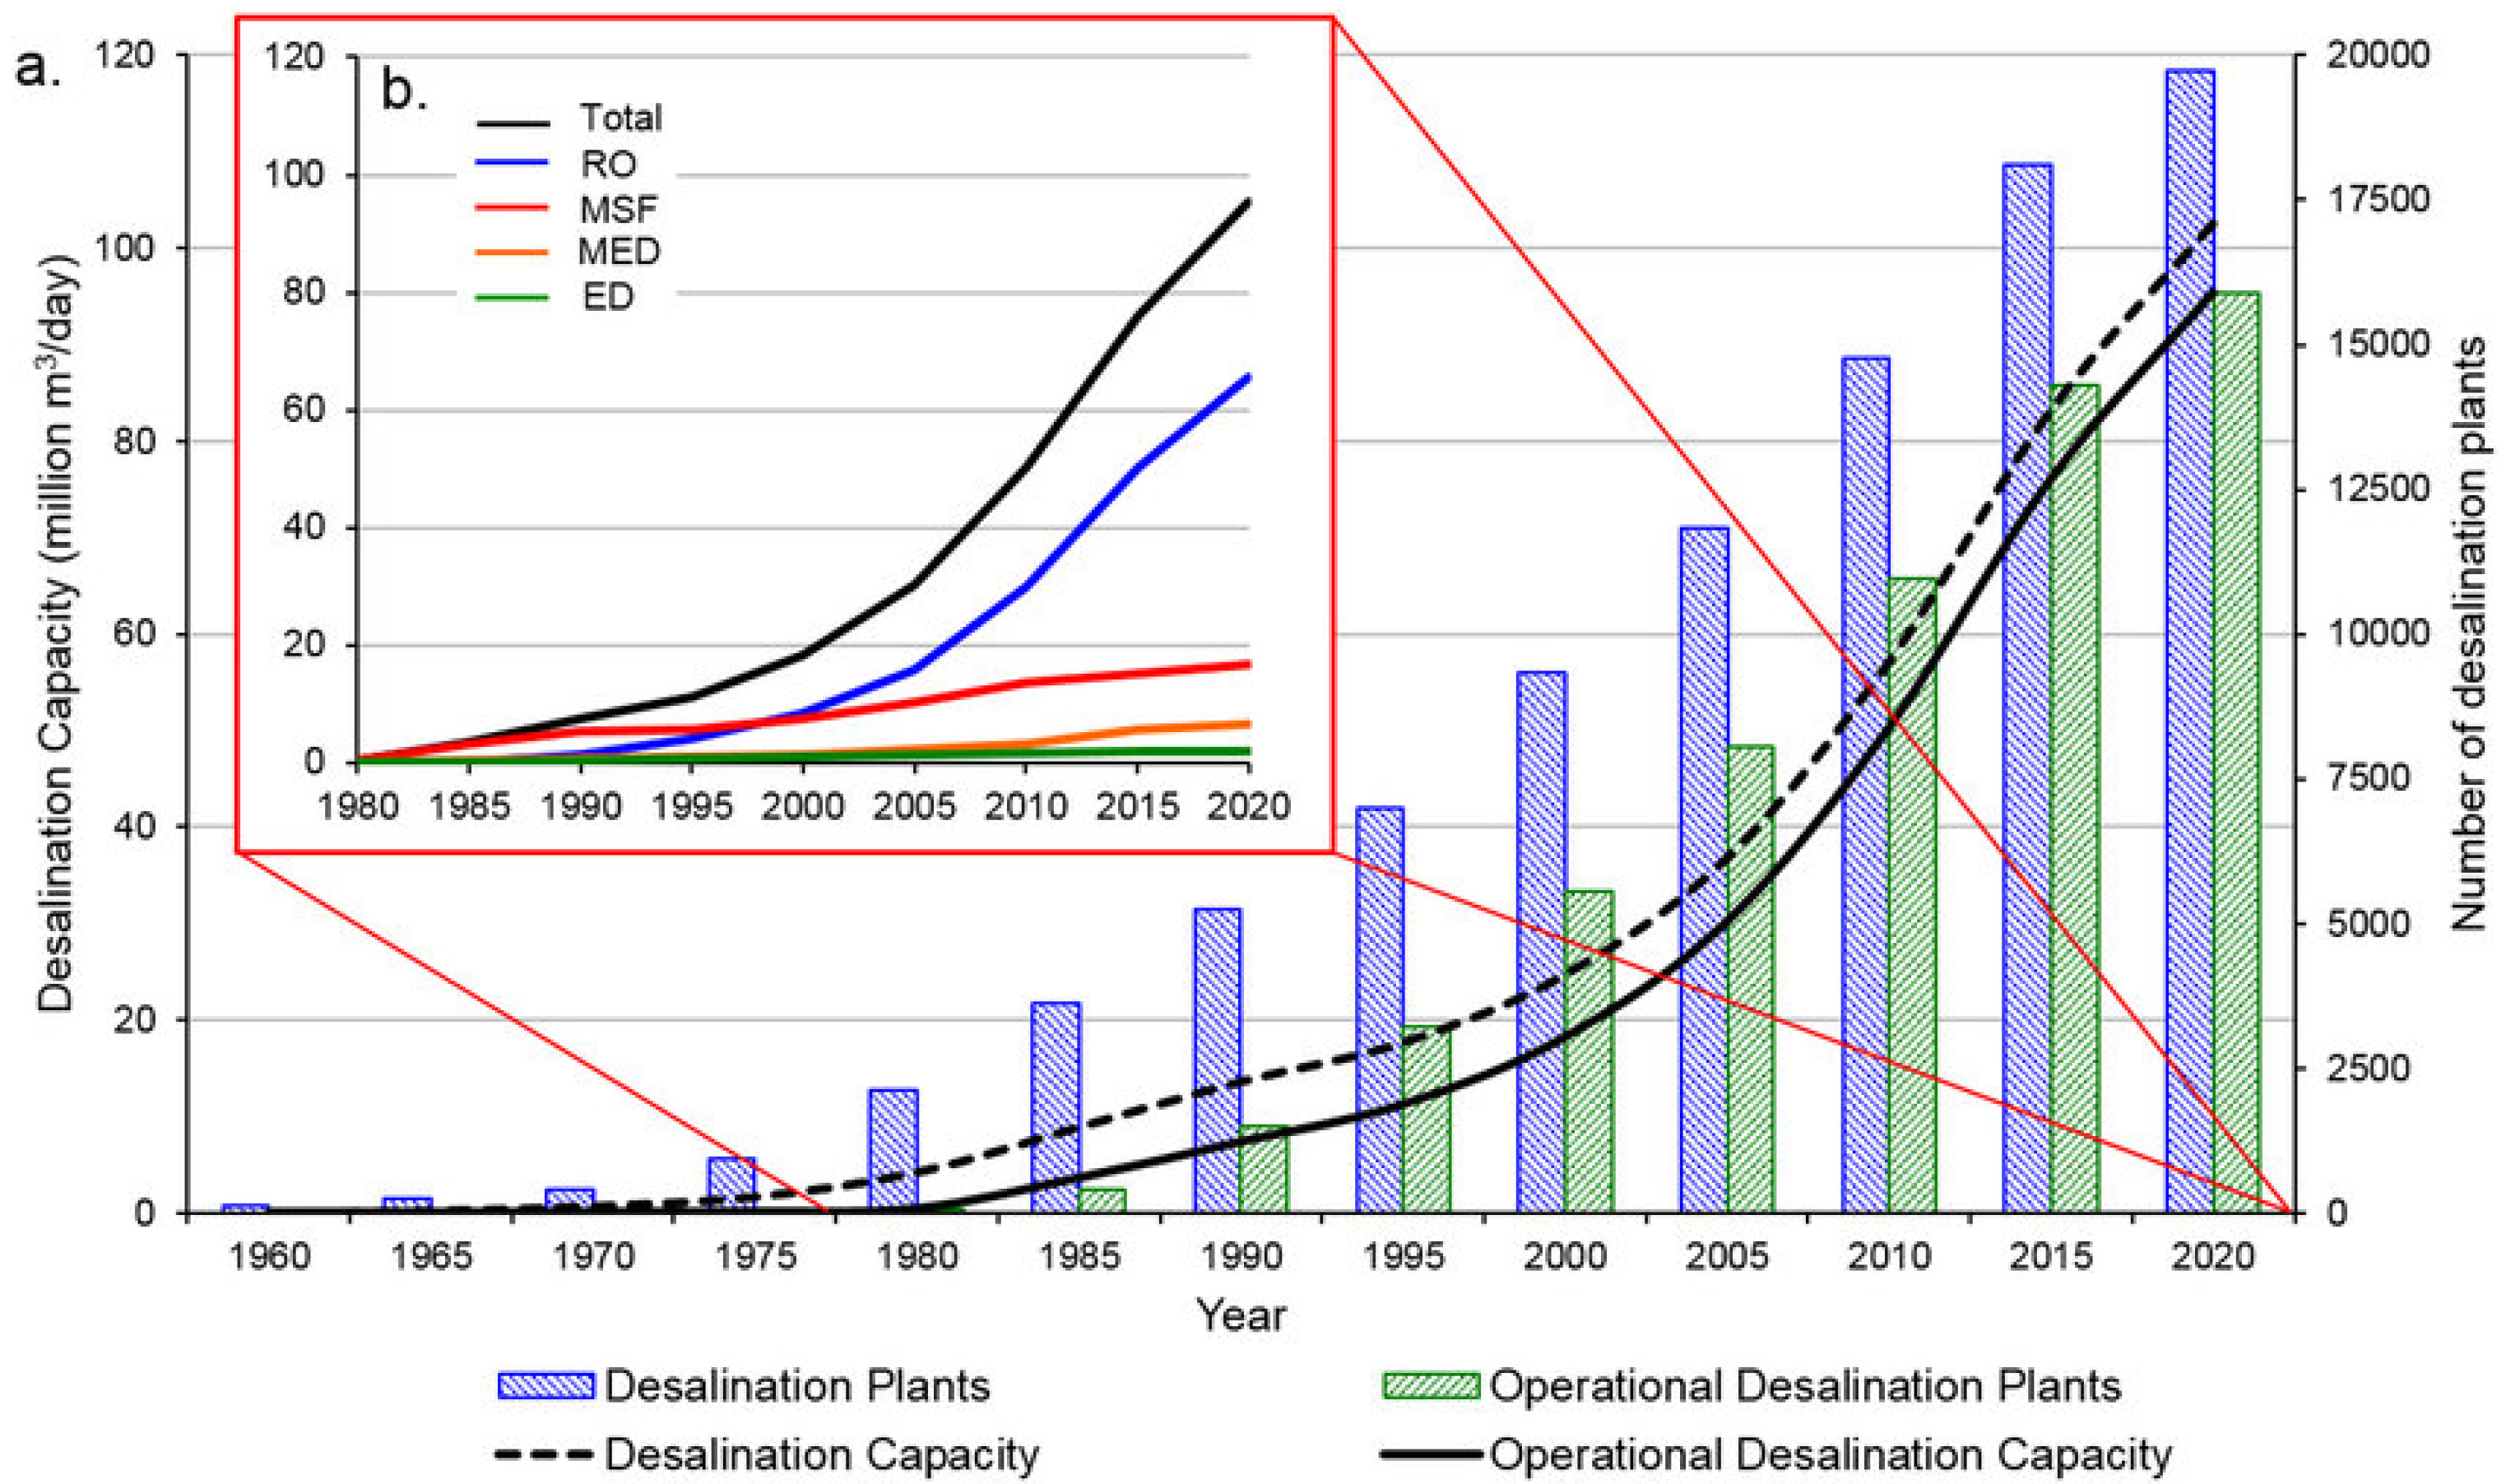
According to the International Desalination Association (IDA), the total number of desalination plants worldwide is more than 20,000 (as of June 2018) including conventional desalination plants. Those produce more than 100 million cubic meters of desalinated water per day to meet the demands of more than 300 million people in around 150 countries worldwide [
4].
Figure 1 illustrates the distribution of the installed water desalination plants globally [
5]. It is noticeable that the interest in using water desalination plants and the realization of their necessity are increasing.
According to C. Ramsay et al. [
6], the total water demand in the Middle East and North Africa (MENA) will increase from 9000 million cubic meters in 2010 up to 13,300 million cubic meter in 2030, because of the growing population and depletion of surface and groundwater resources. Consequently, the desalination capacity in the MENA region is expected to grow from 21 million m
3/day in 2007 to nearly 110 million m
3/day by 2030 (of which 70% will be in Saudi Arabia, the United Arab Emirates, Kuwait, Algeria, and Libya) [
6].
Figure 2 illustrates the return flow ratio; this is a scale to measure the overall water risk depending on its quality. Return flow ratio measures the percentage of available, previously used water that is discharged upstream as wastewater. Higher values indicate higher dependence on treatment plants and potentially lower water quality in areas that lack enough treatment infrastructure and policies. Arid areas with low water use are shown in grey and scored as low stress when calculating aggregated scores [
7]. This clearly indicates the urgency to adapt advanced technologies to diversify the sources of clean water and to utilize non-conventional water resources, which will include desalination resources as a major share.
Water desalination plants powered from renewable energy resources are growing, especially in arid regions with substantial solar energy potential such as the MEAN region. Many of the existing renewable-energy-powered desalination systems, nowadays, are implemented in small capacities from a few m
3/day up to 10 m
3/day. Only a few medium-size applications exist in the MEAN region [
8]. Much effort has been dedicated to developing, enhancing and optimizing systems for RO desalination, which uses various renewable energy technologies where the focus is on PV systems, wind turbines, PV–Wind hybrid systems and energy storage systems (battery banks). The primary goal of optimizing such systems is to achieve an environmentally friendly, cost-effective, reliable and renewable source of power. To achieve this aim, optimal sizing is essential.
Dimitriou, E. et al. performed a study modeling the effect of different parameters on seawater desalination using an RO unit [
9]. The model discussed the effect of pressure fluctuations related to the variations in the power produced from a PV system; pressure values were between 32 and 47 bars. This variation affects the water flux within a range between 0.3 × 10
−3 kg/m
2 s and 5.9 × 10
−3 kg/m
2·s. Water conductivity and concentration polarization are affected as well.
S. Abdallah et al. studied the performance of a water desalination RO unit powered by PV panels. The research discussed the effect of PV panels’ inclination angles on the output flow rates, TDS, and PH values. The achieved results show that the performance increases from 15% to 25% when using a one-axis tracking system. The discussion also included the importance of integrating PV panels as a renewable energy source for clean water supply; however, the effect of pressure variation is not discussed as it kept as a constant value [
10].
Alanood et al. discussed the possibility of reducing consumed energy by adding an energy recovery device for a medium scale RO unit powered from the electrical grid. The pressure increment effect was investigated to see the RO unit’s performance. Three energy recovery efficiencies were tested, 80%, 85%, and 90%. It was concluded that energy consumption is reduced by 6% for the different pressure values when applying the mentioned efficiencies [
11].
Hyung-Gyu Park et al. evaluated the effect of long-term pressure decrement on RO performance. After the development of a model, pressure percentage was reduced from 24.4% to 17.8% after two years of operation. Therefore, a substantial quantity of low pressure RO elements (83.3%) is required to be replaced [
12].
Performance and sizing optimization iterations applied to RO systems in the literature are intended to enhance the output quality and quantity versus reducing the input energy demand. Deployment of RO desalination units in remote areas where a connection to the grid is not feasible are still limited. Thus, research interest is tuned to motivating the off-grid PV-powered RO desalination systems at small and medium scales. Off-grid PV solutions are hindered by the need to use high-energy-density battery banks. The batteries used to back the off-grid systems are expensive, bulky, sensitive to environmental conditions, have a short lifetime, require continuous monitoring and maintenance, are hazardous and are difficult to precisely control.
Minimizing or eliminating the energy storage component in a fully off-grid PV powered RO system remains a priority for researchers. This work addresses this point in an effort to change the need for energy storage in batteries. Rather, it introduces the idea of storing the excess energy generated by the PV system in the salinity of the water produced by the RO unit.
The concept of variable-pressure operation of RO systems is introduced. The relation between the applied pressure and the salinity of the output water is investigated. Inverse proportionality suggests that when there is excessive energy generation by the installed PV system, higher pressure is applied, and, thus, lower salinity levels are achieved (and vice versa). If the applied pressure is modulated to contour the solar irradiation profile in the region of implementation, then the minimum energy storage capacity is needed to back the system for proper operation. The system will be sized such that the produced water, desalinated at different levels of pressure, is mixed by the end of each solar day to achieve the required salinity on average. Thus, an average operation schedule is suggested instead of the traditional instantaneous generation concept.
Underground brackish water is targeted in this study as it is abundant in agricultural and remote areas in the arid and semiarid areas in the MENA region.
3. System Layout
Processing water, either for transportation or treatment, is an energy-intensive process. This challenge makes the coupling of accessing clean and fresh water with solar energy a promising field of development, with the potential to improve its sustainability by minimizing or altogether eliminating the dependence on fossil fuels and significantly reducing the operational costs.
In the optimization of an off-grid photovoltaic operated water desalination unit, the performance and cost of a PV-operated water desalination system will be investigated. The reason behind this is to find the best solution for either submersible or surface applications to desalinate brackish water or sea water. The performance of the energy storage will be intensely discussed to set out beneficial suggestions to improve and enhance the efficiency of the whole system.
Reverse osmosis is the technique that will be implemented in this research. This technique uses semi-permeable membranes. On the feed side of the membranes, applied pressure is used to induce water permeation through membranes while rejecting salts. Depending on the applied pressure, the concentration of dissolved salts in the permeate water can be controlled. The higher the applied pressure on the feed side of the membrane, the lower the salinity percentage of the permeate water and the higher the permeate flow rate.
Since the storage of energy for a PV operated water desalination plant has a high initial cost, a relatively short lifespan, and requires ample space and a controlled environment, the advantage of the correlation between the applied pressure and the salt’s concentration in the permeate water must be taken into consideration, in order to minimize the capacity of the storage system as much as possible. Such a plant requires an energy profile that matches the profile of solar radiation, so that when the solar energy increases, the applied pressure will be improved, and thus the percentage of dissolved salts will decrease (and vice versa).
A mixture of different salinity rates is required to extract a specific volume of water with a specific salinity percentage. This strategy will minimize the capacity of energy storage to a certain level.
Such a system would use the water itself to store the excess energy generated by the PV system. Thus, the higher the excess of energy generated by the solar system is, the lower the salinity level, and the higher the volume of the desalinated water (and vice versa).
Figure 4 is a schematic diagram of the designed system.
3.1. Energy Overview
There are many different types of reverse osmosis energy recovery devices. Researchers have spent decades perfecting devices that capture and recycle otherwise wasted pressure energy, making industrial systems in desalination more economical and reliable. An energy recovery device transfers the wasted energy at the membrane exit from the retentate flow, and passes it back to the incoming raw water, dramatically lowering the power required to operate the system. Here, the Clark pump pressure exchanger produced by Spectra Watermakers [
15] is an example. The Clark pump is a fixed-ratio pressure exchanger consisting of two pistons connected with a rod, as shown in
Figure 5. When the piston reaches the end, a reversing valve switches the brine and exhaust connections, and then the piston reverses its direction. The area of the rod changes the effective areas on either side of the piston, and thus the energy in the “medium pressure feed” is added to the energy in the “concentrate,” producing water at a higher pressure [
16].
3.2. Testing Apparatus
A CE530 apparatus was used in this work and is shown in
Figure 6. The CE530 is designed for the desalination of NaCl solution of up to 4 wt % maximum, with a maximum permeate capacity of 250 L per day. This amount of permeate water production is minimal and is only used for experimental laboratory purposes. The reason for using this plant is its ability to operate at different pressure levels.
Before the experimental operation, a salt solution is filled into the raw water tank. The stirring machine disseminates the salt for optimum solution progress in the water, while the pump pushes the solution out of the raw water tank to the membrane module. In the membrane module, the salt solution (raw water) is separated into a highly concentrated salt solution (retentate), in other words, the RO concentrate, and a low concentration salt solution (permeate). Permeate and retentate are fed back into the raw water tank, to maintain constant concentration during the experiment. Separation occurs according to the principle of reverse osmosis, as it requires a pressure that is higher than the osmotic pressure. The used membrane module is a spiral-wound module. It consists of the actual membrane and the pressure pipe. The membrane is located inside the pressure pipe. The membrane module is attached to the front side of the trainer as shown in
Figure 6. This apparatus was used in order to clearly understand the most important parameters affecting the flow through the reverse osmosis unit as well as the energy consumption of the unit. This system has been used due to its accessibility, and adjustability. Moreover, the results that were found using this apparatus could be expanded to other similar systems.
3.3. Experimental Results
In this experiment, 1 Kg of NaCl (Institute for Thermal Process Engineering at the TU Hamburg-Harburg, Hamburg, Germany) was dissolved in 80 L of distilled water (H2O). This means that 1.25 wt% of NaCl was used, as the density of the distilled water was equal to 997 Kg/m3. Due to the setup configurations, the minimum required pressure to operate the reverse osmosis unit was 40 bar. In this regard, the applied pressure range was 40–60 bar, with a time interval of two minutes for each trial.
Six iterations were carried out.
Table 2 illustrates the temperature results of the six trials and flow rates. The conductivity values are depicted in
Figure 7.
From
Table 2, it can be shown that the applied pressure increased from one trial to another until it reached 58 as a maximum. Moreover, increasing the pressure increased the production of desalinated water. Thus, increasing the applied pressure increased the volumetric amount of desalinated water and decreased its salinity. It is noticeable that with increased pressure, the flow rate of the retentate water also increased. As shown also, both retentate and permeate flow rates increased with increasing pressure, but the separation percentage for the retentate water decreased from 63% to 57%, while the separation percentage of the permeate water increased from 36% to 42.6%.
As shown in
Figure 7, the conductivity of the raw water stayed constant; the reason behind this is the feeding back of the retentate water and the permeate water to the tank of raw water. Moreover, the raw water tank was attached to a sterilizer, which was used to help in keeping the conductivity constant while adding retentate and permeate water synchronously back to it. Keeping the conductivity of the raw water constant is important to accurately investigate the relation between the applied pressure and the salinity, which have been noticed to be directly proportional.
As is also shown in
Figure 7, the conductivity, which is an indicator of the salinity, of the permeate water decreased with increasing applied pressure. Increasing applied pressure means increasing the consumed power, but also decreasing the amount of dissolved salts in the permeate water. Furthermore, it can be noticed that the salinity of the retentate water increased with increasing pressure. Adding the salinity of the retentate water to the salinity of the permeate water, while taking into account the flow rate for both of them, will clearly be equal to 23.2 mS/cm, which is the conductivity of the raw water as it is shown.
Figure 8 illustrates and concludes the relationship between the pressure of the raw water and three important factors: conductivity, permeate flow rate, and power consumption.
The power consumption rates shown in
Figure 8 were calculated using Equation (1).
where
P denotes the consumed power in [
kW],
Q denotes the flow rate of the raw water in [
L/S],
dP denotes the feed-in pressure in [
kPa],
pump denotes the efficiency of the pump,
motor denotes the efficiency of the motor, and η
V−Belt denotes the efficiency of the V-Belt, which connects the pump to the motor, in %. Here, the readings for the flow rate and the pressure were taken from
Table 2, while the efficiency of the pump, the motor, and the
V-Belt were estimated to be equal to 90%, 95%, and 88%, respectively [
17,
18].
Controlling the pressure of the feed-in water enhanced the efficiency of the separation process and reduced the amount of consumed power. The idea behind this research project was to increase the pressure of the feed-in water when there is an excess of PV-generated power to reduce the conductivity of the permeate water and decrease the feed-in pressure when the PV-generated power is relatively low, to produce permeate water with a relatively high salt concentration. This decreased the required capacity of the energy storage, by using permeate water with a lower salt concentration than that required and accepted as an energy storage parameter. The total produced permeate water had an average and acceptable conductivity according to the designed rates.
3.4. Meteorological Data
Meteorological data, including solar radiation, wind speed, ambient temperature, and more important information are essential to design, size and construct an optimal PV system that would fully cover the required energy by the load.
Solar radiation is the main driver of various physical, chemical, and biological processes on the surface of the earth. Accurate and complete solar radiation data are indispensable to any solar energy-related research.
The meteorological data shown in this section were collected by a weather station built at the specified location. The weather data were collected every ten minutes during 2013. The results are shown and illustrated in
Figure 9 [
19,
20].
It can be noticed that the peak solar radiation was detected in April, at 1376 W/m
2. However, this does not mean that April was the month with the highest irradiation rate. For instance, the monthly average solar radiation was registered to be maximum in June, at around 1000 w/m
2, compared to 810 W/m
2 in April. The daily average solar radiation is shown in
Figure 10 [
19,
20].
It can be seen from
Figure 10 that June had the highest average irradiation rate of all the months, while December had the lowest average irradiation rate of the year [
19,
20]. The maximum average irradiation in June was 993 W/m
2, while the maximum average irradiation in December was 487 W/m
2. The yearly average solar radiation profile is shown by the red dotted line, and it is illustrated clearly in
Figure 10. The yearly average solar irradiation was 762 W/m
2.
3.5. PV System
In this section, the design of the PV system for the selected plant is to be discussed. The desalination unit load, with two high-pressure pumps (HPP), a booster pump and a control panel, consumes a total power of 0.90 kWp. The estimated hours of operation are 24 h per day. Therefore, the Total RO load energy required is equal to 21.6 kWh/day (900 Watts * 24 h). The theoretical daily energy requirement for the system is about 21.6 kWh/day (
EL). The efficiency of the batteries (η
b), inverters (η
inv), and the PV thermal losses (η
TH) are 80%, 95%, and 85% respectively. To be on the safe side, an average peak sunshine hours of 6 h was used instead of 7 h, as seen in
Figure 10. The peak power of the PV–system (P
p−PV) was calculated using Equation (2), and it equals 6.1579 kWp, where
SF denotes the safety factor, which is estimated to be 1.3 [
21,
22].
The size of the PV modules must be such as to produce 6.1579 kWp. The selected bifacial module (B60) has a short-circuit current of 10.56 A, an open circuit voltage of 39.10 [V], a maximum rated current of 10.07 A, a maximum rated voltage of 31.80 V, and a maximum rated power of 320 Wp at STC. Therefore, the system needs approximately 20 (6157.9 Wp/320 Wp) PV modules to cover the daily energy requirements.
Since a Tristar 45 PWM solar charge controller was selected to be used, the designed PV system has to be divided into five subarrays; each one has four PV modules connected in parallel. Thus, the maximum rated current for each subarray equals 40.28 A (10.07 Amps*4).
3.6. Battery Bank
The battery bank is required to store excess energy from sunny days to provide the load with the power needed when there is a shortage of PV-generated power (during cloudy days and nights).
Lead-acid VARTA OPzS batteries with a rated voltage of 2 volts were selected to store the excess energy. The batteries are of type 10 OPz S1000.
The capacity of the battery in
Wh (
EBattery) was calculated as per Equation (3), and it has been found that a 46.184 kWh storage capacity is needed, while the depth of discharge (
DOD) is considered to be 80% (State of Charge (SOC) = 20
); the battery’s efficiency is 80%, the inverter’s efficiency is 95%, and the safety factor is 1.3 [
21,
22].
The required number of batteries (
) has been calculated using Equation (4), and it has been found that 24 batteries are required to fully cover the load for one day of autonomy
for the selected plant in the Jordan Valley.
The 24 batteries were connected in series to give a total voltage of 48 Volts.
Battery reduction is a major benefit when using a variable pressure design, as mentioned earlier. Thus, four scenarios are discussed to examine the effect on the needed energy storage. For this purpose, several factors were taken in calculating , which were raw water flow rate, inlet pressure, permeate water flow rate, and permeate water conductivity. In these calculations, there are reference values, which are mainly dependent on a constant inlet pressure for 24 h per day to satisfy the requirements of the system. The other scenarios were built assuming a variable pressure over the day, depending on the amount of insolation. Thus, the higher the insolation, the higher the inlet pressure, and vice versa. The number of batteries was calculated for the reference scenario, as well as for the other scenarios, depending on the assumption for a 24 h period of operation in kWh/m3. However, in the case of variable pressure, the number of batteries was calculated for each pressure level and period of the day separately, and then summed up together.
As shown in
Table 3, the overall energy storage capacity for the testing apparatus was around 2 kWh using the constant pressure desalination plant, where the operating pressure is fixed to be 48 bar. This value is reduced while controlling the operating pressure in all other scenarios. The minimum energy storage capacity was achieved when applying scenario four, where three periods of time were applied: 14 h at low irradiation, 8 h at medium irradiation, and only 2 h at maximum irradiation. Pressure values where selected to be 40, 44, and 58 bars respectively. It is also noted that the permeate flow rate is reduced with an average of 18% for the four scenarios and this is to be considered one of the disadvantages of this design. It is also noted that in Scenario 4, the conductivity of the permeate water has increased by a factor of ~2%, referring to the reference state.
As a result, adapting Scenario 4 on the desalination plant, as shown in
Table 3, will reduce the required number of batteries from 1 to 0.8 per unit (pu), considering 2.0188 kWh as the reference battery energy (1 pu), where no pressure variation is performed, and will also reduce the permeate flow rate by a factor of 20% and increase the total conductivity of the permeate water by ~2%.

 ,
, 


