Article

Transport Properties of Film and Bulk Sr0.98Zr0.95Y0.05O3−δ Membranes

by
Adelya Khaliullina
,
Liliya Dunyushkina
* and
Alexander Pankratov
Institute of High Temperature Electrochemistry, 620137 Ekaterinburg, Russia
*
Author to whom correspondence should be addressed.
Appl. Sci. 2020, 10(7), 2229; https://doi.org/10.3390/app10072229
Submission received: 20 February 2020 / Revised: 18 March 2020 / Accepted: 23 March 2020 / Published: 25 March 2020
(This article belongs to the Special Issue Proton Conducting Solid Oxide Fuel Cells)

Abstract

:
In electrode-supported solid oxide fuel cells (SOFCs) with a thin electrolyte, the electrolyte performance can be affected by its interaction with the electrode, therefore, it is particularly important to study the charge transport properties of thin electrode-supported electrolytes. The transport numbers of charged species in Ni-cermet supported Sr0.98Zr0.95Y0.05O3−δ (SZY) membranes were studied and compared to those of the bulk membrane. SZY films of 2.5 μm thickness were fabricated by the chemical solution deposition technique. It was shown that the surface layer of the films contained 1.5–2 at.% Ni due to Ni diffusion from the substrate. The Ni-cermet supported 2.5 μm-thick membrane operating in the fuel cell mode was found to possess the effective transport number of oxygen ions of 0.97 at 550 °C, close to that for the bulk SZY membrane (0.99). The high ionic transport numbers indicate that diffusional interaction between SZY films and Ni-cermet supporting electrodes does not entail electrolyte degradation. The relationship between SZY conductivity and oxygen partial pressure was derived from the data on effective conductivity and ionic transport numbers for the membrane operating under two different oxygen partial pressure gradients—in air/argon and air/hydrogen concentration cells.

1. Introduction

The growth of global energy consumption requires the development of effective energy conversion methods. Solid oxide fuel cells (SOFCs) are promising devices for the conversion of fuel energy to electricity with high efficiency and low environmental pollution [1,2]. SOFCs based on proton-conducting electrolytes offer significant advantages compared to those using oxygen ion conducting electrolytes. Among these benefits, a lower operating temperature due to an acceptable conductivity in the proton-conducting oxides at intermediate temperatures, and the ability to produce pure hydrogen on the hydrogen electrode avoiding the problem of fuel dilution by mixing with water, appear to be the most important ones. Reducing the operating temperature lowers the cost and enhances the durability and reliability of SOFCs [2,3].
A further enhancement of SOFC performance can be achieved through a decrease in electrolyte thickness. Nowadays, the application of thin-film membranes for the development of portable powering microdevices is considered a significant part of an upcoming nanoionics revolution [4,5]. The high performance of SOFCs with a thin-film electrolyte was demonstrated in [6,7,8,9,10,11,12,13,14]. However, thin-film SOFC efficiency was reported to be sensitive to the diffusional interaction between the electrolyte and the electrodes [4,15,16,17,18,19]. Thin films usually exhibit a nanograined structure, which enhances the effect of material interaction as diffusion along the grain boundaries is much faster than in the grain bulk [16,19,20]. The diffusion of metal ions from the supporting electrode into the electrolyte film during processing can entail an increase of the electronic conductivity and therefore a decrease in the power generation efficiency and overall lifespan of the membrane [18]. Besides, in the extreme operating conditions of SOFC, phase stability degradation of a thin-film electrolyte can proceed faster compared to a bulk electrolyte because of a large ratio of surface to volume [21]. For these reasons, the problem of material selection and processing for the SOFCs with a thin-film membrane is expected to be more significant than for the electrolyte-supported SOFCs.
Among different families of proton-conducting oxides, perovskite-type acceptor-doped strontium zirconate is likely to be an appropriate material for a thin-film membrane for SOFCs since it was reported to exhibit both proton conductivity and high chemical stability required for the long-term performance [22,23,24,25,26,27]. Undoped strontium zirconate exhibits rather low conductivity, however, the substitution of acceptor ions (Y, Dy, Yb, etc.) at Zr positions enhances conductivity due to increasing oxygen vacancies concentration [22,23,24,25,26]. Acceptor-doped SrZrO3 was shown to possess almost pure protonic conduction in a hydrogen atmosphere, whereas in wet oxidizing atmospheres it is a mixed proton and electron-hole conductor [22]. Besides, a small strontium deficiency was shown to improve the conductivity of SrZrO3-based electrolytes due to an increase in the oxygen vacancy concentration [23,28]. In our previous study, we found that Sr0.98Zr0.95Y0.05O3−δ composition possessed the highest conductivity (~10−3 S cm−1 at 800 °C) among SrxZr0.95Y0.05O3−δ (0.94 < x < 1.02) ceramic samples [28]. That is why this composition was chosen for investigation in the present research.
The main objective of the present research is to study the charge transport properties of a thin electrode-supported Sr0.98Zr0.95Y0.05O3−δ (SZY) film. The electrical conductivity and ionic transport numbers of SZY film deposited on NiO-YSZ (YSZ—yttria-stabilized zirconia) substrate, which was supposed to operate as a supporting anode, were determined, and the applicability of thin strontium zirconate based electrolyte in combination with Ni-cermet supporting anode in SOFCs was evaluated. SZY films were fabricated via a multi-step chemical solution deposition (CSD) technique [15,29,30]. The most significant advantages of this technique are the simplicity of complex oxide film deposition, moderate temperature synthesis and the convenience of film deposition on substrates with different shapes, which enables the fabrication of SOFCs with planar and tubular configurations. The obtained films were characterized by X-ray diffraction (XRD), scanning electron microscopy (SEM) and energy-dispersive X-ray spectroscopy (EDX). The conductivity of the samples was studied using impedance spectroscopy (IS). The transport numbers of the thin Ni-cermet supported SZY membrane were determined with the help of a gas concentration cell and compared to those of the bulk SZY sample. Open circuit voltage (OCV), IS and current-voltage (CV) measurements were carried out on the concentration cells with the film and bulk SZY membranes.
To the best of our knowledge, this is the first study of the electrical conductivity and transport numbers in the Ni-cermet-supported SZY membrane. Furthermore, it was shown that a relationship between the electrolyte conductivity and the oxygen partial pressure can be derived from the data on the effective conductivity and transport numbers of oxygen ions in the membrane operating in oxygen activity gradients, and hence the oxygen–ion transport number in the electrolyte can be evaluated in a wide range of pO2.

2. Materials and Methods

2.1. Preparation of Bulk Samples of SZY

Sr0.98Zr0.95Y0.05O3−δ powders were synthesized via a soft chemistry route using SrCO3, ZrOCl2 ∙ 8H2O and Y(NO3)3 ∙ nH2O (all with 99% purity) as precursors. ZrOCl2 ∙ 8H2O and Y(NO3)3 ∙ nH2O were dissolved in distilled water and ethanol, respectively. Concentrations of the solutions were equal to 49.7 g of ZrO2 and 81.3 g of Y2O3 per 1 liter. Stoichiometric amounts of these solutions and SrCO3 powder were mixed. Then citric acid (molar ratio of citric acid to cations was equal to 2) was added to the solution. After dissolving of citric acid, ethylene glycol (molar ratio of ethylene glycol to metal cations was equal to 5) was added. After stirring, the solution was installed on a hot plate to evaporate the solvent, then heated to 1100 °C and held at this temperature for 2 h. The obtained powder was thoroughly ground, calcined at 1200 °C for 2 h, then ground again. The obtained powder was uniaxially pressed into pellets at 130 MPa. The pellets were sintered at 1650 °C for 5 h.

2.2. Preparation of SZY Films

The films were fabricated by the CSD technique. Sr(NO3)2 ∙ nH2O, ZrOCl2 ∙ 8H2O and Y(NO3)3 ∙ nH2O were used as starting reagents. First, solutions of ZrOCl2 ∙ 8H2O and Y(NO3)3 ∙ nH2O in ethanol and Sr(NO3)2 ∙ nH2O in ethanol/distilled water mixture were prepared. The volume ratio of the ethanol/water mixture was 6:1 (water adding was required because of the extremely low solubility of strontium nitrate in ethanol). Then, the prescribed amounts of the individual solutions corresponding to the composition of Sr0.98Zr0.95Y0.05O3−δ were mixed. The concentration of the obtained solution was 18.6 g of SZY per 1 L. Pellets of NiO-YSZ composite (SOFCMAN, Ningbo City, China) with a ceramic phase of YSZ were used as substrates. In the reduced state, the Ni phase is homogeneously distributed in the ceramic phase that makes Ni-YSZ composite an effective anode. The solution was deposited by the multi-step (25 cycles) dip-coating and withdrawal of NiO-YSZ substrates from the solution with a rate of 0.1–0.2 cm min−1, followed by the synthesis in air at 1000 °C for 1 h. After the film deposition, one of the two parallel sides of the substrate was polished to remove the coating.

2.3. Characterization

The phase composition of the samples was studied using X-ray diffraction (XRD) analysis. Measurements were performed on a Rigaku D-Max 2200 (Tokyo, Japan) diffractometer with Cu K 1 radiation. The deposited films were studied using XRD in the mode of grazing incidence diffraction (an angle of incidence was 1.5°). Microstructure and chemical composition of the samples were characterized by scanning electron microscopy (SEM) and energy-dispersive X-ray spectroscopy (EDX) using MIRA 3 LMU (Tescan, Brno, Czechia) equipped with a system Oxford Instruments INCA Energy 350 X-max 80 (Abingdon, UK). For the microstructural investigation of ceramic samples, the sintered SZY pellets were polished finishing with 1 m grit diamond paste and then thermally etched at the temperatures of 1400 °C for 4 h to reveal grain boundaries. The density of the pellets determined as a ratio of their weight and volume was equal to 93% of the theoretical value, which was estimated using unit cell parameters.
The film thickness was evaluated from SEM images of the fractured cross-section of SZY-film/NiO-YSZ pellets. For the film gas-tightness measurements, the differential-pressure method was used. A pressure difference on the opposite sides of the sample separating two chambers with different gas pressures causes gas leakage through the sample. The coefficient K of the gas leakage can be calculated using the following relation:
K = d Δ P d t η h V o Δ P S P o
where ΔP is the change of gas pressure in the low-pressure chamber during time t, Po is the atmospheric pressure, Vo is the volume of the low-pressure gas chamber, η is the gas viscosity, h and S are the thickness and the surface area of the sample. The measurements were carried out in air at room temperature; the lower pressure of 104 Pa was created using a vacuum pump.

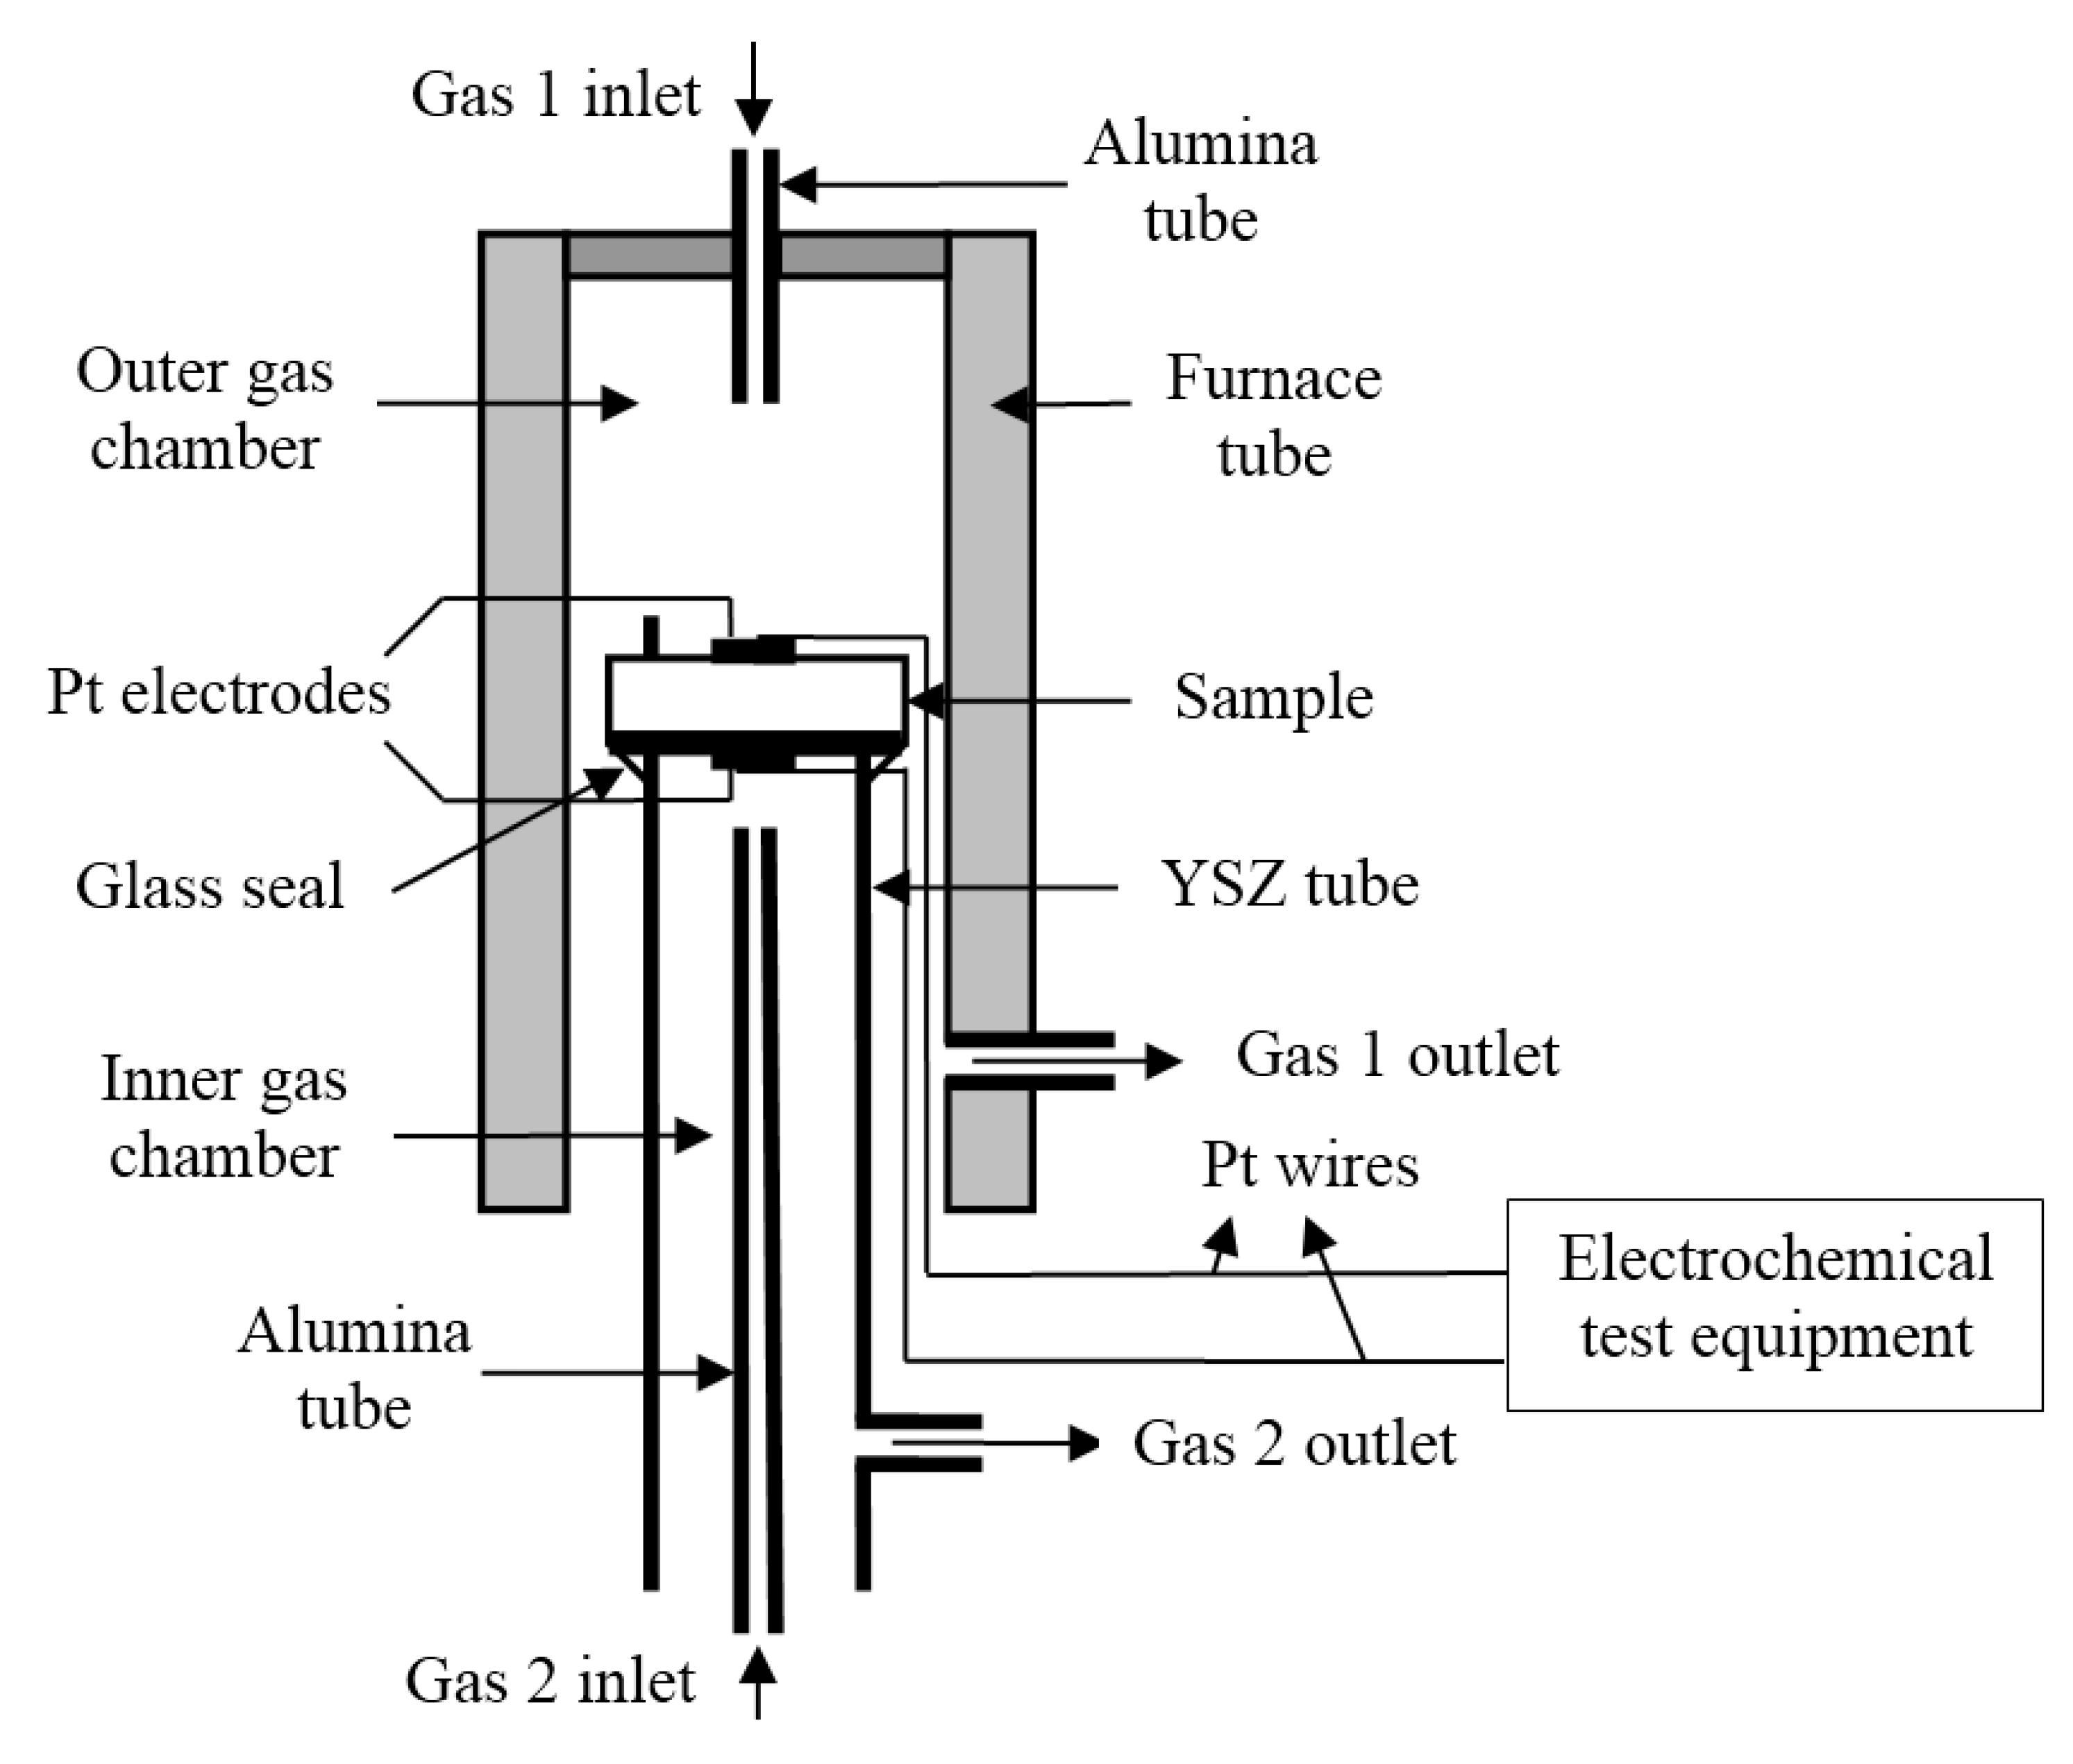
2.4. Measurement Description

The electrical conductivity of the bulk SZY sample was measured using two-probe AC impedance spectroscopy (Parstat 2273-SVS, USA) across the frequency range of 0.1Hz–1MHz, using an amplitude of 30 mV. For the electrical measurements, symmetrical Pt electrodes were made on opposite sides of the pellet by painting a platinum paste and firing at 1000 °C for 1 h. The impedance measurements were carried out in wet air (pH2O = 3365 Pa) and wet hydrogen (pH2O = 3365 Pa) in the temperature range of 300–800 °C. The required humidity was achieved by bubbling the gas through a water bath with a temperature of 26 °C. The samples were equilibrated with the ambient gas for 24 h before the measurements. The measured Nyquist plots were fitted using the software EQUIVCRT 4.51 [31,32].
For the transport numbers determination, gas concentration cells with separated gas chambers were fabricated. The cell testing apparatus is schematically shown in Figure 1. SZY pellets with a thickness of 0.12 cm and NiO-YSZ supported SZY film with a thickness of 2.5 μm were studied. The platinum paste was symmetrically applied to each side of SZY and SZY-film/NiO-YSZ pellets along with current collectors made out of platinum wire and fired at 1000 °C for 1 h. Then the pellets were fixed to the tube made of YSZ electrolyte using spring-loaded rods. For the film sample study, the film-coated side of NiO-YSZ pellet faced YSZ tube. The contact between the sample and the tube was filled with a glass possessing a softening temperature of 950 °C. The sealing glass was used to avoid gas leakage through the contact.
Then the testing assembly was placed into a tubular furnace. The inner gas chamber was confined inside the YSZ tube, while the furnace tube confined the outer chamber. After heating to 950 °C, the furnace was dwelled for 5 minutes to soften the glass, and then cooled down to 800 °C for testing. Before the electrical measurements on the film membrane, NiO-YSZ substrate was reduced in-situ in a hydrogen atmosphere as follows. It is known that during the reduction process, the initial volume of NiO phase is reduced by about 40% creating pores. To prevent the film cracking or delamination because of the growing substrate’s porosity, the outer gas compartment was fed with Ar-H2 gas mixtures with a stepwise hydrogen content increase (10% H2, 20% H2, …, 100% H2) at a flow rate of 2 L h−1 and duration of 1 h for each step, and holding isothermal at 800 °C in hydrogen atmosphere until achieving a constant value of OCV on the concentration cell. The gas flows were controlled using the mass flow controllers RRG-12 and the electronic control unit BUIP-3 (Eltochpribor, Moscow, Zelenograd, Russia).
Measurements of OCV, IS and CV characteristics of the concentration cells Gas1, Pt/SZY/Pt, Gas2 (Cell 1) and Gas1, Pt/Ni-YSZ/SZY-film/Pt, Gas2 (Cell 2) were performed using Potentiostat-Galvanostat P-45X (Elins, Zelenograd, Russia). Impedance measurements were carried out across the frequencies from 0.1 Hz to 500 kHz. The applied amplitude was 30 mV. The oxygen gradient across the SZY membranes was established between atmospheric air (pO2 = 21 kPa, Gas 2), and a lower value (Gas 1) obtained by passing of argon or wet hydrogen. The gases were supplied at a flow rate of 2 L h−1. The residual pO2 in Ar was 10 Pa. The values of pO2 in wet hydrogen were determined using the equilibrium constant of the water formation reaction. The water content in the gases was varied by passing gas flows through the column with zeolite beads (pH2O ≈ 40 Pa), or by bubbling through a water bath with a temperature of 0, 26 or 30 °C (pH2O = 610, 3365 and 4240 Pa, respectively). The temperature was varied from 500 to 800 °C.

3. Results and Discussion

3.1. Samples Characterization

According to XRD data presented in Figure 2, both the bulk and film samples of SZY possess an orthorhombic perovskite-type structure. For SZY film, except for the peaks of the orthorhombic SrZrO3 phase, small reflexes of NiO and YSZ phases caused by the substrate response were recorded.
SEM images of the pellet and film surfaces are depicted in Figure 3. The ceramic sample sintered at 1650 °C demonstrates dense grained microstructure with grains up to 4–5 µm (Figure 3a). The film sintered at a lower temperature (1000 °C) has small-grained morphology with grains of 100–200 nm (Figure 3b). As can be seen in Figure 3a,b, there are no cracks or fractures on the sample’s surfaces, however, a few pinholes can be observed on the film surface. That is why the deposition of several layers is required for achieving sufficient gas-tightness of the film. The film thickness evaluated from the cross-section image of the NiO-YSZ supported film was 2.5 ± 0.1 μm (Figure 3c).
The chemical composition of NiO-YSZ supported SZY film was analyzed using SEM/EDX. The atomic ratio of Sr, Zr and Y elements was 0.95:0.98:0.02. So far as the effective probe depth of EDX is about 1 µm, the obtained results characterize the outer 1 µm layer of the 2.5 µm -thick film. The EDX data indicate that Ni concentration in the outer film layer is 1.5–2 at.%, which can be caused by nickel diffusion from the substrate during the film synthesis. These results correlate with the study of Ni diffusion in 1 µm thick CeO2 film by secondary ion mass spectroscopy technique which has also shown the presence of Ni throughout the entire film after the heat treatment at 800 °C [16].
The film gas-tightness was measured after the reducing firing of SZY-film/NiO-YSZ pellets. The gas leakage coefficient was in the range of (2–5) ∙ 10−17 m2 that is comparable with the values reported for YSZ films deposited by the low pressure and atmospheric plasma spraying and supposed to be sufficient for the SOFC membranes [33].

3.2. Transport Numbers in SZY Membranes

3.2.1. Transport Numbers of Oxygen Ions in the Bulk and Film SZY Membranes

It is known that the transport number of species i in a mixed-conducting material is determined as:
t i = σ i σ
where σi and σ denote the partial conductivity of species i and the total conductivity.
The effective transport numbers of oxygen ions were determined for both the bulk and film SZY membranes exposed to a gradient in the chemical activity of oxygen. The anode and cathode gas chambers of the concentration cells were fed with humid hydrogen and humid air, respectively, at a flow rate of 2 L h−1. The values of humidity of the gases were equal (pH2O = 3365 Pa) to eliminate proton defects transport. After reaching a stationary state, the measurements of OCV, IS and CV characteristics were performed.
A transport number of oxygen ions, t O 2 , in a membrane exposed to pO2 gradient may be determined as:
t O 2 = E m E N
where Em is a measured value of OCV and EN is a theoretical EMF for an oxygen concentration cell. EN is determined by the Nernst equation:
E N = R T n F ln p O 2 ( 1 ) p O 2 ( 2 )
where n is the number of electrons transferred in the cell reaction (n = 4 for oxygen), pO2(1) and pO2(2) are the oxygen partial pressures at the opposite sides of the membrane, F is the Faraday’s constant, R is the universal gas constant and T is the temperature.
However, the ratio of OCV to the Nernst EMF can differ noticeably from the ionic transport number if polarization resistance of a concentration cell is significant. Measuring the impedance of a gas concentration cell, in addition to OCV measurements, was suggested for taking into consideration the cell polarization [34,35]. In this case, the ionic transport number may be calculated as
t O 2 = 1 R E R T ( 1 E m E N )
where RE and RT are an electrolyte resistance and a total cell resistance which can be determined from the impedance spectrum [34].
In the electrode-supported cells with a thin-film electrolyte, the electrode polarization can be significant because of the increase of the electrode thickness. That is why Liu’s approach was applied for the determination of the effective transport numbers in the present study. The values of Em, RE and RT were obtained from the measurements of OCV, IS and CV on gas concentration cells. In the air/H2 gradient, the measurements were carried out for both bulk membrane and Ni-YSZ-supported film, whereas in oxidizing atmospheres only bulk membrane was studied as NiO-YSZ does not act as the electrode at high pO2.
Impedance spectra of Cells 1 and 2 exposed to pO2(air)/pO2(H2) gradient in the Nyquist representation are depicted in Figure 4. Humidity levels in air and hydrogen were equal (pH2O = 3365 Pa) to prevent proton transport in the membrane. The Nyquist plots for Cell 1 exhibit a fragment of a high-frequency arc and a low-frequency semicircle (Figure 4a). The impedance has been fitted to the equivalent circuit Rb(RgbQgb)(RelQel) composed of Rb resistor and two parallel RQ elements (Q is a constant phase element) connected in series using the software EQUIVCRT 4.51. The value of Rb corresponds to the grain bulk resistance of the electrolyte. The high-frequency semicircle with a characteristic capacitance of 10−9 F cm−2 which is typical for the grain boundary response in ceramic electrolytes was ascribed to the response of the grain boundaries of SZY. The characteristic capacitance of the low-frequency arc (10−6 F cm−2) is typical for an electrolyte–electrode interface, so it can be considered as the electrode response. The oxygen–ion transport numbers were calculated using Equation (5) and the obtained values of RT and RE (RE = Rb + Rgb).
For Cell 2, the Nyquist plots are characterized by the appearance of a small fragment of a high-frequency arc related to the electrolyte response and two overlapping arcs at lower frequencies with characteristic capacitances of 10−6 and 10−3 F cm−2, which were ascribed to the effects of the electrode (Figure 4b). So far as the impedance spectra of Cell 2 were far from completed in the low-frequency region (see Figure 4b), the values of RT were determined from the measurement of the tangents to the CV curves of the concentration cell at low current values (the CV curves are shown in the insert to Figure 4b). The significantly different shapes of the electrode response of Cell 1 and Cell 2 were caused by the different compositions and geometries of the anode; the polarization resistance of the Ni-YSZ-anode supported cell was much larger than that of the electrolyte-supported cell (see Figure 4a,b). The spectra have been fitted to the equivalent circuit Rb(RgbQgb)(Rel,1Qel,1)(Rel,2Qel,2). The equivalent circuits for Cells 1 and 2 are given in Figure 4c,d.
In oxidizing atmospheres, the measurements were performed on Cell 1 supplied with air and argon with the same amount of humidity (pH2O = 3365 Pa) to prevent proton transport. So, the cell configuration may be designated as pO2(air), Pt/SZY/Pt, pO2(Ar). Typical impedance spectra of the cell in the Nyquist representation are depicted in Figure 5. The spectra consist of a fragment of a high-frequency semicircle with a characteristic capacitance of 10−9 F cm−2 related with the electrolyte response and a low-frequency semicircle with a characteristic capacitance of 10−6–10−5 F cm−2 ascribed to the polarization of the electrodes.
The area-specific values of RE and RT obtained from the impedance data and used for calculation of transport numbers as functions of inverse temperature are presented in Figure S1. As can be seen, the film membrane resistance is about one order of magnitude smaller than the resistance of the bulk membrane (Figure S1a), however, the difference between the total resistances of the cells is much smaller (Figure S1b), which is caused by a higher polarization resistance of the electrode-supported cell. The values of the measured OCV (Em) and the theoretical EMF (EN) for the gas concentration cells are shown in Figure S2. The temperature dependences of Em and EN are somewhat different, since Em, unlike EN, is affected by the temperature-dependent electrode polarization.
Figure 6 illustrates temperature dependences of the effective conductivity σ ¯ of the bulk and film SZY membranes exposed to pO2(air)/pO2(H2) and pO2(air)/pO2(Ar) gradients, which were calculated using the following relation:
σ ¯ = l R E S
where l is a membrane thickness, S is a surface area of electrodes.
As can be seen, the effective conductivity of the film is about one order of magnitude smaller than that of the bulk membrane. One can assume that the difference is caused by a larger contribution of the grain boundary resistance of the film because of the smaller grain size compared to the bulk sample. It is known that in oxygen–ion conducting solid electrolytes, ion transport across the grain boundary regions is hindered because of oxygen vacancy accumulation and formation of a positively charged core [4,36,37,38,39]. The activation energy of the effective conductivity of the film (98 eV) is somewhat higher than that of the bulk membrane (85 eV) that also indicates the larger contribution of grain boundaries typically possessing higher activation barriers in solid oxide electrolytes [40]. However, an accurate separation of the bulk and grain boundary resistances for the film membrane from the impedance spectra was hindered because of the instrument limitations.
Temperature dependences of the effective transport numbers of the ceramic and film membranes in the air/argon and air/hydrogen concentration cells calculated using Equation (5) are shown in Figure 7. As can be seen, the effective transport numbers of oxygen ions increase with the decreasing temperature approaching the values of 0.99 and 0.97 for the bulk and film SZY membranes exposed to pO2(air)/pO2(H2) gradient, respectively, at 550 °C. In the air/argon cell the ionic transport numbers are lower, and the difference rises with the temperature increase, which is caused by increasing hole conductivity in oxidizing atmospheres.
A high ionic transport number close to unity is the key requirement for the solid electrolyte to minimize a leakage current in a SOFC [41]. So, the Ni-cermet-supported 2.5 µm-thick SZY membrane operating in the fuel cell mode (the air/hydrogen concentration cell) possesses almost pure ionic conduction in the temperature range of 500–600 °C, and therefore can operate as a SOFC membrane.

3.2.2. Conductivity and Transport Numbers of Oxygen Ions as Functions of the Oxygen Partial Pressure

Total conductivity of a typical acceptor doped oxide includes ionic, hole and electron contributions and can be written as:
σ = σ O 2 + σ ho p O 2 1 / 4 + σ eo p O 2 1 / 4
where σho and σeo denote the conductivity of electron holes and electrons, respectively, at pO2 = 1 atm, σ O 2 is the oxygen ion conductivity which remains invariable with pO2 change.
Three parameters, σ O 2 , σho and σeo, are required to calculate the total conductivity and therefore the transport number of oxygen ions as functions of pO2 using Equation (7). These parameters can be determined from the measurements on the gas concentration cells as follows.
The effective total conductivity of the mixed-conducting membrane separating air and hydrogen atmospheres can be obtained by integrating Equation (7) over the corresponding pO2 range:
σ ¯ ( air / H 2 ) = σ O 2 + σ ho p O 2 , H 2 p O 2 , air p O 2 1 / 4 d p + σ eo p O 2 , H 2 p O 2 , air p O 2 1 / 4 d p p O 2 ( air ) p O 2 ( H 2 )
To simplify the task, consider the membrane exposed to the pO2 gradient in oxidizing atmospheres, for example in the air/argon gradient. In this case, Equation (7) can be simplified by neglecting the last contribution, so that Equation (8) can be transformed to:
σ ¯ ( air / Ar ) = σ O 2 + σ ho p O 2 , A r p O 2 , air p O 2 1 / 4 d p p O 2 ( air ) p O 2 ( Ar )
The value of σ O 2 can be obtained using the following expression:
t ¯ o 2 ( air / Ar ) = σ o 2 σ ¯ ( air / Ar )
relating the oxygen–ion conductivity to the effective transport number and the effective conductivity in the membrane exposed to the air/argon gradient, which was obtained experimentally.
Now the value of σho can be easily derived from Equation (9):
σ ho = ( σ ¯ ( air / H 2 ) σ O 2 ) Δ p O 2 p O 2 , Ar p O 2 , air p O 2 1 / 4 d p
where ΔpO2 = pO2 (air) − pO2 (Ar) = 21 kPa – 10 Pa ≈ 21 kPa.
Finally, the factor σeo can be calculated from Equation (8) as follows:
σ eo = ( σ ¯ ( air / H 2 ) σ O 2 ) Δ p O 2 σ ho p O 2 , H 2 p O 2 , air p O 2 1 / 4 d p p O 2 , H 2 p O 2 , air p O 2 1 / 4 d p
Using the obtained parameters of σ O 2 , σho and σeo, the total, oxygen–ion, electron and hole conductivities, σ, σ O 2 , σe and σh, as well as the transport numbers of oxygen ions, electrons and holes, t O 2 , te and th, can be calculated at any pO2 value. For illustration, the temperature dependences of the total, oxygen-ion and electron-hole conductivities of SZY in air (pO2 ≈ 21 kPa) calculated with the help of Equations (7)–(12) are shown in Figure 8. For comparison, the total conductivity of the bulk SZY sample in air obtained from the impedance measurements and the conductivity of a bulk sample of SrZr0.9Y0.1O3−δ measured in wet oxidizing conditions (wet oxygen, pH2O ≈ 3000 Pa) reported in [42] are also presented in Figure 8. It can be seen that the calculated and measured values of conductivity are in good agreement.
The calculated and experimentally obtained values of the total, oxygen–ion and hole conductivity of the bulk SZY sample in humid air (pH2O = 3365 Pa) at 550 °C and the corresponding activation energies are given in Table 1.
The pO2-dependences of the total conductivity and transport numbers of oxygen ions, holes and electrons in SZY calculated using Equations (2) and (7) are shown in Figure 9. The calculated conductivity satisfactorily agrees with the experimentally obtained values of conductivity of SZY in wet air and wet hydrogen (pH2O = 3365 Pa) that indicates the reliability of the proposed approach. For comparison, the conductivity of undoped SrZrO3 as a function of pO2 at 900 °C reported in [43] is shown in Figure 9a; it can be seen that the dependence is similar to those obtained in our research. Figure 9b shows that SZY possesses almost pure ionic conduction in a wide range of pO2 at intermediate temperatures (500–700 °C), however the electrolytic area of SZY decreases with increasing temperature.

3.2.3. Transport Numbers of Protons in the Bulk SZY Membrane in Oxidizing Atmospheres

The effective transport numbers of protons, t ¯ OH , in the bulk SZY membrane in air were measured using a water vapor concentration cell pH2O/, Pt/SZY/Pt, pH2O//. Air flows with the different humidities (pH2O/ = 40 Pa, pH2O// = 610, 3365 and 4240 Pa) at a flow rate of approximately 2 L h−1 were supplied to the gas chambers of the cell. EIS and OCV measurements were performed in the temperature range of 500–800 °C. For illustration, the impedance spectra of the water vapor concentration cell at 750 °C are shown in Figure 10.
To account for the electrode polarization, Equation (5) and the data of OCV and IS measurements were used for calculation of the effective proton transport numbers as well as it was done for oxygen ions. The Nernst EMF of the water vapor concentration cell can be written as:
E N = R T 2 F ln p H 2 O / / p H 2 O /
The values of RT and RE (RE = Rb + Rgb) obtained by fitting the impedance data to the equivalent circuit Rb(RgbQgb)(Rel,1Qel,1)(Rel,2Qel,2) are given in Figure S3. Figure S4 shows the temperature dependences of EN and Em for the water vapor concentration cells.
The evolution of the effective proton transport numbers, t ¯ OH , as a function of pH2O// and temperature are presented in Figure 11. As can be seen the effective transport number of protons increases with increasing pH2O// which can be explained as follows. In wet atmospheres, the dissolution of protons may be described by the hydration reaction:
H 2 O ( g ) + V O + O O ×     2 OH O
where O O × is an oxygen ion in a normal lattice site, V O is an oxygen vacancy, OH O denotes a proton localized on an oxygen ion, or a proton defect. It follows from reaction in Equation (13) that the concentration of proton defects has to increase proportionally to pH2O1/2 at the cost of oxygen vacancies. Therefore, the effective proton transport number in the membrane exposed to the water vapor gradient should increase with a rise of pH2O//.
The effective proton transport number increases with decreasing temperature reaching saturation at T ≈ 600 °C. This fact is in accordance with a common idea that at low temperatures the concentrations of proton defects equal the saturation limit and are therefore independent on temperature [44]. The largest value of the effective proton transport number ( t ¯ OH = 0.87) in the ceramic SZY membrane exposed to a gradient of pH2O was obtained at pH2O/ = 40 Pa, pH2O// = 4240 Pa in the temperature range from 500 to 600 °C. Thus, SZY shows predominant proton conductivity in wet air at intermediate temperatures. The data on the proton transport numbers obtained in our research are in good agreement with those reported for SrZr0.9Y0.1O3−δ in [45]: the proton transport numbers in wet air under pH2O-gradients are close to 0.8 at 700 °C, and also increases with increasing pH2O-gradient and decreasing temperature.

4. Conclusions

The transport numbers of oxygen–ion conduction in the bulk and 2.5 µm-thick Ni-cermet supported Sr0.98Zr0.95Y0.05O3−δ (SZY) membranes were studied. The film fabricated via a multi-step chemical solution deposition and synthesized at 1000 °C showed a nanograined morphology with grains of 100–200 nm. The bulk sample obtained by a soft chemistry route followed by sintering at 1650 °C possessed a dense microstructure with grains of up to 4–5 µm. It was found that the Ni-cermet supported film contains nickel due to the diffusional interaction with the substrate.
Despite Ni diffusion, the 2.5 μm-thick membrane operating in the fuel cell mode was found to possess highly effective transport numbers of oxygen ions close to those of the bulk membrane (0.97 and 0.99 at 550 °C, respectively). The high transport numbers of ionic conduction in the thin Ni-cermet supported electrolyte indicates that the diffusional interaction with the supporting electrode, which is expected to be more intensive during the film synthesis at 1000 °C and less intensive during the cell operation (500–800 °C) does not lead to electrolyte degradation, and therefore this combination of materials is appropriate for application in SOFCs. The effective proton transport number of 0.87 was reached in the bulk SZY membrane operating in humid air at temperatures from 500 to 600 °C.
The film conductivity was shown to be one order of magnitude smaller than that of the bulk membrane. The difference is caused by a larger contribution of the grain boundary resistance of the nanograined film. To improve the film conductivity, the temperature of the film sintering is to be increased. The next step of our research will involve a study to reveal the effect of the film sintering temperature on the electrochemical performance of Ni-cermet supported cells.
Using the data on the effective conductivity and the effective transport numbers of oxygen ions in SZY membrane operating in the fuel cell mode and oxidizing conditions, and assuming the conventional model of defect formation in acceptor doped oxides, the relationship between the total conductivity of SZY and the oxygen partial pressure was derived. The good agreement of the calculated conductivity values with the experimentally obtained data indicates the reliability of the applied approach.

Supplementary Materials

The following are available online at https://www.mdpi.com/2076-3417/10/7/2229/s1, Figure S1: The area specific values of RE (a) and RT (b) as functions of inverse temperature for the gas concentration cells air/H2 and air/Ar with the bulk and film SZY membranes, Figure S2: Temperature dependences of Em and EN for the gas concentration cells: (a) air/H2, (b) air/Ar, Figure S3: The area specific values of RE (a) and RT (b) as functions of inverse temperature for the gas concentration cells pH2O/, Pt/SZY/Pt, pH2O// in air at pH2O/ = 40 Pa and pH2O// = 4240, 3365 and 610 Pa., Figure S4: Temperature dependences of EN and Em for the gas concentration cell pH2O/, Pt/SZY/Pt, pH2O// in air at pH2O/ = 40 Pa and pH2O// = 4240, 3365 and 610 Pa.

Author Contributions

Conceptualization, A.K. and L.D.; methodology and validation, A.K. and L.D.; formal analysis, A.K.; investigation, A.K. and A.P.; resources, L.D.; data curation, L.D.; writing—original draft preparation, A.K.; writing—review and editing, L.D.; visualization, A.K. and L.D.; supervision, L.D.; project administration, L.D.; funding acquisition, L.D. All authors have read and agreed to the published version of the manuscript.

Funding

This research was funded by Ural Branch of the Russian Academy of Sciences, project number 18-10-3-42.

Acknowledgments

SEM: EDX and XRD experiments were done using facilities of the shared access center “Composition of compounds” (Institute of High-Temperature Electrochemistry, Ural Branch of the Russian Academy of Sciences).

Conflicts of Interest

The authors declare no conflict of interest. The funders had no role in the design of the study; in the collection, analyses, or interpretation of data; in the writing of the manuscript, or in the decision to publish the results.

References

  1. Irshad, M.; Siraj, K.; Raza, R.; Ali, A.; Tiwari, P.; Zhu, B.; Rafique, A.; Ali, A.; Ullah, M.K.; Usman, A. A brief description of high temperature solid oxide fuel cell’s operation, materials, design, fabrication, technologies and performance. Appl. Sci. 2016, 6, 75. [Google Scholar] [CrossRef] [Green Version]
  2. Fabbri, E.; Pergolesi, D.; Traversa, E. Materials challenges toward proton-conducting oxide fuel cells: A critical review. Chem. Soc. Rev. 2010, 39, 4355–4369. [Google Scholar] [CrossRef]
  3. Hossain, S.; Abdalla, A.M.; Jamain, S.N.B.; Zaini, J.H.; Azad, A.K. A review on proton conducting electrolytes for clean energy and intermediate temperature-solid oxide fuel cells. Renew. Sust. Energ. Rev. 2017, 79, 750–764. [Google Scholar] [CrossRef]
  4. Garbayo, I.; Baiutti, F.; Morata, A.; Tarancon, A. Engineering mass transport properties in oxide ionic and mixed ionic-electronic thin film ceramic conductors for energy applications. J. Eur. Ceram. Soc. 2019, 39, 101–114. [Google Scholar] [CrossRef]
  5. Tuller, H.L.; Litzelman, S.J.; Jung, W.; Saraf, L.; Shutthanandan, V.; McCready, D.E.; El-Azab, A.; Jaffe, J.E.; Engelhard, M.H.; Peden, C.H.F.; et al. Micro-ionics: Next generation power sources. Phys. Chem. Chem. Phys. 2009, 11, 3023–3034. [Google Scholar] [CrossRef]
  6. Kek, D.; Panjan, P.; Wanzenberg, E.; Jamnik, J. Electrical and microstructural investigations of cermet anode/YSZ thin film systems. J. Eur. Ceram. Soc. 2001, 21, 1861–1865. [Google Scholar] [CrossRef]
  7. Nandasiri, M.I.; Thevuthasan, S. State-of-the-art thin film electrolytes for solid oxide fuel cells. In Thin Film Structures in Energy Applications; Babu Krishna Moorthy, S., Ed.; Springer: Cham, Germany, 2015; pp. 167–214. [Google Scholar]
  8. Evans, A.; Bieberle-Hütter, A.; Rupp, J.L.M.; Gauckler, L.J. Review on microfabricated micro-solid oxide fuel cell membranes. J. Power Sources 2009, 194, 119–129. [Google Scholar] [CrossRef]
  9. Huang, H.; Nakamura, M.; Su, P.; Fasching, R.; Saito, Y.; Prinz, F.B. High-performance ultrathin solid oxide fuel cells for low-temperature operation. J. Electrochem. Soc. 2007, 154, B20–B24. [Google Scholar] [CrossRef]
  10. Shim, J.H.; Chao, C.-C.; Huang, H.; Prinz, F.B. Atomic layer deposition of yttria-stabilized zirconia for solid oxide fuel cells. Chem. Mater. 2007, 19, 3850–3854. [Google Scholar] [CrossRef]
  11. Su, P.C.; Chao, C.C.; Shim, J.H.; Fasching, R.; Prinz, F.B. Solid oxide fuel cell with corrugated thin film electrolyte. Nano Lett. 2008, 8, 2289–2292. [Google Scholar] [CrossRef]
  12. Elam, J.W.; Dasgupta, N.P.; Prinz, F.B. ALD for clean energy conversion, utilization, and storage. MRS Bull. 2011, 36, 899–906. [Google Scholar] [CrossRef]
  13. Solov’ev, A.A.; Sochugov, N.S.; Shipilova, A.V.; Efimova, K.B.; Tumashevskay, A.E. Mid-Temperature Solid Oxide Fuel Cells with Thin Film ZrO2:Y2O3 Electrolyte. Russ. J. Electrochem. 2011, 47, 494–502. [Google Scholar] [CrossRef]
  14. Noh, H.-S.; Yoon, K.J.; Kim, B.-K.; Je, H.-J.; Lee, H.-W.; Lee, J.-H.; Son, J.-W. The potential and challenges of thin-film electrolyte and nanostructured electrode for yttria-stabilized zirconia-base anode-supported solid oxide fuel cells. J Power Sources 2014, 247, 105–111. [Google Scholar] [CrossRef]
  15. Dunyushkina, L.A.; Pankratov, A.A.; Gorelov, V.P.; Brouzgou, A.; Tsiakaras, P. Deposition and Characterization of Y-doped CaZrO3 Electrolyte Film on a Porous SrTi0.8Fe0.2O3−δ Substrate. Electrochim. Acta 2016, 202, 39–46. [Google Scholar] [CrossRef]
  16. Litzelman, S.J.; De Souza, R.A.; Butz, B.; Tuller, H.L.; Martin, M.; Gerthsen, D. Heterogeneously doped nanocrystalline ceria films by grain boundary diffusion: Impact on transport properties. J. Electroceram. 2009, 22, 405–415. [Google Scholar] [CrossRef]
  17. Agrirusis, C.; Kilo, M.; Muller, A.C.; Weber, A.; Borchardt, G.; Ivers-Tiffee, E. Interdiffusion between electrode and electrolyte materials for cathode supported SOFC’s with thin film electrolytes. In Proceedings of the XIII International Conference on High Temperature Materials Chemistry, Julich, Germany, 10–14 April 2000; Volume 4, pp. 1–5. [Google Scholar]
  18. Yamaji, K.; Xiong, Y.; Kishimoto, H.; Horita, T.; Brito, M.E.; Yokokawa, H. Electronic Conductivity and Efficiency of SOFC Electrolytes. ECS Trans. 2008, 12, 317–322. [Google Scholar]
  19. Li, Z.-P.; Mori, T.; Aucheterlonie, G.J.; Zou, J.; Drennan, J.; Miyayama, M. Diffusion and segregation along grain boundary at the electrolyte–anode interface in IT-SOFC. Solid State Ion. 2011, 191, 55–60. [Google Scholar] [CrossRef]
  20. Mills, E.M.; Kleine-Boymann, M.; Janek, J.; Yang, H.; Browning, N.D.; Takamura, Y.; Kim, S. YSZ thin films with minimized grain boundary resistivity. Phys. Chem. Chem. Phys. 2016, 18, 10486–10491. [Google Scholar] [CrossRef] [Green Version]
  21. Reisert, M.; Aphale, A.; Singh, P. Solid Oxide Electrochemical Systems: Material Degradation Processes and Novel Mitigation Approaches. Materials 2018, 11, 2169. [Google Scholar] [CrossRef] [Green Version]
  22. Yajima, T.; Suzuki, H.; Yogo, T.; Iwahara, H. Protonic conduction in SrZrO3-based oxides. Solid State Ion. 1992, 51, 101–107. [Google Scholar] [CrossRef]
  23. Gharbage, B.; Marques, F.M.B.; Frade, J.R. Protonic conduction in Sr1−y(Zr1−xDyx)O3−δ. Ceramics. J. Eur. Ceram. Soc. 1996, 16, 1149–1156. [Google Scholar] [CrossRef]
  24. Huang, P.; Petric, A. Electrical conduction of Y-doped strontium zirconate. J. Mater. Chem. 1995, 5, 53–56. [Google Scholar] [CrossRef]
  25. Huang, H.H.; Ishigame, M.; Shin, S. Protonic conduction in the single-crystals of Y-doped SrZrO3. Solid State Ion. 1991, 47, 251–255. [Google Scholar] [CrossRef]
  26. Muller, J.; Kreuer, K.D.; Maier, J.; Matsuo, S.; Ishigame, M. A conductivity and thermal gravimetric analysis of a Y-doped SrZrO3 single crystal. Solid State Ion. 1997, 97, 421–427. [Google Scholar] [CrossRef]
  27. Zajac, W.; Rusinek, D.; Zheng, K.; Molenda, J. Applicability of Gd-doped BaZrO3, SrZrO3, BaCeO3 and SrCeO3 proton conducting perovskites as electrolytes for solid oxide fuel cells. Cent. Eur. J. Chem. 2013, 11, 471–484. [Google Scholar] [CrossRef]
  28. Dunyushkina, L.A.; Khaliullina, A.S.; Meshcherskikh, A.N.; Pankratov, A.A.; Osinkin, D.A. Effect of A-site nonstoichiometry on defect chemistry and electrical conductivity of undoped and Y-doped SrZrO3. Materials 2019, 12, 1258. [Google Scholar] [CrossRef] [Green Version]
  29. Dunyushkina, L.; Smirnov, S.; Kuimov, V.; Gorelov, V. Electrical conductivity of CaZr0.9Y0.1O3−δ films deposited from liquid solutions. Int. J. Hydrog. Energ. 2014, 39, 18385–18391. [Google Scholar] [CrossRef]
  30. Courtin, E.; Boy, P.; Piquero, T.; Vulliet, J.; Poirot, N.; Laberty-Robert, C. A composite sol–gel process to prepare a YSZ electrolyte for solid oxide fuel cells. J. Power Sources 2012, 206, 77–83. [Google Scholar] [CrossRef]
  31. Boukamp, B. A package for impedance/admittance data analysis. Solid State Ion. 1986, 18–19, 136–140. [Google Scholar] [CrossRef] [Green Version]
  32. Boukamp, B. A Nonlinear least squares fit procedure for analysis of immittance data of electrochemical systems. Solid State Ion. 1986, 20, 31–44. [Google Scholar] [CrossRef] [Green Version]
  33. Zhang, C.; Liao, H.L.; Li, W.Y.; Zhang, G.; Coddet, C.; Li, C.J.; Li, C.X.; Ning, X.J. Characterization of YSZ solid oxide fuel cells electrolyte deposited by atmospheric plasma spraying and low pressure plasma spraying. J. Therm. Spray Technol. 2006, 15, 598–603. [Google Scholar] [CrossRef]
  34. Liu, M.; Hu, H. Effect of interfacial resistance on determination of transport properties of mixed-conducting electrolytes. J. Electrochem. Soc. 1996, 143, L109–L112. [Google Scholar] [CrossRef]
  35. Agarwal, V.; Liu, M. Electrochemical properties of BaCe0.8Gd0.2O3 electrolyte films deposited on Ni-BaCe0.8Gd0.2O3 substrates. J. Electrochem. Soc. 1997, 144, 1035–1040. [Google Scholar] [CrossRef]
  36. Kim, S.; Maier, J. On the conductivity mechanism of nanocrystalline ceria. J. Electrochem. Soc. 2002, 149, J73–J83. [Google Scholar] [CrossRef]
  37. Guo, X.; Ding, Y. Grain boundary space charge effect in zirconia. Experimental Evidence. J. Electrochem. Soc. 2004, 151, J1–J7. [Google Scholar] [CrossRef] [Green Version]
  38. Iguchi, F.; Sata, N.; Yugami, H. Proton transport properties at the grain boundary of barium zirconate based proton conductors for intermediate temperature operating SOFC. J. Mater. Chem. 2010, 20, 6265–6270. [Google Scholar] [CrossRef]
  39. Shirpour, M.; Merkle, R.; Maier, J. Space charge depletion in grain boundaries of BaZrO3 proton conductors. Solid State Ion. 2012, 225, 304–307. [Google Scholar] [CrossRef]
  40. Gerstl, M.; Navickas, E.; Friedbacher, G.; Kubel, F.; Ahrens, M.; Fleig, J. The separation of grain and grain boundary impedance in thin yttria stabilized zirconia (YSZ) layers. Solid State Ion. 2011, 185, 32–41. [Google Scholar] [CrossRef] [Green Version]
  41. Fergus, J.W. Electrolytes for solid oxide fuel cells. J. Power Sources 2006, 162, 30–40. [Google Scholar] [CrossRef]
  42. Heras-Juaristi, G.; Pérez-Coll, D.; Mather, G.C. Effect of sintering conditions on the electrical-transport properties of the SrZrO3-based protonic ceramic electrolyser membrane. J. Power Sources 2016, 331, 435–444. [Google Scholar] [CrossRef]
  43. Labrincha, J.A.; Marques, F.M.B.; Frade, J.R. Protonic and oxygen-ion conduction in SrZrO3-based materials. J. Mater. Sci. 1995, 30, 2785–2792. [Google Scholar] [CrossRef]
  44. Kreuer, K.D. Strategies in the development of proton conducting oxides for fuel cell applications in ionic and mixed conducting ceramics. J. Electrochem. Soc. 1998, 97, 17–27. [Google Scholar]
  45. Pérez-Coll, D.; Heras-Juaristi, G.; Fagg, D.P.; Mather, G.C. Transport-number determination of a protonic ceramic electrolyte membrane via electrode-polarisation correction with the Gorelov method. J. Power Sources 2014, 245, 445–455. [Google Scholar] [CrossRef] [Green Version]
Figure 1. A schematic representation of the apparatus for electrochemical testing of concentration cells.
Applsci 10 02229 g001
Figure 2. XRD patterns for the bulk Sr0.98Zr0.95Y0.05O3−δ (SZY) sample and SZY film on NiO-yttria-stabilized zirconia (YSZ) substrate.
Applsci 10 02229 g002
Figure 3. SEM images of the thermally etched surface of SZY pellet (a), surface (b) and fractured cross-section of NiO-YSZ supported SZY film (c).
Applsci 10 02229 g003
Figure 4. Impedance spectra of (a) Cell 1 with the bulk SZY membrane, (b) Cell 2 with the film membrane exposed to pO2(air)/pO2(H2) gradient (in the insert: CV curves for Cell 2); (c,d)—equivalent circuits for Cell 1 and Cell 2.
Applsci 10 02229 g004aApplsci 10 02229 g004b
Figure 5. Impedance spectra of the bulk SZY membrane exposed to pO2(air)/pO2(Ar) gradient. pH2O(air) = pH2O(Ar) = 3365 Pa.
Applsci 10 02229 g005
Figure 6. Temperature dependences of the effective conductivity of the bulk and film SZY membranes exposed to pO2(air)/pO2(H2) and pO2(air)/pO2(Ar) gradients.
Applsci 10 02229 g006
Figure 7. Temperature dependences of the effective transport number of oxygen ions in the bulk and film SZY membrane exposed to pO2(air)/pO2(H2) and pO2(air)/pO2(Ar) gradients.
Applsci 10 02229 g007
Figure 8. The calculated total, oxygen–ion and hole conductivities and the measured total conductivity of the bulk SZY sample in humid air (pH2O = 3365 Pa) as functions of inverse temperature. The solid line presents the total conductivity of SrZr0.9Y0.1O3−δ reported in [42].
Applsci 10 02229 g008
Figure 9. Calculated (a) total conductivity and (b) transport numbers of oxygen ions, electrons and holes in SZY as functions of pO2. Closed squares and triangles show the total conductivity of the bulk SZY sample in wet hydrogen and wet air, respectively, obtained from impedance data. Open squares show the conductivity data for SrZrO3 reported in [43].
Applsci 10 02229 g009
Figure 10. Impedance spectra of the cell pH2O/, Pt/SZY/Pt, pH2O// at 750°C in air at pH2O/ = 40 Pa and pH2O// = 4240, 3365 and 610 Pa.
Applsci 10 02229 g010
Figure 11. Effective proton transport number in the bulk SZY membrane exposed to pH2O gradient in air as a function of: (a) pH2O// (pH2O/ = 40 Pa) and (b) temperature.
Applsci 10 02229 g011
Table 1. The calculated values of the total, oxygen–ion and hole conductivity and the measured total conductivity of bulk SZY at 550 °C in humid air (pH2O = 3365 Pa) and the corresponding activation energies.
σ,
S cm−1
σ O 2 ,
S cm−1
σh,
S cm−1
σexp,
S cm−1
Ea(σ), eV E a ( σ O 2 ) ,   eV Ea(σh), eVEa(σ exp), eV
Our data9.1 × 10−57.6 × 10−55.4 × 10−61.2 × 10−41.030.941.580.92
Ref. [42]17.7 × 10⁻⁵ 1.09
1 Conductivity of a bulk SrZr0.9Y0.1O3−δ sample in wet oxygen (pH2O ≈ 3000 Pa).

