Abstract
In this study, geographic information system (GIS)-based methods and applications utilized for mine development were reviewed. Three types of GIS-based studies, namely studies on mine planning, operation, and environmental management, were examined to describe the role of GIS as a decision-making support tool in mine development. This review was conducted by classifying previous GIS-based studies into several subtopics that pertain to mine development activities and the range of environments to be managed. Because the use of GIS is appropriate for spatial data management related to ore deposits and mine environment conditions at various scales, the applications of GIS-based methods in mine development could be expanded further.
1. Introduction
With global concerns regarding the exhaustion of high-quality ore deposits near the surface, the risks related to mine development are increasing in terms of economic, technical, and environmental considerations [1]. In detail, a drop in both mineral production and profits for mining companies has resulted in the introduction of large heavy machines and advanced mining technologies to mine low-quality ore deposits at greater depths. Moreover, as mine-induced disasters and hazards have become difficult to properly monitor and control, a negative impact on work safety and the surrounding environment has been evident. Consequently, the necessity for systematic and strategic mine planning, operation, and environmental management based on optimization techniques or decision-making systems are emerging to improve mineral productivity, operational efficiency, and stability in the mine environment.
To accomplish these objectives, geographic information system (GIS)-based methodologies have been effectively used to design and optimize the mine development process. GIS is a comprehensive framework that is used to capture, store, query, analyze, and display spatial data in various applications [2]. In the field of geoscience, various applications have been proposed to manage and control natural phenomena using GIS, and literature reviews on GIS applications have been actively conducted [3,4,5,6,7,8]. However, in the mining sector, although GIS has been widely applied for mine development, no attention has been paid to evaluating the GIS-based methods and applications pertaining to mine planning, operation, or environmental management.
Thus, the purpose of this study was to investigate and review the GIS-based methods and applications proposed for designing and optimizing mine planning, operations, and environmental management. The scope of this study was confined to relevant published studies in these areas. Keywords (i.e., GIS, mining, planning or design or operation, or environmental management) were input into the Google Scholar website, and 68 articles were identified for the literature review. Finally, 58 articles were selected after consideration of the type of article, similarity with other articles, relevance to scope, and content details.
This paper is organized into six sections. Section 1 introduces mine activities according to the mine development phase. Section 2 describes the GIS-based methods and applications for mine planning. Section 3 presents the literature covering various mine operation systems using GIS. Section 4 reviews the GIS-based methods for mine environmental management and reclamation planning. Section 5 presents the advantages and disadvantages of using GIS in mining and suggests future directions for GIS. Finally, the conclusions are presented in Section 6.
2. Mine Development Phase
Generally, the mine development phase consists of mine planning, construction, operation, and reclamation [9]. In the planning phase, the mineralized target is found through geophysical and geochemical exploration. In the construction and operation phases, infrastructure is built for mineral production, and ore materials are extracted using heavy equipment. Finally, in the reclamation phase, all undesirable materials, such as waste, tailings, and contaminated topsoils, are removed from the mining area, and the underground area is properly filled with rock materials.
To facilitate investment decisions, feasibility studies are performed by considering the technical, economic, and environmental aspects of mine development in the planning phase [10]. The scale and grade of mineral deposits are estimated using the results of computer-aided modeling. The appropriate mining method is selected, and the open-pit boundary is optimized to quantify the volume and amount of ore and waste. Additionally, the mine infrastructure is designed, and potential conflicts are identified to prevent political, legal, and environmental problems. Finally, ore resources and reserves, which refer to the amount and grade of the minable ore body, can be determined.
When the mine development plan is approved, an open-pit or underground mine is constructed, and haulage roads, benches, and processing plants are built in the mining area. Various optimization techniques and decision-making systems are applied to optimize the mineral production and haulage operations. Furthermore, wireless communication systems can play a major role in tracking personnel and equipment and in monitoring the working environment from a remote office. Various management systems related to the underground ventilation network, safety management, and drainage system can be implemented to prevent disasters caused by noxious gases, dust, fires, or water; they can also alert workers about the need to escape, if necessary.
The environmental impacts on the mining area should be monitored and controlled in both the mine operation and reclamation phases [11]. In the mine operation phase, dust, noise, and vibration mainly occurred as a result of drilling and blasting activities. Moreover, slope failure and erosion problems are a frequent occurrence in mining sites. After the mining operation, various mining-induced hazards, including subsidence, water pollution, soil contamination, and deforestation, can occur in mining areas [12]. Therefore, it is crucial to continuously monitor the movement of drainage flows, metal leaching, and sediments, and establish a database framework for effective hazard management. Furthermore, systematic mine rehabilitation planning may prevent and minimize risks to the mining environment and human health.
3. Mine Planning Using GISs
GIS-based research on mine planning is generally classified into four topics: ore reserve estimation, open pit optimization, mine infrastructure design, and potential conflict region analysis.
3.1. Ore Reserve Estimation
In the ore reserve estimation phase, GIS-based technologies, such as spatial analysis and targeting, exposition, 3D data visualization, and processing, can be utilized to identify and assess the location, size, and geometry of mineral deposits buried underground.
Sprague et al. [13] introduced a query framework for spatial targeting within a 3D GIS software environment. They developed query tools that can be used as a GIS-3D plug-in, which included a proximity query (to a “probe” object), property query (numeric attribute), shell query (containment within a closed surface), meta-data query, feature query (dome, depression, curvature), trend query (dip plane, vector), and intersection query (with a “probe” object). The developed plug-in also demonstrated the usefulness of software extensions to GOCAD©. The 3D GIS capabilities of GOCAD© facilitate queries and easy attribute representation, and support spatial targeting to meet mining and mineral exploration needs.
Uygucgil and Konuk [14] integrated geostatistics with GIS capabilities, such as spatial analysis, exposition, and 3D data visualization and processing. In this study, GIS-based visual and interactive analyses were used to examine the relationship between the data in the study area and the total data in the integrated spatial database. A case study was conducted in Turkey to evaluate the accuracy of kriging, a geostatistical method for estimating the shape, spatial location, and volume of open mines. The accuracy of each of the three normal co-kriging estimations was assessed to determine which method was the most accurate. Consequently, the estimate with three variables appears to be more accurate than that calculated with the two-variable models. These results show that the additional information obtained from additional auxiliary variables improves the accuracy of the estimates in the mine data.
Hosseinali and Alesheikh [15] identified and classified weighting methods used in the mine exploration process. Weighting methods can be classified into two main groups: data-driven and knowledge-driven methods. In this study, six weighting methods were identified and scientifically assessed, namely ratio estimation, analytical hierarchy process (AHP), Delphi, weight of evidence, logistic regression, and artificial neural networks (ANNs). The first three are examples of knowledge-driven methods, whereas the last three are classified as data-driven methods. The evaluation of each weighting method on copper deposits in Iran showed that the ANN method is the most accurate because it can accurately predict all borehole characteristics.
Kim et al. [16] developed a new outlier top-cut method to quantify statistically significant data and presented the results of an analysis of borehole data from Au deposits. Generally, a geostatistical interpolation method, such as kriging, is used to estimate the amount of resources. However, if the data used in such an analysis deviate significantly from the mean value, this data should be excluded because it can significantly affect the results. In this process, the existing top-cut method can cause errors by excluding significant data, whereas the new methodology developed in this study can minimize the loss of data and analyze statistically significant outliers. The Getis–Ord Gi* statistic was calculated for each Au sample value in a borehole dataset by considering the 3D spatial coordinates of the borehole data. The Getis–Ord Gi* statistic is calculated by comparing the local sum for a feature and its neighbors to the total sum as follows:
where is the attribute value for feature , is the spatial weight between feature and , is equal to the total number of features, and:
The resultant Getis–Ord Gi* statistic is a z-score. For statistically significant positive z-scores, the larger the z-score, the more intense the clustering of high values (i.e., a hot spot). When the local sum is very different from the expected local sum, and that difference is too large to be the result of random chance, a z-score is statistically significant.
Figure 1 shows a schematic diagram of a 3D hotspot analysis for borehole data. Figure 2 shows the results of kriging using different top-cut methods for Au deposits. The proposed method can alleviate the overestimation or underestimation that can occur when applying existing methods.
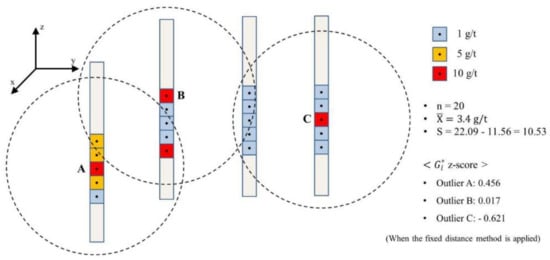
Figure 1.
Schematic diagram of 3D hot-spot analysis for borehole data [16].
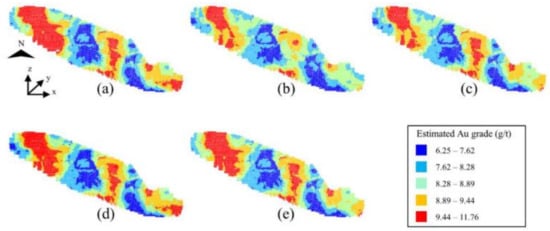
Figure 2.
Kriging results of Au grade estimation using (a) all data or capped data with a (b) probability top-cut, (c) 95% percentile top-cut, (d) +2 standard deviation top-cut, and (e) hot-spot top-cut [16].
3.2. Open-Pit Optimization
Baek et al. [17] proposed a method to quantify the uncertainty that exists in the open-pit optimization results as a result of fluctuations in mineral prices due to changes in the world economy and mineral reserves. In this study, Monte Carlo simulations were used to generate multiple sets of mineral prices based on historical mineral price data, and the boundary optimization was repeatedly performed using this price. The results of the open-pit optimal boundary analysis are examined; 1 is assigned if a block exists within the optimal boundary, and 0 is assigned otherwise. This binarization is performed on all results of optimal boundary analysis. By integrating several binarized block models, a probability model was generated that quantitatively represented the uncertainty derived from changes in the mineral prices.
Figure 3 shows an example of a probability model formation representing uncertainty. The results of a case study applying the proposed method to copper-zinc mixed deposits showed that significant uncertainty existed in the open-pit optimization results. Figure 4 shows the probability model representing the uncertainty in the pit optimization results analyzed through the case study. The method developed in this study was able to quantify the probability that each block representing deposits is included within the open pit optimal boundary when copper and zinc prices increased or decreased from the current reference prices (Figure 5) [17].
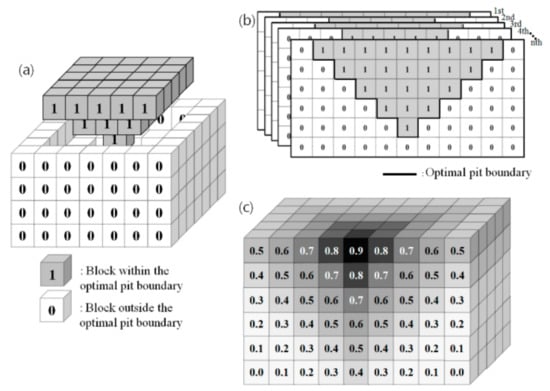
Figure 3.
Example of a probability model formation representing uncertainty: (a) binarized block model, (b) probability model formation using overlay analysis, and (c) sectional view of the probability model [17].
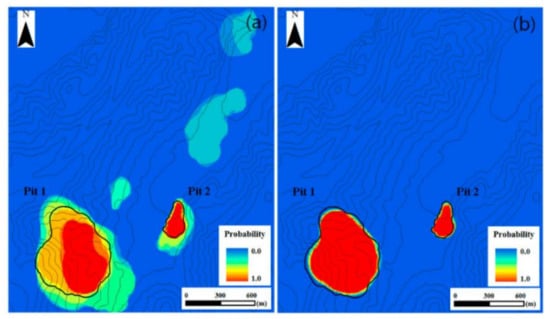
Figure 4.
Probability model representing uncertainty in pit optimization results. (a) Case 1 considers the variation in copper prices only. (b) Case 2 considers the variation in zinc prices only [17].
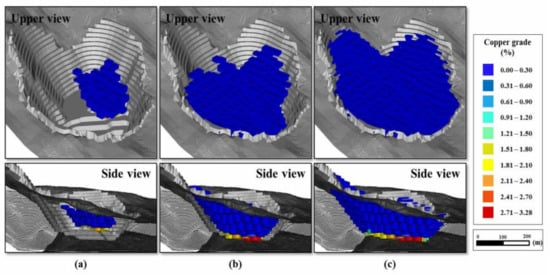
Figure 5.
Blocks representing ore reserves above the optimal pit boundary. (a) Case 1: probability ≥ 90%. (b) Case 1: probability ≥ 80%. (c) Case 1: probability ≥ 70% [17].
Sinha et al. [18] used GIS-based technology to develop overburden dumps and backfilled and mined-out zones as existing hilly topography; they also assessed soil erosion rates to identify dam locations that require monitoring. Soil erosion rates from the developed mining landscapes were evaluated using an empirical E30 model. A unique parametric change study was performed by altering the original normalized difference vegetation index values for estimating the soil erosion rate with different vegetation densities [18]. The case studies show that erosion rates increase in barren mining land, while the year-wise plantation decreases. The GIS-based approach presented could help assess the potential for soil erosion and taking the necessary steps before initiating the operation of the mining.
Grenon and Hadjigeorgiou [19] developed a slope stability analysis tool that can be used to integrate slope stability analysis into the data management, ore reserve, and pit optimization processes of an open-pit mine. The module advanced in this study was successfully applied to the analysis of a surface mine. The case study included both kinematic and limit equilibrium stability analyses for bench and inter-ramp designs. In addition, this module utilized GIS-provided visualization tools and designated stability susceptibility zones along the pit. This approach can improve the optimized 3D pit configuration and contribute to a better understanding of the economic impact of various slope and pit designs.
Grenon and Laflamme [20] proposed a methodology that can rigorously determine the inter-ramp and bench-face slope orientations in a digital elevation model (DEM) of an open pit. They conducted a case study on Portage Pit in Canada and analyzed the GIS slope algorithm commonly used to evaluate the slope orientations in the DEM. Consequently, planar regression algorithms based on principal component analysis provided the best results at the inter-ramp and bench-face levels. In addition, the optimal sampling window was 21 × 21 cells for the inter-ramp and 9 × 9 cells for the bench. Subsequent slope stability analysis relying on those assessed slope orientations would provide a more realistic geometry for potential slope instabilities in the design pit [20]. The methodology presented in this study is flexible and can be adopted according to the block size and pit shape of the mine.
3.3. Mine Infrastructure Design
In the mine infrastructure design phase, the optimal positioning of facilities (e.g., crusher, storage, waste dump), power lines, and road design features must be carried out. Because GIS includes functions pertaining to the processing and targeting of spatial data and path analysis, it can be useful at this stage.
Lechner et al. [21] suggested how to optimally design linear infrastructure, such as roads in mines, by considering environmental and social factors. First, environmental and social factors were identified through structured interviews with stakeholders, and the weightings of spatial data inputs were calculated using these factors. These spatial layers were then used to construct a cost surface for the least-cost path analysis (LCPA). In addition, they conducted a case study with the South Konawe Regency, located in southeastern Sulawesi Province. Figure 6 shows a cost surface map for each subfactor based on GIS spatial data. Figure 7 shows the results of the least-cost path and corridor analysis for national and local groups. This figure also shows the differences in the paths identified by different groups. This study demonstrates the capability of GIS with LCPA and social survey methods to identify the infrastructure corridors that have the least impact on social and environmental values. This tool has the potential for use and refinement in more effective multiple-criteria decision-making by communities and government planning authorities [21].
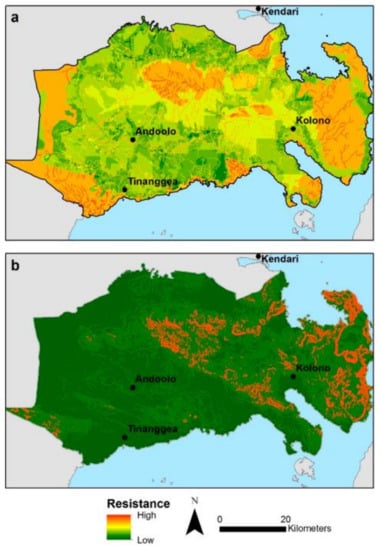
Figure 6.
Example of the cost surface produced through (a) combining all the weighted GIS layers representing each of the subfactors where spatial data was available for local regions and (b) using only topography where high-resistance areas have higher slope values [21].
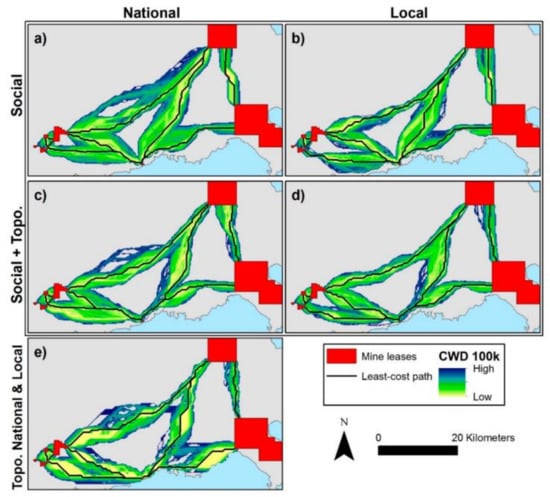
Figure 7.
Infrastructure corridors identified with least-cost paths and corridor analysis for national and local groups (a–d). (a,b) Pathways and corridors identified where the resistance surface is based only on social values. (c,d) Pathways and corridors identified where the resistance surface is based on a combination of topography and social values. (e) Pathways and corridors identified only where the resistance surface is based on topography. Corridor width is based on a cost-weighted distance (CWD) threshold of 100,000 m [21].
Blachowski [22] assessed the following aspects of the mining and transport of rock minerals (aggregates) in the context of regional development: the spatial and temporal changes in the distribution and intensity of mining, availability of economic reserves in active mines, magnitude and distribution of road transport flows of aggregates, potential of railways as an alternative means of transport, and valorization of undeveloped aggregate deposits to assess their suitability for future use. In this investigation, a case study was conducted in Lower Silesia, Poland, and cartographic models were developed using GIS to facilitate the analysis of the mining and transport of mineral resources. This model could be used to comprehensively aid with advising on the current state of mineral resources, mining, and transport in the region and to provide insight into future extraction activities.
Baek and Choi [23] proposed a new method for designing roads to efficiently carry out truck haulage operations in open-pit mines that are in the planning or design phase. In this study, terrain data, including the final designs of the pit and bench, obtained using the LCPA method were processed to analyze the haul road layout (Figure 8a). The zigzag haul road layout was determined through an initial analysis simplified by the application of the Douglas–Peucker algorithm (Figure 8b). In addition, the haul road layout was modified according to the radius of curvature constraints presented in the existing guides (Figure 8c). The terrain data and haul road layouts of the mines were then entered into AutoCAD Civil 3D to visualize the haul road of the open-pit mine in three dimensions. These processes are shown in Figure 9. Figure 10 shows the design result of the haul road of the open-pit mine and the 3D visualization that was obtained by combining the mine terrain model designed with benches and the result of the 3D haul road layout design. The proposed method can be used in the planning and design stages as a tool to design the layout of haul roads at civil engineering and construction sites, that is, where no road exists, as well as at mining sites [23].
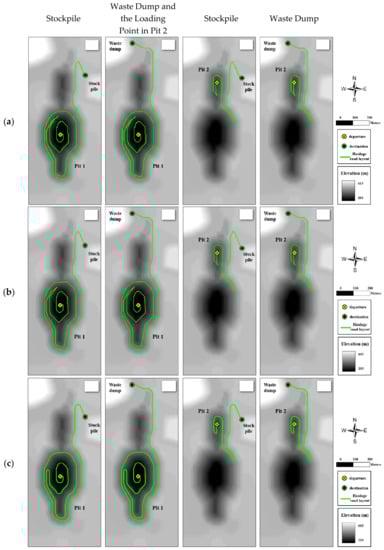
Figure 8.
Results of analyzing the 2D haul road. (a) Haul road layout in the pit 1 and pit 2 areas analyzed using least-cost path analysis (LCPA). (b) Simplification of the haul road layout of pit 1 and pit 2. (c) Results of modifying the road layout in pit 1 and pit 2 by considering the radius of curvature (modified from Baek et al. [23]).
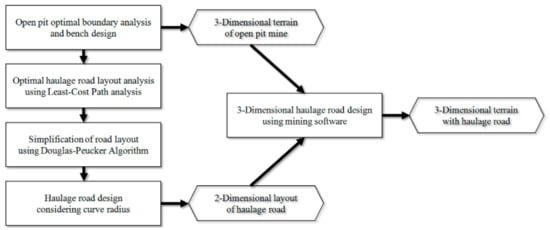
Figure 9.
Study process of haul road design for open-pit mines using the proposed method [23].
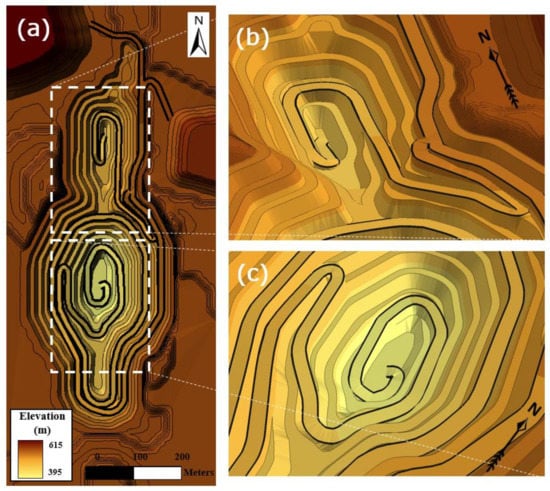
Figure 10.
Result of the haul road design. (a) Open-pit mine with bench and haul road. 3D views: (b) pit 2 area and (c) pit 1 area [23].
3.4. Potential Conflict Region Analysis
In the potential conflict region analysis phase, GIS geoprocessing and hydrologic modeling can be utilized.
Jeronimo et al. [24] conducted a case study of the ecological and economic zoning of Cajamarca in Peru, which is rich in gold, to analyze the land-use planning process in the face of conflicting interests regarding future land and water use. GIS techniques were used to evaluate the conflicting policies on land and water use between a powerful pro-mining association led by the central government and a conservation coalition (anti-mining) led by the local government. This study suggests how GIS technology can be used if there is a conflict between stakeholders concerning mine development, such as in Cajamarca, Peru.
Craynon et al. [25] carried out a GIS-based spatial analysis considering social, environmental, and economic factors for the sustainable development of mineral and energy resources. In addition, a case study was conducted to identify potential sustainability conflict zones in mining design. They identified key parameters for consideration in decision-making through the GIS analysis of on-the-ground issues related to sustainability. The case study suggests that the use of this approach could have promoted better communication and planning. The adoption of such a process could assist in the transition to a new regulatory framework that is based on and promotes sustainable development principles [25].
4. Mine Operation Using GIS
The aspects of mine operation can be classified into ore haulage operation optimization, wireless communication system design and management, decision support systems, and mine ventilation/safety/drainage system design and management.
4.1. Ore Haulage Operation Optimization
Several studies have been performed to monitor the ore haulage system of trucks and shovels using spatial visualization functions and optimize the ore haulage routes of dump trucks using raster-based and vector-based LCPA.
Gu et al. [26] designed a GIS monitoring dispatch client to monitor the haulage system of trucks and shovels in an open-pit mine. This system allows users to manage, dispatch, and monitor trucks and shovels through vehicle location displays based on Global Positioning System (GPS) and General Packet Radio Service (GPRS) data, playback of historical paths, and inquiries concerning truck locations.
Choi et al. [27] proposed a raster-based GIS model to determine the optimal haulage routes of dump trucks in large-scale open-pit mines using multi-criteria evaluation and LCPA. In the process of weighting multiple adverse factor scores, pairwise comparisons were applied to quantitatively analyze the different resistances of five factors and three constraints, such as truck speed, proximity to water and ore bodies, existence of curves, visibility, and haul road maintenance. The model was applied to the Pasir open-pit mine, and the result showed that the optimal haulage routes of dump trucks could be determined by considering both the haulage distance and multiple criteria.
Choi and Nieto [28] presented a modified raster-based least-cost path algorithm to account for the effects of terrain relief and curves along a route in the optimal haulage route planning of an open-pit mine. This study determined the optimal haulage routes between loaders and dumps that ensure the least travel time or fuel consumption of dump trucks in the working areas without paved roads. The software, named the Google Earth-based Optimal Haulage Routing System (GEOHARTS), was developed to provide project settings, information visualization, and route optimization functions. Figure 11 presents interfaces of the GEOHARTS software for optimal haulage route planning.
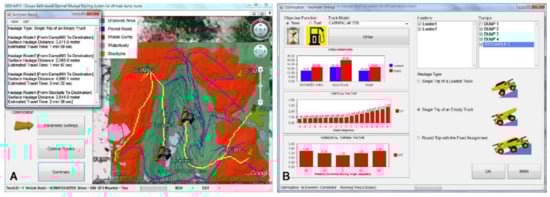
Figure 11.
Visualization of the Google Earth-based Optimal Haulage Routing System (GEOHARTS) software for optimal haulage planning in an open-pit mine. (a) Optimal haulage routes of empty trucks that ensure the least travel time. (b) Parameter settings for haulage route analysis [28].
Previous studies on the haulage route optimization of dump trucks in open-pit mines mostly used raster data [29]. However, the raster data can cause several problems, including zigzag-shaped travel paths due to cell resolution and the neglect of the topological relationship among haulage roads. To overcome these problems, Park et al. [29] demonstrated that vector-based network analysis is effective in determining the optimal haulage routes of dump trucks by considering the terrain gradient in open-pit mines. The Dijkstra algorithm [30] was adopted as a basic concept of network analysis, and this study presented an overall method for creating vector network data of an open-pit mine using ArcGIS software. The method consists of four procedures: (a) creating a DEM, (b) digitizing the haulage road network, (c) calculating the terrain gradient of the haulage roads, and (d) calculating the average speed and travel time of the dump truck along haulage roads. It was observed that the proposed method could effectively determine the optimal haulage routes of dump trucks, taking into account changes in truck speed, which depend on the slope gradient of the open-pit mine. Park et al. [31] analyzed the optimal routes of vehicles for auxiliary operations in open-pit mines using a heuristic algorithm for the traveling salesman problem (TSP) within a GIS environment. To compare the quantitative difference of travel routes determined by a heuristic TSP algorithm and intuitive judgment, the visiting points for auxiliary vehicles in the study area were set to 5, 15, and 25. Consequently, this study demonstrated that travel time could be shortened by 20 min when the auxiliary vehicle traveled through 25 working points along the haulage route analyzed by the heuristic TSP algorithm.
Park et al. [32] measured the carbon dioxide emissions of diesel vehicles operated in an underground mine using GIS. A GIS database was established for underground haulage road networks; then, the average travel speed of the diesel vehicles on each road was estimated to calculate the carbon dioxide emission factor through the field survey. The results revealed that the amount of carbon dioxide emissions related to truck haulage operations could be calculated by considering the carbon dioxide emission factor and travel distance of diesel vehicles determined by the GIS-based network analysis. However, this study did not consider that the carbon dioxide emission factor of each road could change according to the road gradient, load capacity of vehicles, and emission standards. Oh et al. [33] followed the new carbon dioxide emission factor suggested by the European Environment Agency. This study constructed a vector network of underground haulage roads, which includes data detailing the speed of the diesel vehicle, road gradient, and load capacity.
Baek et al. [34] developed the Bluetooth Beacon-Based Underground Navigation System to display optimal haulage route and truck location data on mobile devices in real time. A GIS-based network analysis was adopted for optimal haulage routing. After determining the optimal haulage route, the route information is updated to the web server. Moreover, GIS-based spatial visualization was used to display the installation locations of wireless sensors, which identify the dump truck locations.
4.2. Wireless Communication System Design and Management
In open-pit mines and underground mines, wireless communication systems are installed to collect data pertaining to equipment operation, work safety, and production processes on a web server in real time. Studies have been conducted to design and manage wireless communication systems using web-based GIS and spatial analysis.
For example, Li and Zhong [35] proposed a digital mine model, which is composed of a data warehouse platform and an application/analysis platform based on web-based GIS technology. When new drill hole data were acquired through the control network system, spatial feature layers could be created in a shape file format based on the coordinate information, and a new spatial data set could be converted into a geodatabase file. This model permitted remote users to search, query, visualize, and analyze mine deposit information without the need for access to the mining site.
Chai and Li [36] designed a personnel orientation system to monitor the location and status of a miner’s location in an underground mine. Web-based GIS technology was adopted to store the attributes and spatial data of individual miners, which are related to the radio frequency identification system, and show a playback of traces of miners in real time through Ethernet communication. The suggested system could enhance worker safety management in underground mines.
Moridi et al. [37] modeled an underground mine monitoring and communication system, which was implemented with a wireless sensor network and a GIS server. ZigBee nodes were installed underground to sense environmental attributes, such as temperature, humidity, and gas concentrations. Then, the spatiotemporal data were joined and related to the attribute tables of the ZigBee node geographical positions in the GIS server. This study also developed a geoprocessing model that determines the emergency status according to the environmental standard, which is used to control ventilation fans and send ZigBee emergency messages using the Python programming language (ArcPy).
Baek and Choi [38] suggested a new GIS-based algorithm to design an initial wireless communications system in open-pit mines. The geoprocessing analysis was used for multiple candidate transmitter (wireless access point) selection by considering the probability of further development and environmental factors in the mine. Subsequently, a communication viewshed analysis based on the three-dimensional (3D) partial Fresnel zone was applied to quantitatively estimate the possible area of communication and analyze favorable transmitter combinations. The results revealed that the 3D Fresnel indices were calculated for 15 candidate transmitter locations, and an initial transmitter layout was designed by considering two, three, and four favorable transmitter combinations (Figure 12).
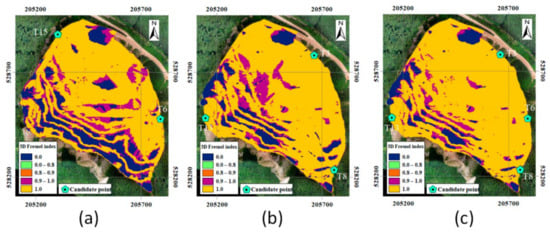
Figure 12.
Three-dimensional Fresnel index overlay maps for favorable transmitter combination analysis: (a) combination of transmitters 6 and 15; (b) combination of transmitters 3, 8, and 13; and (c) combination of transmitters 3, 6, 8, and 13 [38].
4.3. Decision-Support Systems
GIS functions based on a spatial database and 3D visualization can also be used to manage mine data and make a high-quality mining decision for effective mining operations.
Li et al. [39] designed a Longruan GIS platform to control and monitor mine disasters induced by high crustal stress, gas thickness, and seepage water pressure in an underground coal mine. Roadway, 3D geological, and working face modeling were performed based on an irregular triangulated network using a geomechanical parameter database, which was related to hydrogeological, gas distribution, crustal stress, rock mechanical, and rock classification data. Then, rock stability and dynamic disasters were evaluated through the computation program of the application to provide support design and rescue measurements to users.
Şalap et al. [40] proposed a GIS-based monitoring and management system for underground coal mining safety. In this system, a database and metadata management system was designed to record details on mine accidents, as well as the working and operating conditions of underground workers and equipment. Various functions, including air velocity distribution analysis, thematic representations, and emergency route analysis, have been provided to users to support decision-making within a web-based GIS environment.
Gu et al. [41] suggested a dynamic ore-blending management system for effective mine production monitoring and shovel dispatching. In this system, a spatial database is constructed, which includes the coordinate data of the holes, boundaries of muck-piles, ore grade of holes, and shovel data, and the isolines of the ore grade and location of each shovel are displayed on the open-pit mine map. Through the ore weighting and truck dispatching system based on the GPS and GPRS, dispatchers could analyze the amount and average grade of ore produced in real time and control ore productivity by dispatching shovels and trucks according to the daily ore-blending plan.
Banerjee et al. [42] developed an enterprise GIS system, which was implemented with distributed desktop applications throughout an entire mining company for active mine data analysis and management. There are three types of use levels in the system: (1) operators can generate and retrieve georeferenced information, mine and civil maps, and employee and equipment databases; (2) users can convert the basic maps into digital formats and generate map features and thematic maps; and (3) company executives can analyze mining activities through map queries and make decisions concerning mine operation optimization. This study also elaborated on the implementation strategy of this system at each mine development phase.
Duncan and Rahman [43] presented a 3D mine prototype to establish a 3D spatial database and a 3D model of subsurface objects, such as mine structures and ore bodies in Ghana. A GIS-based 3D tetrahedron model was introduced to represent the 3D underground mine model. This study delineated the type of spatial data produced during mine development and operation, and suggested integrating spatial data with a 3D model for a comprehensive understanding of mine operation.
4.4. Mine Ventilation/Safety/Drainage System Design and Management
GIS can contribute to the design of an underground ventilation network model and management of drainage systems to promote safety and prevent mine accidents during mine operations. Spatial database construction and GIS-based spatial analysis have often been applied for this purpose.
Liu and Yang [44] constructed a GIS-based mine ventilation network model for the ventilation route and quantity planning using network analysis. This study generated all types of ventilation network components, such as underground tunnels, points of intersection (nodes), and ventilation facilities (air door, wall, and window), and established a spatial database related to the ventilation network and excavation. GIS-based network analysis was conducted to analyze the optimal ventilation route and the best rescue route in fire accidents by assigning resistance values to the specific ventilation network.
Massanés et al. [45] proposed a ventilation management system to analyze and visualize environmental data obtained from an underground ventilation network within the GIS environment. The investigation has focused on a Spanish mine, and the ventilation network was constructed using two perspectives: principal and auxiliary circuits. The network database parameters consisted of coordinates, date of the measure, air velocity, dry and wet temperature, and noxious gas concentrations for principal and auxiliary ventilation. The results showed that variations in air velocity and gas concentration along the principal circuit were obtained using 753 historical data records. Moreover, the most adverse working faces were analyzed by considering effective temperatures and gas concentrations. Using the same GIS-based database of the ventilation network, Bascompta et al. [46] estimated the air recirculation over time and investigated the effect of air recirculation on the underground environmental conditions in the Spanish mine. It was found that changes in the environmental conditions due to air recirculation, especially in the CO and NOx values, depend on the ventilation layout.
Prakash and Vekerdy [47] developed a prototype GIS, called CoalMan, to manage surface and underground fires in coal mining areas. This system monitors the fire region based on remote sensing data processing functions, such as pre-processing, enhancement, and classification, provided in the GIS software package ILWIS. In addition, using spatial analysis, coal fire risk maps were generated by considering the presence or absence of mining activity, access to air, and propensity of the coal.
Choi et al. [48] examined quantitative visible areas to select optimal viewpoints near an open-pit mine and analyzed hazardous sections for dump truck drivers with limited sight distance. Viewshed analysis was adopted to calculate the visibility index for all points in a DEM by considering the inter-visibility between the viewpoint and target points. The application at Pasir coal mine, Indonesia, showed that the proposed methodology could be used to select the optimal viewpoints by analyzing the ratio of the pit to the viewshed area. In addition, the potential truck collision area could be identified by conducting viewshed analysis through the centerline of a haulage route. This finding could assist in improving the safety of mining operations by considering visibility effects.
Zhang et al. [49] developed an emergency rescue command information system to design and simulate an emergency escape plan within the web-GIS environment. The architecture of the system consisted of (1) emergent incident management, (2) incident display, (3) historical accident management, and (4) emergency escape simulation to show the shortest escape path for each type of accident in a coal mine.
Choi and Park [50] suggested a new GIS-based modeling technique to design in-pit stormwater ponds in large-scale open-pit mines. The analysis model identified hydrological parameters, including the flow accumulation of rainfall in sinks and catchments, and designed in-pit stormwater ponds with pumping facilities by considering an optimal pump capacity and pond storage. Finally, a flooding simulation was performed to determine the feasibility of pond design under concentrated rainfall conditions. This model could be utilized as a powerful tool for drainage system design.
5. Environmental Management Using GISs
GIS-based research on the environmental management of mines can be classified into three topics: mine operation environment management, mine-induced hazard management, and mine rehabilitation design.
5.1. Mine Operation Environment Management
Regarding mine operation environment management, research has been conducted on the prediction of blasting vibration and dust impact, evaluation of the slope stability in an open-pit mine, and analysis of the composition of the mine area. The studies discussed here utilized GIS functions, such as spatial database construction and mapping, geoprocessing, and drainage analysis.
Bui et al. [51] examined the impact of blast-induced ground vibrations on surrounding structures (e.g., highways, water pipes, railways, and residential areas) from a quarry mine in Vietnam. They investigated a total of 25 blasting events and recorded 83 observations, which were classified using the fuzzy C-means clustering (FCM) algorithm. On this basis, quantile regression neural network (QRNN) models were developed. The combination of FCM and QRNN models created a new hybrid model with which to predict blast-induced ground vibration. The developed model was found to have a higher accuracy when compared with other models, such as that from the US Bureau of Mines, random forest, QRNN (without clustering), and ANN. The proposed model can be used to control the blast-induced ground vibration and minimize its effects.
Li et al. [52] developed an appraisal environmental system that addresses the main tasks of environmental impact assessment, such as environmental impact analysis, pollutant impact prediction, and the assessment of mitigation measures, through the use of scoping exercises (step 1) and technical assessments (step 2). Scoping assesses the qualitative impact using a knowledge-based system, while technical assessment evaluates quantitative impacts based on GIS, mathematical modeling, and evaluation. After constructing the mine model, the user can run a scoping system by importing information from both the user and mine model database to qualitatively assess the environmental impact of the operation. If there is a significant adverse impact at this stage, further quantitative investigations can be carried out using the technical assessment system. By applying the developed system, case studies were conducted for surface mining and quarrying projects, and the results are presented in several GIS images.
Francioni et al. [53] proposed a new approach using simple kinematic analysis techniques and three-dimensional finite difference method stress models for deterministic stability analysis. This approach is applied to the study of open-fit quarry slopes based on the integrated use of two remote sensing techniques, terrestrial laser scanning (TLS) and unmanned aerial vehicle (UAV). These techniques supplement the data obtained from traditional engineering geology surveys. TLS was performed using a long-range laser scanner (up to 1 km range) with three different point clouds to avoid occlusions. Digital terrestrial photogrammetry was performed using a UAV system that overcomes problems related to elevation, steepness, and complex slope geometry. In addition, a kinematic analysis was carried out using GIS techniques. The developed approach helps to overcome the common problems of complex slope geometry encountered in kinematic slope analysis.
Nelson et al. [54] used GIS software and modeling techniques to analyze slope failures in the Chuquicamata open-pit mine in Chile. They used several steps for the analysis, including initial data compilation and conversion, data validation, derivative data layer generation, and predictive modeling. In addition, the risk of slope failure was analyzed by comparing GIS-based predicted slope stability models with post-modeling slope failures. Consequently, the GIS-based modeling methods were found to be more effective at analyzing the risk of slope failure in an open-pit mine than conventional graphic-based drawing programs.
Choi et al. [55] developed and presented a GIS model that combines fuzzy theory and AHP to evaluate slope instability in open-pit coal mines. Relative collapse risk can be evaluated by considering seven influence factors simultaneously (i.e., overall slope gradient, slope height, surface flows, excavation plan, tension crack, fault, waterbody). In addition, the weight of each factor can be determined using fuzzy membership functions and the AHP. This model could be used in conjunction with the GIS database to assess the risk of slope collapse for the entire slope instability. The application of the model to the Pasir open-pit coal mine in Indonesia confirmed that it could be an effective tool for analyzing the risk of slope failure when establishing a slope management solution.
Choi et al. [56] conducted a study of flood and gully erosion problems at the Pasir open-pit coal mine in Indonesia. First, GIS was used to obtain quantitative information regarding the hydrological characteristics of the surface drainage system from a DEM. Based on the analysis results of the drainage system, raster-based spatial analysis was performed to distinguish the bench slopes with concentrated surface drainage flows and calculate the ratio of the amount of incoming water to the size of the temporary storage pond [56]. Finally, the bench slopes that are vulnerable to gully erosion were identified and an optimal design for pump placement to reduce the risk of flooding during heavy rain was proposed. Figure 13 shows the rated value map derived from the surface flow accumulation in the study area.
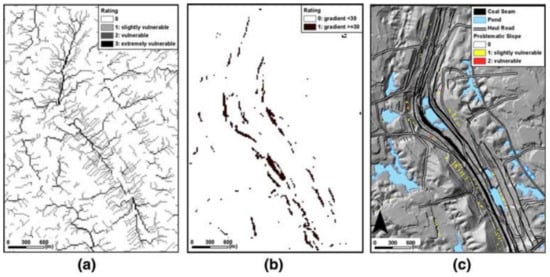
Figure 13.
Rated value maps. (a) Rating the vulnerability to erosion from the flow accumulation of surface drainage. (b) Rating the slope gradient to extract steep bench slopes (30° C). (c) Locations of bench slopes vulnerable to gully erosion during rainfall [56].
Yucel et al. [57] researched the detection and visualization of changes in acid mine lakes using time-series satellite image data from GIS that provided a variety of details on a year-to-year basis regarding the regional scale of the land and changes in water bodies. The data received from the remote-sensing satellites were used to verify the developed monitoring system, and various acid mine areas of 9 km2 were selected for the case study. GIS software was used to analyze satellite images as a time series and convert the boundaries of the acid mine lakes into a vector data format. Then, the changes in the area and perimeter of the acid mine lakes were calculated and presented through tables and graphics. In addition, thematic maps of the changes in the acid mine lakes were created. Case studies indicated that the number of mine lakes increased, creating environmental risks due to their increased hydrochemical properties and area.
Werner et al. [58] created detailed maps of representative samples of current larger-scale mines around the world and determined whether a generalization can be made regarding mine areas based on factors that influence their extent. In this study, commodities primarily produced by the mines were selected for comparative analysis and site mapping. At this time, the main focus was on open pits, infrastructure areas of mining sites, waste rock dumps, water storage ponds, and tailings storage facilities. Then, additional site characteristics were compiled. Finally, multiple regression analysis was used to assess the possible relationships between the extent of mining features and potential explanatory variables. As a result, the analyzed mines showed considerable diversity in their extent and configurations, and the effects of the distribution of the ores and surrounding topography on the arrangement of the features around the mines were determined. In addition, the most conservative regression models accounted for ≈ 40% – 75% of the variability in the extent of the various mining features, except for water storage ponds. The results of this study could be used to determine the demand for land in current and future mining developments.
5.2. Mine-Induced Hazard Management
GIS functions, such as watershed analysis, spatial mapping, spatial database, and spatial modeling, could be used for mine-induced hazard management. In this paper, we present examinations that have addressed the movement of soil, water inrush, and sediment; mine subsidence; and the storage and visualization of mine reclamation data.
Moomen and Dewan [59] developed early warning indicators of mining-induced land degradation to enable coordination between stakeholders in new regions that have undergone exploration and mining activities. To this end, they developed a model to quantify the relationships between mining leases and biophysical conditions that enhance land degradation. The Upper West Region of Ghana was considered as the study area, and the spatial impact relationship between mine development and land degradation was evaluated by considering vegetation displacement, the land degradation impact index, and the rainfall erosivity index in satellite images during two time periods. The model developed in this study can help to find efficient strategies for sustainable mining and the mutual benefit of rural land resources between policymakers, communities, and interested development partners. It can also enhance the understanding of companies and governments regarding the links between mining-induced land degradation and social conflict.
Duncan et al. [60] assessed the Golden Star Resources Bogoso Prestea Limited concession, where mining caused land use changes based on GIS-based spatial analysis. Area estimation and analysis of land use flow methods were performed to analyze a 20-year period (1986–2006), making it possible to identify how changes in land use in mining and agriculture over those two decades have emerged. This analysis revealed that land use from mining has stabilized owing to good reclamation practices and reduced mine development.
Wu et al. [61] proposed a GIS- and ANN-based coupling technique to evaluate the vulnerability of the water inrush controlled by geomorphology and the regional geologic structure of coal mines. To this end, a coal mine located in northern China was used to assesses the vulnerability of the water inrush through GIS, and ANN was utilized to determine the weight coefficient for each factor that affects the water inrush. The technology developed in this study could more accurately predict karst water inrushes while solving the following difficulties in assessing the vulnerability of the water inrush: (1) water inrush is controlled by several factors, (2) inaccurate weight for each factor, (3) lack of an established mathematical model to explain the process of water inrush, and (4) water inrush closely related to human activity.
Boggs et al. [62] presented the results of hydrology and landform evolution modeling techniques integrated with GIS to assess the possible impacts of mining on the Swift Creek catchment in the Northern Territory of Australia. First, a spatial and attribute database related to the study area was constructed using GIS, and hydrology and sediment transport parameters were derived from field data collected within the Swift Creek catchment. The Distributed parameter Field-Williams (DISTFW) hydrology model was then used to determine long-term hydrology parameters, and the SIBERIA landform evolution model was employed to derive annual hydrographs. Attempts to link the hydrology and landform evolution models with GIS showed that the process of parameter derivation and modeling can be simplified. In addition, linking these models to GIS provides significant benefits, as GIS can assist in the derivation, storage, manipulation, processing, and visualization of georeferenced data at the catchment-wide scale.
Miao et al. [63] investigated the feasibility of differential radar interferometry (DInSAR) using both ERS and Envisat images to monitor mine subsidence in Tang Shan, Hebei Province, China. They used GIS tools to analyze and validate the DInSAR results. They also discussed the disadvantages of using interferometric measurements for monitoring mine subsidence. Consequently, the results from Tang Shan showed that the subsidence was serious in the 1990s, and the resulting displacement was measured.
Maryati et al. [64] conducted research to design a GIS database template for environmental management in mining operations in Indonesia. Using ArcCatalog ArcGIS 9.3 software, the GIS database was designed, followed by steps such as the inventory and evaluation of government regulations, inventory and evaluation of environmental quality standards, sorting and grouping parameters, classification of design features and attributes, and creation of a GIS database and dictionary. The newly designed GIS database template has many benefits for environmental management, including integration into a single database, prevention of duplicate data, volume data reduction, data uniformity, ease in finding and tracking data, and integration of spatial and attribute data. Furthermore, the template can be used as an input for GIS analysis for decision-making and development strategies.
Álvarez et al. [65] offered a different perspective on the rationale for research, preservation, and development of a mining heritage for educational purposes. To this end, the Lullumres iron mine in Spain was selected, and documents were analyzed and classified to investigate and reconstruct the 3D geometric structure of the mine. They also proposed ways to integrate this information into GIS to improve the management of the mine data. Consequently, the closed mine was found to be a live mine with factors, traditionally regarded as negative, that need to be included as patrimonial elements with associated implications.
Radulescu and Radulescu [66] presented the main directions of implementation of GIS technology in mining through a management information system. They explained the role of GIS in Romania’s mining sector and how it is used at each stage of mine development. The research shows that GIS can have a significant impact on the exploration and development stages of a mine and the mining process.
5.3. Mine Rehabilitation Design
Regarding mine rehabilitation design, studies performed using the GIS main functions of spatial modeling and analysis and decision support were reviewed.
Gorokhovich et al. [67] presented a methodology for combining spatial data on resources for coal mine reclamation and used the extrapolation of GIS analysis to prioritize a list of potential mine reclamation sites within the contiguous United States. They used four major spatial elements, namely dredged materials, abandoned mines, fly ash sources, and railroad data, such as that from the mine reclamation project in Bark Camp, Pennsylvania, USA, and also used GIS to prioritize areas where reclamation projects similar to Bark Camp are feasible. For each 1 km of the United States territory, GIS analysis identified unique occurrences of all four spatial elements within 20, 40, 60, 80, and 100 km radii from abandoned mines [67]. Consequently, the number of mines abandoned and their location in each state in the United States were identified and visualized. The methodology presented in this study could be helpful for government officials to plan mine reclamation.
Fadda et al. [68] presented a plan for the re-utilization of excavation based on the naturalistic and geographical conditions of the mining areas and their surroundings. As preparatory work, they characterized the research area with a topographic survey; established a geodetic control network with a global positioning system to describe the morphological features of the landscape; and performed three-dimensional analysis and geoprocessing using a commercial geographical system, such as GIS, and computer-aided design. The graphic data layers were then integrated with geological and morphological maps. This process helps to create and render virtual 3D environments for current, past, and future landscape development.
Kim et al. [69] developed ArcMine, a new GIS extension that can support reclamation projects in abandoned mining areas. ArcMine offers four main functions: the ability to assess the hazards of mine subsidence, estimate the erosion of mine waste, analyze the flow path of mine water on the surface, and identify tree species suitable for mine reforestation. They integrated topographical maps, geological maps, mine drift maps, and borehole data to set up a spatial database and examined the distributed mine hazards that were likely to damage the surrounding environment. It was demonstrated that the new GIS extensions developed in this study could provide useful information on mine hazards to support reclamation planning.
Pavloudakis et al. [70] proposed a spatial decision support system (SDSS) that minimizes problems such as the lack of data integration and time-consuming analysis caused by conventional methods in the reclamation plan of the mine. Based on binary integer linear programming models, the SDSS could solve these problems by integrating GIS with multiple-criteria decision-making methods. The SDSS also allows users to select appropriate land use in different parts of the post-mining area, taking into account social, technical, economic, environmental, and safety criteria. The proposed SDSS was used to carry out a case study regarding the selection of the optimal landscape reclamation strategy for the Amynteon lignite surface mine in Greece. The system showed that mining companies can efficiently determine the specific land use (agricultural land, forest, recreational area, and industrial zone) that is most suitable for each part of the research area.
Menegaki and Kaliampakos [71] proposed a new method for quantitatively evaluating the impacts on the landscape during mine operation and the improvement achieved after rehabilitation of the mine site. They named the method Landscape Evaluation Tool for Open Pit Mine Design, which focuses on measuring two main parameters: the alteration of the topographic relief and the sensitivity of observation conditions, with both making use of GIS tools. The quantitative values generated for each of the above parameters were shown to facilitate the discrimination of seemingly similar alternative designs and rehabilitation schemes. In addition, case studies showed that the partial backfilling of the quarry site could effectively reduce its visual impacts, producing low topographic relief alteration and viewing sensitivity indices.
6. Discussion
6.1. Advantages of Using GIS in Mining
To support mine planning, optimize mine operations, and analyze the environmental impact on the mining site, GIS can be effectively used for the following reasons.
(1) Effective mine data management in georeferenced, spatial, and attribute data formats: Mine data mainly include drill holes, ore bodies, mineral deposits, pit boundaries, and underground haulage roads, which have spatial characteristics. Therefore, these data can be effectively stored, manipulated, and processed in georeferenced (geographic coordinate-related characteristics), spatial (locational information), and attribute (spatial properties) data formats in the GIS environment. For this purpose, various GIS database frameworks have been established for drill hole data [35,41], block models of mineral deposits [17], underground haulage road networks [29,31,32,33,34], underground environmental attributes using ZigBee nodes [37], and underground ventilation networks [44,45,46].
(2) Powerful decision-making support for mine managers: GIS can be used to support decision-making during the various stages of mining development. Examples include ore reserve detection and estimation using spatial 3D query tools [13], visualization of uncertainty in open-pit boundaries [17], and land-use selection after mine closure using multi-criteria decision analysis [70]. Furthermore, mining-induced potential conflicts [24,25], disasters [47,53,54,55], and hazards [59,60,61,62,63] can be identified in advance using spatial analysis tools. Finally, all of the data and information are shared with multiple users to discuss optimal decisions through enterprise GIS technology [42].
(3) Flexibility of multi-parameter considerations: GIS offers numerous data integration tools, map overlapping tools, multi-criteria analysis tools, and mapping algebra functions for multi-parameter consideration. For example, various spatial analysis models have been developed for optimal truck haulage route determination by considering truck movement impact factors [27], multiple-transmitter candidate location selection by considering the possibility of additional mine development and environmental factors [38], and in-pit stormwater pond design by considering the hydrological characteristics of surface drainage systems [50].
(4) Fast and objective mine site investigation without on-site access: GIS can reduce the time and effort required for detailed mine site investigation by using remote-sensing data and various types of maps (e.g., topographic contour maps, geological maps, hydrological maps, and infrastructure maps). For mine reclamation planning, these methodologies are applied to determine mine-land reclamation activities [70], access mine subsidence and waste erosion [69], and evaluate the visibility impact of mining sites [71]. Consequently, mine investigators do not need to access undeveloped, dangerous, and hazardous areas for a site investigation.
6.2. Future Direction of GIS in Mining
In recent years, new technologies, such as sensor networks, mobile devices, wireless communication, and UAVs, have been introduced into mining sites in accordance with the fourth industrial revolution. In particular, information-communication-technology-based mine safety management systems have been actively utilized in open-pit and underground mines to track equipment and worker locations and monitor the mine operation environment. To transmit location data to the web server, a wireless communication network is installed in the open-pit and underground mines. Several studies have been conducted to simulate the truck haulage system using data derived from the mine safety management system. For instance, Baek and Choi [72] presented a knowledge-based simulation methodology for truck haulage systems in underground mines by considering the truck travel time, which was extracted from big data of a mine safety management system. Moreover, Baek and Choi [73] developed a deep neural network (DNN) model, which was trained using a large set of truck haulage system operation conditions and truck cycle times to predict the ore production and crusher utilization of a truck haulage system in an underground mine.
However, the aforementioned studies manually generated input data, which were required for the truck haulage system simulation and DNN model training of big data from a mine safety management system without GIS-based spatial and attribute database generation for the system. Therefore, in the future, current research needs to be expanded as follows: (a) the introduction of a GIS-based spatial and attribute database for a mine safety management system with consideration of the packet data frame (e.g., equipment detection time, ID of detected equipment); (b) the development of algorithms to automatically measure input parameters (e.g., haulage operation time, number of dispatched trucks, truck travel time) of a truck haulage system simulation and DNN model training from the spatial and attribute database and generate input data in a matrix format; and (c) the development of database query functions to extract specific input data according to the haulage operation time, date, and type of equipment.
7. Conclusions
In this review, numerous published studies on GIS-based methods and applications for planning, optimizing, and managing mine development processes were presented. A total of 58 recently published articles were found, and the detailed contents, primarily regarding GIS functions, were analyzed for this literature review. For systematic reviews, three topics were used for classification, namely mine planning, mine operation, and environmental management, by taking into account various mine development phases and a range of environments to be managed. It was observed that GIS-based methods, including spatial database, spatial analysis, spatial mapping, and visualization, can be effectively used at all mine development stages at the global, regional, and mine scales. The conclusions drawn from the detailed review of each topic are as follows.
(1) In the mine planning phase, GIS-based methods were adopted for ore reserve estimation, open-pit boundary optimization, mine infrastructure design, and potential conflict analysis. There were three main characteristics of GIS considered for this topic. First, GIS capabilities, such as a spatial database and the associated analysis, were integrated with geostatistics interpolation functions and various weighting methods (AHP, Delphi, logistic regression, and ANN) to quantitatively estimate ore deposits in the feasibility study stage. Second, it was confirmed that 3D spatial query functions would be effective searching tools for mineral target visualization above a cut-off grade. Finally, spatial analysis, including LCPA, corridor analysis, and hydrologic modeling, could be widely applied at the regional scale to design the mine-port haulage route and prevent potential social and environmental conflict.
(2) GIS-based methods can be widely used for mine operation system optimization and management. Various mine operation systems have been implemented in mining sites for ore haulage operations, wireless communication, ore management, safety monitoring, underground ventilation, and drainage systems. There are three steps to designing and managing mine operation systems using GIS. First, the spatial database and metadata of workers and equipment, haulage roads and ventilation networks, production rates, and environmental factors are built in the GIS environment. Then, all mine members are allowed to share mine operation data in real time by uploading and displaying it on the GIS web server. Finally, mine operation systems can be optimized by determining the ore haulage route, ventilation direction and quantity, and rescue planning in an emergency through GIS-based spatial analysis.
(3) Numerous GIS-based applications for mine environmental management were observed in the mine operation and reclamation phase. The impact of mine-induced disasters and hazards on mining environments and human health has been predicted and managed using spatial databases, spatial analysis, and visualization techniques. Remote sensing images were principally used to analyze the variation in the mine environment (mine subsidence, slope failure, and mine lake) as a time series. Moreover, various GIS extension systems were developed to support decision-making in mine reclamation planning and re-utilization designs.
GIS has powerful capabilities for designing and optimizing mine development stages in terms of spatial data management, decision-making support, and multi-parameter consideration. Nonetheless, the practical use of GIS-based methods for mine planning, operation, and environmental management remains difficult. Consequently, to maximize the practicality and applicability of GIS in the mining site, a general understanding and training of the GIS platform is required through continuous communication and feedback between engineers and researchers.
Author Contributions
Y.C. gathered the published literature; all the authors reviewed and analyzed the published literature; all the authors wrote the paper. Y.C. implemented the final work for the paper submission. All authors have read and agreed to the published version of the manuscript.
Funding
This work was supported by the KETEP grant funded by the Korea Government’s Ministry of Trade, Industry and Energy (project no. 20182510102370).
Conflicts of Interest
The authors declare no conflict of interest.
References
- Carvalho, F.P. Mining industry and sustainable development: time for change. Food Energy Secur. 2017, 6, 61–77. [Google Scholar] [CrossRef]
- Chang, K.-T. Introduction to Geographic Information Systems, 5th ed.; McGraw-Hill higher education: New York City, NY, USA, 2010; pp. 1–448. [Google Scholar]
- Lewis, P. A Review of GIS Techniques for Handling Geoscience Data within Australian Geological Surveys. In Geophysics and geochemistry at the millenium. Proceedings of Exploration 97: Fourth Decennial International Conference on Mineral Exploration, Toronto, Canada, 14-18 September 1997; Gubins, A.G., Ed.; Prospectors and Developers Associaton: Toronto, Canada, 1997; pp. 81–86. [Google Scholar]
- Lukasheh, A.F.; Droste, R.L.; Warith, M.A. Review of Expert System (ES), Geographic Information System (GIS), Decision Support System (DSS), and their applications in landfill design and management. Waste Manage Res. 2001, 19, 177–185. [Google Scholar] [CrossRef] [PubMed]
- Wang, H.; Liu, G.; Xu, W.; Wang, G. GIS-based landslide hazard assessment: an overview. Prog. Phys. Geogr. 2005, 29, 548–567. [Google Scholar] [CrossRef]
- Gajos, M.; Sierka, E. GIS Technology in Environmental Protection: Research Directions Based on Literature Review. Pol. J. Environ. Stud. 2012, 21, 241–248. [Google Scholar]
- Hou, d.; O’Connor, D.; Nathanail, P.; Tian, L.; Ma, Y. Integrated GIS and multivariate statistical analysis for regional scale assessment of heavy metal soil contamination: A critical review. ENVIRON. POLLUT. 2017, 231, 1188–1200. [Google Scholar] [CrossRef]
- Wang, X.; Xie, H. A Review on Applications of Remote Sensing and Geographic Information Systems (GIS) in Water Resources and Flood Risk Management. Water 2018, 10, 608. [Google Scholar] [CrossRef]
- Hustrulid, W.A.; Kuchta, M.; Martin, R.K. Open Pit Mine Planning and Design, 3rd ed.; CRC Press: Leiden, The Netherlands, 2013; pp. 1–1288. [Google Scholar]
- Darling, P. SME Mining Engineering Handbook, 3rd ed.; Society for Mining, Metallurgy and Exploration (SME): Littleton, CO, USA, 2011; pp. 1–1837. [Google Scholar]
- Environmental Code of Practice for Metal Mines. Available online: https://www.ec.gc.ca/lcpe-cepa/documents/codes/mm/mm-eng.pdf (accessed on 19 February 2020).
- Suh, J.; Kim, S.-M.; Yi, H.; Choi, Y. An Overview of GIS-Based Modeling and Assessment of Mining-Induced Hazards: Soil, Water, and Forest. Int. J. Environ. Res. Public Health 2017, 14, 1463. [Google Scholar] [CrossRef]
- Sprague, K.; de Kemp, E.; Wong, W.; McGaughey, J.; Perron, G.; Barrie, T. Spatial targeting using queries in a 3-D GIS environment with application to mineral exploration. Comput. Geosci. 2006, 32, 396–418. [Google Scholar] [CrossRef]
- Uygucgil, H.; Konuk, A. Reserve estimation in multivariate mineral deposits using geostatistics and GIS. J. Min. Sci. 2015, 51, 993–1000. [Google Scholar] [CrossRef]
- Hosseinali, F.; Alesheikh, A.A. Weighting Spatial Information in GIS for Copper Mining Exploration. Am. J. Appl. Sci. 2008, 5, 1187–1198. [Google Scholar] [CrossRef]
- Kim, S.M.; Choi, Y.; Park, H.D. New Outlier Top-Cut Method for Mineral Resource Estimation via 3D Hot Spot Analysis of Borehole Data. Minerals 2018, 8, 348. [Google Scholar] [CrossRef]
- Baek, J.; Choi, Y.; Park, H.-S. Uncertainty Representation Method for Open Pit Optimization Results Due to Variation in Mineral Prices. Minerals 2016, 6, 17. [Google Scholar] [CrossRef]
- Sinha, N.; Deb, D.; Pathak, K. Development of a mining landscape and assessment of its soil erosion potential using GIS. Eng. Geol. 2017, 216, 1–12. [Google Scholar] [CrossRef]
- Grenon, M.; Hadjigeorgiou, J. Integrated structural stability analysis for preliminary open pit design. Int. J. Rock Mech. Min. 2010, 47, 450–460. [Google Scholar] [CrossRef]
- Grenon, M.; Laflamme, A.-J. Slope orientation assessment for open-pit mines, using GIS-based algorithms. Comput. Geosci. 2011, 37, 1413–1424. [Google Scholar] [CrossRef]
- Lechner, A.M.; Devi, B.; Schleger, A.; Brown, G.; McKenna, P.; Ali, S.H.; Rachmat, S.; Syukril, M.; Rogers, P. A Socio-Ecological Approach to GIS Least-Cost Modelling for Regional Mining Infrastructure Planning: A Case Study from South-East Sulawesi, Indonesia. Resources 2017, 6, 7. [Google Scholar] [CrossRef]
- Blachowski, J. Spatial analysis of the mining and transport of rock minerals (aggregates) in the context of regional development. Environ. Earth Sci. 2014, 71, 1327–1338. [Google Scholar] [CrossRef]
- Baek, J.; Choi, Y. A New Method for Haul Road Design in Open-Pit Mines to Support Efficient Truck Haulage Operations. Appl. Sci. 2017, 7, 747. [Google Scholar] [CrossRef]
- Preciado Jeronimo, R.; Rap, E.; Vos, J. The politics of Land Use Planning: Gold mining in Cajamarca, Peru. Land Use Policy 2015, 49, 104–117. [Google Scholar] [CrossRef]
- Craynon, J.R.; Sarver, E.A.; Ripepi, N.S.; Karmis, M.E. A GIS-based methodology for identifying sustainability conflict areas in mine design – a case study from a surface coal mine in the USA. Int. J. Min., Reclam. Environ. 2016, 30, 197–208. [Google Scholar] [CrossRef]
- Gu, Q.; Lu, C.; Li, F.; Wan, C. Monitoring dispatch information system of trucks and shovels in an open pit based on GIS/GPS/GPRS. J. China Univ. Min. Technol. 2008, 18, 288–292. [Google Scholar] [CrossRef]
- Choi, Y.; Park, H.D.; Sunwoo, C.; Clarke, K.C. Multi-criteria evaluation and least-cost path analysis for optimal haulage routing of dump trucks in large scale open-pit mines. Int. J. Geogr. Inf. Sci. 2009, 23, 1541–1567. [Google Scholar] [CrossRef]
- Choi, Y.; Nieto, A. Optimal haulage routing of off-road dump trucks in construction and mining sites using Google Earth and a modified least-cost path algorithm. Autom. Constr. 2011, 20, 982–997. [Google Scholar] [CrossRef]
- Park, B.; Choi, Y.; Park, H.S. Creation of Vector Network Data with Considering Terrain Gradient for Analyzing Optimal Haulage Routes of Dump Trucks in Open Pit Mines. Tunn. Undergr. Space 2013, 23, 353–361. [Google Scholar] [CrossRef]
- Dijkstra, E.W. A Note on Two Problems in Connexion with Graphs. Numer. Math. 1959, 1, 269–271. [Google Scholar] [CrossRef]
- Park, B.; Choi, Y.; Park, H.S. Optimal Routes Analysis of Vehicles for Auxiliary Operations in Open-pit Mines using a Heuristic Algorithm for the Traveling Salesman Problem. Tunn. Undergr. Space 2014, 24, 11–20. [Google Scholar] [CrossRef][Green Version]
- Park, B.; Park, S.; Choi, Y.; Park, H.S. Calculation of a Diesel Vehicle’s Carbon Dioxide Emissions during Haulage Operations in an Underground Mine using GIS. Tunn. Undergr. Space 2015, 25, 373–382. [Google Scholar] [CrossRef]
- Oh, S.; Choi, Y.; Park, H.D. Calculation of a Diesel Truck’s Carbon Dioxide Emissions in an Underground Mine Considering Road Gradient, Load Capacity and Emission Standards. J. Korean Soc. Miner. Energy Resour. Eng. 2017, 54, 100–109. [Google Scholar] [CrossRef]
- Baek, J.; Choi, Y.; Lee, C.; Suh, J.; Lee, S. BBUNS: Bluetooth beacon-based underground navigation system to support mine haulage operations. Minerals 2017, 7, 228. [Google Scholar] [CrossRef]
- Li, X.; Zhong, S. Digital mine design based on Data Warehouse and GIS. Proceedings of the 2nd International Conference on Information Science and Engineering, Hangzhou, China, 4-6 December 2010; IEEE: New York, NY, USA, 2010; pp. 3653–3656. [Google Scholar]
- Chai, Y.; Li, D.; Chai, Y. Research and Design of Personnel Orientation System in Mine Based on GIS/MIS. Proceedings of the 2010 Fourth International Conference on Genetic and Evolutionary Computing, Shenzhen, China, 13-15 December 2010; IEEE: New York, NY, USA, 2010; pp. 268–271. [Google Scholar]
- Moridi, M.A.; Kawamura, Y.; Sharifzadeh, M.; Chanda, E.K.; Wagner, M.; Jang, H.; Okawa, H. Development of underground mine monitoring and communication system integrated ZigBee and GIS. Int. J. Min. Sci. Technol. 2015, 25, 811–818. [Google Scholar] [CrossRef]
- Baek, J.; Choi, Y. A New GIS-Based Algorithm to Support Initial Transmitter Layout Design in Open-Pit Mines. Energies 2018, 11, 63. [Google Scholar] [CrossRef]
- Li, M.; Zhang, X.; Mao, S.; Liu, Q. Study of deep mining safety control decision making system. Procedia Earth Planet. Sci. 2009, 1, 377–383. [Google Scholar] [CrossRef][Green Version]
- Şalap, S.; Karslioǧlu, M.O.; Demirel, N. Development of a GIS-based monitoring and management system for underground coal mining safety. Int. J. Coal Geol. 2009, 80, 105–112. [Google Scholar] [CrossRef]
- Gu, Q.; Lu, C.; Guo, J.; Jing, S. Dynamic management system of ore blending in an open pit mine based on GIS/GPS/GPRS. Min. Sci. Technol. 2010, 20, 132–137. [Google Scholar] [CrossRef]
- Banerjee, T.K.; Roy, S.; Dey, S. A GIS Solution for an Integrated Underground Coal Mine Management: A Conceptual Framework. J. Manag. Policies Pract. 2014, 2, 129–143. [Google Scholar]
- Duncan, E.E.; Rahman, A.A. 3D GIS for mine development – integrated concepts. Int. J. Min., Reclam. Environ. 2015, 29, 3–18. [Google Scholar] [CrossRef]
- Liu, H.; Yang, D. GIS-based mine ventilation network and safety analysis. Proceedings of 2004 IEEE International Geoscience and Remote Sensing Symposium, Anchorage, AK, USA, 20-24 September 2004; IEEE: New York, NY, USA, 2004; pp. 2945–2948. [Google Scholar]
- Massanés, M.B.; Pera, L.S.; Moncunill, J.O. Ventilation management system for underground environments. Tunn. Undergr. Sp. Technol. 2015, 50, 516–522. [Google Scholar] [CrossRef]
- Bascompta, M.; Castañón, A.M.; Sanmiquel, L.; Oliva, J. A GIS-based approach: Influence of the ventilation layout to the environmental conditions in an underground mine. J. Environ. Manage. 2016, 182, 525–530. [Google Scholar] [CrossRef]
- Prakash, A.; Vekerdy, Z. Design and implementation of a dedicated prototype GIS for coal fire investigations in North China. Int. J. Coal Geol. 2004, 59, 107–119. [Google Scholar] [CrossRef]
- Choi, Y.; Suh, J.; Park, H.D.; Sunwoo, C. Application of GIS-based Viewshed Analysis for Selecting Optimal Viewpoints and for Evaluating the Sight Distance on a Haul Road in Open-pit mines. J. Korean Soc. Geosystem Eng. 2008, 45, 265–275. [Google Scholar]
- Zhang, M.-y.; Shan, L.-y.; Zhao, Z.-p. The design of coal mine emergency rescue command information system based on web GIS. Proceedings of the 2011 2nd International Conference on Artificial Intelligence, Management Science and Electronic Commerce (AIMSEC), Dengleng, China, 8-10 August 2011; IEEE: New York, NY, USA, 2011; pp. 4455–4458. [Google Scholar]
- Choi, Y.; Park, H.D. GIS Modeling for Design of In-pit Stormwater Ponds in Large Scale Open-pit Mines. J. Korean Soc. Geosystem Eng. 2011, 48, 165–177. [Google Scholar]
- Bui, X.-N.; Choi, Y.; Atrushkevich, V.; Nguyen, H.; Tran, Q.-H.; Long, N.Q.; Hoang, H.-T. Prediction of blast-induced ground vibration intensity in open-pit mines using unmanned aerial vehicle and a novel intelligence system. Nat. Resour. Res. 2019, 28, 1–20. [Google Scholar] [CrossRef]
- Li, S.; Dowd, P.A.; Birch, W.J. Application of a knowledge- and geographical information-based system to the environmental impact assessment of an opencast coal mining project. Int. J. Surf. Min., Reclam. Environ. 2000, 14, 277–294. [Google Scholar] [CrossRef]
- Francioni, M.; Salvini, R.; Stead, D.; Giovannini, R.; Riccucci, S.; Vanneschi, C.; Gullì, D. An integrated remote sensing-GIS approach for the analysis of an open pit in the Carrara marble district, Italy: Slope stability assessment through kinematic and numerical methods. Comput. Geotech. 2015, 67, 46–63. [Google Scholar] [CrossRef]
- Nelson, E.P.; Connors, K.A.; Suárez, S.C. GIS-Based Slope Stability Analysis, Chuquicamata Open Pit Copper Mine, Chile. Nat. Resour. Res. 2007, 16, 171–190. [Google Scholar] [CrossRef]
- Choi, Y.; Park, H.D.; Sunwoo, C.; Jung, Y.B. Application of Fuzzy Theory and AHP to Evaluate the Slope Instability at Pasir Open Pit Coal Mine, Indonesia. J. Korean Soc. Miner. Energy Resour. Eng. 2009, 46, 45–60. [Google Scholar]
- Choi, Y.; Park, H.D.; Sunwoo, C. Flood and gully erosion problems at the Pasir open pit coal mine, Indonesia: A case study of the hydrology using GIS. Bull. Eng. Geol. Environ. 2008, 67, 251–258. [Google Scholar] [CrossRef]
- Yucel, D.S.; Yucel, M.A.; Baba, A. Change detection and visualization of acid mine lakes using time series satellite image data in geographic information systems (GIS): Can (Canakkale) County, NW Turkey. Environ. Earth Sci. 2014, 72, 4311–4323. [Google Scholar] [CrossRef]
- Werner, T.T.; Mudd, G.M.; Schipper, A.M.; Huijbregts, M.A.J.; Taneja, L.; Northey, S.A. Global-scale remote sensing of mine areas and analysis of factors explaining their extent. Glob. Environ. Change 2020, 60, 1–10. [Google Scholar] [CrossRef]
- Moomen, A.-W.; Dewan, A. Assessing the spatial relationships between mining and land degradation: evidence from Ghana. Int. J. Min., Reclam. Environ. 2017, 31, 505–518. [Google Scholar] [CrossRef]
- Duncan, E.E.; Kuma, J.S.; Primpong, S. Open Pit Mining and Land Use Changes: An Example from Bogosu-Prestea Area, South West Ghana. J. Inf. Syst. Dev. Ctries. 2009, 36, 1–10. [Google Scholar] [CrossRef]
- Wu, Q.; Xu, H.; Pang, W. GIS and ANN coupling model: An innovative approach to evaluate vulnerability of karst water inrush in coalmines of north China. Environ. Geol. 2008, 54, 937–943. [Google Scholar] [CrossRef]
- Boggs, G.S.; Evans, K.G.; Devonport, C.C.; Moliere, D.R.; Saynor, M.J. Assessing catchment-wide mining-related impacts on sediment movement in the Swift Creek catchment, Northern Territory, Australia, using GIS and landform-evolution modelling techniques. J. Environ. Manage. 2000, 59, 321–334. [Google Scholar] [CrossRef]
- Miao, F.; Yan, M.; Qi, X.; Ye, C.; Wang, B.; Liu, R.; Jianhua, C. Application of DInSAR and GIS for underground mine subsidence monitoring. Int. Arch. Photogramm. Remote Sens. Spat. Inf. Sci. 2008, 37, 251–255. [Google Scholar]
- Maryati, S.; Shimada, H.; Sasaoka, T.; Hamanaka, A.; Matsui, K.; Nagawa, H. GIS Database Template for Environmental Management of Mining in Indonesia. J. Geogr. Inf. Syst. 2012, 4, 62–70. [Google Scholar] [CrossRef]
- Álvarez, J.P.F.; Pieiga, A.G.-L.; Suárez-Lázare, C.J. New concepts in reassessing mining heritage: A study and its implications from the Ancient Iron Mine of Llumeres (North Spain). J. Cult. Herit. 2010, 11, 172–179. [Google Scholar] [CrossRef]
- Radulescu, C.; Radulescu, V.M.G. Approaches of the management informational systems regarding the implementation of the geographic information systems (GIS) in the mining basins of Romania. In Proceedings of the 11th International Multidisciplinary Scientific Geoconference and EXPO, Albena Seaside & Spa Resort, Bulgaria, 19–25 June 2011; pp. 215–222. [Google Scholar]
- Gorokhovich, Y.; Voros, A.; Reid, M.; Mignone, E. Prioritizing Abandoned Coal Mine Reclamation Projects Within the Contiguous United States Using Geographic Information System Extrapolation. Environ. Manage. 2003, 32, 527–534. [Google Scholar] [CrossRef]
- Fadda, S.; Fiori, M.; Matzuzzi, C. Developing rehabilitation design for the abandoned mine excavations in central Sardinia, Italy. Int. J. Min., Reclam. Environ. 2010, 24, 286–306. [Google Scholar] [CrossRef]
- Kim, S.M.; Choi, Y.; Suh, J.; Oh, S.; Park, H.D.; Yoon, S.H.; Go, W.R. ArcMine: A GIS extension to support mine reclamation planning. Comput. Geosci. 2012, 46, 84–95. [Google Scholar] [CrossRef]
- Pavloudakis, F.; Galetakis, M.; Roumpos, C. A spatial decision support system for the optimal environmental reclamation of open-pit coal mines in Greece. Int. J. Min., Reclam. Environ. 2009, 23, 291–303. [Google Scholar] [CrossRef]
- Menegaki, M.E.; Kaliampakos, D.C. Evaluating mining landscape: A step forward. Ecol. Eng. 2012, 43, 26–33. [Google Scholar] [CrossRef]
- Baek, J.; Choi, Y. Simulation of Truck Haulage Operations in an Underground Mine Using Big Data from an ICT-Based Mine Safety Management System. Appl. Sci. 2019, 9, 639. [Google Scholar] [CrossRef]
- Baek, J.; Choi, Y. Deep Neural Network for Ore Production and Crusher Utilization Prediction of Truck Haulage System in Underground Mine. Appl. Sci. 2019, 9, 4180. [Google Scholar] [CrossRef]


© 2020 by the authors. Licensee MDPI, Basel, Switzerland. This article is an open access article distributed under the terms and conditions of the Creative Commons Attribution (CC BY) license (http://creativecommons.org/licenses/by/4.0/).