Article

The Feature Selection Effect on Missing Value Imputation of Medical Datasets

1
Department of Nursing, Ditmanson Medical Foundation Chia-Yi Christian Hospital, Chiayi 60002, Taiwan
2
Department of Information Management and Institute of Healthcare Information Management, National Chung Cheng University, Chiayi 62102, Taiwan
3
Department of Information Management, National Central University, Taoyuan 320, Taiwan
4
School of Medicine, China Medical University, Taichung 404, Taiwan
5
Department of Psychiatry, Chiayi Branch, Taichung Veterans General Hospital, Chiayi 600, Taiwan
*
Author to whom correspondence should be addressed.
These authors contributed equally.
Appl. Sci. 2020, 10(7), 2344; https://doi.org/10.3390/app10072344
Submission received: 7 March 2020 / Revised: 22 March 2020 / Accepted: 26 March 2020 / Published: 29 March 2020
(This article belongs to the Special Issue Medical Artificial Intelligence)

Abstract

:
In practice, many medical domain datasets are incomplete, containing a proportion of incomplete data with missing attribute values. Missing value imputation can be performed to solve the problem of incomplete datasets. To impute missing values, some of the observed data (i.e., complete data) are generally used as the reference or training set, and then the relevant statistical and machine learning techniques are employed to produce estimations to replace the missing values. Since the collected dataset usually contains a certain number of feature dimensions, it is useful to perform feature selection for better pattern recognition. Therefore, the aim of this paper is to examine the effect of performing feature selection on missing value imputation of medical datasets. Experiments are carried out on five different medical domain datasets containing various feature dimensions. In addition, three different types of feature selection methods and imputation techniques are employed for comparison. The results show that combining feature selection and imputation is a better choice for many medical datasets. However, the feature selection algorithm should be carefully chosen in order to produce the best result. Particularly, the genetic algorithm and information gain models are suitable for lower dimensional datasets, whereas the decision tree model is a better choice for higher dimensional datasets.

1. Introduction

In many real-world medical domain problems, the datasets collected for data mining purposes are usually incomplete, containing missing (attribute) values or missing data, such as pulmonary embolism data [1], DNA microarray data [2], metabolomics data [3], cardiovascular disease data [4], lung disease data [5], food composition data [6], traffic data [7], and other medical data [8].
Many data mining and machine learning algorithms used in the data mining process are not able to effectively analyze incomplete datasets. In addition, directly using incomplete datasets for the purpose of data analysis can have a significant effect on the final conclusions that are drawn from the data [9].
There are a number of different techniques that can be used to deal with missing values, such as case deletion, mean substitution, and model-based imputation, to name a few [10,11,12]. Among them, the simplest solution is based on case deletion (or listwise deletion), in which data containing missing values are deleted. However, it is problematic when missing data are not random or the missing rate for the whole dataset is larger than a certain value, for example 10% [11,13].
Model-based imputation methods using machine learning techniques have been shown to outperform many other statistical techniques [14,15,16,17,18,19]. In general, these types of model-based imputation methods are based on machine learning techniques and involve training using a set of complete data to produce estimations to replace the missing values in an incomplete dataset.
However, since a collected (incomplete) dataset must contain a number of features (i.e., input variables) to represent the data, it is likely that some of the features will not be representative, which can affect the discriminatory power of the data mining algorithms. In other words, redundant and irrelevant features or unwanted features from the collected dataset must be filtered out; otherwise the mining performance will be affected. This situation could be even worse when ultra-high or hyperdimensional datasets containing a very large number of features are used, which is called the curse of dimensionality [20].
For the purpose of missing value imputation, performing feature selection over the observed data to filter out unrepresentative features could make the imputation process more efficient, since some of the missing features, which may be regarded as unrepresentative, are not required for imputation. Moreover, feature selection is able to make the imputation model trained by the lower dimensional observed data provide better estimations for the rest of the missing features.
In literature, several studies have focused on this issue [21,22]. However, since feature selection methods can be classified into filter, wrapper, and embedded methods [23], none of them consider all three types of methods for missing value imputation, especially for medical datasets. Additionally, the numbers of features in their chosen datasets are also very small (i.e., 13 to 105 and 6 to 9).
Therefore, the research objective in this study is to examine the effects of performing three types of feature selection methods on model-based missing value imputation over different medical domain datasets. For feature selection, three different types of feature selection methods are employed; information gain (IG) as the filter-based method, genetic algorithm (GA) as the wrapper-based method, and decision tree (DT) as the embedded-based method. In addition, three popular machine learning techniques are used for the imputation process, namely the k-nearest neighbor (k-NN), multilayer perceptron (MLP), and support vector machine (SVM) approaches.
The contribution of this paper is two-fold. First, the effect of performing feature selection on missing value imputation is examined for various domain problems. Second, the best combinations of feature selection and imputation methods are identified for datasets with different dimensionality scales.
The rest of this paper is organized as follows. A review of the related literature is given in Section 2, including the types of missing values and the missing value imputation process. Section 3 describes the experimental procedure, Section 4 presents the experimental results, and some conclusions are provided in Section 5.

2. Literature Review

2.1. Types of Missing Values

According to [9], there are three types of missing values or missing data mechanisms: missing completely at random (MCAR), missing at random (MAR), and missing not at random (MNAR).
In MCAR, the missing values occur entirely at random, which means that the data are missing independently of both observed and unobserved data. As an example of two attributes, represented by x and y, missing value y neither depends on x nor y. In MAR, whether a data point is missing or not is not related to the missing data, but rather related to some of the observed data; that is, given the observed data, data are missing independently of the unobserved data. For example, the missing value y depends on x but not y. In MNAR, the probability of a missing value depends on the variable that is missing.
Although real world data are rarely MCAR, it has often been assumed in past studies that the data are MCAR or MAR. However, for MNAR data, imputation methods that assume MAR data can often produce only small biases, and this depends on how well a MAR mechanism can approximate the MNAR mechanism.

2.2. Missing Value Imputation

According to [24,25,26], the methods to deal with incomplete data containing missing values can be classified into three categories, which are case deletion, learning without handling of missing values, and missing value imputation. In case deletion, which is the simplest method, the data with missing values are removed from the original incomplete dataset to make it become a complete dataset. For the learning methods that do not involve handling of missing values, some learning techniques can be employed, such as Bayesian networks [27] and cost-sensitive decision trees [28].
On the other hand, missing value imputation can be broadly classified into single imputation and multiple imputation methods. In the single imputation methods, the focus is on substituting each missing value, which is done using a statistical method, such as the mean and mode technique. In addition, there are several machine-learning-based techniques, such as the k-nearest neighbor [29,30], multilayer perceptron [14], and support vector machines [31] techniques, which can be used to estimate the missing values. However, these can lead to biased estimates of variances and covariances (i.e., underestimation of standard error) [32].
Multiple imputation methods are aimed at solving the limitations of single imputation methods so that each missing value is replaced by two or more acceptable values, which represent a distribution of possibilities. One representative method is the least absolute shrinkage and selection operator (LASSO), which is a regression analysis method that performs variable selection and prediction [33]. It has been modified for specific domain problems, such as medical data [34] and high-dimensional data [35]. However, there are limitations in that the computational complexity is larger than for single imputation methods, and different estimations produced to replace a specific missing value may be very different, which can lead to the situation where different values are obtained from the same data using the same method at different times [32]. Therefore, the research objective of this paper is to examine the feature selection effect on single imputation methods, especially by three widely used machine learning methods —MLP, KNN, and SVM.

2.3. Feature Selection

Feature selection can be defined as a process of selecting a subset of relevant features (or variables) from a given dataset. Since real-word datasets usually contain some features that are either redundant or irrelevant, they can be removed without incurring much loss of information [36,37]. In other words, feature selection can be regarded as a special case of dimensionality reduction, which aims to reduce the number of random variables under consideration by obtaining a set of principal variables. In particular, the difference between feature selection and dimensionality reduction is that the set made by dimensionality reduction does not have to be a subset of the original set of features. For principal component analysis, new synthetic features are made from a linear combination of the original ones, and the less important ones are discarded.
In general, feature selection algorithms can be classified into three types of methods—filter, wrapper, and embedded methods [36]. One major type of filter method used to select important features is based on ranking techniques. Specifically, the input features are scored via a suitable ranking criterion and features that fall below a certain threshold are removed. Many statistical techniques belong to the filter type of method, including information gain and stepwise regression.
The wrapper methods are based on using a predictor (or learning model) as the objective function to evaluate different feature subsets. The best feature subset is chosen, which is the one that can make the predictor produce the highest accuracy rate. Evolutionary compaction techniques, such as the genetic algorithm and particle swarm optimization methods, have recently gained much attention and shown some success [38,39].
The representative wrapper methods are the genetic algorithm and particle swarm optimization methods. However, the wrapper methods have a large computational cost for model training and in searching for the best subset.
The embedded methods perform feature selection during the model learning process [39,40,41]. In other words, feature selection is incorporated into the classifier training process. Specifically, embedded methods not only measure the relations between the input features and the output features, but also search for features that allow better classification accuracy. One representative embedded method is the decision tree model, where the constructed tree contains a number of selected features (i.e., decision nodes) that can distinguish well between different classes (i.e., leaf nodes). Besides decision trees, there are some other types of embedded feature selection methods, such as l1-regularization techniques, including LASSO (least absolute shrinkage and selection operator) [33] and l1-SVM (L1-norm SVM) [42], and memetic algorithms [43].

3. Research Methodology

3.1. Combination of Feature Selection and Missing Value Imputation

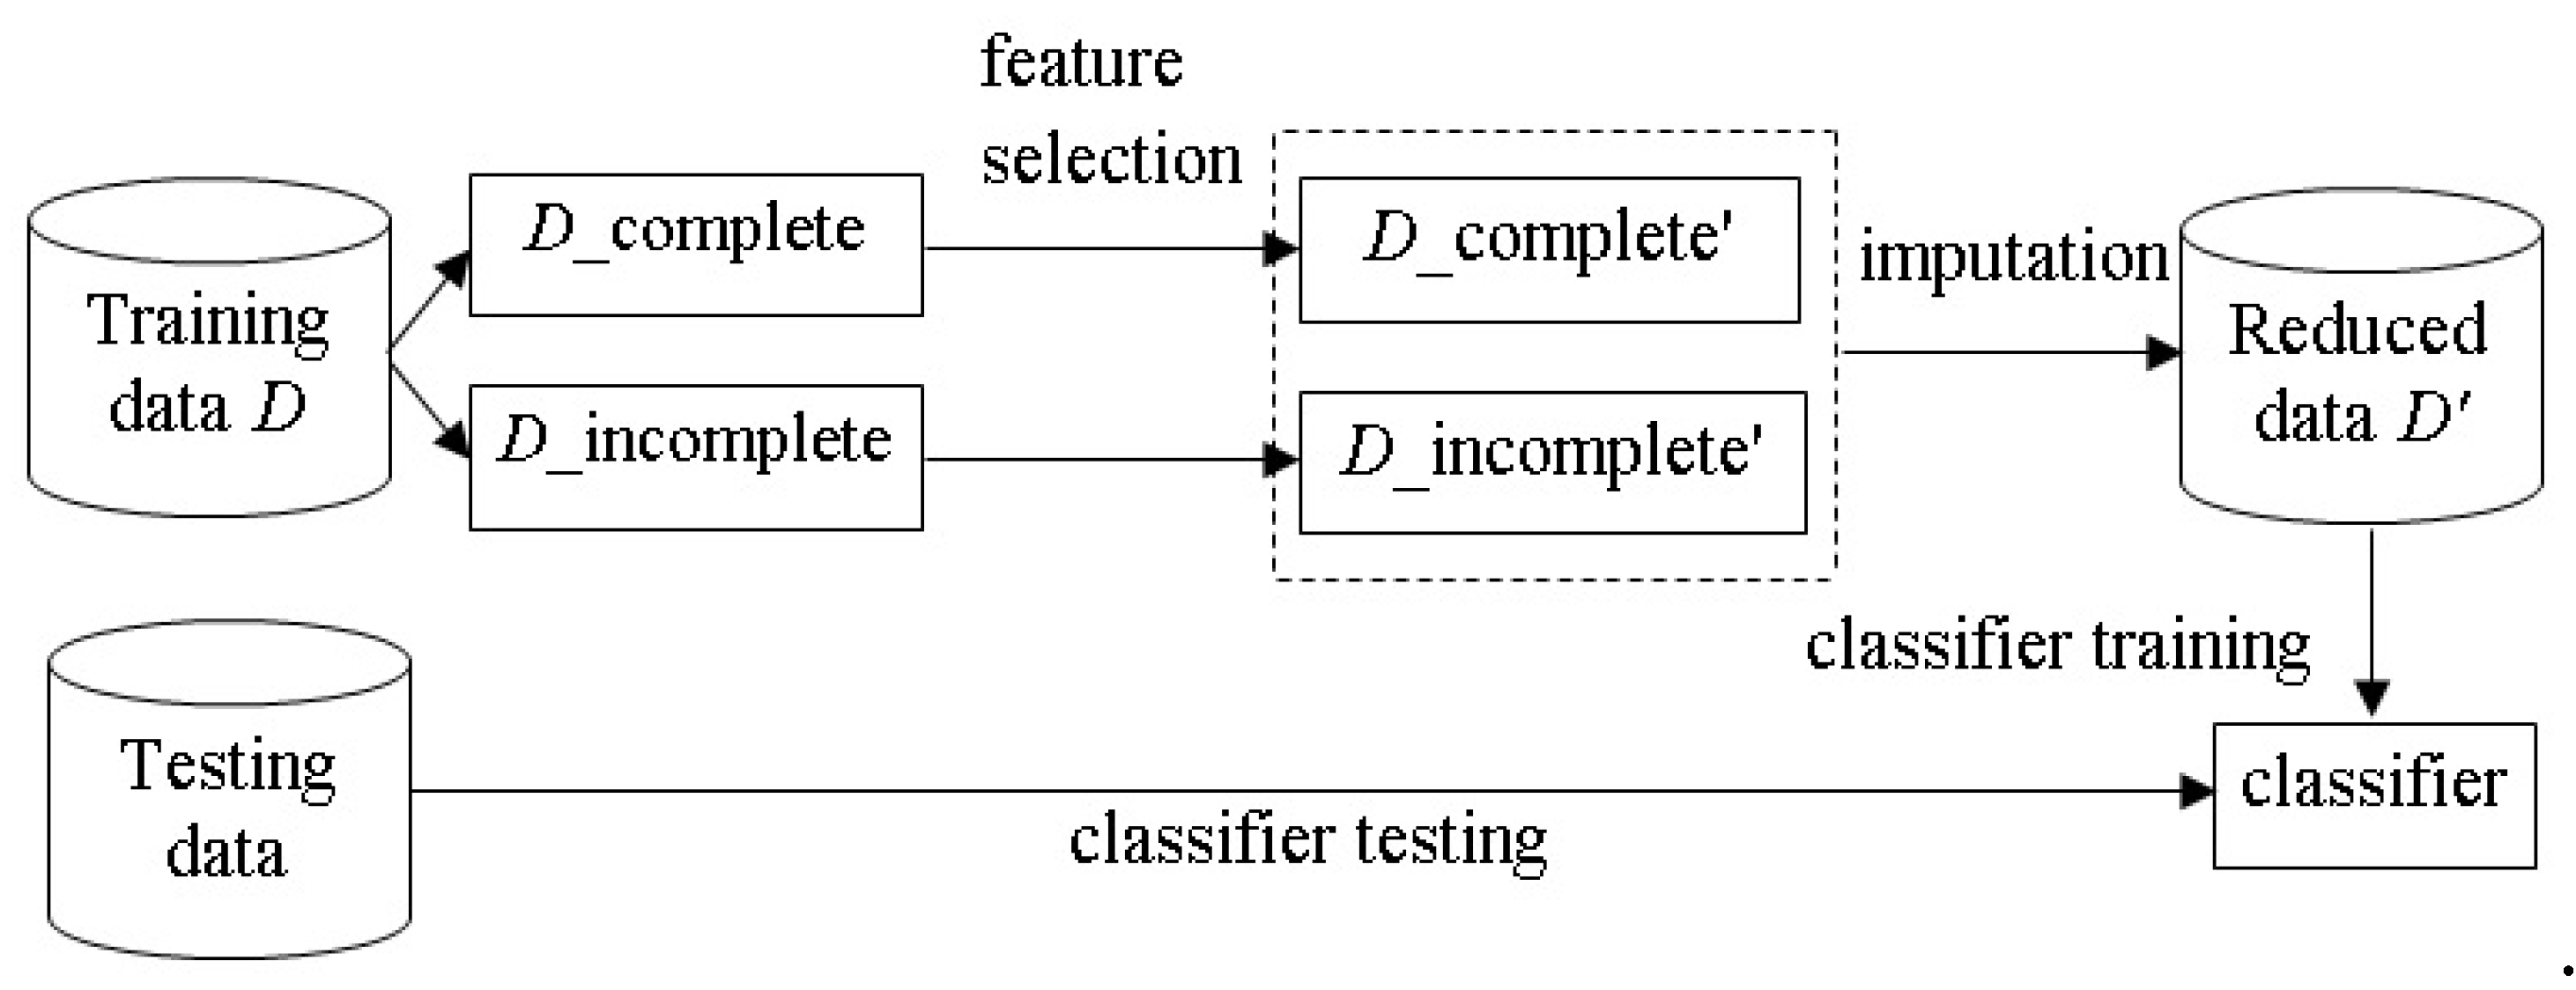
The process combining feature selection and missing value imputation is illustrated in Figure 1. The incomplete M dimension dataset D is composed of training and test sets, denoted by D_tr and D_te, respectively. For feature selection, D_tr contains a number of complete (i.e., D_complete) and incomplete (i.e., D_incomplete) data samples. The feature selection step is performed on the D_complete subset, leading to a new subset that contains N dimensions (where N < M), denoted as D_complete’. It should be noted that the feature selection process only considers the data in D_complete, since each of these data contains no missing attribute values, which allow feature selection algorithms to successfully select a subset of representative features. However, the issue of whether D_complete represents the population is beyond the scope of this paper. Next, the D_incomplete subset is also reduced to the same N dimensional subset, denoted as D_incomplete’.
For missing value imputation, the D_complete’ subset is used to construct a learning model. For the example of imputing the missing value of the i-th feature (i = 1, 2, …, N) in D_incomplete’, the learning model is trained by the data samples of D_incomplete’, where the i-th feature of D_incomplete’ is used as the output feature and the rest of the features are the input features. Then, estimations are produced by the model to replace the missing values in the D_incomplete’ subset.
The same process is performed over the testing set D_te. That is, the M dimensional testing set D_te is reduced to the N dimensional testing set, denoted by D_te’. Next, missing value imputation is performed by the learned model trained by D_complete’. Finally, the imputed dataset, denoted as reduced data D_tr’, is used to train a classifier, and its classification performance is examined by the reduced testing set (i.e., D_te’).
The baseline imputation process, without feature selection being performed, uses D_complete directly with the model to produce estimations for the missing values of D_incomplete. The aim of this study is to examine differences in performance between the combined feature selection and imputation method and the baseline imputation method.

3.2. Experimental Setup

The experiment is based on five UCI (University of California, Irvine) datasets, in which three datasets contain relatively lower dimensional features and the other two are of higher dimensions. Choosing these datasets with different feature dimensions leads to make the final conclusion. The basic information for the five datasets is listed in Table 1.
For each dataset, missing values are simulated by the MCAR mechanism. The results of calculations with both imputation processes obtained with different missing rates, ranging from 10% to 50% at 10% intervals, are compared in order to understand the performance trends. Note that for larger missing rates with MCAR, each data sample in the training set is likely to become incomplete, which means that there is no data sample in the D_complete subset. Therefore, the criterion for performing the missing rate simulation is that at least 5 training data samples should be complete, without any missing values.
Moreover, each dataset is divided into 90% training and 10% testing datasets by the 10-fold cross validation method [44]. The final classification performance of a classifier is based on the average of 10 test results. Specifically, for each missing rate, each of the 10-fold training sets is simulated 10 times, resulting in 100 different training sets under a specific missing rate. Finally, the feature selection and final classification performance is averaged by the 100 results in order to avoid the bias result produced by the MCAR mechanism.
Three feature selection algorithms are compared, namely information gain (IG), a type of filter method; the genetic algorithm (GA) as a type of wrapper method; and C4.5 decision tree (DT) as a type of embedded method. They are implemented using Weka software (http://www.cs.waikato.ac.nz/ml/weka/). In particular, for the IG the feature selection method, the top ranked 50%, 65%, and 80% of features are kept and compared. Our results show that using the top ranked 80% of original features outperforms the other two settings. Therefore, we only report the best result of IG in this paper. For GA, the predictor and searcher functions are based on “WrapperSubsetEval” and “Genetic Search” functions in Weka software, respectively. For DT, the J48 decision tree classifier is used, where the nodes in the constructed tree are regarded as the selected features.
For missing value imputation, three deferent learning models are constructed, namely the k-nearest neighbor (KNN), multilayer perceptron (MLP) neural network, and support vector machine (SVM) models. As a result, there are nine different combinations of the three feature selection methods and three imputation models. Note that the parameters for constructing these models are based on the default parameters in Weka software. Note that since the aim of this paper is to examine whether performing feature selection can affect the imputation result and classification performance, tuning the parameters to find out the best classifier is not the research objective of this paper.
Finally, SVM is considered for classifier design, since it is the most widely used technique for pattern classification and has shown its effectiveness in many pattern recognition problems [45].

4. Experiments

4.1. Results of Lower Dimensional Datasets

Table 2, Table 3 and Table 4 list the classification results obtained with different combinations of feature selection methods and the MLP, KNN, and SVM imputation models over the three lower dimensional datasets with different missing rates, respectively. They are denoted as DT+MLP, GA+MLP, IG+MLP, DT+KNN, GA+KNN, IG+KNN, DT+SVM, GA+SVM, and IG+SVM. Note that the best result for each missing rate is underlined. Moreover, the number in the bracket followed by each dataset represents the classification accuracy of the SVM trained and tested by the original complete dataset. As we can see in most cases, the combined approaches perform better than the baseline models (i.e., MLP, KNN, and SVM), except for the SPECT dataset.
Figure 2, Figure 3 and Figure 4 show the average classification accuracies of different combined approaches (i.e., DT/GA/IG+MLP, DT/GA/IG+KNN, and DT/GA/IG+ SVM). The baseline imputation models are MLP, KNN, and SVM, which do not have feature selection.
It can be seen that the worst performance is obtained when using the baseline imputation models without performing feature selection in all cases (i.e., missing rates). In particular, using GA and IG for feature selection can make the classifier perform similarly. For the level of significance, the combined models can provide significantly better performances than the baseline imputation models (p < 0.01).
Table 5 shows the numbers of features that are selected by DT, GA, and IG. Among them, DT generally filters out most of the original features from the lower dimensional datasets. This indicates that DT produces “over-selection” results from these datasets; that is, a number of useful features are filtered out, which degrade the final classification performances. On the contrary, IG selects 80% of the original features, where most of the original features are kept.
In short, since using GA and IG to combine with different imputation models can make the classifier produce similar classification accuracies, GA is recommended because it can filter out more unrepresentative features while retaining the classification performance.

4.2. Results of Higher Dimensional Datasets

Table 6 lists the classification results obtained with different combinations of feature selection methods and the MLP, KNN, and SVM imputation models for the high dimensional datasets with the 30% missing rate. The results are interesting, showing that for the arrhythmia dataset, which contains the largest number of features, performing feature selection by DT can allow the MLP, KNN, and SVM imputation models to produce slightly better imputation results than the baseline imputation models with feature selection.
On the other hand, for the breast cancer dataset, the top two performances are based on GA+KNN and GA+SVM. This result indicates that performing feature selection does not necessarily have a positive effect on missing value imputation. However, based on the results of our experiments, a specific feature selection method and imputation model combinations can be recommended for future research, which is likely to outperform the baseline imputation models without feature selection.
Table 7 shows the numbers of features selected by DT, GA, and IG. The results show that DT is a better choice for the higher dimensional datasets as large numbers of features can be filtered out, while combining DT with the imputation models can provide the best result in the arrhythmia dataset and reasonably good performance in the breast cancer dataset.

5. Conclusions

Missing value imputation is a solution for the incomplete dataset problem. Given that the imputation process requires a set of observed data for imputation modeling, regardless of whether statistical or machine learning techniques are used to produce estimations to replace the missing values, the quality of the observed data is critical. In this paper, we focus on the problem from the feature selection perspective, assuming that some of the collected features may be unrepresentative and affect the imputation results, leading in turn to degradation of the final performance of the classifiers when compared with the ones where feature selection is performed.
For the experiments, five different medical domain datasets containing various numbers of feature dimensions are used. In addition, three different types of feature selection methods are compared, namely information gain (IG) as the filter method, genetic algorithm (GA) as the wrapper method, and decision tree (DT) as the embedded method. For missing value imputation, the multilayer perceptron (MLP) neural network, k-nearest neighbor (KNN), and support vector machine (SVM) models are constructed individually.
The experimental results show that the combination of feature selection and imputation can make the classifier (i.e., SVM) perform better than the baseline classifier without feature selection for many datasets with different missing rates. For lower dimensional datasets, using GA and IG for feature selection is recommended, whereas DT is a better choice for higher dimensional datasets.
Some issues should be considered in future research work. First, other missingness mechanisms, including MAR and MNAR, can be investigated for the feature selection effect. In addition, some datasets that naturally have specific numbers of missing data (i.e., specific missing rates) can be used. On the other hand, some other differences among the datasets that could influence the results can also be used, for example binary or multiple differences, or even the difficulty in classification where the datasets contain much higher dimensions or larger numbers of instances and classes. Second, in performing feature selection and missing value imputation, the major limitation is that a number of observed data (i.e., D_complete) must be provided for the feature selection methods to select some representative features and imputation models to produce estimations to replace the missing values. Therefore, the effect of using different numbers of observed data on the feature selection and imputation results should be investigated. On the other hand, for datasets that do not contain a sufficient number of complete data samples, the over-sampling techniques [46,47] used to create synthetic samples can be employed. Lastly, very high dimensional datasets in specific domain problems containing several hundreds of thousands of dimensions, such as text and sensor array data, should be further investigated to assess the level of impact of performing feature selection over very high dimensional incomplete datasets.

Author Contributions

Conceptualization, C.-H.L. and M.-W.H.; methodology, C.-H.L. and C.-F.T.; software, K.-L.S.; validation, C.-H.L., C.-F.T., K.-L.S., and M.-W.H.; formal analysis, C.-H.L., C.-F.T., K.-L.S., and M.-W.H.; resources, K.-L.S.; data curation, C.-F.T.; writing—original draft preparation, C.-H.L., C.-F.T., K.-L.S., and M.-W.H.; writing—review and editing, M.-W.H.; visualization, X.X.; supervision, M.-W.H.; project administration, M.-W.H.; funding acquisition, C.-F.T. All authors have read and agreed to the published version of the manuscript.

Funding

The work was supported by the Ministry of Science and Technology (MOST) of Taiwan under grant MOST 103-2410-H-008-034-MY2.

Conflicts of Interest

The authors declare no conflict of interest.

References

  1. Van der Heijden, G.J.M.G.; Donders, A.R.T.; Stijnen, T.; Moons, K.G.M. Imputation of missing values is superior to complete case analysis and the missing-indicator method in multivariable diagnostic research: A clinical example. J. Clin. Epidemiol. 2006, 59, 1102–1109. [Google Scholar] [CrossRef]
  2. Troyanskaya, O.; Cantor, M.; Sherlock, G.; Brown, P.; Hastie, T.; Tibshirani, R.; Botstein, D.; Altman, R.B. Missing value estimation methods for DNA microarrays. Bioinformatics 2001, 17, 520–525. [Google Scholar] [CrossRef] [Green Version]
  3. Armitage, E.G.; Godzien, J.; Alonso-Herranz, V.; Lopez-Gonzalvez, A.; Barbas, C. Missing value imputation strategies for metabolomics data. Electrophoresis 2015, 36, 3050–3060. [Google Scholar] [CrossRef]
  4. Shah, A.D.; Bartlett, J.W.; Carpenter, J.; Nicholas, O.; Hemingway, H. Comparison of random forest and parametric imputation models for imputing missing data using MICE: A caliber study. Am. J. Epidemiol. 2014, 179, 764–774. [Google Scholar] [CrossRef] [Green Version]
  5. Liao, S.; Lin, Y.; Kang, D.D.; Chandra, D.; Bon, J.; Kaminski, N.; Sciurba, F.C.; Tseng, G.C. Missing value imputation in high-dimensional phenomic data: Imputable or not, and how? BMC Bioinform. 2014, 15, 346. [Google Scholar] [CrossRef] [Green Version]
  6. Ispirova, G.; Eftimov, T.; Korosec, P.; Seljak, B.K. MIGHT: Statistical methodology for missing-data imputation in food composition databases. Appl. Sci. 2019, 9, 4111. [Google Scholar] [CrossRef] [Green Version]
  7. Choi, Y.-Y.; Shon, H.; Byon, Y.-J.; Kim, D.-K.; Kang, S. Enhanced application of principal component analysis in machine learning for imputation missing traffic data. Appl. Sci. 2019, 9, 2149. [Google Scholar] [CrossRef] [Green Version]
  8. Stekhoven, D.J.; Buhlmann, P. Missforest-non-parametric missing value imputation for mixed-type data. Bioinformatics 2012, 28, 112–118. [Google Scholar] [CrossRef] [Green Version]
  9. Rubin, D.B.; Little, R.J.A. Statistical Analysis with Missing Data, 2nd ed.; Wiley: Hoboken, NJ, USA, 2002. [Google Scholar]
  10. Enders, C.K. Applied Missing Data Analysis; Guildford Press: New York, NY, USA, 2010. [Google Scholar]
  11. Garcia-Laencina, P.J.; Sancho-Gomez, J.-L.; Figueiras-Vidal, A.R. Pattern classification with missing data: A review. Neural Comput. Appl. 2010, 19, 263–282. [Google Scholar] [CrossRef]
  12. Tsikriktsis, N. A review of techniques for treating missing data in OM survey research. J. Oper. Manag. 2005, 24, 53–62. [Google Scholar] [CrossRef]
  13. Olinsky, A.; Chen, S.; Harlow, L. The comparative efficacy of imputation methods for missing data in structural equation modeling. Eur. J. Oper. Res. 2003, 151, 53–79. [Google Scholar] [CrossRef]
  14. Conroy, B.; Eshelman, L.; Potes, C.; Xu-Wilson, M. A dynamic ensemble approach to robust classification in the presence of missing data. Mach. Learn. 2016, 102, 443–463. [Google Scholar] [CrossRef] [Green Version]
  15. Pan, R.; Yang, T.; Cao, J.; Lu, K.; Zhang, Z. Missing data imputation by K nearest neighbours based on grey relational structure and mutual information. Appl. Intell. 2015, 43, 614–632. [Google Scholar] [CrossRef]
  16. Silva-Ramirez, E.-L.; Pino-Mejias, R.; Lopez-Coello, M. Single imputation with multilayer perceptron and multiple imputation combining multilayer perceptron and k-nearest neighbours for monotone patterns. Appl. Soft Comput. 2015, 29, 65–74. [Google Scholar] [CrossRef]
  17. Valdiviezo, H.C.; Aelst, S.V. Tree-based prediction on incomplete data using imputation or surrogate decisions. Inf. Sci. 2015, 311, 163–181. [Google Scholar] [CrossRef]
  18. Bertsimas, D.; Pawlowski, C.; Zhuo, Y.D. From predictive methods to missing data imputation: An optimization approach. J. Mach. Learn. Res. 2018, 18, 1–39. [Google Scholar]
  19. Raja, P.S.; Thangavel, K. Missing value imputation using unsupervised machine learning techniques. Soft Comput. 2020, 24, 4361–4392. [Google Scholar] [CrossRef]
  20. Hastie, T.; Tibshirani, R.; Friedman, J. The Elements of Statistical Learning; Springer: New York, NY, USA, 2001. [Google Scholar]
  21. Doquire, G.; Verleysen, M. Feature selection with missing data using mutual information estimators. Neurocomputing 2002, 90, 3–11. [Google Scholar] [CrossRef]
  22. Hapfelmeier, A.; Ulm, K. Variable selection by random forests using data with missing values. Comput. Stat. Data Anal. 2014, 80, 129–139. [Google Scholar] [CrossRef] [Green Version]
  23. Guyon, I.; Elisseeff, A. An introduction to variable and feature selection. J. Mach. Learn. Res. 2003, 3, 1157–1182. [Google Scholar]
  24. Schafer, J.L.; Graham, J.W. Missing data: Our view of the state of the art. Psychol. Methods 2002, 7, 147–177. [Google Scholar] [CrossRef]
  25. Zhu, X.; Zhang, S.; Jin, Z.; Zhang, Z.; Xu, Z. Missing value estimation for mixed-attribute data sets. IEEE Trans. Knowl. Data Eng. 2011, 23, 110–121. [Google Scholar] [CrossRef]
  26. Lin, W.-C.; Tsai, C.-F. Missing value imputation: A review and analysis of the literature (2006–2017). Artif. Intell. Rev. 2020, 53, 1487–1509. [Google Scholar] [CrossRef]
  27. Wong, M.L.; Guo, Y.Y. Learning Bayesian networks from incomplete databases using a novel evolutionary algorithm. Decis. Support Syst. 2008, 45, 368–383. [Google Scholar] [CrossRef]
  28. Zhang, S.; Qin, Z.; Ling, C.X.; Sheng, S. “Missing is useful”: Missing values in cost-sensitive decision trees. IEEE Trans. Knowl. Data Eng. 2005, 17, 1689–1693. [Google Scholar] [CrossRef]
  29. Batista, G.; Monard, M. An analysis of four missing data treatment methods for supervised learning. Appl. Artif. Intell. 2003, 17, 519–533. [Google Scholar] [CrossRef]
  30. Zhang, S.; Li, X.; Zong, M.; Zhu, X.; Wang, R. Efficient kNN classification with different numbers of nearest neighbors. IEEE Trans. Neural Netw. Learn. Syst. 2018, 29, 1774–1785. [Google Scholar] [CrossRef]
  31. Pelckmans, K.; De Brabanter, J.; Suykens, J.A.K.; De Moor, B. Handling missing values in support vector machine classifiers. Neural Netw. 2005, 18, 684–692. [Google Scholar] [CrossRef]
  32. Allison, P.D. Missing Data—Quantitative Applications in the Social Sciences; SAGE Publications Inc.: New York, NY, USA, 2001. [Google Scholar]
  33. Tibshirani, R. Regression shrinkage and selection via the lasso. J. R. Stat. Soc. Ser. B Stat. Methodol. 1996, 58, 267–288. [Google Scholar] [CrossRef]
  34. Sabbe, N.; Thas, O.; Ottoy, J.-P. EMLasso: Logistic lasso with missing data. Stat. Med. 2013, 32, 3143–3157. [Google Scholar] [CrossRef]
  35. Liu, Y.; Wang, Y.; Feng, Y.; Wall, M.M. Variable selection and prediction with incomplete high-dimensional data. Ann. Appl. Stat. 2016, 10, 418–450. [Google Scholar] [CrossRef]
  36. Tang, J.; Alelyani, S.; Liu, H. Feature selection for classification—A review. In Data Classification Algorithms and Applications; Aggarwal, C.C., Ed.; Chapman and Hall/CRC: Boca Raton, FL, USA, 2014. [Google Scholar]
  37. Li, Y.; Li, T.; Liu, H. Recent advances in feature selection and its applications. Knowl. Inf. Syst. 2017, 53, 551–577. [Google Scholar] [CrossRef]
  38. De la lglesia, B. Evolutionary computation for feature selection in classification problems. Wiley Interdiscip. Rev. Data Min. Knowl. Discov. 2013, 3, 381–407. [Google Scholar] [CrossRef]
  39. Xue, B.; Zhang, M.; Browne, W.N.; Yao, X. A survey on evolutionary computation approaches to feature selection. IEEE Trans. Evol. Comput. 2016, 20, 606–626. [Google Scholar] [CrossRef] [Green Version]
  40. Zhao, Z.; Liu, H. Spectral feature selection for supervised and unsupervised learning. In Proceedings of the International Conference on Machine Learning, Corvallis, OR, USA, 20–24 June 2007; pp. 1151–1157. [Google Scholar]
  41. Zhu, X.; Zhang, S.; Hu, R.; Zhu, Y.; Song, J. Local and global structure preservation for robust unsupervised spectral feature selection. IEEE Trans. Knowl. Data Eng. 2018, 30, 517–529. [Google Scholar] [CrossRef]
  42. Bradley, P.; Mangasarian, O.L. Feature selection via concave minimization and support vector machines. In Proceedings of the International Conference on Machine Learning, Madison, WI, USA, 24–27 July 1998; pp. 82–90. [Google Scholar]
  43. Zhu, Z.; Ong, Y.-S.; Dash, M. Wrapper-filter feature selection algorithm using a memetic framework. IEEE Trans. Syst. Man Cybern. Part B Cybern. 2007, 37, 70–76. [Google Scholar] [CrossRef]
  44. Kohavi, R. A study of cross-validation and bootstrap for accuracy estimation and model selection. Int. Jt. Conf. Artif. Intell. 1995, 2, 1137–1143. [Google Scholar]
  45. Byun, H.; Lee, S.-W. A survey on pattern recognition applications of support vector machines. Int. J. Pattern Recognit. Artif. Intell. 2003, 17, 459–486. [Google Scholar] [CrossRef]
  46. Chawla, N.V.; Bowyer, K.W.; Hall, L.O.; Kegelmeyer, W.P. SMOTE: Synthetic minority over-sampling technique. J. Artif. Intell. Res. 2002, 16, 321–357. [Google Scholar] [CrossRef]
  47. Singh, B.; Toshniwal, D. MOWM-Multiple Overlapping Window Method for RBF based missing value prediction on big data. Expert Syst. Appl. 2019, 122, 303–318. [Google Scholar] [CrossRef]
Figure 1. The combined feature selection and missing value imputation process. D_complete and D_incomplete mean the compete and incomplete data samples in training dataset D. D_complete’ and D_incomplete’ mean the reduced feature set of the original D_complete and D_incomplete, respectively. D’ represents the reduced feature set of the original D without any missing value.
Applsci 10 02344 g001
Figure 2. The combined feature selection and missing value imputation process: DT+MLP, GA+MLP, and IG+MLP.
Applsci 10 02344 g002
Figure 3. The combined feature selection and missing value imputation process: DT+KNN, GA+KNN, and IG+KNN.
Applsci 10 02344 g003
Figure 4. The combined feature selection and missing value imputation process: DT+SVM, GA+SVM, IG+SVM.
Applsci 10 02344 g004
Table 1. Information for the five datasets.
Dataset No. of InstancesNo. of FeaturesNo. of Classes
Lymphography148184
Heart270132
SPECT (Single Proton Emission Computed Tomography)267222
Arrhythmia2382796
Breast Cancer56441172
Table 2. Classification results for the MLP imputation method.
Missing RatesDT+MLPGA+MLPIG+MLPMLP
Lymphography(77.43)
10%75.5376.2676.273.68
20%74.9573.9373.8572.87
30%75.2274.4974.1573.01
40%74.7573.0273.8673.17
50%74.0672.5471.9670.31
Heart(75.11)
10%77.2676.8977.8555.41
20%75.0475.9376.5955.56
30%75.7874.6776.355.41
40%73.774.5273.5655.56
50%73.4872.374.9655.41
SPECT(75.26)
10%64.5672.6271.6573.93
20%64.4772.5472.4874.52
30%65.1472.472.4873.78
40%65.0771.9471.5174.67
50%64.7472.0272.472.59
Table 3. Classification results for the KNN imputation method.
Missing RatesDT+KNNGA+KNNIG+KNNKNN
Lymphography(77.43)
10%75.8175.3274.8173.97
20%76.4973.5673.6173.11
30%74.9974.1474.2171.84
40%75.0473.3273.5472.16
50%74.8272.8772.0469.84
Heart(75.11)
10%77.8576.89 76.52 55.56
20%75.70 75.56 76.7455.56
30%75.33 75.93 76.0055.56
40%75.7074.37 75.48 56.00
50%74.00 73.41 74.1555.70
SPECT(75.26)
10%64.172.6271.6574.37
20%64.8572.4772.6173.78
30%65.1472.472.1873.33
40%64.9371.7971.1173.04
50%64.9772.3971.5673.63
Table 4. Classification results for the SVM imputation method.
Missing RatesDT+SVMGA+SVMIG+SVMSVM
Lymphography(77.43)
10%75.576.8975.9475.09
20%74.4175.7674.1674.48
30%76.0176.5274.773.35
40%75.5774.674.7674.45
50%75.0575.4573.669.95
Heart(75.11)
10%76.67 77.7077.11 55.70
20%75.93 76.96 77.1155.41
30%73.11 73.26 76.1556.00
40%72.96 67.41 75.0455.70
50%70.96 61.41 74.9655.70
SPECT(75.26)
10%64.3372.6271.573.78
20%64.9372.5571.8673.19
30%65.5172.6372.0273.48
40%64.8372.2470.9974.37
50%64.3772.3171.1172.89
Table 5. The numbers of selected features by DT, GA, and IG.
Original FeaturesDTGAIG
Lymphography 185714
Heart 137610
SPECT225718
Table 6. Classification results for the different methods.
DatasetsImputation Methods
DT+MLPGA+MLPIG+MLPMLP
Arrhythmia (38.27)29.3229.1329.1329.13
Breast Cancer (85.17)82.3181.6882.2982.39
DT+KNNGA+KNNIG+KNNKNN
Arrhythmia (38.27)29.3229.1329.1329.13
Breast Cancer (85.17)82.9583.5082.2982.39
DT+SVMGA+SVMIG+SVMSVM
Arrhythmia (38.27)29.3229.1329.1329.13
Breast Cancer (85.17)82.8283.3482.2982.39
Table 7. The numbers of selected features for DT, GA, and IG.
Original featuresDTGAIG
Arrhythmia2793070223
Breast Cancer117464794

