Article

Wireless-Based Identification and Model Updating of a Skewed Highway Bridge for Structural Health Monitoring

by
Leqia He
1,*,†,
Edwin Reynders
2,
Jaime H. García-Palacios
3,
Giuseppe Carlo Marano
1,
Bruno Briseghella
1 and
Guido De Roeck
2
1
Sustainable and Innovative Bridge Engineering Research Center, College of Civil Engineering, Fuzhou University, Fuzhou 350108, China
2
Structural Mechanics Section, University of Leuven (KU Leuven), 3001 Leuven, Belgium
3
Civil Engineering Department, Universidad Politécnica de Madrid, 28040 Madrid, Spain
*
Author to whom correspondence should be addressed.
Leqia He was Previously Research Associate at Structural Mechanics Section, University of Leuven (KU Leuven), 3001 Leuven, Belgium.
Appl. Sci. 2020, 10(7), 2347; https://doi.org/10.3390/app10072347
Submission received: 31 January 2020 / Revised: 19 March 2020 / Accepted: 23 March 2020 / Published: 29 March 2020
(This article belongs to the Special Issue Assessing and Extending the Service Life of Bridges)

Abstract

:
Vibration-based monitoring was performed on a short-span skewed highway bridge on the basis of wireless measurements. By means of operational modal analysis, highly accurate modal results (frequencies and mode shapes) were extracted by using a self-developed wireless acquisition system, for which the performance was verified in the field. In order to reproduce the experimental modal characteristics, a refined finite element model was manually tuned to reduce the idealization errors and then updated with the sensitivity method to reduce the parametric errors. It was found that to build a reliable Finite element (FE) model for application in structural health monitoring, the effects of superelevation and boundary conditions of a skewed bridge should be taken into account carefully.

1. Introduction

Structural health monitoring (SHM) aims at observation and interpretation of full-scale and long-term performance of civil infrastructures. As a subset of SHM, vibration-based monitoring focuses on the dynamic responses of structures [1]. Although vibration data have a broad application in diagnosis and prognosis of the structural condition, identified modal characteristics are of specific interest because they are reflective of structural mass, stiffness, and even damping mechanism, which are representative of the structural condition [2,3]. Therefore, in the past decades, vibration-based monitoring has rapidly grown into important academic research and the industrial application field. Among the development and applications of vibration-based monitoring, vibration-based damage assessment is of extreme importance due to the increasing costs of the maintenance of existing infrastructures and the catastrophic results of the structural failures [4,5,6].
A relatively large portion of vibration-based damage assessment methods is implemented by using a numerical model. By correlating the numerical model to the identified modal data of the real structures under the undamaged and damaged states, damage could be identified by the relative changes of the model parameters, such as the elemental or substructural stiffness [7]. However, for model-based damage assessment, real-world applications are sometimes prone to failure due to the inaccuracy of the numerical models, the measurement errors, and the associated numerical challenges to be addressed in solving the inverse problems [8,9,10].
The importance of the aforementioned problems has been gradually noticed and their solutions have been recently proposed both theoretically and practically [11,12,13,14,15]. First, the use of an accurate and highly reliable reference model has been emphasized by some researchers [16,17,18,19,20]. Errors of a Finite Element model can generally be classified into idealization error, discretization error, and parametric error. Although the last two kinds of errors can be significantly reduced by means of refined modelling and parametric model updating, the idealization errors can only be removed if appropriate modelling assumptions are introduced [21,22,23]. Especially, some dynamic characteristics of the bridges that are usually neglected during the design and construction stages should be investigated thoroughly, since the higher modes are typically more sensitive to the structural damage. Secondly, testing procedure, identification methods, and instrumentation require further improvement. Operational modal analysis (OMA) has arisen to be a viable technique to identify the modal parameters of structures under ambient conditions, i.e., wind and traffics, etc. [24,25]. Since no artificial excitation, such as drop weight or shakers are needed, the method is relatively more competitive and efficient compared to the traditional experimental technique. Moreover, bridges can still be in operation, as traffic needs not to be blocked during the tests. Nevertheless, the response signals of ambient vibrations are typically of a very small amplitude, which are easily polluted by measurement noises. Not only some advanced identification methods are required [26], but also the versatile testing technique and highly sensitive and reliable acquisition systems are important. In this regard, the combination of accelerometer and strain senor can contribute to derive very accurate modal curvature of bridges for damage assessment [27,28]. Moreover, the use of the novel wireless sensing system is advantageous in comparison to traditional cabled system for its quick deployment, easy configuration, and little interference, which helps to improve the spatial resolution of the experimental mode shapes [29,30].
Under a research project financed by the Spanish Ministry of Science and Innovation, a high-synchronous wireless sensing system has been developed for OMA [31]. Synchronization errors in wireless measurements are known to have a profound effect on the identified modal results. Although their influence on the identified frequencies and damping ratios is generally negligible, errors in the identified mode shapes can be significant due to the asynchronous data [32,33]. This article presents the results of OMA performed on a skewed highway bridge for in-field performance verification of the developed wireless sensors. A traditional wired system was used as the reference for comparison of the experimental results.
The intention of the experimental campaign was also to build a highly accurate reference model for long term performance evaluation of the structure. The dynamic behavior of the skewed concrete bridge has been investigated by many researchers in previous years. Nevertheless, further studies remain to be done on these kinds of bridges from the perspective of SHM [34,35]. A very good effort was made to study the compound effects of skew angle, superelevation, mesh refinement, and boundary conditions on the modal characteristics of skewed bridges [36]. By the current study, it is shown that superelevation and boundary conditions play an important role for deriving a reliable FE model of a short-span skewed highway bridge for its monitoring.

2. Operational Modal Analysis of a Skewed Highway Bridge

2.1. Bridge Description

The tested structure is a prestressed concrete box-girder bridge of a span of 16.4 m (see Figure 1). It is a part of the A-67 highway linking Venta de Banos and Santander, in Spain, known as “Viaducto sobre arroyo de Bustillo”. There are two parallel spans accommodating the traffic of the opposite directions, respectively. As shown in Figure 1, only the front span was tested. As shown in Figure 2, the cross section consists of two prefabricated box girders joined by the cast-in-situ deck slab. Each box girder is simply supported on neoprene bearing pads. Located on a curved path, the bridge is constructed with a superelevation of around 5%, which provides a transverse slope of 3 degrees. The width of the deck is 11.8 m and the skew angle is 14 degrees, as shown in Figure 3.

2.2. Operational Modal Analysis

In order to identify the experimental modes of the bridge, vibration measurements were performed on the structure under operational conditions. During the tests, one of the traffic lanes was closed to allow the sensor placement, while the other was still open (see Figure 1b). The excitation of the structure was mainly ambient, due to mild wind and traffic on both the tested and the adjacent spans. The tests were performed during the day time. The traffic was not very busy, but there was generally at least one vehicle passing over the tested bridge for each measurement duration. The passing vehicles included cars and even some heavy trucks, as shown in Figure 1b.
As shown in Figure 3, there were thirty-four measurement points in total, mostly on one of the traffic lanes. The points were aligned along the skew direction of the bridge in agreement to the bending direction, as suggested by the a priori finite element model built before the testing. Vertical accelerations of the bridge deck were recorded. Since the width of the bridge deck is of a similar magnitude as the span length, the dynamic behavior of the deck is expected to be close to that of a plate instead of a beam. In order to catch the torsion modes and the bending modes in the transversal cross-section, a node, labeled as No. 34, was placed on the other side of the bridge close to the side barrier where the traffics were open. The measurements had to be divided into several setups since the number of the points exceeded the number of the acquisition system channels. Three reference nodes, indicated by R1, R2, and R3, common to all the setups, served as the basis for combining the mode shapes identified from each individual setup.
The adopted measurement system was the wireless sensing system developed in the aforementioned project. Figure 4a shows one of the wireless units deployed during the measurements, to which four external piezoelectric (PCB) accelerometers were connected. In total, there were four wireless units, also known as the clients, installed in the experimental campaign. A self-developed graphical user interface of the wireless measuring system was operated from a laptop, which also acted as the acquisition server (see Figure 4b). All the functions of the system could be easily managed through the user interface, including data acquisition, wireless communication, and time synchronization among all the client units.
System identification was carried out by the stochastic subspace identification (SSI) algorithm, as implemented in the MACEC software package [37]. Data processing included the following steps: (1) reduction of the sampling rate of the wireless data from 3906 Hz to 100 Hz; (2) removal of the drift of the signal due to its DC components; (3) removal of the low-frequency noise through a high-pass filter with a cut-off frequency of 2 Hz. For the covariance-driven SSI algorithm, the algorithmic parameter i—half the number of block rows—is set to 180. The system identification is performed for the state-space systems sequentially in orders from 2 to 250. In the corresponding stabilization diagram, the stabilization criteria are: 1% for frequencies, 5% for damping ratios and 1% for Modal assurance criterion (MAC) of the mode shapes.
Two ambient vibration measurement campaigns were conducted on the bridge on 25–26 November 2009 and 2 February 2011, respectively. During the first test, a traditional wired acquisition system was used in order to obtain the operational modal results as the reference. The measurement periods were both ten minutes for the wired and the wireless systems. During the second test, the measurements were repeated with a ten-min and a fifteen-min period, respectively, for each setup of the wireless system. The corresponding experimental results were denoted by Wired, WL1, WL2, and WL3 in turn, as shown in Table 1. Seven modes were identified below 40 Hz by all the tests. Table 1 shows the identified natural frequencies, together with the relative difference between the wireless and the wired results. For WL1, the relative differences of the identified frequencies were quite low (<3.5% in absolute values). Whereas, for WL2 and WL3, the relative differences of the identified frequencies were much higher, especially for Mode No. 4 and Mode No. 5. The differences may be attributed to the changing ambient conditions between the first and the second tests, including excitation levels, temperature, and humidity. MAC values were also calculated between the wireless and wired results, which provided a measure of consistency or degree of linearity between the mode shape vectors [38]. Most of the MAC values were higher than 0.9. The results were plausible, since unity represents a perfect fit. The experimental mode shapes are plotted in Figure 5. Most of the mode shapes were found to be smooth and consistent. In addition, MAC values calculated between the results of WL2 and WL3 suggested that the differences in the mode shapes between the last two wireless measurements were usually very small.

3. FE Model Updating with Experimental Modal Data

3.1. Manual Tuning

A first refined finite element model was built by using the FE software ANSYS [39]. The box girders, deck slab, and side barriers were all simulated with three-dimensional tetrahedral solid elements, known as Solid-92. Material properties, as listed in Table 2, which are typical of prestressed concrete, were assigned to the model. In particular, a reduction factor was applied to the elasticity modulus (and the shear modulus) of the side barrier. On-site observation found that high uncertainty existed in the connectivity between side barriers and the bridge deck and those between adjacent side barrier assemblies, which varied among different locations. The fifteen percent reduction was assigned by assumption, since the exact stiffness contribution of the side barrier to the whole structure was difficult to be modeled accurately. Moreover, the supports were simply represented by rigid constraints and the transverse slope of the bridge deck surface was neglected. See Figure 6a. In comparison to the experimental results, the numerical modal characteristics were not satisfactory for the initial model. First, as shown in Table 3, the relative difference of the natural frequencies was higher than 5% in absolute values for some modes. Secondly, one of the modes that was identified by the experiments was missed in the numerical prediction. Thirdly, a significant discrepancy could be found with respect to the cross-sectional deformation in the mode shape (see, for instance, Figure 7).
In order to improve the numerical results, the following aspects were considered in the manual tuning of the FE model: (1) the geometry of the FE model was re-built by taking into account the superelevation of around 5%; (2) the cast-in-situ close-ends of the box girder at each side were modeled; (3) the neoprene supports were simulated by means of springs (Element COMBIN-14), instead of rigid constraints. See Figure 6b. Material properties are however unchanged from the initial model. Table 3 lists the modal results of the initial and tuned FE models with comparison to their experimental counterparts. The manually tuned model provided better modal results as compared to the initial model. In particular, one of the identified modes that was missed (mode No. 4) was found by the tuned model. Moreover, with respect to the modal deflection of the transversal cross section, the numerical results of the tuned model were closer to the experimental results than those of the initial model (see Figure 7).

3.2. Sensitivity-Based FE Model Updating

A sensitivity-based FE model updating approach was applied to the tuned model in order to obtain more accurate numerical results. The updating process was formulated into a numerical optimization problem. It aimed at finding the best model parameters that minimizes the difference between the numerical and experimental modal data. Herein, the following nonlinear least-squares problem had to be solved:
θ * = arg min θ J ( θ ) = arg min θ ε z ( θ ) T W ε ε z ( θ ) = arg min θ i w ε , i ( ε z , i ( θ ) ) 2 ,
ε z denotes the residuals between the experimental and numerical modal data z. For the undamped eigenvalue z = λ , the residuals ε λ , i ( θ ) are given by
ε λ , i ( θ ) = λ i ( θ ) λ ˜ i λ ˜ i ,   for   λ i = ω i 2 = ( 2 π f i ) 2   and   i { 1 ,   2 ,   ,   n λ } ,
where the upper tilde denotes the experimental values and f (and w) stands for the (angular) natural frequency. For the mode shape z = Φ , the residuals ε Φ , i ( θ ) are given by
ε ϕ , i ( θ ) = Φ i ( θ ) Φ ˜ i Φ ˜ i 1 ,   for   i { 1 , 2 , , n ϕ } ,
where both the experimental and numerical mode shape vectors ( Φ ˜ i and Φ i ) are normalized to the maximum unity by considering only the real parts of Φ ˜ i . x 1 : = j | x j | is the sum of the absolute values of the vector x, according to the 1-norm. In Equation (1), W ε is the diagonal weighting matrix, which provides a means to balance the contributions from each individual residual. In detail, the following weighting factors were considered:
w ε λ , i = 1 ,   for   i { 1 ,   2 ,   ,   n λ }   and   w ε ϕ , i = 10 ,   for   i { 1 ,   2 ,   ,   n ϕ } ,
in order to provide a heavier weight for the mode shapes.
Equation (1) was solved by using the in-built MATLAB function “lsqnonlin”. It is a trust-region-reflective optimization algorithm, also known as the Levenberg-Marquardt method. The iterative process was terminated when a certain convergence criterion was satisfied, such as the relative change in θ being less than the specified tolerance.
A preliminary sensitivity study was performed in order to decide the design variables for model updating. The following definition of the parametric sensitivity was considered,
s ij = Δ ω i ω i × θ j Δ θ j ,
The chosen criterion of the maximum value of |Sij| > 5%, for each individual θj, led to the six parameters for updating, as shown in Table 4. In total, fourteen model parameters had been investigated. The others that were discarded for updating included the stiffness of the boundary springs in the longitudinal, lateral, and vertical directions, respectively (in total, six on one side of the bridge) and the elastic modulus of the close-ends of the two box girders, respectively.

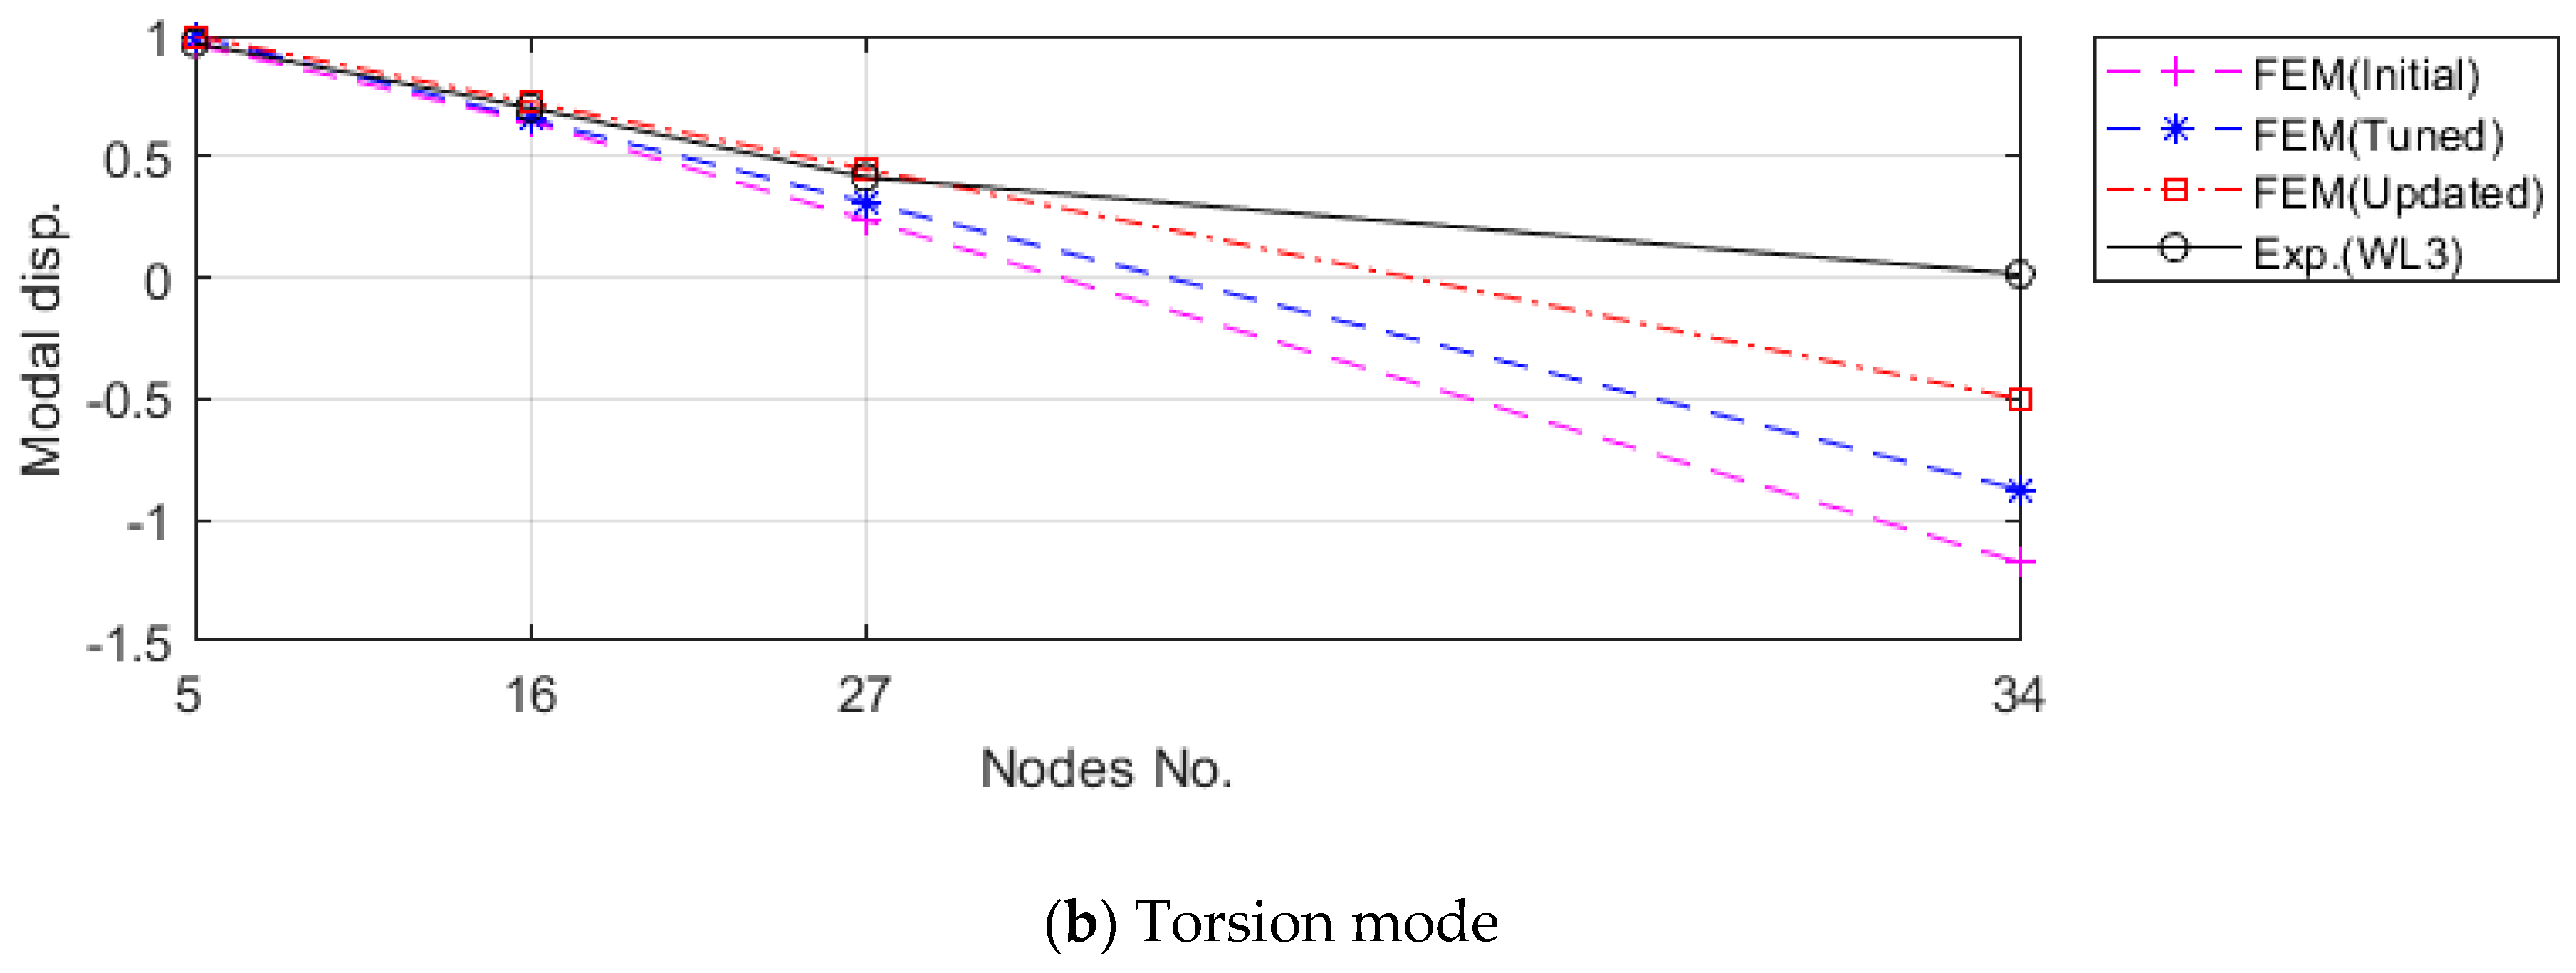
3.3. The Updating Results

Table 3 provides a summary of the numerical modal results compared with the experimental ones. It should be noted that the sensitivity-based parametric updating was also applied to the initial model, but without giving significant improvements in the modal results. As mentioned previously, in comparison to the initial model, the improvement of the manually tuned FE model was significant both in terms of the relative differences of natural frequencies and the MAC values, with the exception of the last mode. It was concluded that the modelling errors due to simplification or idealization from the assumptions, such as those related to the superelevation and boundary conditions, could only be reduced by improvement of the FE model, instead of the parametric updating. It suggested that superelevation and the corresponding transverse slope, even of a small degree, may have a profound influence on the dynamics of the short-span skewed bridge.
The sensitivity-based model updating procedure led to the more satisfactory modal outcomes in reference to the experimental modal results. The absolute value of Δf, averaged over six modes excluding Mode 4, is 3.6%, 1.5%, and 1.4% for the initial model, tuned model, and updated model, respectively. The absolute value of Δf, averaged over seven modes, is 1.4% and 1.3% for the tuned model and updated model, respectively. Moreover, the MAC value, averaged over six modes excluding Mode 4, is 0.85, 0.87, and 0.88 for the initial model, tuned model, and updated model, respectively. The MAC value, averaged over seven modes, is both 0.84 for the tuned model and updated model. Although the relative differences of frequencies and the MAC values were not so much different between the tuned and updated models, the improvement was more significant when the modal displacements of the transversal cross section were plotted. As shown in Figure 7, the updated FE model provided an even better match to the experimental results with respect to the cross-sectional deflection than the manually tuned model. It was speculated that the similar MAC values for the tuned and updated models were related to the fact that only one node (No. 34) was measured on the other side of the bridge. Therefore, improvement in the mode shapes, especially those related to the vertical bending in the transversal direction and torsion, were not evident by measure of the MAC values. Figure 5 provides the mode shape plots of the updated model in alignment with the identified experimental modal results. It was evident that most of the modes were associated with a significant cross-section deflection and deformation.
The initial and updated values of the updating parameters are given in Table 4. In agreement with on-site observations, the largest variation of the parameters was related to the side barriers, for the relatively high uncertainty. Increase of the stiffness and density was also identified on the slab, which should be attributed to the influence of neglecting the road pavements by the initial and manually tuned models. In general, the updated parameters were acceptable for their physical meanings.

4. Conclusions

In vibration-based structural health monitoring, the highly accurate reference model derived through the FE model updating plays an important role. In the current case study, OMA was performed on a short-span skewed highway bridge by using a self-developed wireless acquisition system. Very accurate modal data obtained under the operational condition of the structure provides a reliable measure of the healthy state of the bridge. A refined FE model, built of solid elements, was successfully updated in reference to the experimental modal data by means of both manual tuning and the sensitivity-based model updating approach. The profound effects of the superelevation and boundary conditions to the dynamics characteristics of the skewed bridge were highlighted in the current study. In particular, the importance to remove idealization errors before parametric model updating is verified in obtaining the accurate reference FE model.

Author Contributions

Conceptualization, methodology, L.H., E.R., J.H.G.-P. and G.D.R.; validation, formal analysis, L.H., E.R. and J.H.G.-P.; investigation, resources, data curation, writing—original draft preparation, L.H., E.R., J.H.G.-P., G.C.M. and B.B.; writing—review and editing, L.H., E.R., and G.D.R.; project administration, J.H.G.-P.; funding acquisition, J.H.G.-P. and G.D.R. All authors have read and agreed to the published version of the manuscript.

Funding

The financial supports from the Spanish Ministry of Science and Innovation, under Research Grant AMILCAR TEC2009-14595-C02-01 are acknowledged for the development of the wireless system and during the experimental campaign. Moreover, the first author needs to acknowledge the financial supports from the Fuzhou municipal city under the research project “2017-G-67” and those from the Fuzhou University under the research project “XRC—1675”.

Conflicts of Interest

The authors declare no conflicts of interest.

References

  1. Brownjohn, J.M.; De Stefano, A.; Xu, Y.L.; Wenzel, H.; Aktan, A.E. Vibration-based monitoring of civil infrastructure: Challenges and successes. J. Civ. Struct. Health Monit. 2011, 1, 79–95. [Google Scholar] [CrossRef]
  2. Doebling, S.W.; Farrar, C.R.; Prime, M.B. A summary review of vibration-based damage identification methods. Shock Vib. Dig. 1998, 30, 91–105. [Google Scholar] [CrossRef] [Green Version]
  3. Carden, E.P.; Fanning, P. Vibration based condition monitoring: A review. Struct. Health Monit. 2004, 3, 355–377. [Google Scholar] [CrossRef]
  4. Worden, K.; Friswell, M.I. Modal–Vibration-Based Damage Identification. In Encyclopedia of Structural Health Monitoring; Boller, C., Chang, F.-K., Fujino, Y., Eds.; John Wiley & Sons, Ltd.: Hoboken, NJ, USA, 2009; Chapter 11; ISBN 978-0-470-05822-0. [Google Scholar]
  5. Lynch, J.P.; Farrar, C.R.; Michaels, J.E. Structural health monitoring: Technological advances to practical implementations [scanning the issue]. Proc. IEEE 2016, 104, 1508–1512. [Google Scholar] [CrossRef]
  6. Di Bona, G.; Silvestri, A.; Forcina, A.; Petrillo, A. Total efficient risk priority number (TERPN): A new method for risk assessment. J. Risk Res. 2018, 21, 1384–1408. [Google Scholar] [CrossRef]
  7. Peeters, B.; De Roeck, G. One-year monitoring of the Z24-Bridge: Environmental effects versus damage events. Earthq. Eng. Struct. Dyn. 2001, 30, 149–171. [Google Scholar] [CrossRef]
  8. Friswell, M.I. Damage identification using inverse methods. Philos. Trans. R. Soc. A Math. Phys. Eng. Sci. 2007, 365, 393–410. [Google Scholar] [CrossRef]
  9. Farrar, C.R.; Worden, K. An introduction to structural health monitoring. Philos. Trans. R. Soc. A Math. Phys. Eng. Sci. 2007, 365, 303–315. [Google Scholar] [CrossRef]
  10. Turco, E. Tools for the numerical solution of inverse problems in structural mechanics: Review and research perspectives. Eur. J. Environ. Civ. Eng. 2017, 21, 509–554. [Google Scholar] [CrossRef]
  11. Perera, R.; Ruiz, A. A multistage FE updating procedure for damage identification in large-scale structures based on multiobjective evolutionary optimization. Mech. Syst. Signal Process. 2008, 22, 970–991. [Google Scholar] [CrossRef] [Green Version]
  12. Fang, S.E.; Perera, R.; De Roeck, G. Damage identification of a reinforced concrete frame by finite element model updating using damage parameterization. J. Sound Vib. 2008, 313, 544–559. [Google Scholar] [CrossRef] [Green Version]
  13. Simoen, E.; De Roeck, G.; Lombaert, G. Dealing with uncertainty in model updating for damage assessment: A review. Mech. Syst. Signal Process. 2015, 56, 123–149. [Google Scholar] [CrossRef] [Green Version]
  14. Reynders, E.; Maes, K.; Lombaert, G.; De Roeck, G. Uncertainty quantification in operational modal analysis with stochastic subspace identification: Validation and applications. Mech. Syst. Signal Process. 2016, 66, 13–30. [Google Scholar] [CrossRef]
  15. Shadan, F.; Khoshnoudian, F.; Esfandiari, A. A frequency response-based structural damage identification using model updating method. Struct. Control Health Monit. 2016, 23, 286–302. [Google Scholar] [CrossRef]
  16. Mosavi, A.A.; Sedarat, H.; O’Connor, S.M.; Emami-Naeini, A.; Lynch, J. Calibrating a high-fidelity finite element model of a highway bridge using a multi-variable sensitivity-based optimisation approach. Struct. Infrastruct. Eng. 2014, 10, 627–642. [Google Scholar] [CrossRef]
  17. Zordan, T.; Briseghella, B.; Liu, T. Finite element model updating of a tied-arch bridge using Douglas-Reid method and Rosenbrock optimization algorithm. J. Traffic Transp. Eng. (Engl. Ed.) 2014, 1, 280–292. [Google Scholar] [CrossRef] [Green Version]
  18. Liu, T.; Zhang, Q.; Zordan, T.; Briseghella, B. Finite element model updating of Canonica Bridge using experimental modal data and genetic algorithm. Struct. Eng. Int. 2016, 26, 27–36. [Google Scholar] [CrossRef]
  19. Fa, G.; He, L.; Fenu, L.; Mazzarolo, E.; Briseghella, B.; Zordan, T. Comparison of direct and iterative methods for model updating of a curved cable-stayed bridge using experimental modal data. In Proceedings of the IABSE Conference, Guangzhou, China, 8–11 May 2016; pp. 538–545. [Google Scholar]
  20. Bursi, O.S.; Kumar, A.; Abbiati, G.; Ceravolo, R. Identification, model updating, and validation of a steel twin deck curved cable-stayed footbridge. Comput. Aided Civ. Infrastruct. Eng. 2014, 29, 703–722. [Google Scholar] [CrossRef]
  21. Mottershead, J.E.; Link, M.; Friswell, M.I. The sensitivity method in finite element model updating: A tutorial. Mech. Syst. Signal Process. 2011, 25, 2275–2296. [Google Scholar] [CrossRef]
  22. Goulet, J.A.; Smith, I.F. Structural identification with systematic errors and unknown uncertainty dependencies. Comput. Struct. 2013, 128, 251–258. [Google Scholar] [CrossRef] [Green Version]
  23. Sehgal, S.; Kumar, H. Structural dynamic model updating techniques: A state of the art review. Arch. Comput. Methods Eng. 2016, 23, 515–533. [Google Scholar] [CrossRef]
  24. Peeters, B.; De Roeck, G. Reference-based stochastic subspace identification for output-only modal analysis. Mech. Syst. Signal Process. 1999, 13, 855–878. [Google Scholar] [CrossRef] [Green Version]
  25. Peeters, B.; De Roeck, G. Stochastic system identification for operational modal analysis: A review. J. Dyn. Sys. Meas. Control 2001, 123, 659–667. [Google Scholar] [CrossRef]
  26. Reynders, E. System identification methods for (operational) modal analysis: Review and comparison. Arch. Comput. Methods Eng. 2012, 19, 51–124. [Google Scholar] [CrossRef]
  27. Reynders, E.; Roeck, G.D.; Gundes Bakir, P.; Sauvage, C. Damage identification on the Tilff Bridge by vibration monitoring using optical fiber strain sensors. J. Eng. Mech. 2007, 133, 185–193. [Google Scholar] [CrossRef]
  28. Rauert, T.; Feldmann, M.; He, L.; De Roeck, G. Calculation of bridge deformations due to train passages by the use of strain and acceleration measurements from bridge monitoring supported by experimental tests. Proc. EURODYN 2011, 2011, 1149–1155. [Google Scholar]
  29. He, L.; Qin, S.; Bui, T.T.; Reynders, E.; Cuadrado, M.; Museros, P.; De Roeck, G. Operational modal analysis of a high-speed railway bridge: The Jalon viaduct. In Proceedings of the ISMA2012-USD2012 conference, Leuven, Belgium, 12–20 September 2012; pp. 1073–1088. [Google Scholar]
  30. Qin, S.; Reynders, E.; He, L.; Bui, T.; De Roeck, G. Effects of initial conditions in operational modal analysis. Struct. Control Health Monit. 2014, 21, 557–573. [Google Scholar] [CrossRef] [Green Version]
  31. Araujo, A.; García-Palacios, J.; Blesa, J.; Tirado, F.; Romero, E.; Samartín, A.; Nieto-Taladriz, O. Wireless measurement system for structural health monitoring with high time-synchronization accuracy. IEEE Trans. Instrum. Meas. 2011, 61, 801–810. [Google Scholar] [CrossRef] [Green Version]
  32. Lynch, J.P. An overview of wireless structural health monitoring for civil structures. Philos. Trans. R. Soc. A: Math. Phys. Eng. Sci. 2007, 365, 345–372. [Google Scholar] [CrossRef]
  33. Krishnamurthy, V.; Fowler, K.; Sazonov, E. The effect of time synchronization of wireless sensors on the modal analysis of structures. Smart Mater Struct. 2008, 17, 055018. [Google Scholar] [CrossRef]
  34. Whelan, M.J.; Gangone, M.V.; Janoyan, K.D.; Jha, R. Operational modal analysis of a multi-span skew bridge using real-time wireless sensor networks. J. Vib. Control 2011, 17, 1952–1963. [Google Scholar] [CrossRef]
  35. Omar, T.; Nehdi, M.L. Condition Assessment of Reinforced Concrete Bridges: Current Practice and Research Challenges. Infrastructures 2018, 3, 36. [Google Scholar] [CrossRef] [Green Version]
  36. Hardyniec, A.B. Dynamic Testing and Modeling of A Superelevated Skewed Highway Bridge. Master’s Thesis, Virginia Polytechnic Institute and State University, Blacksburg, VA, USA, 20 August 2009. [Google Scholar]
  37. Reynders, E.; Schevenels, M.; De Roeck, G. A MATLAB Toolbox for Experimental and Operational Modal Analysis; Report BWM-2014-06; KU Leuven: Leuven, Belgium, 2014; Available online: https://bwk.kuleuven.be/bwm/macec/macec.pdf (accessed on 26 March 2020).
  38. Allemang, R.J. The modal assurance criterion–twenty years of use and abuse. Sound Vib. 2003, 37, 14–23. [Google Scholar]
  39. ANSYS Inc. Robust Simulation and Analysis Software. Release 6.1. ANSYS Incorporated, 2003. Available online: http://www.ansys.com/ (accessed on 26 March 2020).
Figure 1. The skewed highway bridge: (a) Side view; (b) front view (during the measurements).
Applsci 10 02347 g001
Figure 2. Cross section B1-B1 of the bridge, as indicated in Figure 3 (units in meters).
Applsci 10 02347 g002
Figure 3. The measurement nodes on the bridge deck, labeled from No. 1 to No. 34, in which the reference ones are denoted by R (units in meters).
Applsci 10 02347 g003
Figure 4. The wireless sensing system: (a) One of the client units; (b) server.
Applsci 10 02347 g004
Figure 5. Comparison of the experimental and numerical mode shapes: (a) those of the updated FE model (n3); (b) those of the identified results (WL3).
Applsci 10 02347 g005aApplsci 10 02347 g005bApplsci 10 02347 g005c
Figure 6. FE models built with 3D solid elements: (a) the initial model; (b) the manually tuned model.
Applsci 10 02347 g006
Figure 7. Plot of the vertical modal displacements along the transversal cross section. Note: The modal displacements are normalized to the maximum unity for the first thirty-three nodes.
Applsci 10 02347 g007aApplsci 10 02347 g007b
Table 1. Experimental modes as identified from the measurements.
ModeWiredWL1WL2WL3
No.fw [Hz]fwl1 [Hz]Δfwl1 [%]fwl2 [Hz]Δfwl2 [%]fwl3 [Hz]Δfwl3 [%]MAC
17.417.491.17.420.17.541.80.98
28.048.33.28.03−0.18.040.00.90
312.6712.4−2.113.244.513.083.20.97
417.1417.371.315.37−10.315.28−10.90.87
520.1319.96−0.822.1710.121.999.20.95
629.0529.180.429.320.929.240.70.96
736.0636.922.435.66−1.134.96−3.10.68
Note: Df = (fwl−fw)/fw; MAC values were calculated between Wired and WL2.
Table 2. Material properties of the initial FE model.
ComponentsE (MPa)nG (MPa)q (kg/m3)
Box Girder32,3730.213,4892500
Slab32,3730.213,4892500
Side Barriers16,1870.267452500
Note: E for modulus of elasticity, u for Poisson’s ratio, G for shear modulus and q for density.
Table 3. Comparison of the experimental and numerical modal results.
Exp. ModeNo.1234567
fwl3 [Hz]7.548.0413.0815.2821.9929.2434.96
Initial FE Modelfn1 [Hz]7.468.3612.29n/a21.4127.6434.23
Δf [%]−1.14.0−6.0n/a−2.6−5.5−2.1
MAC0.950.770.91n/a0.770.880.84
Manually Tuned FE Modelfn2 [Hz]7.487.9513.1415.1322.2328.8533.48
Δf [%]−0.8−1.10.5−1.01.1−1.3−4.2
MAC0.970.860.940.690.790.880.77
Updated FE Modelfn3 [Hz]7.757.9512.7015.1921.9729.5535.08
Δf [%]2.8−1.1−2.9−0.6−0.11.10.3
MAC0.970.930.900.640.800.870.80
Note: Df = (fn − fwl3)/fwl3; MAC values are calculated between the experimental and numerical modes.
Table 4. Values of the initial and updated parameters θ.
Box GirderSlabSide Barrier
Eb (MPa)q (kg/m3)Eb (MPa)q (kg/m3)Eb (MPa)q (kg/m3)
Initial32,3732,50032,3732,50016,1872,500
Updated33,0692,41835,3712,83518,2083,283
Δθ2%−3%9%13%12%31%
Note: Δ θ = ( θ updated θ initial ) / θ initial .

