Article

Finite Element Analysis of Reinforced Concrete Bridge Piers Including a Flexure-Shear Interaction Model

1
Department of Civil and Mechanical Engineering, University of Cassino and Southern Lazio, 03043 Cassino, Italy
2
Department of Architecture, Roma Tre University, Largo G. B. Marzi 10, 00153 Roma, Italy
3
College of Civil Engineering, Fuzhou University, Fuzhou 350108, China
*
Author to whom correspondence should be addressed.
Appl. Sci. 2020, 10(7), 2209; https://doi.org/10.3390/app10072209
Submission received: 31 January 2020 / Revised: 25 February 2020 / Accepted: 11 March 2020 / Published: 25 March 2020
(This article belongs to the Special Issue Assessing and Extending the Service Life of Bridges)

Abstract

:
This paper discusses the seismic behavior of reinforced concrete (RC) bridge structures, focusing on the shear–flexure interaction phenomena. The assessment of reinforced concrete bridges under seismic action needs the ability to model the effective non-linear response in order to identify the relevant failure modes of the structure. Existing RC bridges have been conceived according to old engineering practices and codes, lacking the implementation of capacity design principles, and therefore can exhibit premature shear failures with a reduction of available strength and ductility. In particular, recent studies have shown that the shear strength can decrease with the increase of flexural damage after the development of plastic hinges and, in some cases, this can cause unexpected shear failures in the plastic branch with a consequent reduction of ductility. The aim of the research is to implement those phenomena in a finite-element analysis. The proposed model consists of a flexure fiber element coupled with a shear and a rotational slip spring. The model has been implemented in the OpenSEES framework and calibrated against experimental data, showing a good ability to capture the overall response.

1. Introduction

Damage due to earthquakes can have a significant impact on transportation networks, in particular on bridges that represent the weakest component of those networks. Structural and non-structural damage in bridges can, indeed, produce significant losses both in terms of a prolonged traffic disruption and in terms of the repairs required for assure again the viability of the damaged bridges [1,2]. In order to prevent those nefarious outcomes, in recent decades, great effort has been made for the assessment of the seismic vulnerability of bridges, specifically on reinforced concrete (RC) bridges constructed before the adoption modern seismic codes.
Modern bridge structures are able to resist the seismic action with a response that assures high levels of dissipation of energy thanks to an inelastic behavior characterized by large ductile deformation cycles. To achieve this performance objective, modern design codes have implemented in their provisions plastic design principles aimed at preventing the activation of brittle damage mechanisms.
On the other hand, existing bridge structures have been designed when many sites were not classified as seismically prone and adopting older construction standards, relying on the admissible stress method, with levels of seismic demand (if any) much lower than the ones currently adopted. Therefore, the resulting structures where conceived to respond in the elastic range, leaving a false sense of security that the actual resistances (well beyond the nominal ones considered in the design process) would be assured by the adopted safety coefficients and by the inelastic behavior of materials and structures. On the contrary, the lack of a hierarchy of strengths that would be lately assured by the implementation, in modern codes, of capacity design principles, would not prevent the occurrence of non-ductile failure modes reducing the extent of the inelastic response [3,4,5,6].
A typical characteristic of existing bridge piers is the presence of a low percentage of transversal reinforcement, usually represented by poorly detailed and highly spaced stirrups, that would be considered substandard according the construction practice adopted today [7].
According to the experimental evidence, structures with such a characteristic can show a premature shear failure, limiting the capacity to undergo inelastic deformation and therefore dissipate energy. In fact, several researches and studies on shear strength have evidenced that, even in the case those piers have been initially designed with nominal shear capacity exceeding the shear in equilibrium with flexural yielding, those piers could still fail early in shear due to the detrimental action of inelastic flexural deformations on the shear strength [8,9].
Indeed, the widening of flexural–shear cracks due to cyclic inelastic deformations, especially in the plastic-hinge region, reduce the ability of concrete to transfer the shear action through mechanisms relying on aggregate interlock. As a consequence, there is a sectional shear capacity reduction, showing that under cyclic loading the shear strength of columns can be heavily dependent on the inelastic deformations and that shear strength degrades with ductility more quickly than flexural strength. Thus, it is important, when assessing the seismic response of existing structures to take into consideration in the numerical model the insurgence of those complex interaction phenomena affecting the overall response of the bridge structures.
In past decades different attempts have been made to propose computational models able to couple flexural and shear effects. Those models offer a huge variety of solutions depending on the complexity and the sophistication of the numerical procedure adopted to represent the physical problem, from a relatively simple approach in which a translational spring, representing the shear behavior, is added [10,11,12] to frame models where sophisticated, multi-dimensional, constitutive laws are employed [13,14,15,16,17].

2. Objectives and Methods

The present study aims at contributing to the modelling capability of RC bridge elements under seismic loading. To pursue this objective, a simple phenomenological model has been presented, considering the most relevant damage modes of existing RC bridge elements. Particular emphasis in the development of the model has been given to the study of the shear-flexure interaction, that is deemed a pivotal issue for the assessment of existing RC piers. The available formulations, contained either in recent codes of practice or in research documents, have been discussed. Those models are generally calibrated on empirical tests. A database of experimental tests on specimens characterized by mechanical and reinforcing properties typical of substandard bridge element has been retrieved in order to test the validity of the proposed model.

3. Numerical Model

3.1. Model Outline

In this research the seismic response of a RC bridge pier is studied through a numerical model based on a three-component approach, in which the following coexisting behavioral mechanisms are accounted for: flexure, shear and bonding. As schematically depicted in Figure 1, the lateral displacement of a cantilever bridge pier can, indeed, be idealized as the sum of those three components.
Flexure is by far the most relevant aspect in determining the seismic response of a bridge pier and it is also the most investigated.
The bonding is essentially responsible for the additional displacement due to the slippage of the longitudinal reinforcing bars in the anchoring concrete. In most cases this phenomenon can be represented as a fixed-end rotation of the pier due to the strain penetration carried by the steel bars anchoring into the foundation concrete. This additional displacement can also account for the possible extra effects due to reinforcement interruption (due to limitations in steel bar lengths or to concrete casting performed in stages) and consequent need to splicing the reinforcement by overlapping the bars.
Finally, regarding shear deformation, in general it is admitted that in slender columns the contribution of the shear flexibility on the total displacement can be neglected: it starts to have a significant effect only on squat elements with a low height-to-depth ratio. However, it becomes relevant in any case, if the element is expected to be damaged in shear.
The proposed computational model has been developed using the finite element method within the OpenSEES framework for seismic analysis [18]. Specifically, a two dimensional (2D) nonlinear finite element model has been employed, by means of a three-component model, in which the three aforementioned deformability contributions (flexure, shear, and slip) are separately considered and modelled.
As illustrated in Figure 2, a fiber-based, nonlinear beam-column element has been connected at each end of the column together with a zero-length rotational spring to account for the bond-slip behavior and a zero-length translational spring to account for the shear behavior. Since the element is loaded only at the ends (no distributed loads are applied along the element length and no competent mass is assigned to the element during a dynamic analysis) the shear internal force is constant, so that just one translational spring is sufficient for the shear behavior. In the case of a typical bridge pier cantilever schematization, the rotational and translational springs should be added just to the fixed end.

3.2. Flexural Behavior

The flexural behavior has been modelled with a distributed plasticity approach using a nonlinear force-based beam-column element, with a fiber discretization of the section.
The peculiarity of a finite element with a force formulation is that it employs force shape functions (derived by equilibrium considerations) to obtain the internal forces (at section level) once the external forces acting at the nodes of the element are known.
The vantage of that approach is that, provided no loads are applied along the element length, just one element can be sufficient to capture the bending behavior of the whole cantilevered pier, despite the fact that the formation of plastic hinges at the fixed end of the element will produce a concentration of non-linear curvatures.
The overall response of the element is obtained through the integration of the non-linear responses obtained over the different sections of the element. In practice, the integral is substituted by a weighted summation adopting some numerical integration scheme over a certain number of monitored sections. In our case, a Gauss–Lobatto 5 node scheme was adopted.
In order to analyze the non-linear response of the element cross-sections, those have been discretized in fibers, as depicted in Figure 3a. Since a reinforced concrete element is essentially composed by two different materials, namely casted in place concrete and steel reinforcing bar, two different kinds of constitutive relationship are used to describe the mechanical behavior of those materials, and assigned to relevant fibers within the element sections.
The longitudinal steel reinforcement has been modelled by the Menegotto and Pinto [19] constitutive law (Steel02 uniaxial material in OpenSEES). With reference to Figure 3b fy and εy are, respectively, the yield strength and strain of the reinforcement whilst E0 is the elastic modulus and bo an adimensional parameter accounting for post-yield stiffening.
The concrete has been modelled in OpenSEES using the Concrete04 uniaxial material which is based on the Popovics law [20]. The concrete on the section cover has been considered unconfined, whilst the concrete in the section core has been considered as confined, using the Mander et al. model [21]. With reference to Figure 3c, fco and fcc are, respectively, the strength of unconfined and confined concrete, whilst εco and εcc are the corresponding strains.

3.3. Slipage Behavior

The slippage of the reinforcing bars will cause rigid-body rotation of the column, that produces an additional source of the deformation, that can be significant.
Several bond slip models are available in literature for deformed bars [22,23,24,25].
In order to account for the slippage in the numerical model, a rotational slip springs at the bottom of the element with linear constitutive relationship was used and its stiffness is given by [26]:
K s l i p = 8 u E I e f f f y ϕ l o n g
where ϕlong is the diameter of longitudinal rebar, fy is the yield strength of longitudinal rebar, u is the average tension on the surface between the longitudinal reinforcement and the concrete that can be calculated as 0.5 f c where f’c is the concrete compressive strength and EIeff is the effective stiffness that can be evaluated by [27]:
{ E I e f f = 0.2 E I i f   0.2 P A g f c E I e f f = E I ( 5 3 P A g f c 40 30 ) i f   0.2 P A g f c 0.5 E I e f f = 0.7 E I i f   0.5 P A g f c
where P is axial load, Ag is gross area of section, E is the Young’s module of the concrete and I is the section inertia moment (bh3/12).

3.4. Shear Behavior

In the past, different shear-capacity models have been proposed to account for the flexure-shear coupling, leading to the strength degradation of columns with deformation.
The first one was the formulation codified in the ATC seismic design guidelines, where a shear-capacity curve degrading with displacement ductility was proposed (Figure 4).
In this study the phenomenological model illustrated in Figure 5 has been adopted for modelling the shear spring, accounting for both strength and deformation components due to shear action.
As shown in Figure 5, the first two branches represent the backbone behavior of the shear component of the element before the intersection with the shear strength domain (marked with a red circle) and the start of the degrading branch.
The pre-cracking shear stiffness KS,uncracked can be calculated through the elasticity theory:
K S , u n c r a k e d = G A v H
G = E c 2 ( 1 + ν ) 0.4 E c
where H is the column height, G, Ec, and ν are respectively the shear, Young’s, and Poisson’s moduli of concrete, and Av is the shear effective area of the column.
In general, this stiffness is contributing to a minor displacement increase, since even in squat elements the flexural stiffness is significantly smaller, but it can be useful to modify the fiber element formulated within OpenSEES as an Euler-Bernoulli beam-column to a full Timoshenko element.
The post-cracking shear stiffness KS,cracked can be calculated considering the deformation of transversal steel through the diagonal cracks. Park and Paulay [27] proposed an equivalent strut-model:
K S , c r a k e d = ρ w s i n 4 ( θ ) c o t 2 ( θ ) s i n 4 ( θ ) + 10 ρ w E s A v
where ρw is the transversal steel reinforcement ratio, θ is the angle between the diagonal cracks and the member axis and Es is the Young’s modulus of steel.
In Figure 5 the shear-strength domain represents the maximum shear that the column can sustain. As it is evident, that limit state curve is not constant, as in the usual formulation contained in most design codes (like Eurocode 2 or ACI-318), but is dependent with the displacement and the element once reached the maximum strength, will follow the degrading branch.
In the literature, there are several shear-capacity models that have been proposed to account for the shear-strength degradation of columns under seismic loading [9,28,29,30]. It is worth noting that all the aforementioned formulations are defined in terms of total displacement (i.e., the sum of single displacement components) so that the shear-strength domain has been placed in Figure 5 (where the displacement is defined just in terms of shear deformations) only for illustration purposes.
As shown in Figure 3, the failure is activated when the shear capacity curve (bold black dash line) intercept the shear demand curve (black line) which represent the global behavior of the column gives by the summation of the flexure, slippage and shear behaviors.
In the Sezen and Moehle [9] model, the nominal shear strength is given as the summation of the contribution from concrete Vc and the transverse reinforcement Vs:
V n = V c + V s
where the concrete contribution can be calculated by:
V c = k ( 0.5 f c a d 1 + P 0.5 f c A g ) 0.8 A g   ( M P a )
while the steel contribution can be calculated by:
V s = k A w f y d s
where f′c is the compressive strength of concrete, Ag is gross area of section, P is the axial load, a is the shear span (distance between the maximum moment section to point of inflection), d is effective depth of the section, Aw is the transversal reinforcement area, fy is the yield strength of the transversal reinforcement. The factor k is the parameter which considers the variation of shear strength with the increase of displacement ductility and is defined to be equal to 1.0 for displacement ductility less than 2, to be equal to 0.7 for displacement ductility μΔ exceeding 6, and to vary linearly for intermediate displacement ductility, as shown in Figure 6.
In the Biskinis et al. model [28] the nominal shear strength is calculated as the summation of three contribution from concrete Vc, transversal reinforcement Vs and axial load VP:
V n = V c + V s + V P
where the concrete contribution is given by:
V c = k [ 0.16 m a x ( 0.5 ; 100 ρ t o t ) ( 1 0.16 m i n ( 5 ; a h ) ) f c A g ]
the transversal reinforcement contribution is given by Equation (8), as in the previous model, and the contribution of axial load is given by:
V P = h c 2 a min ( P ; 0.55 A g f c )
where ρtot is the total longitudinal reinforcement ratio, h is the depth of the section, and c is the neutral axis deepth.
The factor k is only function of the plastic part of the displacement ductility and is given by:
k = 1 0.05 · min ( 5 ; μ Δ p l )
where:
μ Δ p l = Δ Δ y Δ y = θ θ y θ y
where Δ and θ are respectively the displacement and rotation at the point considered while Δy and θy are respectively the yielding displacement and yielding rotation.
Similar to this model is the Kowalsky and Priestley model [30]. In fact, the nominal shear strength can be evaluated by the Equation (9) where the concrete contribution can be calculated by:
V c = α β γ f c ( 0.8 A g )
where the α factor is function of the ratio a/d, the β factor is function of the longitudinal steel ratio ρl, and the γ factor is function of the ductility curvature μχ, as shown in Figure 7, Figure 8 and Figure 9.
The transversal contribution is given by:
V s = A w f y ( d c δ ) s · cot θ
where δ is the concrete cover and s is the transverse reinforcement spacing. The axial load contribution is given by:
V P = { P h c 2   a   i f   P > 0 0    i f   P 0
Finally, the model by Elwood and Moehle [29] introduce a drift capacity model based on observations from the experimental database, it is different than previous model because it allows to evaluate the drift ratio at shear failure rather than the shear strength. The empirical equation is:
Δ s L = 3 100 + 4 ρ w 1 40 ν f c 1 40 P A g f c 1 100 ( M P a )
where Δs/L is the drift ratio at shear failure, Δs is the displacement where the shear degradation begin, L is the height of the column, ρw is the transverse reinforcement ratio and ν is the nominal shear stress (Vmax/Ag).

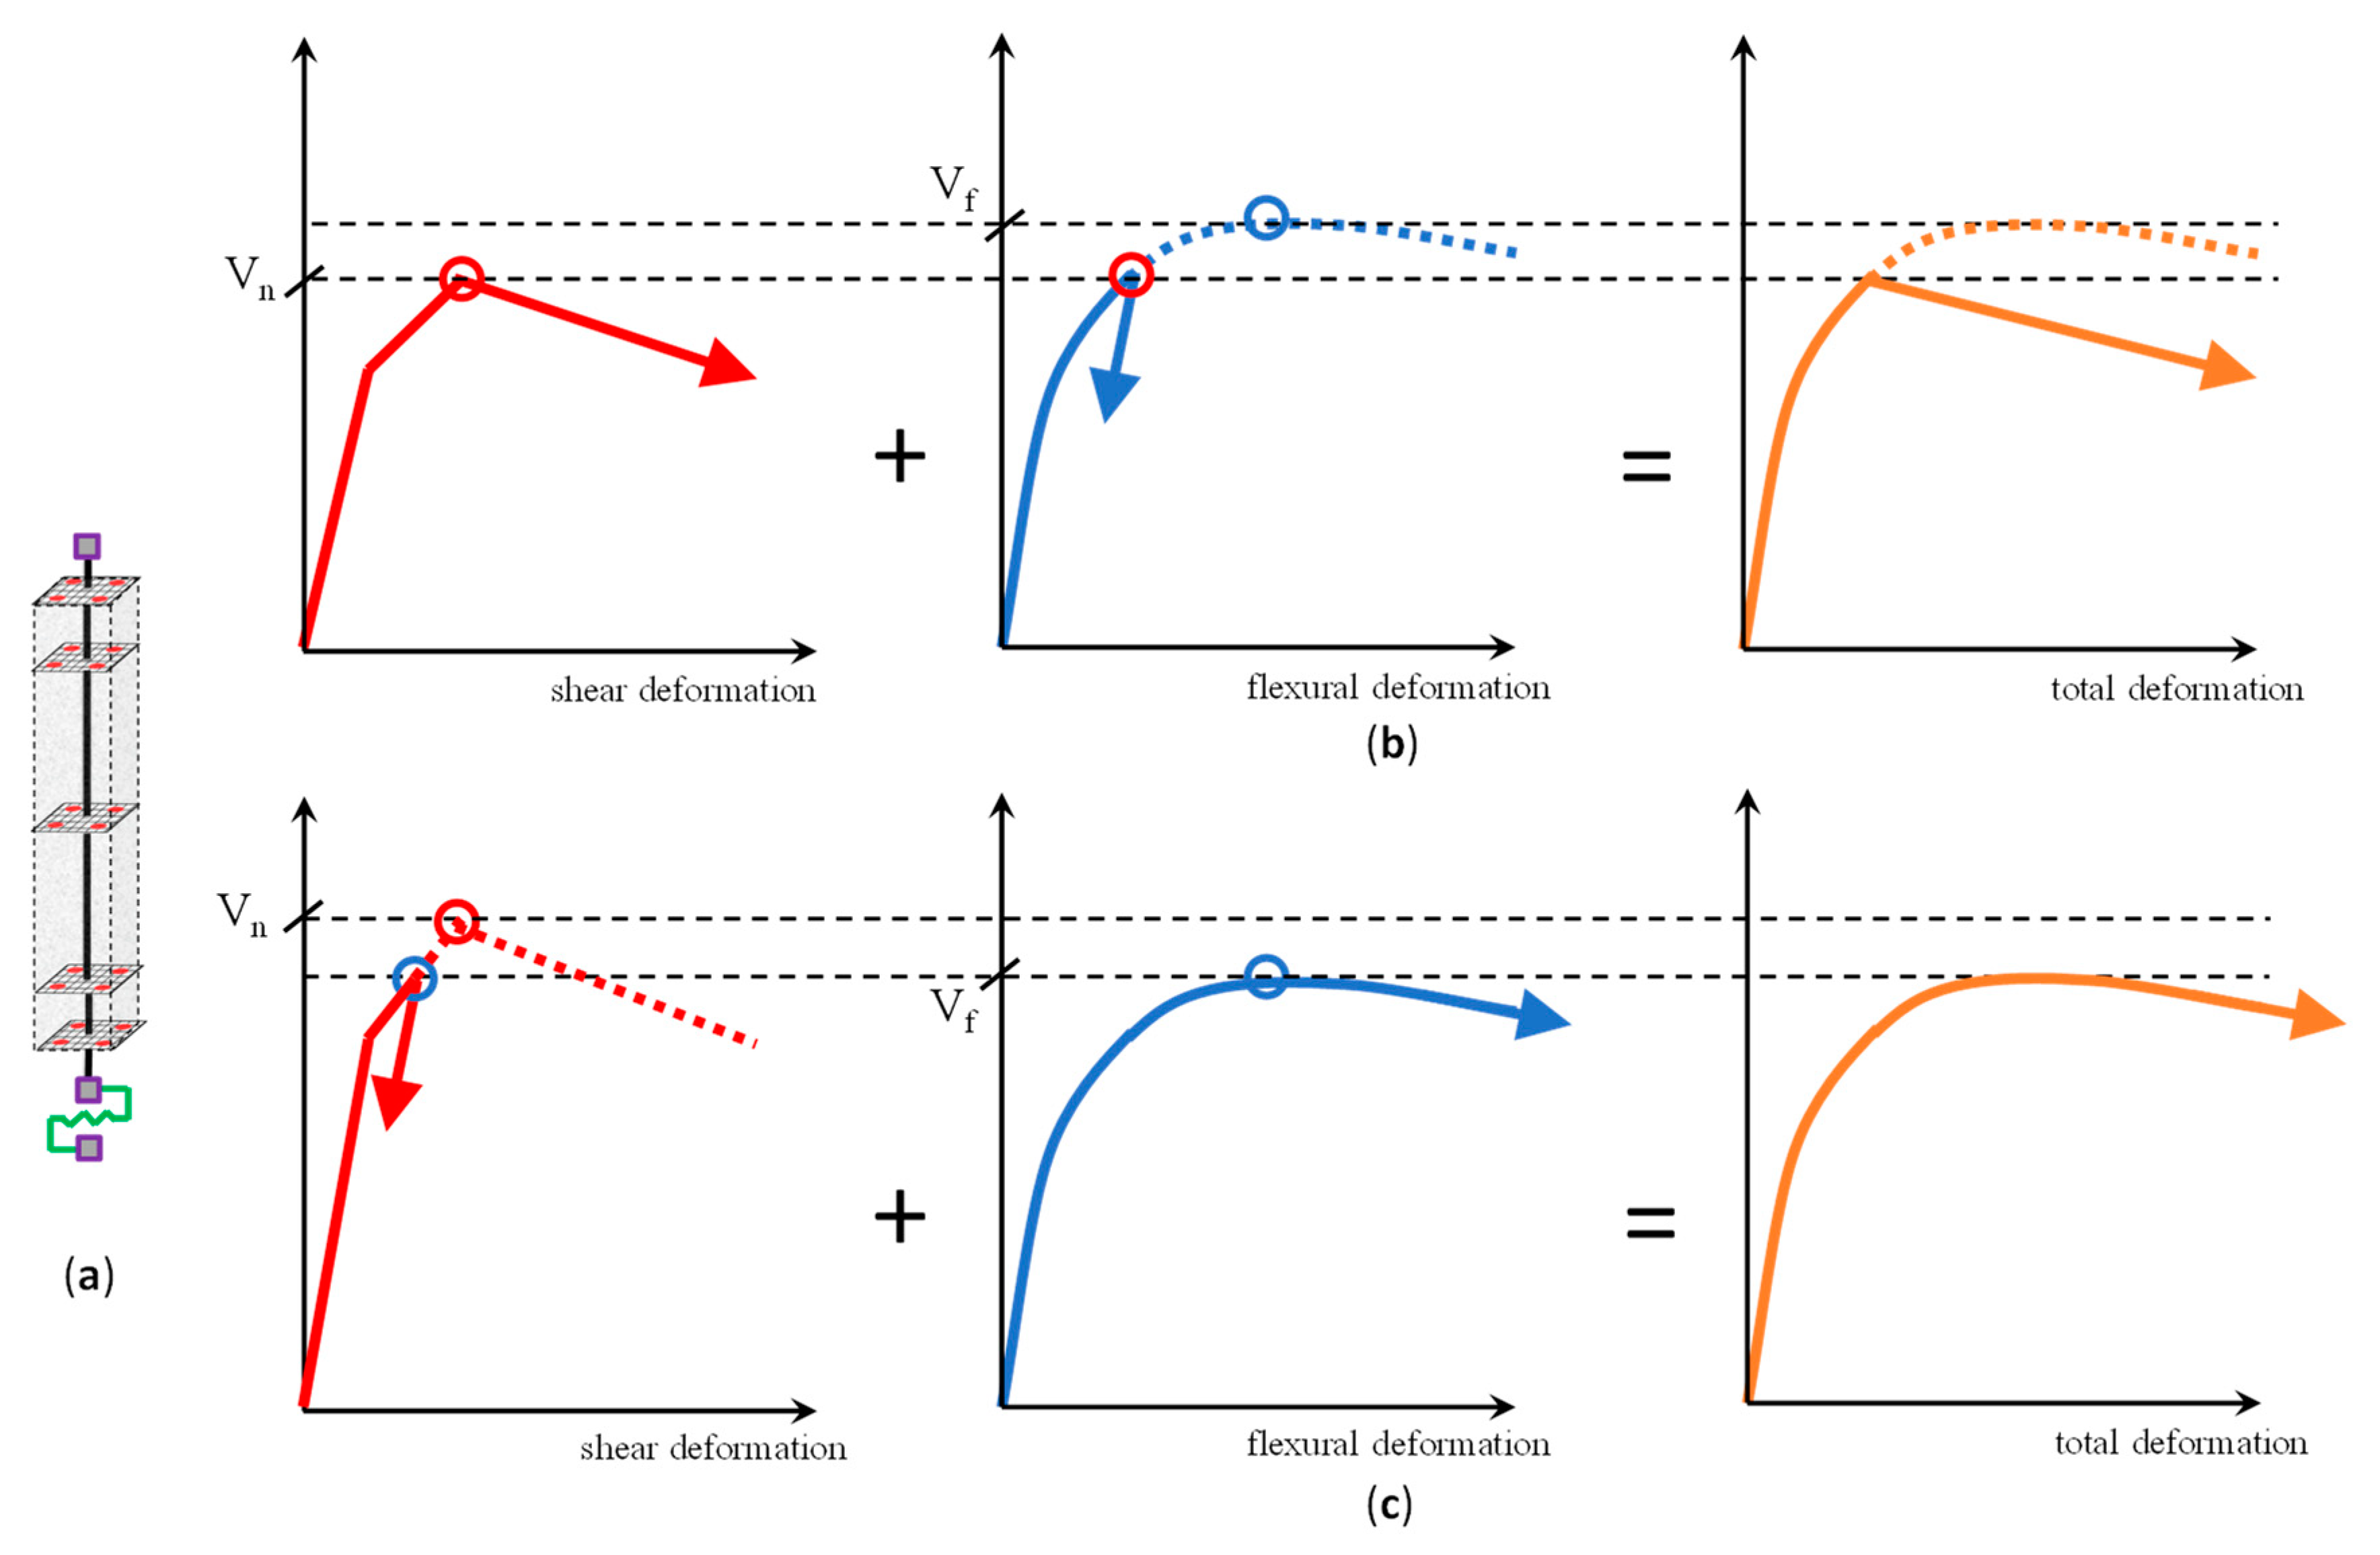
3.5. Interaction Model

In order to ensure that correct coupling is established between flexural, slip and shear behavior, a control is performed at element level through equilibrium and compatibility conditions.
In particular, thanks to the series arrangement of the three model components (the two zero length springs and the force-based beam column element) representing the pier under lateral load, the shear force acting in each element will be the same, but the deformation development of each element will be different for different cases.
In particular is discussed here the interaction between the flexural and shear behavior, as schematized in Figure 10a. In the proposed model all the shear deformation is concentrated in the translational shear spring whilst the flexural deformation is modelled by the beam-column element.
OpenSEES introduced, as an interaction model, the LimitStateMaterial command, based on Elwood works (2004), used to construct a uniaxial hysteretic material object with, among others, damage and post-damage unloading stiffness based on ductility.
This command overcomes the pitfall of a simplistic shear-flexure interaction model represented by having a shear spring in series with a beam column element. In a very simple serial model, indeed, if the shear strength (the maximum of the shear spring response) is less than the bending yield strength (the shear corresponding to the development of the plastic hinges), the total response is correctly dominated by a brittle failure occurring in the elastic branch. If, on the other hand, the shear strength is higher than the bending yield strength, then the model is not able to capture any shear degradation, in contrast with theoretical and experimental evidence. Actually, in the latter case, when the initial shear strength is higher than yielding strength, but close enough to it, when degrading with the increase of inelastic deformation could be lower. In this case the activation of shear damage in the plastic branch is expected, as shown in Figure 4 (case B), this leads the structural response of the column to follow the degrading branch of the shear-strength-domain of Figure 5. In order to improve the series model, the LimitStateMaterial associated with LimitCurve command can be used to define a limit shear surface defined by the drift capacity model proposed by Elwood, with the use of the shear-failure domain given by Equation (17).
The behavior of the shear spring and bending beam-column element are illustrated schematically in Figure 10.
If the shear capacity Vn of the pier is lower than its flexural strength Vf, the pier will have a response controlled by the shear behavior as shown schematically in Figure 10b. Before reaching the shear capacity Vn, shear response and flexural response will develop simultaneously in accordance with the solid line in the figure and once the shear demand reaches the shear strength, Vn, a shear failure occurs and the shear response enters into descending range where significant deterioration behavior occurs, conditioning the overall response, that cannot develop forces higher than the shear strength.
If the shear capacity Vn of the column is higher than flexural strength Vf, the pier will have a response controlled by the flexural behavior as shown schematically in Figure 10c. Before reaching the flexural capacity Vf, shear response and flexural response will develop simultaneously in accordance with the solid line in the figure and once the shear demand reaches the flexural strength Vf, a flexural failure occurs and the flexural response enters into descending range, conditioning the overall response, that cannot develop forces higher than the shear strength.
Adopting the proposed model, prior to the activation of the degrading branch, the response will follow the behavior given by the summation of flexure and shear (as in the simple serial spring model). After each step, the limit curve model checks if the force and deformation have exceeded the limit surface. If the limit curve has not been exceeded, the analysis continues at the next step without any change to the response. If the limit curve has been exceeded, then the behavior is redefined according to the degrading slope Kdeg, and the residual strength Fres both indicated in Figure 11.

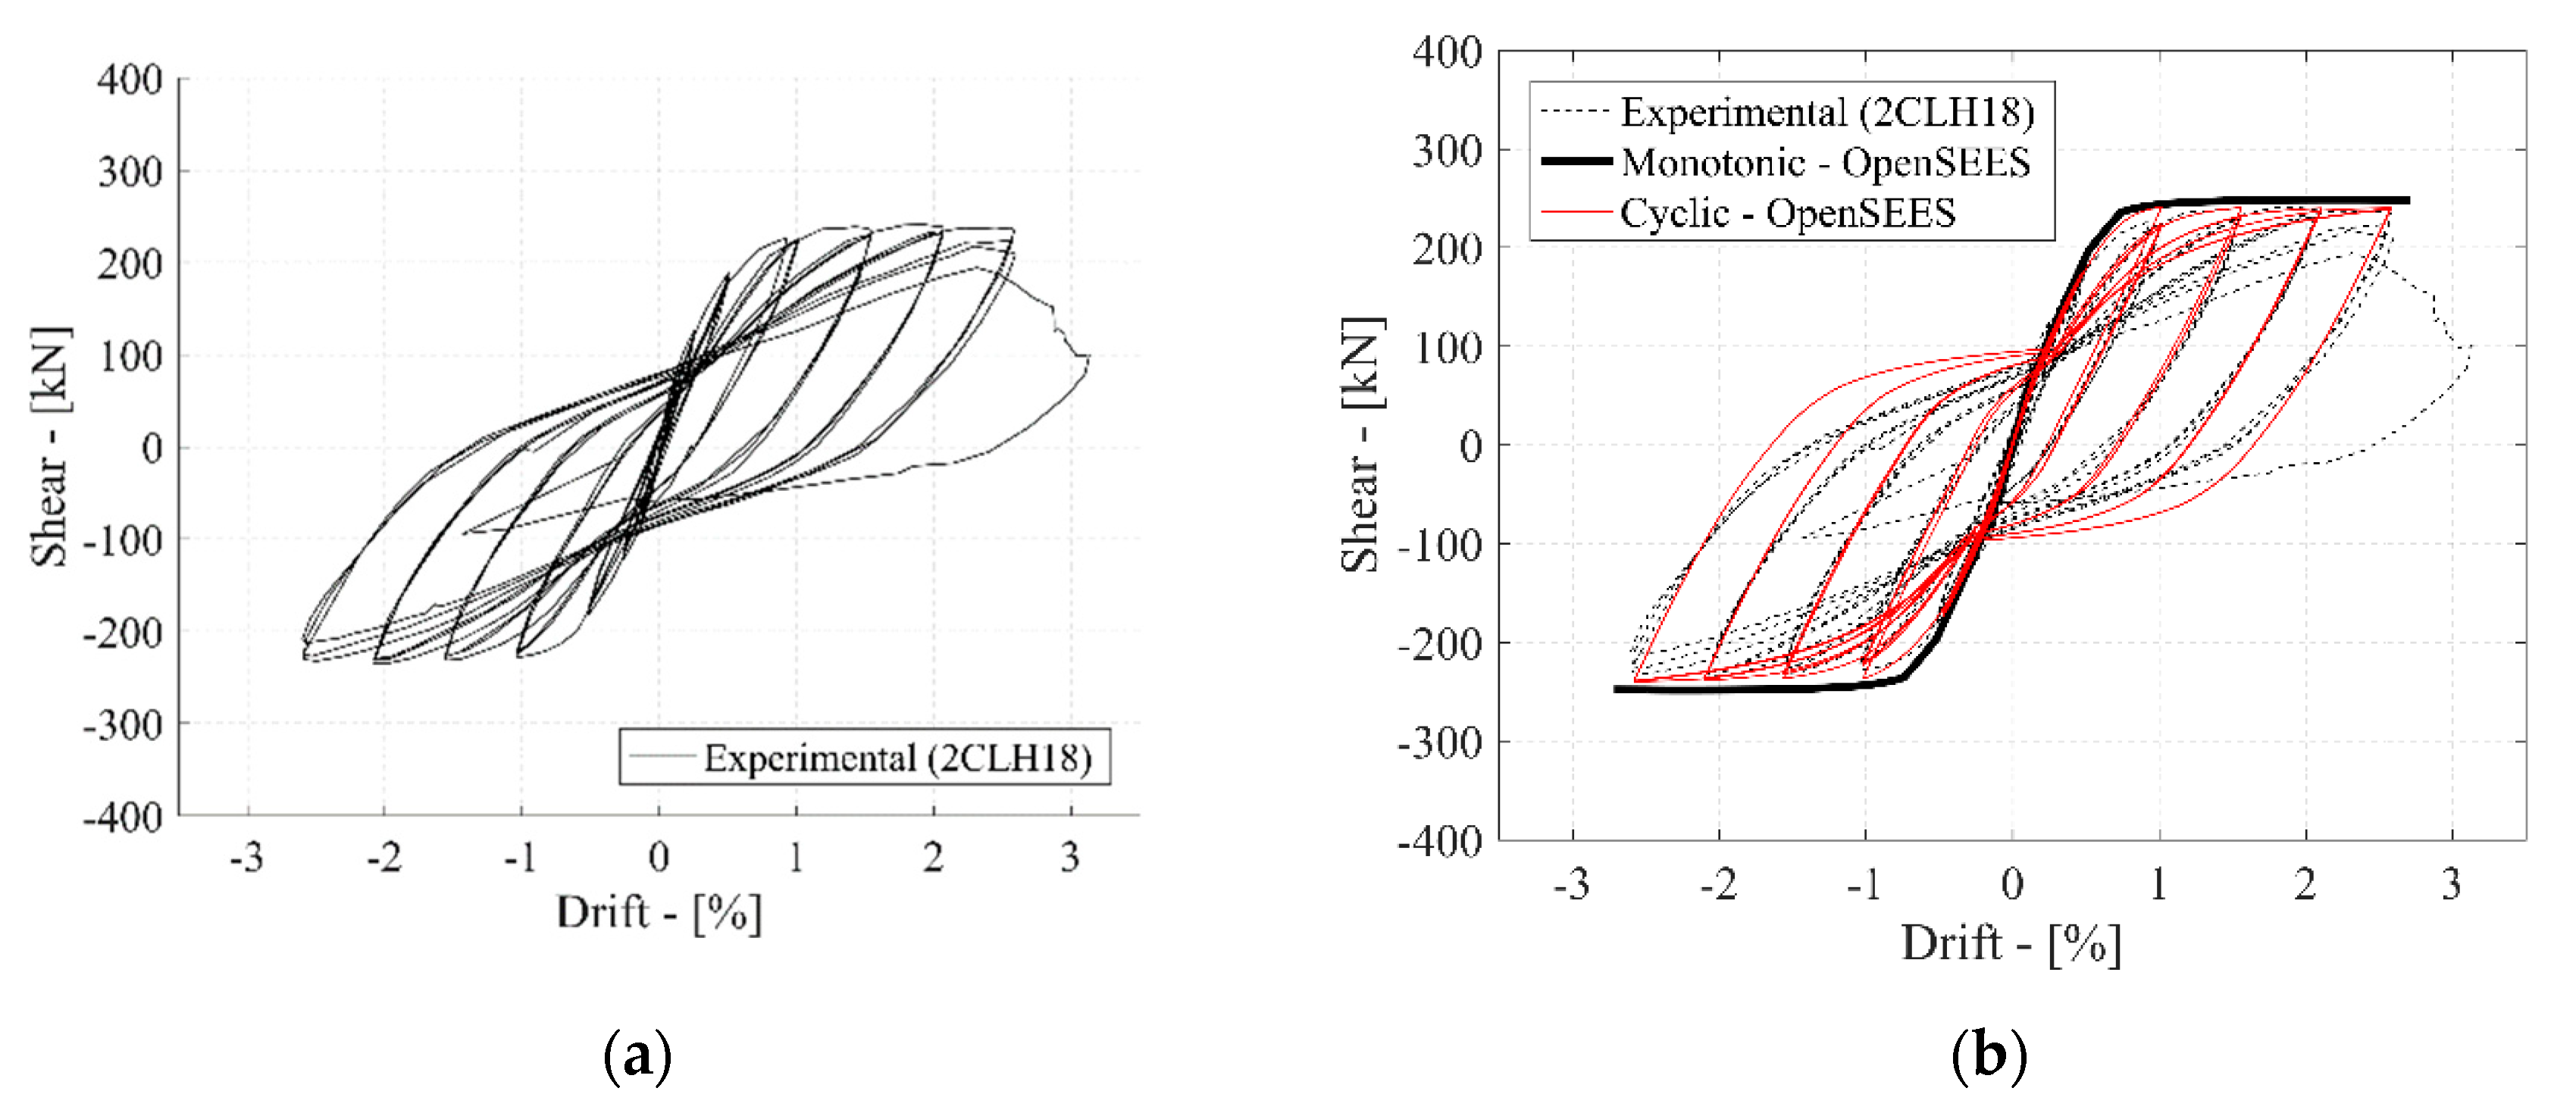
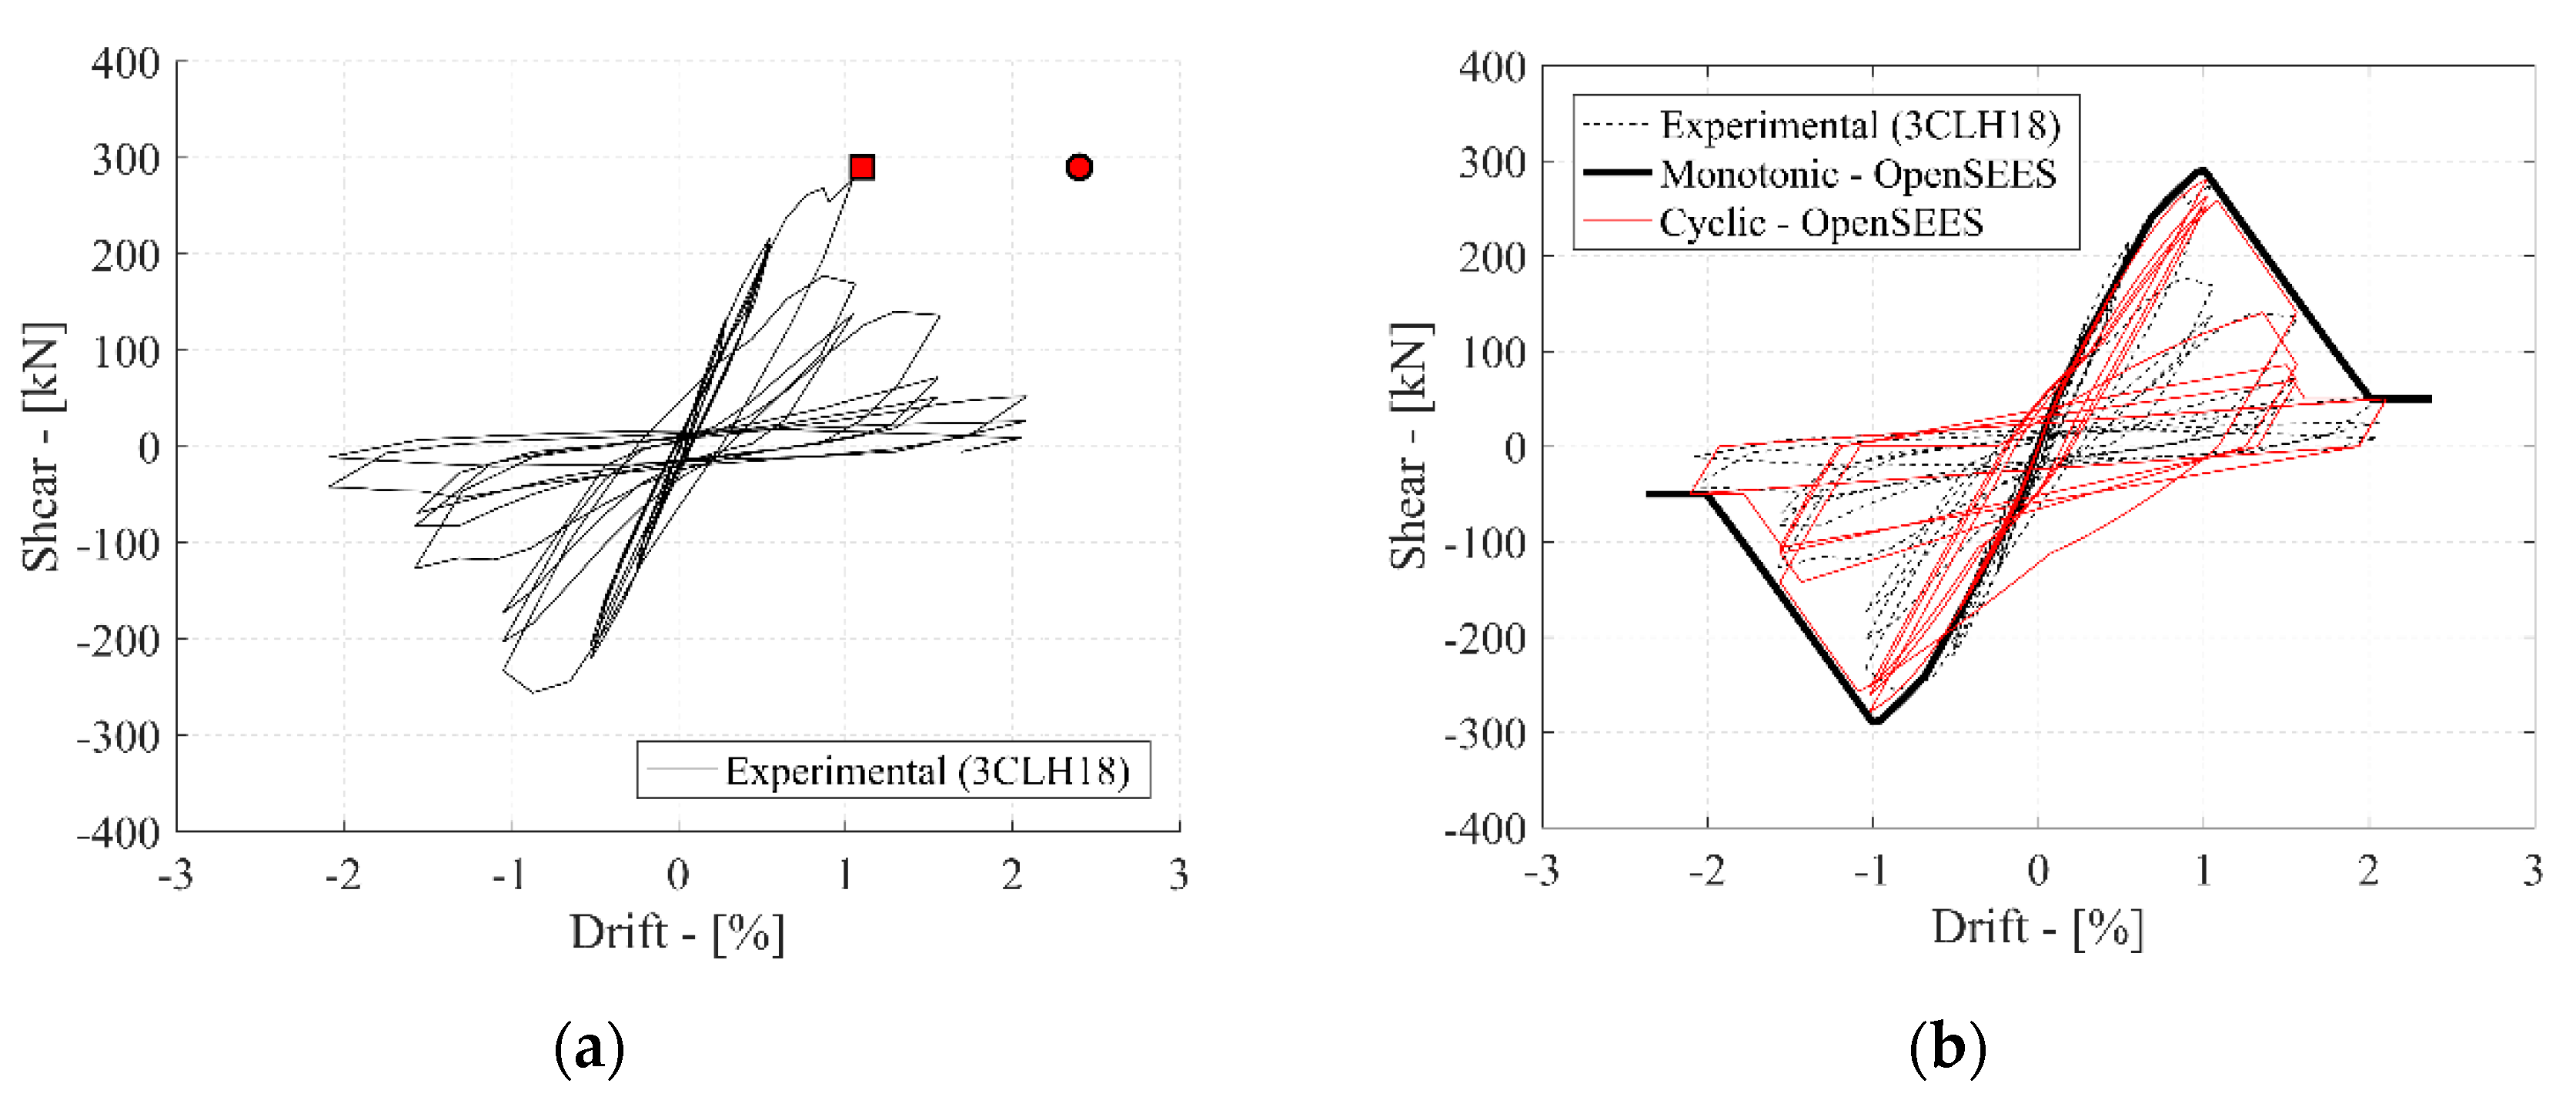
4. Numerical Validation

Using the model illustrated in the previous chapter, the experimental behavior of a series of reinforced concrete elements was simulated analytically by the proposed model. The details of the specimens failing in shear are summarized in Table 1.
In Figure 12a and Figure 13a the experimental behavior of specimen 2CLH18 and 3CLH18 are shown. Both the columns had a double cantilever configuration, a square cross-section of 457 × 457 mm. The longitudinal steel reinforcement was placed uniformly around the perimeter of the cross-section and they were 25 mm (#8) and 32 mm (#10) as nominal diameter for the specimen 2CLH18 and 3CLH18, respectively. The transversal reinforcements were hoop with 9.5 mm (#3) and 457 mm respectively as nominal diameter and spacing (ρw = 0.0007) for both specimens. The axial force was equal to P = 503 kN (ν = P/(Ag·f’c) = 0.09). The concrete compressive strength was equal to f’c = 26 MPa, whilst the longitudinal steel yielding strength was equal to fyl = 335 MPa and the transversal steel yielding strength was equal to fyw = 400 MPa.
The two specimens have the same shear strength due to the identical transversal reinforcements while the higher longitudinal reinforcement of the specimen 3CLH18 leads a higher yielding force than the specimens 2CLH18. As a consequence the experimental response of the two specimens experience two different collapse modes: the first one (2CLH18) has a typical response dominated by flexure up to collapse due to the reaching of the available ductility whilst the second one shows clearly a strength degradation in the plastic branch due to shear failure immediately after the onset of the flexural yielding. The two specimens exemplify well the two cases reported in Figure 10.
In Figure 12b and Figure 13b the numerical analysis has been compared with the experimental one. In the numerical model the cracked stiffness of the shear spring, KS,cracked has been set equal to the one of the uncracked one, KS,uncracked, following. Therefore, the black dash line of Figure 4, as given by Equation (3).
It is clear from the experimental curve that the shear degradation starts at a drift value of about (Δs/L)exp = 0.01 and displacement of about Δs,expt = 30.4 mm (square mark in Figure 13a).
Using Equation (17) is possible to calculate the drift ratio and displacement at shear degradation that are (Δs/L)calc = 0.024 and Δs,calc = 71.4 mm, respectively (circle mark in Figure 13a).
From the comparison between the experimental and calculate results (Figure 13b) is clear that the drift capacity model of espressed by Equation (17), in this case, gives a value much higher in term of drift ratio and displacement at shear failure than the one experienced experimentally.
Since the Limit Curve model is based on this empirical equation to define the shear limit surface theoretically it could not work correctly. Therefore, we decided to evaluate from the experimentation the values that should be used in the numerical analysis, in order to better approximate with OpenSEES the experimental curve. The values of the specimens failing in shear are reported in Table 2.

5. Conclusions

This paper presents a finite element model for assessing the nonlinear behavior of RC bridge piers under combined axial, shear, and bending moment. The model explicitly takes into account the response caused by the shear capacity deterioration due to the interaction with flexural deformation. This important effect has been introduced through the incorporation of a zero-length shear spring in series with a flexural column element and a rotational slip spring.
A phenomenological curve for the shear response has been proposed and calibrated, realistically capturing the monotonic and cyclic response of columns, including the pinching, the stiffness softening, and the strength deterioration due to deformations and cyclic load reversals. A good agreement between the numerical prediction and experimental data can be observed.

Author Contributions

All authors substantially contributed to this work. A.R. and A.P. were the scientific principal investigators of the research, and were responsible of conceptualization of activities and the development of investigations. D.L. and G.F. makes substantial contributions to the investigation with particular regard to the software. C.N. and B.B. supervised all the research and revised the results. All authors have read and agreed to the published version of the manuscript.

Funding

This research was funded by ReLUIS/DPC within the framework of the 2014–2018 and of the 2019–2021 Research Projects.

Acknowledgments

The authors would like to thank the anonymous referees for their valuable comments and suggestions.

Conflicts of Interest

The authors declare no conflict of interest.

References

  1. Nuti, C.; Rasulo, A.; Vanzi, I. Seismic assessment of utility systems: Application to water, electric power and transportation networks. In Proceedings of the Safety, Reliability and Risk Analysis: Theory, Methods and Applications Proceedings of the Joint ESREL and SRA-Europe Conference, Valencia, Spain, 22–25 September 2008; Volume 3, pp. 2519–2529. [Google Scholar]
  2. Nuti, C.; Rasulo, A.; Vanzi, I. Seismic safety of network structures and infrastructures. Struct. Infrastruct. Eng. 2010, 6, 95–110. [Google Scholar] [CrossRef]
  3. Rasulo, A.; Testa, C.; Borzi, B. Seismic risk analysis at urban scale in Italy. Lect. Notes Comput. Sci. 2015, 9157, 403–414. [Google Scholar] [CrossRef]
  4. Rasulo, A.; Fortuna, M.A.; Borzi, B. Seismic risk analysis at urban scale in Italy. Lect. Notes Comput. Sci. 2016, 9788, 198–213. [Google Scholar] [CrossRef]
  5. Lavorato, D.; Pelle, A.; Fiorentino, G.; Nuti, C.; Rasulo, A. A nonlinear material model of corroded rebars for seismic response of bridges, COMPDYN 2019. In Proceedings of the 7th ECOMAS Thematic Conference on Computational Methods in Structural Dynamics and Earthquake Engineering, Crete Island, Grecee, 24–26 June 2019. [Google Scholar]
  6. Lavorato, D.; Fiorentino, G.; Pelle, A.; Rasulo, A.; Bergami, A.V.; Briseghella, B.; Nuti, C. A corrosion model for the interpretation of cyclic behavior of reinforced concrete sections. Struct. Concr. 2019. [Google Scholar] [CrossRef]
  7. Lynn, A.C.; Moehle, J.P.; Mahin, S.A.; Holmes, W.T. Seismic evaluation of existing reinforced concrete building columns. Earthq. Spectra 1996, 12, 715–739. [Google Scholar] [CrossRef]
  8. Priestley, M.J.N.; Seible, F.; Verma, R.; Xiao, Y. Seismic shear strength of reinforced concrete columns. In Structural Systems Research Project Report No. SSRP 93/06; University of California: San Diego, CA, USA, 1993. [Google Scholar]
  9. Sezen, H.; Moehle, J.P. Shear strength model for lightly reinforced concrete columns. J. Struct. Eng. 2004, 130, 1692–1703. [Google Scholar] [CrossRef]
  10. Filippou, F.C.; D’Ambrisi, A.; Issa, A. Nonlinear static and dynamic analysis of reinforced concrete subassemblages. In Earthquake Engineering Research Center Report No. UCB/EERC-92/08; University of California: Berkeley, CA, USA, 1992. [Google Scholar]
  11. Cassese, P.; De Risi, M.T.; Verderame, G.M. A degrading shear strength model for RC columns with hol-low circular cross-section. Int. J. Civ. Eng. 2019, 17, 1241–1259. [Google Scholar] [CrossRef]
  12. Cassese, P.; De Risi, M.T.; Verderame, G.M. A modelling approach for existing shear-critical RC bridge piers with hollow rectangular cross section under lateral loads. Bull. Earthq. Eng. 2019, 17, 237–270. [Google Scholar] [CrossRef]
  13. Guedes, J.; Pinto, A.V. A numerical model for shear dominated bridge piers. In Proceedings of the Second Italy–Japan Workshop on Seismic Design and Retrofit of Bridges, Rome, Italy, 27–28 February 1997. [Google Scholar]
  14. Ranzo, G.; Petrangeli, M. A fibre finite beam element with section shear modelling for seismic analysis of RC structures. J. Earthq. Eng. 1998, 2, 443–473. [Google Scholar] [CrossRef]
  15. Petrangeli, M. Fiber element for cyclic bending and shear of RC structures. II: Verification. J. Eng. Mech. 1999, 125, 1002–1009. [Google Scholar] [CrossRef]
  16. Marini, A.; Spacone, E. Analysis of reinforced concrete elements including shear effects. ACI Struct. J. 2006, 103, 645–655. [Google Scholar]
  17. Ceresa, P.; Petrini, L.; Pinho, R.; Sousa, R. A fibre flexure-shear model for seismic analysis of RC-framed structures. Earthq. Eng. Struct. Dyn. 2009, 38, 565–586. [Google Scholar] [CrossRef]
  18. McKenna, F.; Fenves, G.L.; Scott, M.H.; Jeremic, B. Open System for Earthquake Engineering Simulation (OpenSEES); University of California: Berkeley, CA, USA, 2000. [Google Scholar]
  19. Menegotto, M.; Pinto, P.E. Method of Analysis of Cyclically Loaded RC Plane Frames including Changes in Geometry and Non-Elastic Behavior of Elements under Normal Force and Bending; International Association for Bridge and Structural Engineering: Zurich, Switzerland, 1973; pp. 15–22. [Google Scholar]
  20. Popovics, S. A numerical approach to the complete stress-strain curve of concrete. Cem. Concr. Res. 1973, 3, 583–599. [Google Scholar] [CrossRef]
  21. Mander, J.B.; Priestley, M.J.; Park, R. Theoretical stress-strain model for confined concrete. J. Struct. Eng. 1988, 114, 1804–1826. [Google Scholar] [CrossRef] [Green Version]
  22. Eligehausen, R.; Bertero, V.V.; Popov, E.P. Local bond stress-slip relationships of deformed bars under generalized excitations: Tests and analytical model. In Report No EERC; Earthquake Engineering Research Center, University of California: Berkeley, CA, USA, 1983; pp. 1–169. [Google Scholar]
  23. Sezen, H.; Setzler, E.J. Reinforcement slip in reinforced concrete columns. ACI Struct. J. 2008, 105, 280. [Google Scholar]
  24. CEB-FIB. Model Code 2010-Final Draft; The International Federation for Structural Concrete (FIB CEB-FIP): Lausanne, Switzerland, 2010. [Google Scholar]
  25. Elwood, K.J. Shake Table Tests and Analytical Studies on the Gravity Load Collapse of Reinforced Concrete Frames. Level of. Ph.D. Thesis, University of California, Berkeley, CA, USA, January 2002. [Google Scholar]
  26. Elwood, K.J.; Eberhard, M.O. Effective Stiffness of Reinforced Concrete Columns. In Research Digest No 2006-1. ACI Struct. J. 2009, 106, 476–484. [Google Scholar]
  27. Park, R.; Paulay, T. Reinforced Concrete Structures; John Wiley & Sons: Hoboken, NJ, USA, 1975. [Google Scholar]
  28. Biskinis, D.E.; Roupakias, G.K.; Fardis, M.N. Degradation of Shear Strength of Reinforced Concrete Members with Inelastic Cyclic Displacements. ACI Struct. J. 2004, 101, 773–783. [Google Scholar]
  29. Elwood, K.J.; Moehle, J.P. Drift Capacity of Reinforced Concrete Columns with Light Transverse Reinforcement. Earthq. Spectra 2005, 21, 71–89. [Google Scholar] [CrossRef]
  30. Kowalsky, M.J.; Priestley, M.J.N. Improved Analytical Model for Shear Strength of Circular Reinforced Concrete Columns in Seismic Regions. ACI Struct. J. 2000, 97, 388–396. [Google Scholar]
  31. Lynn, A. Seismic Evaluation of Existing Reinforced Concrete Building Column. Ph.D. Thesis, University of California at Berkeley, Berkeley, CA, USA, 2001. [Google Scholar]
  32. Saatcioglu, M.; Ozcebe, G. Response of reinforced concrete columns to simulated seismic loading. Struct. J. 1989, 86, 3–12. [Google Scholar]
  33. Calvi, G.M.; Pavese, A.; Rasulo, A.; Bolognini, D. Experimental and numerical studies on the seismic response of R.C. hollow bridge piers. Bull. Earthq. Eng. 2005, 3, 267–297. [Google Scholar] [CrossRef]
Figure 1. Idealized components of horizontal displacement: (a) Original undeformed configuration as a cantilever column; (b) bending deformation; (c) shear deformation and (d) bonding deformation.
Applsci 10 02209 g001
Figure 2. Numerical finite element model adopted in this study (x is the element local axis).
Applsci 10 02209 g002
Figure 3. Properties of a RC section: (a) Fiber discretization of the section (y and z are the element local axis); (b) steel reinforcement and (c) cover (unconfined) and core (confined) concrete constitutive law (the meaning of the symbols is given in the text).
Applsci 10 02209 g003
Figure 4. ATC model for shear-strength degradation (dy: yielding displacement). Three cases are considered: (A) shear failure before flexural yielding (pure shear failure); (B) shear failure after flexural yielding (shear-flexural failure); (C) flexural failure.
Applsci 10 02209 g004
Figure 5. Phenomenological model for the shear spring.
Applsci 10 02209 g005
Figure 6. The factor k after Sezen and Moehle [9] (in Equations (7) and (8)).
Applsci 10 02209 g006
Figure 7. The factor α after Kowalsky and Priestley [30] (in Equation (14)).
Applsci 10 02209 g007
Figure 8. The factor β after Kowalsky and Priestley [30] (in Equation (14)).
Applsci 10 02209 g008
Figure 9. The factor γ after Kowalsky and Priestley [30] (in Equation (14)).
Applsci 10 02209 g009
Figure 10. Combination of the single response components in shear-flexure interaction model: (a) Two-component model; (b) Response controlled by shear failure and (c) Response controlled by flexural failure.
Applsci 10 02209 g010
Figure 11. Redefinition of backbone after failure.
Applsci 10 02209 g011
Figure 12. Specimen 2CLH18: (a) Experimental behaviour. (b) Comparison of numerical cyclic response with experimental results.
Applsci 10 02209 g012
Figure 13. Specimen 3CLH18: (a) Experimental behaviour. The square and circle marks represent respectively the experimental (Table 2) and calculated (Equation (17)) initiation of shear degradation. (b) Comparison of numerical cyclic response with experimental results.
Applsci 10 02209 g013
Table 1. Database of examined reinforced concrete elements.
Rectangular Section
ReferenceSpecimenb (mm)h (mm)s (mm)a/d (---)ρl
(---)
ρw
(---)
f’c (MPa)fyl (MPa)fyw (MPa)ν
(---)
Test Type
Lynn A.C.
[31]
2CLH18457.2457.2457.23.740.020.000726.8330.7399.60.09DC
3CLH18457.2457.2457.23.740.030.000726.8330.7399.60.09DC
3SLH18457.2457.2457.23.740.030.000726.8330.7399.60.09DC
2SLH18457.2457.2457.23.710.020.000727.5330.7399.60.07DC
3CMH18457.2457.2457.23.740.030.000725.4330.7399.60.28DC
3CMD12457.2457.2457.23.740.030.001725.4330.7399.60.28DC
Saatcioglu Ozcebe [32]U1350.0350.0150.03.280.030.008543.6430.0470.00.00SC
U2350.0350.0150.03.280.030.008530.2453.0470.00.16SC
U3350.0350.075.03.280.030.016934.8430.0470.00.16SC
Hollow Rectangular Section
ReferenceSpecimenb (mm)h (mm)s (mm)a/d (---)ρl
(---)
ρw
(---)
f’c (MPa)fyl (MPa)fyw (MPa)ν
(---)
Test Type
Calvi et al. [33]T250450.0450.075.03.000.01770.002530.3550.0550.00.07SC
T500A450.0450.075.03.000.01770.002529.7550.0550.00.15SC
T500B450.0450.075.03.000.01770.002532.7550.0550.00.15SC
T750450.0450.075.03.000.01770.002530.8550.0550.00.21SC
b: column section width; h: column section height; s: stirrup spacing; a/d: aspect ratio (shear span/section depth); ρl: longitudinal reinforcement ratio; ρw: transverse reinforcement ratio; f’c: compressive strength of concrete; fyl: yield strength of longitudinal steel; fyw: yield strength of transverse steel; ν: axial load ratio; Test type: SC (single cantilever), DC (double cantilever).
Table 2. Experimental values needed for the calibration of the shear spring (Figure 4).
Rectangular Section
ReferenceSpecimenΔs/L
(---)
Ks,deg (kN/mm)Vs
(kN)
Vres
(kN)
Lynn A.C. (2001) [31]3CLH180.0100−7.5277.050.0
3SLH180.0077−4.4270.048.7
2SLH180.0088−6.2231.6
3CMH180.0100−12.4324.494.3
3CMD120.0085−4.1355.8
Saatcioglu, Ozcebe [32]U10.044−2.8273.070.0
U20.021−6.0280.090.0
U30.044−3.7255.0
Hollow Rectangular Section
ReferenceSpecimenΔs/L
(---)
Ktdeg (kN/mm)Vs
(kN)
Vres
(kN)
Calvi et al. [33]T2500.022−8.9217.247.9
T500A0.010−6.3209.0
T500B0.022−7.8228.0
T7500.020257.9

