Article

Development of an ESCO Risk Assessment Model as a Decision-Making Tool for the Energy Savings Certificates Market Regulator: A Case Study

1
Department of Energy Engineering, Sharif University of Technology, Tehran, P.O. Box 14565-114, Iran
2
M. E. Rinker Sr. School of Construction Management, University of Florida, P.O. Box 115703, Gainesville, FL 32611, USA
3
CUIRE, Department of Civil Engineering, The University of Texas at Arlington, P.O. Box 19308, Arlington, TX 76019, USA
4
SWIS, Department of Civil Engineering, The University of Texas at Arlington, P.O. Box 19308, Arlington, TX 76019, USA
5
Lyle School of Engineering, Southern Methodist University, P.O. Box 750339, Dallas, TX 75275, USA
*
Author to whom correspondence should be addressed.
Appl. Sci. 2020, 10(7), 2552; https://doi.org/10.3390/app10072552
Submission received: 9 February 2020 / Revised: 31 March 2020 / Accepted: 2 April 2020 / Published: 8 April 2020
(This article belongs to the Section Energy Science and Technology)

Abstract

:
This article is focused on developing an Energy Service Company (ESCO) risk assessment model for use by energy savings certificates (ESC) market regulators. This model enables market regulators to determine the appropriate point in time for ESCOs to sell their certificates with the aim of minimizing risk as well as maximizing economic gain yet remain motivated for reducing the cost of energy efficiency technologies. To this end, the interactions between an ESCO and other parties (such as suppliers) in the market in addition to the principles of the energy efficiency performance contract are taken into consideration. Then, appropriate probability distributions have been fitted to the stochastic variables to be applied in the Net Present Value (NPV) function, based on sampled company data. A case study considers a one MW Organic Rankine Cycle (ORC) implementation in Iran’s petrochemical industry. The finding of this study shows if the ESCO is allowed to sell the certificates during the first seven years as well reduce 30% of the investment cost, the expected Net Present Value over Investment Cost (NPV/I) savings will cover more than one cycle.

Graphical Abstract

1. Introduction

The energy demands enhancement and environmental concerns of utilizing fossil fuels in recent years have led to a significant increase in investment in energy efficiency projects [1,2,3]. Despite the actions and considerable investments that are being made, there remain several obstacles which need to be removed in order to accelerate the uptake of energy efficiency projects. Hansen et al. reported the history and status of the energy services industry in 49 countries and analyzed the opportunities, barriers and problems in using ESCO as the main executors of energy efficiency projects [4]. Based on this report, the main challenges of ESCO business can be divided into four main categories that affect energy efficiency projects and ESCO business from risk and economic viewpoints, namely: “awareness of the energy savings potential and access to the information”; “access to the efficient technologies”; “existence of financial institutions and instruments”; and “low energy prices and benefits of energy efficiency projects”. The impacts of these challenges are reflected in the increase of the risk of energy savings projects, especially under the ESCO business model which is based on the energy performance contracts (EPC). Because the ESCO business is based on the EPC, its benefit in energy efficiency projects will be obtained as a part of saved energy that is determined in a contract between the ESCO and energy consumer during a specific time period [5,6]. This heightens the dependency of the benefits of ESCO to the energy consumer’s behavior and thus makes it to be susceptible to different uncertainties [7,8,9,10].
The investigation of the experiences of different countries shows that more success in removing four related challenges leads to higher regards for ESCO business. Additionally, successful experiences demonstrate that the market-based solutions are the best approach for solving the challenges of energy savings projects, and when the market structure, as shown in Figure 1, is more developed in a country, the ESCO business is more active in that country and their challenges are fewer. The creation of the ESC market, such as the tradable white certificates (TWC) market in recent years, is a testimony to this claim [11,12].
However, the energy savings market, despite its benefits for solving the mentioned challenges of ESCO, is not mature yet and there is discussion about the ways for increasing its performance and effectiveness [14]. As with any market, the ESC market will work and be effective if its supply and demand sides are formed adequately and match with each other [15,16,17,18]. From the demand side, policy makers and governments are pursuing different ways such as determining standards and penalties to reinforce it [19]. Apart from the supply side, which is done by ESCO, the encouragement of ESCO to perform more energy savings projects for creating an appropriate amount of supply is essential in order to lead to liquid markets. As previously mentioned, the ESCO business model is a high-risk model, which heightens its challenges for performing energy savings projects. Therefore, ESCO will be encouraged to perform more projects and subsequently supply more certificates in the ESC market if its risk is decreased. As such, the main question of this article is:
“How could the ESC market be effective for risk reduction in the ESCO business?”
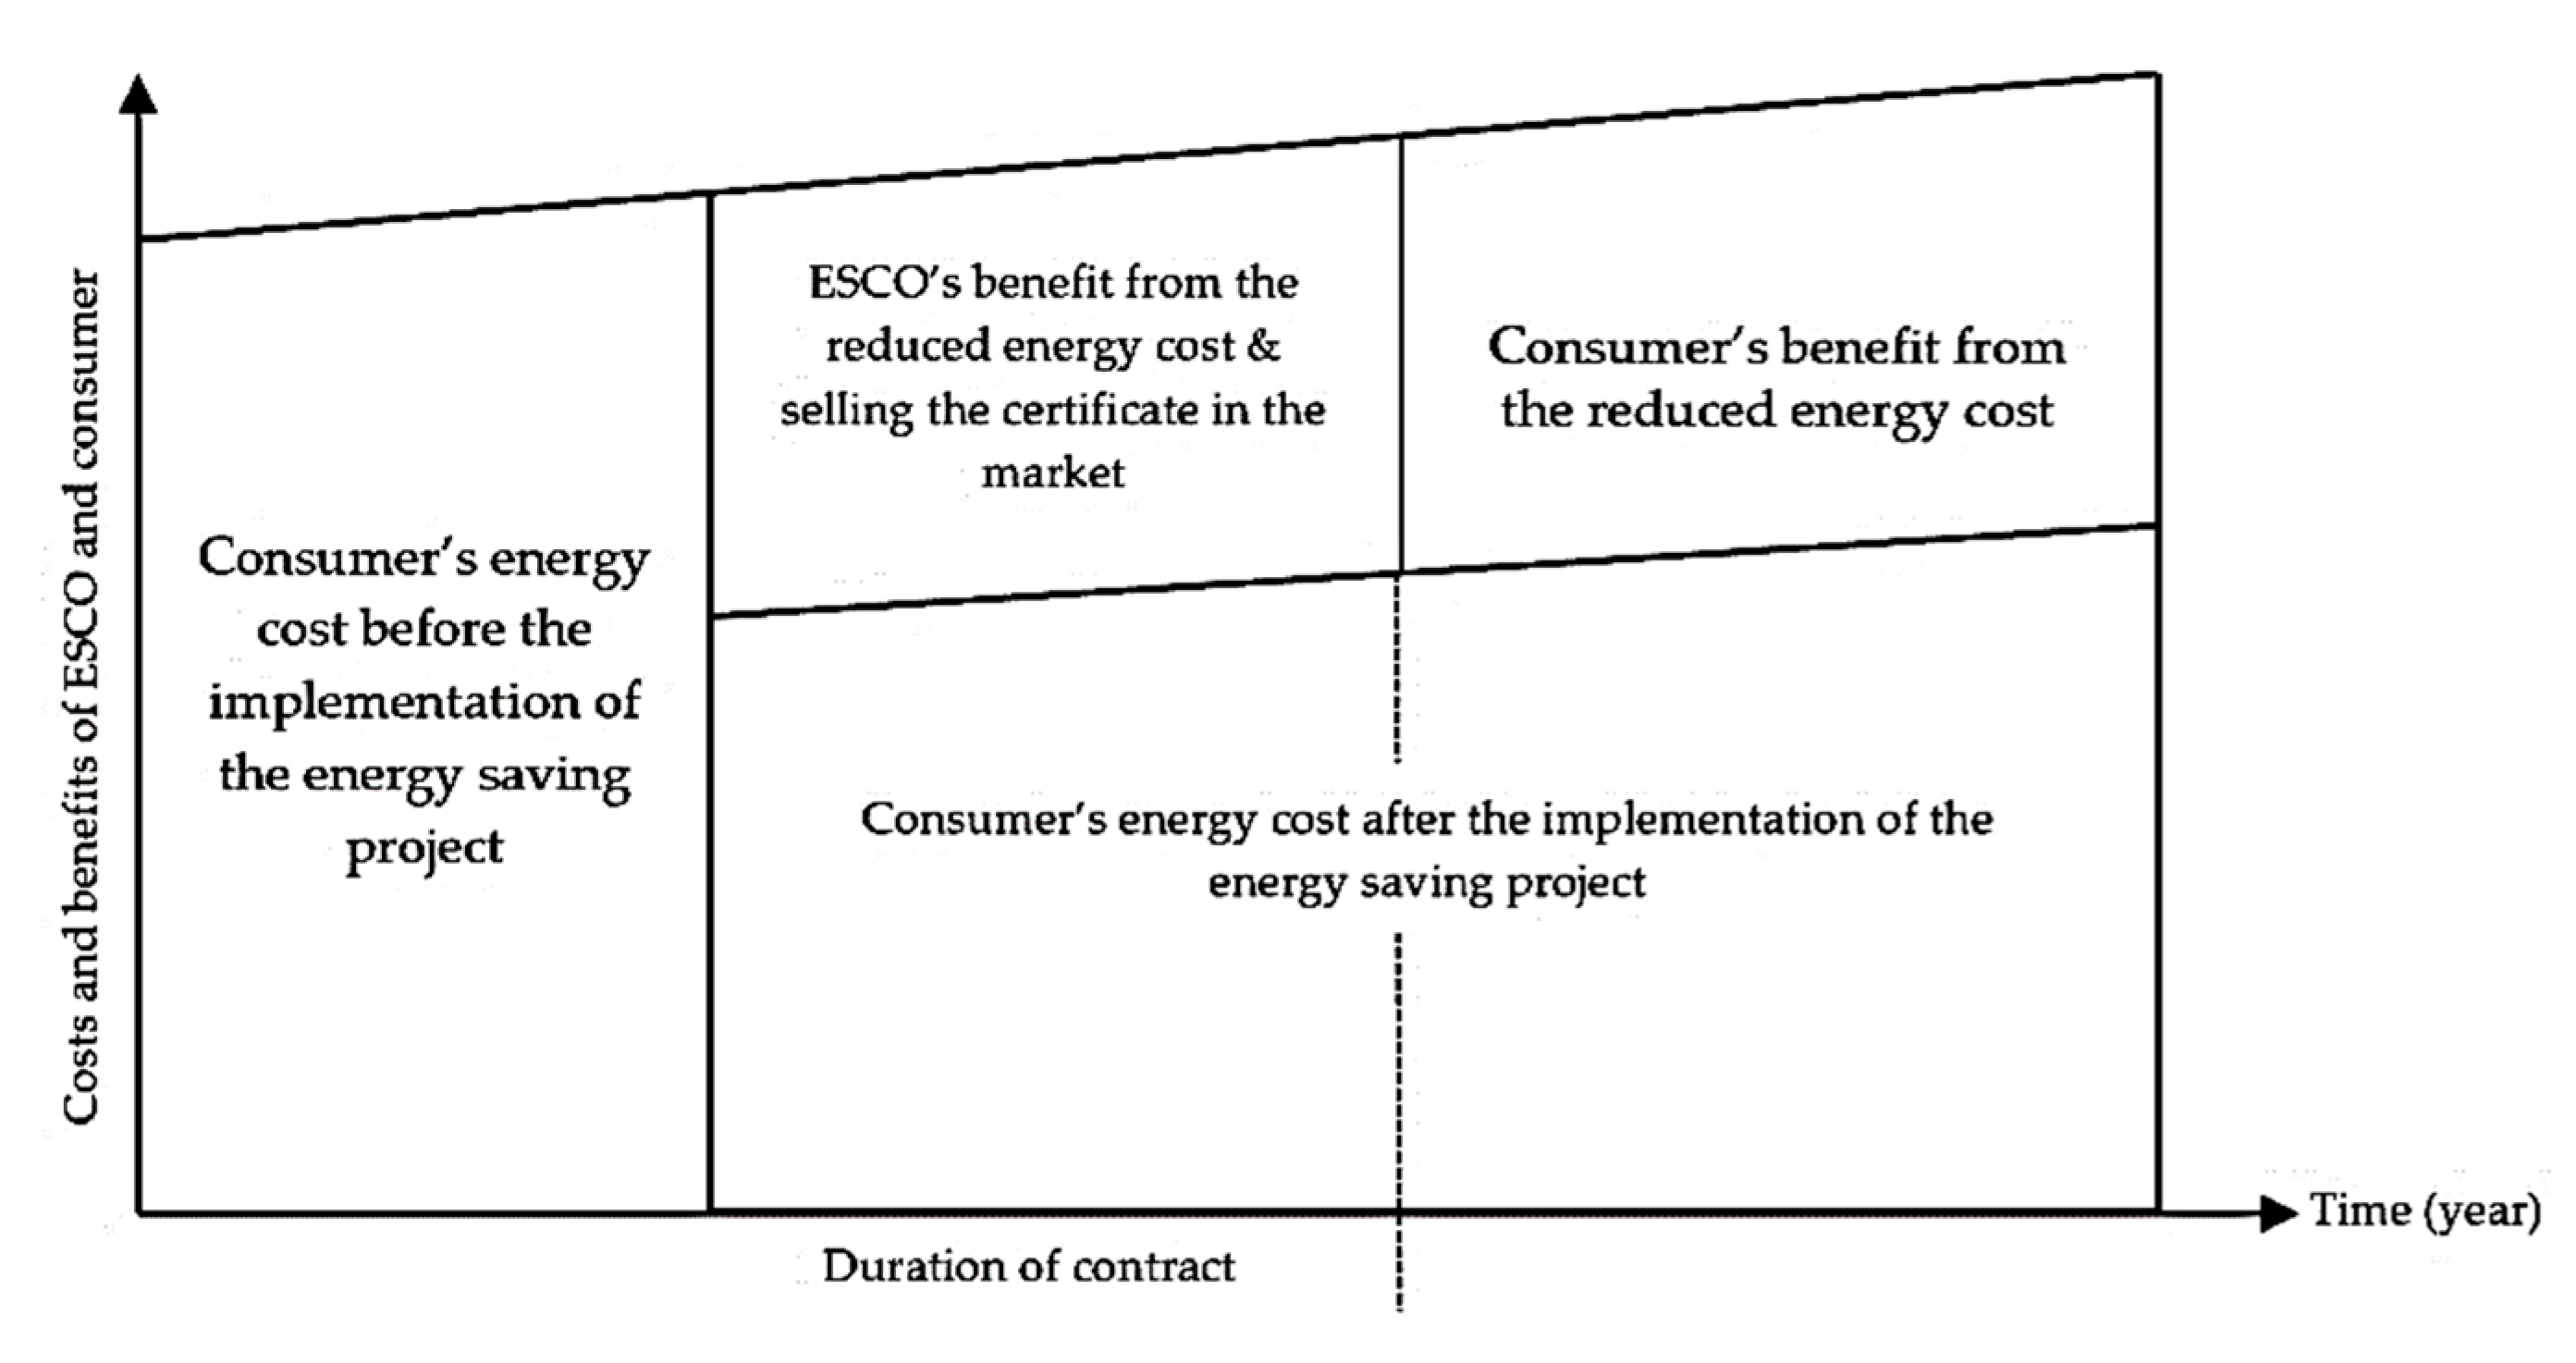
As shown in Figure 2, after fulfilling the energy saving project, an ESCO, in addition to owning a portion of the benefits from the consumer reduced energy cost, can benefit from selling the certificates in the market for a time period that is determined by the market regulator. Due to this, a determined time period by the market regulator is one of the most important parameters that affect the risk reduction of ESCO in the ESC market.
As the allowed time period by the regulator for selling the certificates becomes longer, the benefit of ESCO will also increase and subsequently the risk in its business will reduce. However, too much risk reduction by this means is not appropriate, since it prevents the ESCO from attempting to implement other solutions such as developing more cost-effective technologies. On the other hand, a short-allowed time window will not be effective enough to make the ESCO project justified from the risk and economic viewpoints that cause the market to be unproductive for risk reduction. This means that determination of an appropriate time period by the market regulator is necessary to lead to an optimal allocation of financial resources to the ESCO. To this end, the main idea of this study is to develop a risk assessment model of an ESCO by consideration of the energy savings market structure as a decision-making tool for determination of the appropriate time period by the market regulator for certificates sale.
Overall, studies about ESC market can be categorized into three main stages, as shown in Table 1. The early studies were mainly about the fundamentals of market, which include the studies of the market’s performance mechanism, the relationship of the market players, compatibility of the market with energy saving regulations and policies of the country, etc. The studies of the benefits and costs of the market is the second category that includes analysis of the needed resources for creation of the market, cost of publishing, and the exchange of the certificates, benefits of saved energy and certificates, etc. Sustainability and better performance of the market is the third category of studies which encompasses the issues such as price fluctuation, monopoly, demand, and supply matters that should be analyzed to consider appropriate solutions for them to avoid market failure.
Although the previous studies concerning the ESC market are, in most cases, related to the ESCO activity in the market, the issue requiring more investigation is risk reduction in ESCO business through determination of the appropriate time period by the market regulator for selling the certificates. Additionally, it is notable that different studies about ESCO risk analysis have been undertaken in the next section, but the main distinction between this study and previous work is the focus on risk assessment of ESCO in the ESC market structure as well as the mentioned related issues to the market regulator. To this end, the NPV function has been considered as a basic tool for developing the risk assessment model in this article, since it allows assessment of how the time period deemed by the market regulator affects the risk in ESCO business. In addition, all of the affective risk factors could be reflected in the NPV function as input cash flows ( x i , t ) and output cash flows ( y i , t ) as Equation (1) [29].
NPV = t T ( x i , t y i , t ) ( 1 + r ) t ,
where ( x i , t ) include income items and ( y i , t ) include expense items at time t in the period of T.

2. Methodology

2.1. Modeling

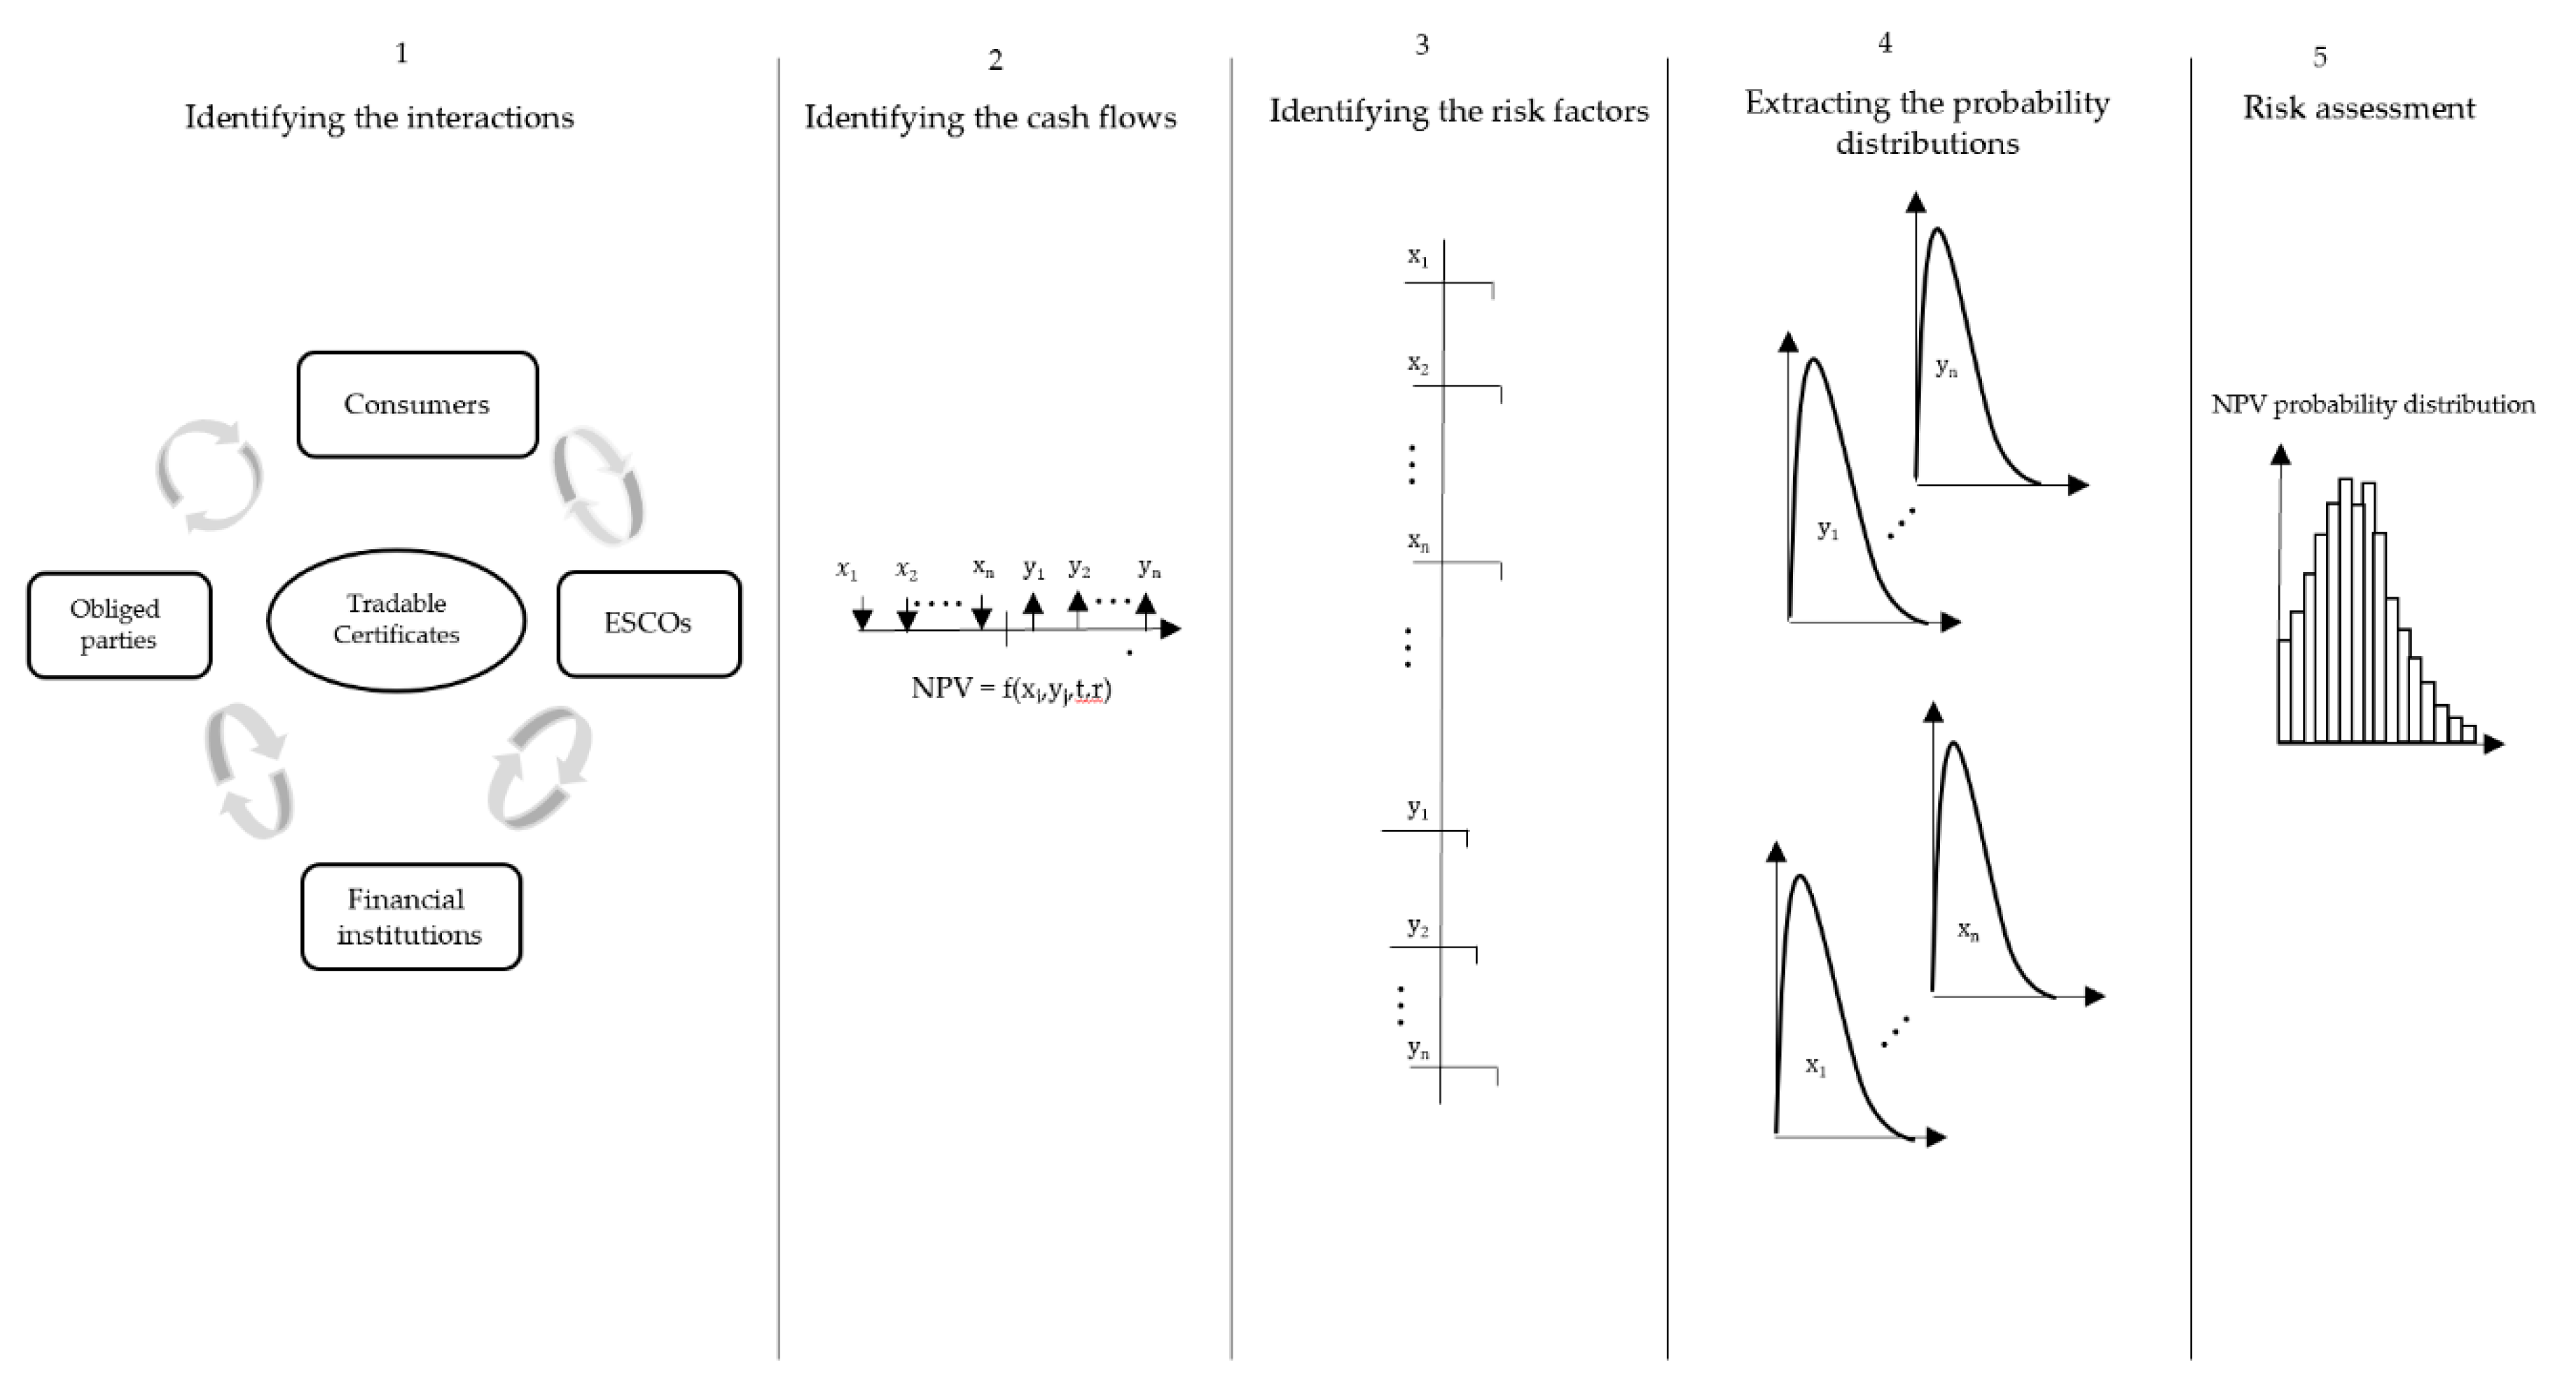
The steps that should be taken for risk assessment are shown in Figure 3. To organize the NPV function, the identification of the interactions between the ESCO and other members of the market is considered first. Then, the interactions are expressed in the form of cash flows and mathematical equations. After the organization of the NPV function, the uncertain variables are identified, then, if sufficient historical data are available, the appropriate probability distributions for the considered variables are included. The Monte Carlo method is used to generate the random numbers to model the probability distribution of the corresponded variables [30,31,32]. Finally, the probability distributions of the variables are included in the NPV function using the Monte Carlo method and the probability distribution of the NPV is obtained by discounting the probability distribution of the cash flows. By extracting the NPV probability distribution, a sensitivity analysis can be undertaken using different time periods in the calculations to analyze how the risk in ESCO project changes with the time periods. Additionally, different financial criteria such as expected Net Present Value over Investment (NPV/I) can be calculated as is considered in this study. The related steps are discussed in the following section.

2.1.1. Identification of the Interactions of ESCO in the ESC Market

A conceptual view of the ESC and the process are taken for converting a defined project between ESCO to tradable certificates, as illustrated in Figure 4.
The legislator requires the energy consumers to comply with specific energy standards. If they violate them, they must implement energy savings projects or pay a fine which will be reflected in the purchase of the ESC in the market that are supplied by ESCOs. If an energy saving project is performed by the ESCO and the supervisor of the market makes this verification, the ESCO will be able to supply the certificates during a determined time period by the regulator. First, by negotiation of ESCO and energy consumer, an energy saving project is performed, and based on the achieved saved energy, financial processes are performed to convert the saved energy into the tradable certificates. This involves paying a fee to financial institutions, which is a part of ESCO costs. Then, the financial institute issues certificates in the primary market at the base price and pays the received funds to the ESCO. After completion of the supply of certificates in the primary market, certificates will be exchanged in the secondary market. In fact, the first market is an auction market, where the price discovery is conducted under the supervision of the market observer to prevent unrealistic price fluctuations and the formation of a monopoly [26]. Then, in the second market, a matching between suppliers and buyers occurs. Finally, buyers of the certificates that are energy consumers who have violated the standards, will present the certificates to the legislator.

2.1.2. The ESCO Cash Flows

In Table 2, due to the discussion in the previous section, the input and output cash flows associated with ESCO and the required assumptions for applying the NPV are presented.
Finally, the net present value of the cash flows of ESCO is organized according to Equation (2).
NPV = t T ( V en , certi , t +   V en , sav ) ( C sec   C tr   C op   ) ( 1 + r ) t     C inv ,
where the input cash flows include the “revenue of the sold certificates— V e n , c e r t ” and the “reduced energy cost—Ven,sav”. The output cash flows include the “certificate issuance fee—Csec”, “certificates transaction cost—Ctr”, “Operational cost— C o p ” and the “Investment cost— C i n v ”.
The revenue that is obtained by selling the certificates is calculated as described in Equation (3).
V en , sec , i = [ E en , re , i E ^ en , op , i ]     A S     P ^ i     Q i , d ,
where E e n , r e ,   i and E ^ e n ,   o p ,   i represent the intensity of the energy carrier “I” consumption before and after the optimization, respectively. A s , P ^ i , and Q i , d also represent the activity level of energy consumer, the price of a unit of energy carrier “I” certificate and the demand for energy carrier “I” certificate (in format of percentage) in the market, respectively.
The revenue from the reduced energy cost is determined according to Equation (4), which is influenced by P i , s and is considered as the energy carrier price.
V en , sav ,   i = [ E en , re ,   i     E ^ en , op , i ]     A s     P i , s   .

2.1.3. The Major Risks That the ESCO Is Exposed to by Consideration of the Market Structure

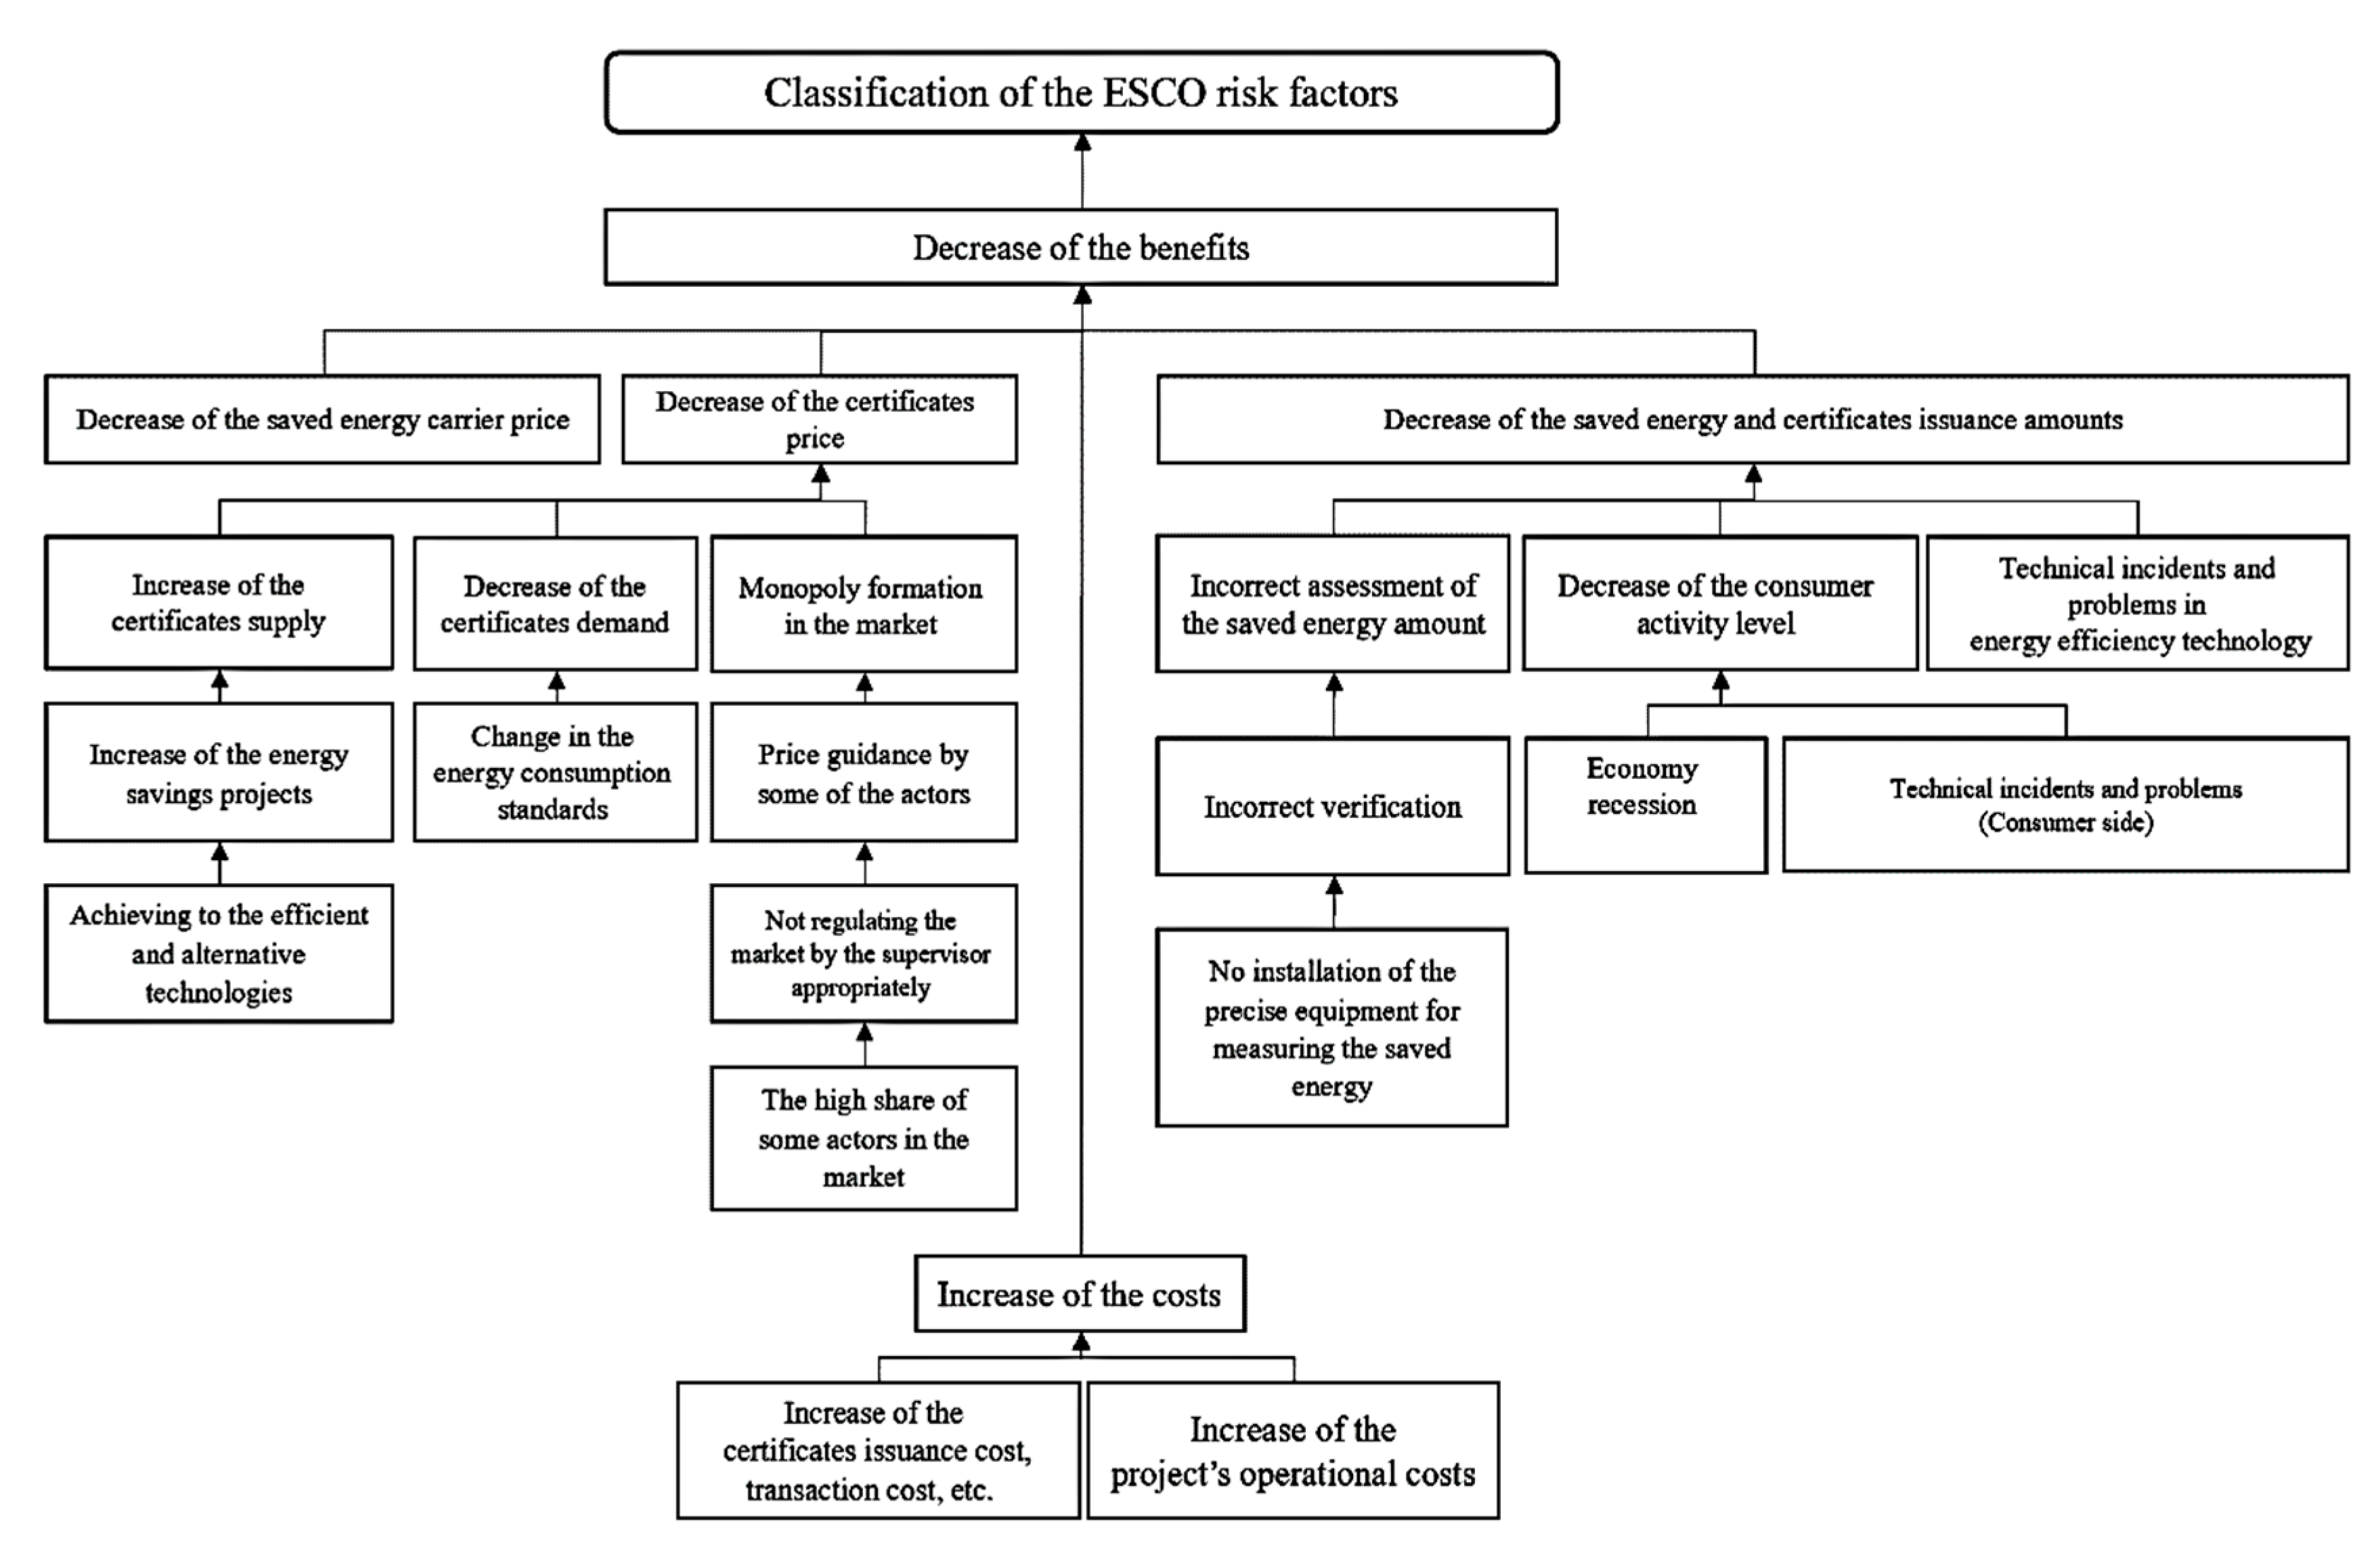
Identification of the risk factors in the ESCO business, requires organizing the factors that have an adverse effect on the ESCO net cash flow, which reduce the input cash flows or increase the output cash flows. Based on Equations (2)–(4), Figure 4, and related studies about the risk analysis of the energy performance contract [33,34], risk factors in the ESCO business are categorized and presented in Figure 5 by consideration of the ESC market structure.
From the benefit aspect, a decrease of the saved energy carrier price is one of the risk factors that can affect the benefit of ESCO, which is obtained from saved energy directly. Decrease of the certificates price is another risk factor that leads to loss of a part of the benefits that originates from selling the certificates in the market, which itself has three main sub-factors: increase of the certificates supply, decrease of the certificates demand, and monopoly formation in the market. Decrease of the saved energy and certificates issuance amount is another important risk factor. Incorrect assessment, decrease of the activity level (a portion of nominal capacity which is active), and technical accidents in energy efficiency technology, could be the main reasons behind the decrease. From the cost viewpoint, increase of the project’s operational costs as well as related costs to the market such as certificate issuance and transaction costs are the main risk factors. In light of what has been said above, in the next section, the discussed issues will be implemented within a case study.

2.2. Study Area

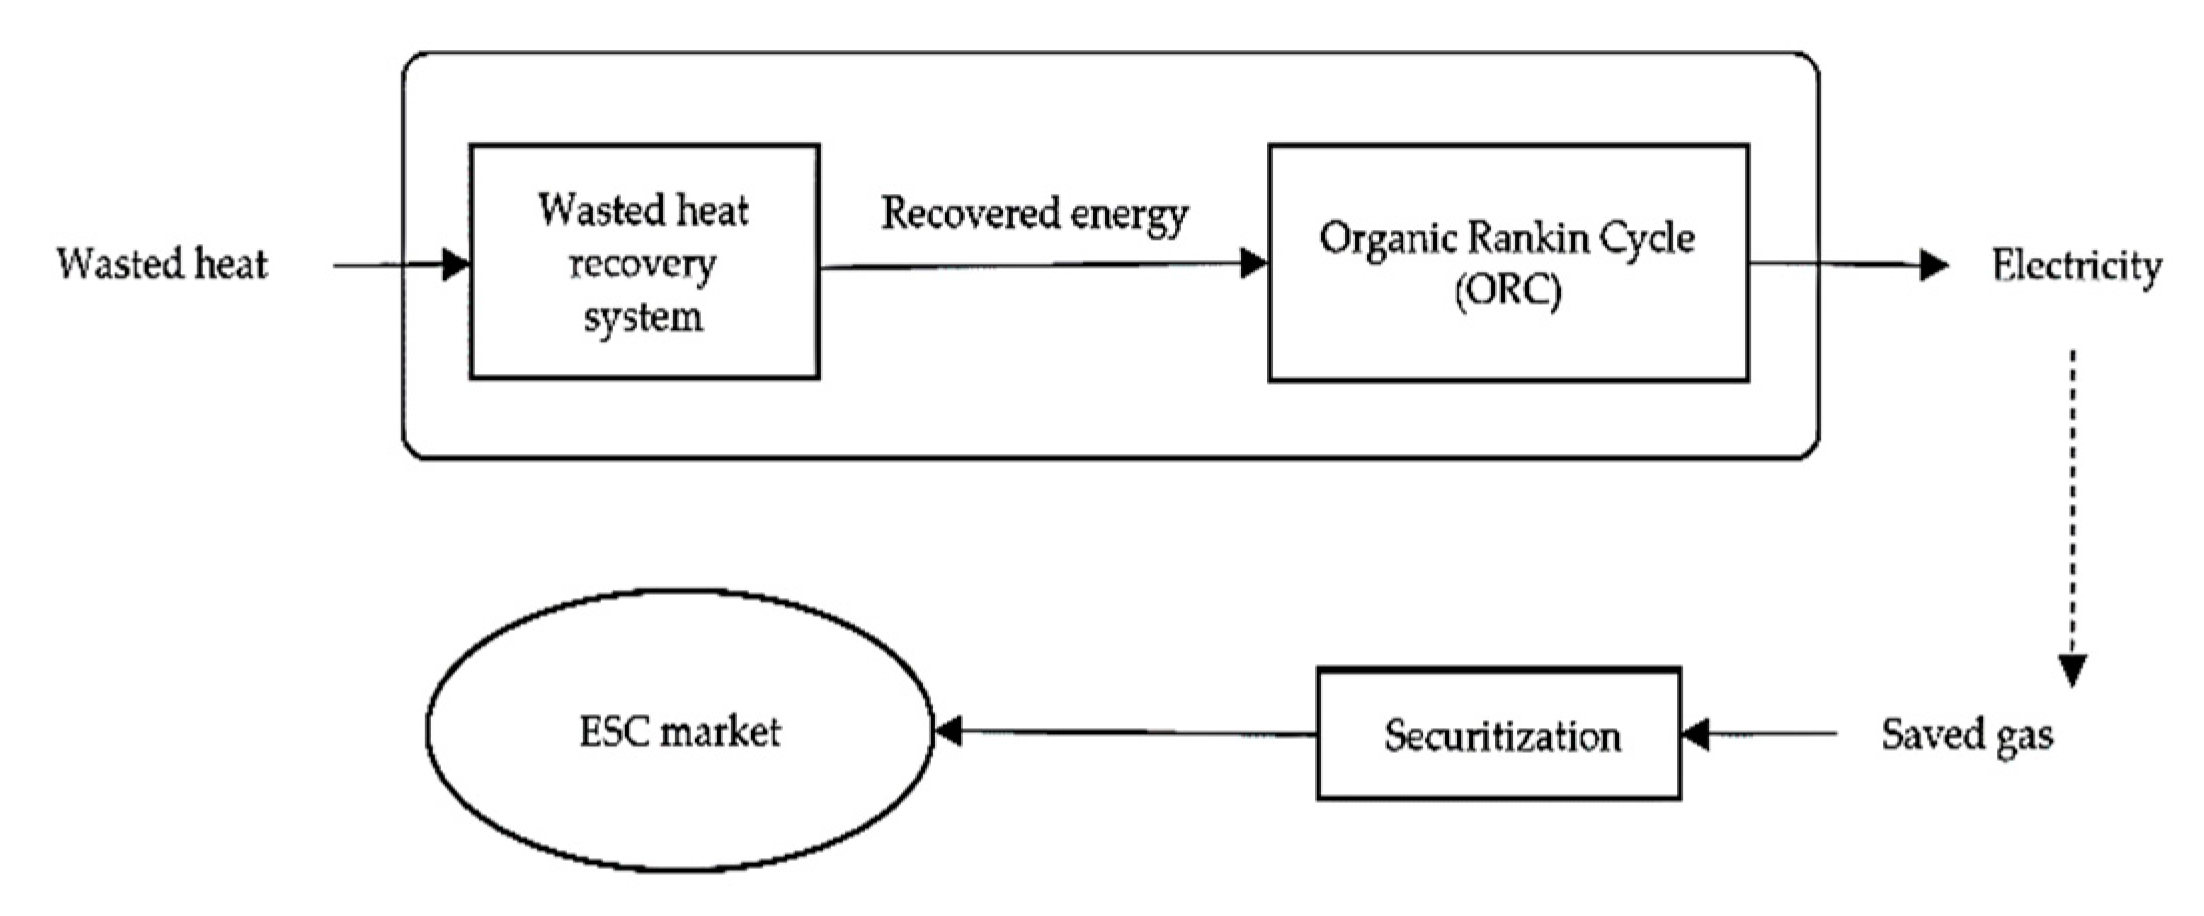
Determination of the appropriate time period for issuance of the certificates which ESCO supplies based on a performed project by Organic Rankine Cycle in Iran’s petrochemical industry is the case study of this article, as shown in the overview in Figure 6. By utilizing ORC technology and generating the electricity, methane gas consumption is reduced indirectly. Consequently, the ESCO, in addition to benefiting from the generated electricity, will be able to supply the certificates in the market equivalent to the amount of saved methane gas. To this end, ESCO will implement the ORC technology to convert the wasted heat to the electricity and under an EPC, will receive a portion of the benefits of the produced electricity. Then, since the produced electricity leads to less consumption of methane gas for electricity production, it is assumed that ESCO could supply the certificates in the ESC market based on the amount of saved methane gas from this viewpoint.
The reason that this case study is considered, is that Iran’s petrochemical industry is one of the main industries of Iran with considerable capacity [35,36] and due to the high rate of the low temperature heat flows in this industry [37], the implementation of ORC can result in the conversion of the significant amount of wasted heat to the electricity. However, the price of fuel methane gas in Iran’s petrochemical industry is less than 3 cents per cubic meter, which is symptomatic of a significant difference to the price of methane gas in well-known gas hubs such as Henry Hub and National Balancing Point (NBP), which is a virtual trading point in the United Kingdom for the trade of gas [38]. Because of this, heat recovery projects are considered high risk and uneconomical in the petrochemical industry of Iran. In addition to the low price of fuel methane gas, ORC technology is more expensive than other kinds of technologies for heat recovery such as Steam Rankine Cycle (SRC), which is another challenge in achieving the mentioned opportunity [39].
Asalouyeh is one of the main hubs of the petrochemical industry in Iran and also has large power plants, which is the area of study in this article. The National Iranian Gas Company (NIGC) is the gas supplier in Iran. Therefore, according to Figure 4, the National Iranian Gas Company and petrochemical agencies in Asalouyeh are considered as the supervisory authority and market participants, respectively. The petrochemical plants that use fuel methane gas more than the standard set by the legislator should purchase energy efficiency certificates from the market, which is supplied based on a performer methane gas saving project through the related concept in Figure 6 about ORC implementation in another petrochemical plant.
In fact, selling the certificate of saved methane gas in the ESC market is a way to increase the benefit and reduce the risk of ESCO for implementing the ORC technology. This is not justified only based on the benefits of produced electricity and that the certificate sale will be effective if the appropriate time period is determined for certificates sale by the market regulator. To this end, the explained steps in the methodology section should be taken. First, NPV is calculated based on the values of the involved variables through the following assumptions for a sensitivity analysis, then, after recognizing the main risk factors through sensitivity analysis, the probability distributions of the important risk factors are extracted for risk assessment and right time period determination for certificate sale.
  • Implementation of one MW ORC.
  • Investment cost equals 2000 dollars per kilowatt [40].
  • Construction period of one year and consideration of the benefit for 10 years.
  • The time period at which the ESCO sells the certificates and owns the generated electricity are considered equal (see Figure 2).
  • Electricity price in Asalouyeh equals 6 cents per kilowatt-hour (National Petrochemical Company (NPC), 2016).
  • Fuel methane gas savings of 0.28 cubic meters per a kilowatt-hour produced electricity.
  • Annual maintenance cost is considered 5% of the investment cost [40].
  • The activity level is considered 91% of nominal production capacity of a petrochemical plant per year, which is equivalent to 11 months of operation per year [41].
  • Discount rate equals 7.8% [42,43]. This discount rate is locally and in all different projects the discount rate must be established according to the local circumstances and it may vary from place to place. For example, if your local study is located in the United States and you are using this formula in April 2020, you have to consider the discount rate of 0.25%.
In addition to the assumptions mentioned above, the certificates price is another parameter which should be included in the calculations that can be assumed based on two points. The first point concerns a law that was enacted by Iran’s supreme council of energy in 2017 (NPC, 2017) in order to define the fundamentals of ESC market formation in Iran. This law is based on the energy subsidiaries and allows an ESCO to sell the saved energy carrier at a low price based on the highest price energy carrier in other sectors of energy systems to the consumers that have violated the standards. The second point is that in Iran’s petrochemical industry, the price of methane gas as fuel and feedstock are not determined similarly. Unlike the fuel methane gas, which has a fixed price as previously mentioned, the price of methane gas as feedstock is determined based on a formula, which is described by Equation (5) by simplification of the main formula that has been done by the authors. This issue causes the meaningful difference between the price of methane gas for these two kinds of consumption in such a way, by applying the expected price of oil and Henry Hub Gas in this equation, the expected price of feedstock methane gas will be 11.6 cent/M3, which means the price of feedstock methane gas is at least more than twice of the price of fuel methane.
Pr G ,   F , t   ( Cent / M 3 ) = 0.084     Pr oil , t   ( $ / bbl ) + 0.25     Pr HH , t   ( Cent / M 3 ) + 3.33 .  
Due to these points, the market is limited to the petrochemical industry in this study. Petrochemical plants that have violated the standards in consumption of the fuel methane gas, should buy the certificates that have been issued in the market based on an energy saving project in another petrochemical plant. The price of certificates is assumed equal to the price of feedstock methane gas as in Equation (5). Table 3 presents the calculated NPV based on the considered assumptions.
By considering Table 3 and Equations of Section 2.1.2, three factors encompassing the activity level of the consumer, the electricity price and the certificates price are considered to be applied by their probability distributions in the NPV function since these factors are the most important factors which affect the value of benefits and cost in Table 2. The results of the sensitivity analysis in Table 4 shows how the NPV is influenced by these factors and therefore, their probability distributions should be extracted for required calculations of risk assessment.

2.2.1. Probability Density Distribution of the Certificates Price

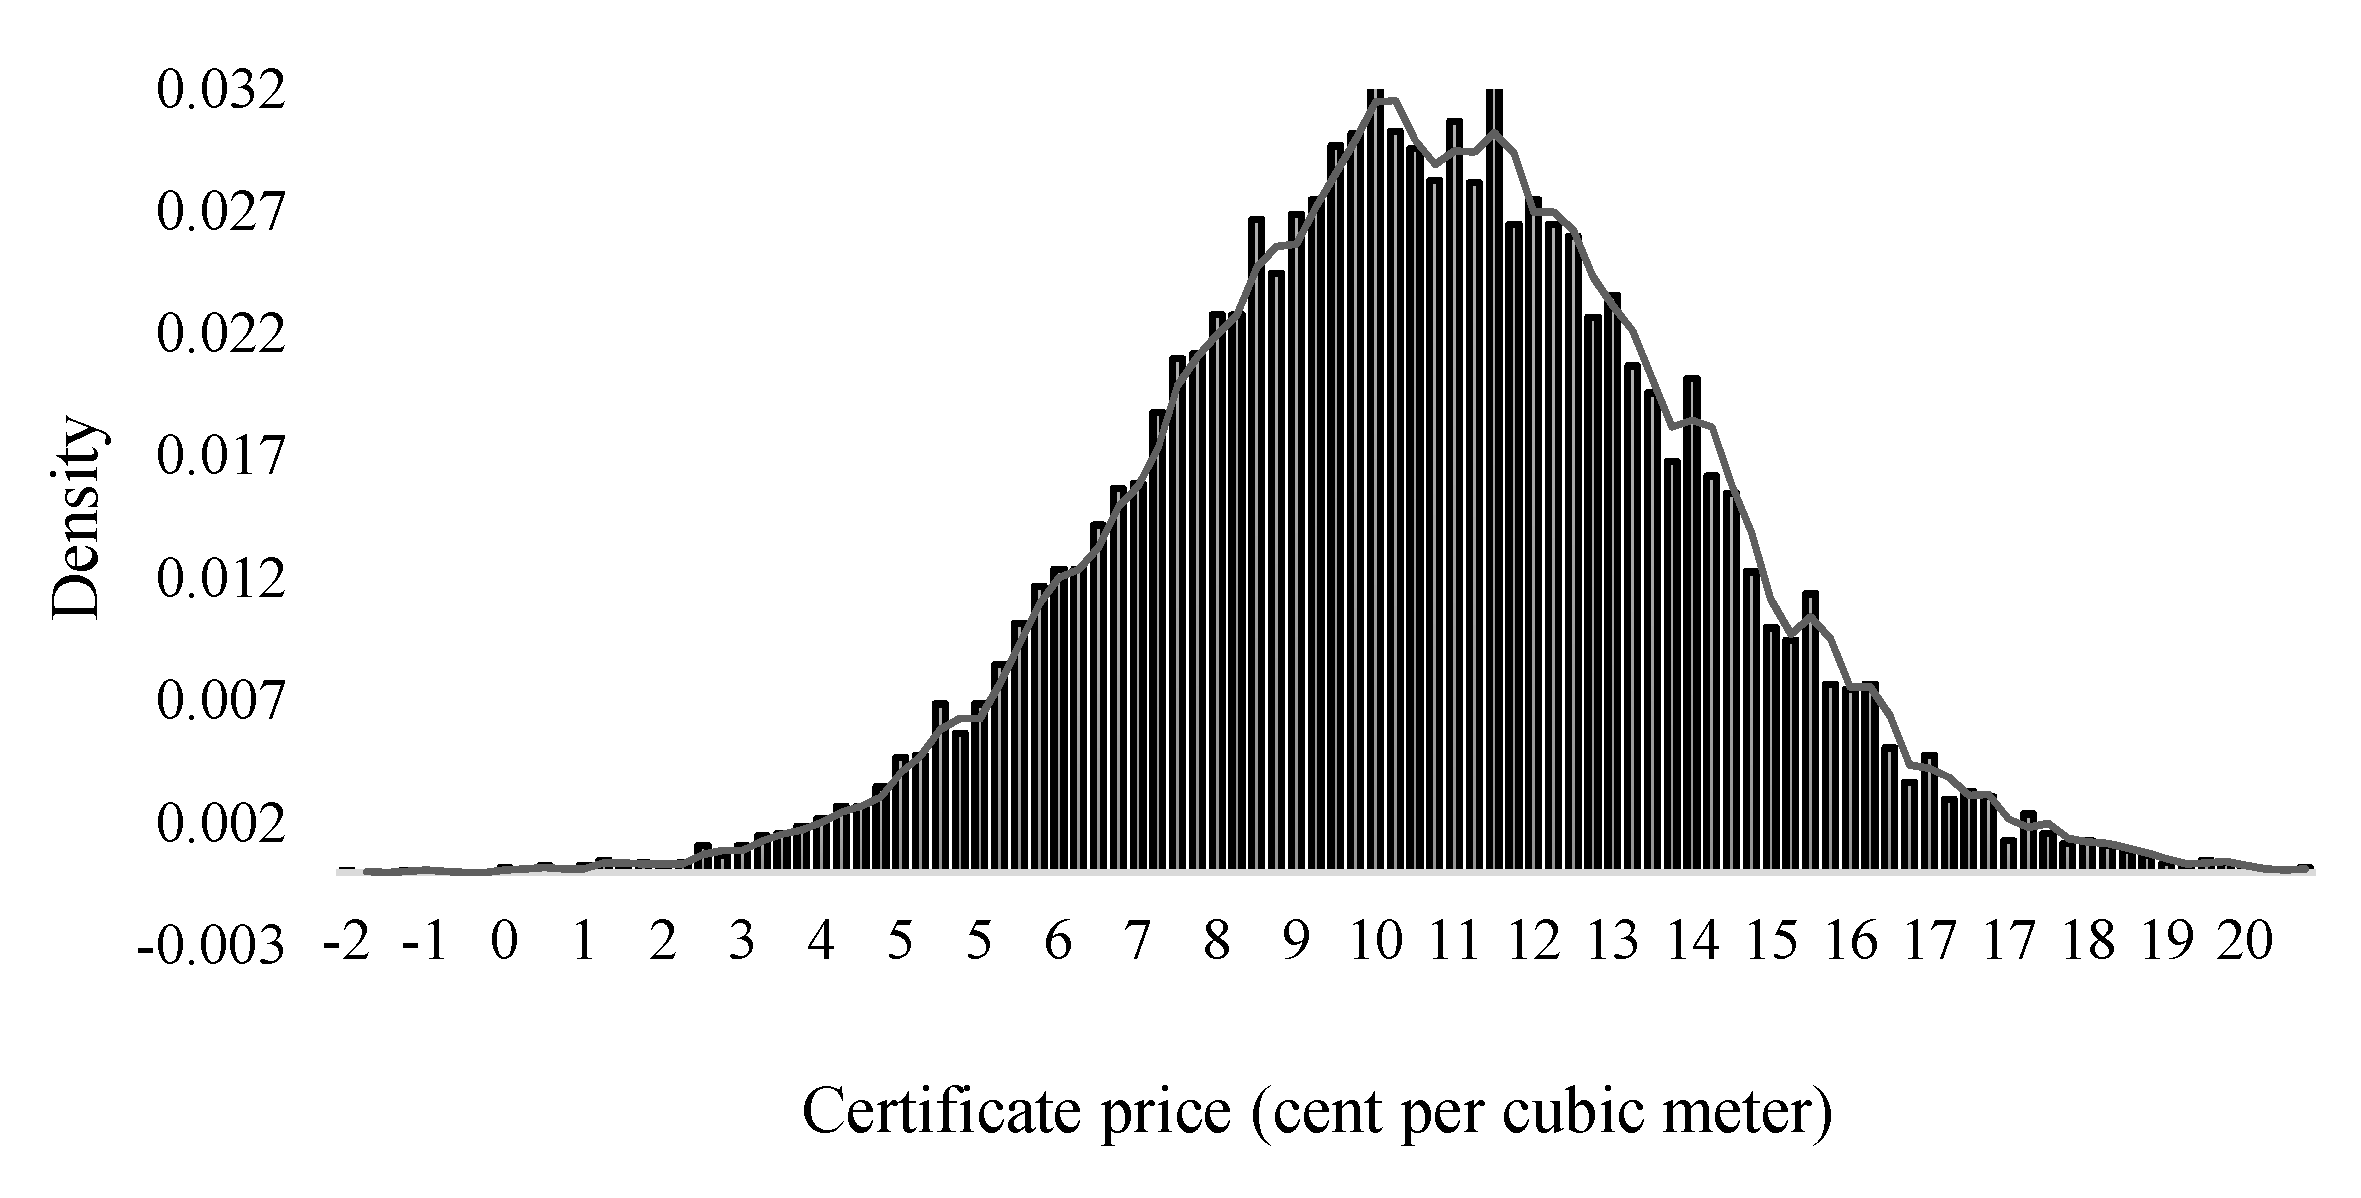
It is assumed that the certificates price is equal to the feedstock methane gas of Iran’s petrochemical industry, which is determined based on Equation (5), by applying the probability density distribution of Henry Hub gas price ( Pr HH , t ) and historical oil price ( Pr oil , t ) from the U.S. Energy Information Administration (EIA) in Equation (5) (considered to be normally distributed). The probability density distribution of the certificates price are obtained, as shown in Figure 7, and will be considered for calculating the benefit of ESCO form selling the certificates that are supplied based on saved methane gas.

2.2.2. Probability Density Distribution of the Activity Level

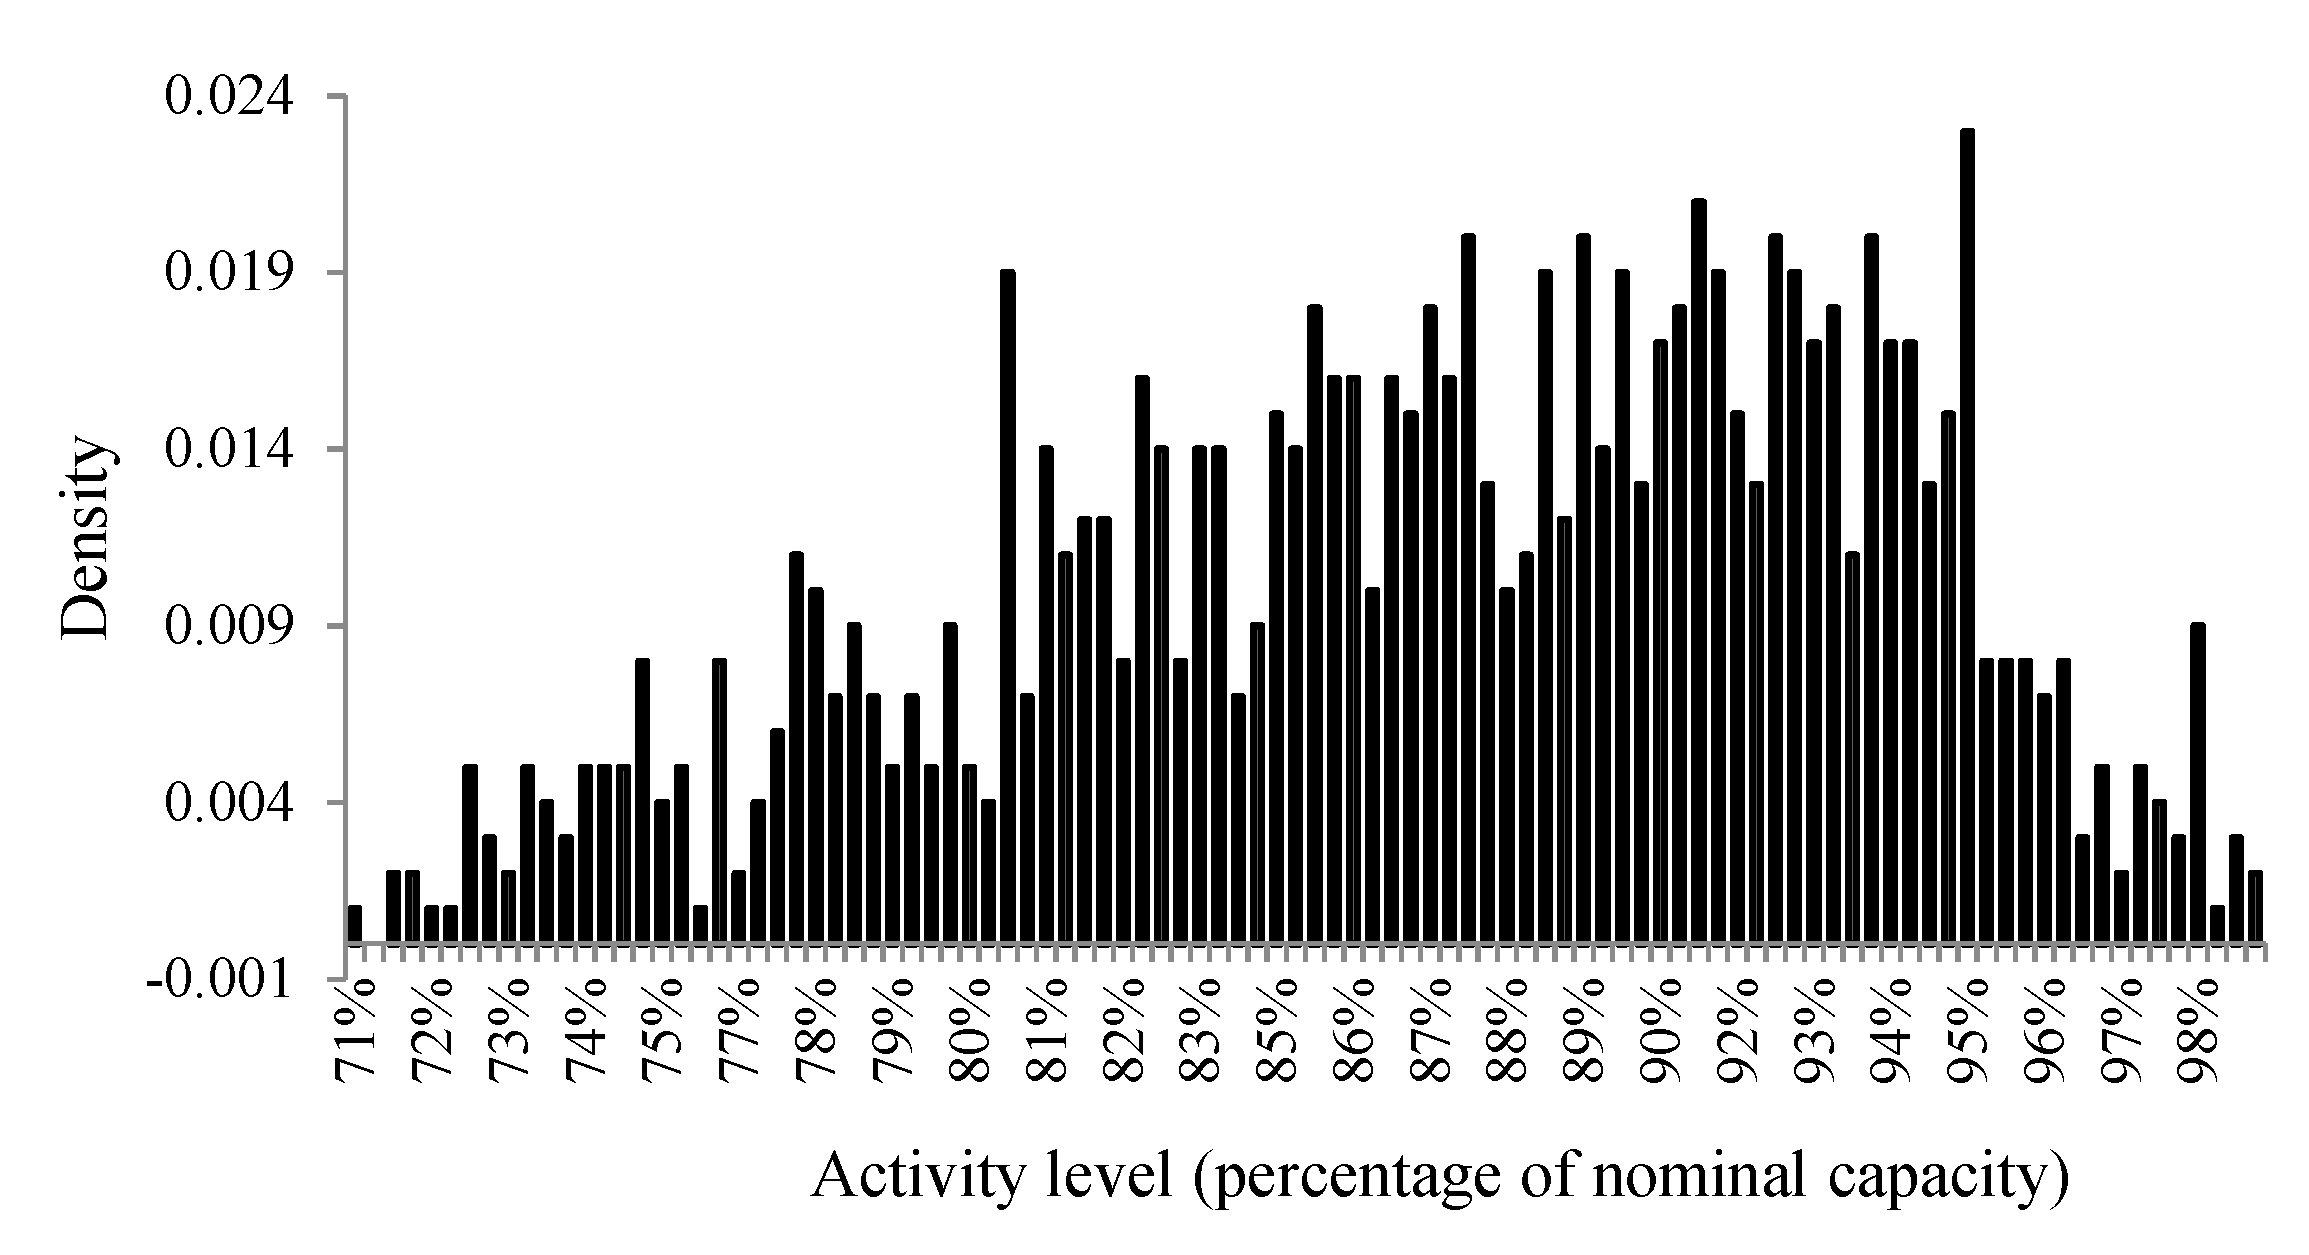
In petrochemical plants, one month of the year (91% of the nominal production capacity) is typically allocated for an overhaul that can be shorter or longer depending on the required technical and repair actions [41]. This means that minimum, most likely, and maximum of the activity level are 0%, 91.6%, and 100% of the nominal production capacity. Since the minimum, most likely, and maximum quantities are the fundamentals of creation of triangular distribution as well as their magnitudes are for activity level, this kind of distribution was considered for extraction of the probability distribution of the activity level. The extracted probability density distribution of the activity level is shown in Figure 8. Therefore, by including the activity level of the petrochemical plant in the calculations, the amount of saved methane gas will be determined since the amount of wasted heat and subsequently saved methane gas is proportional to the activity level of petrochemical plant. Then, both of the benefits of ESCO which originates from produced electricity and sold certificates will be calculated. (see Equations (4) and (5))

2.2.3. Probability Density Distribution of the Electricity Price

The electricity price for Iran’s petrochemical plants is determined by the government with a formula that increases the electricity price annually based on the Equation (6), which is simplified by the authors and states the annual growth of the electricity price.
G elec , t = 0.015     IF t ,
where G elec , t states the annual growth of the electricity price and IF t is the annual inflation rate.
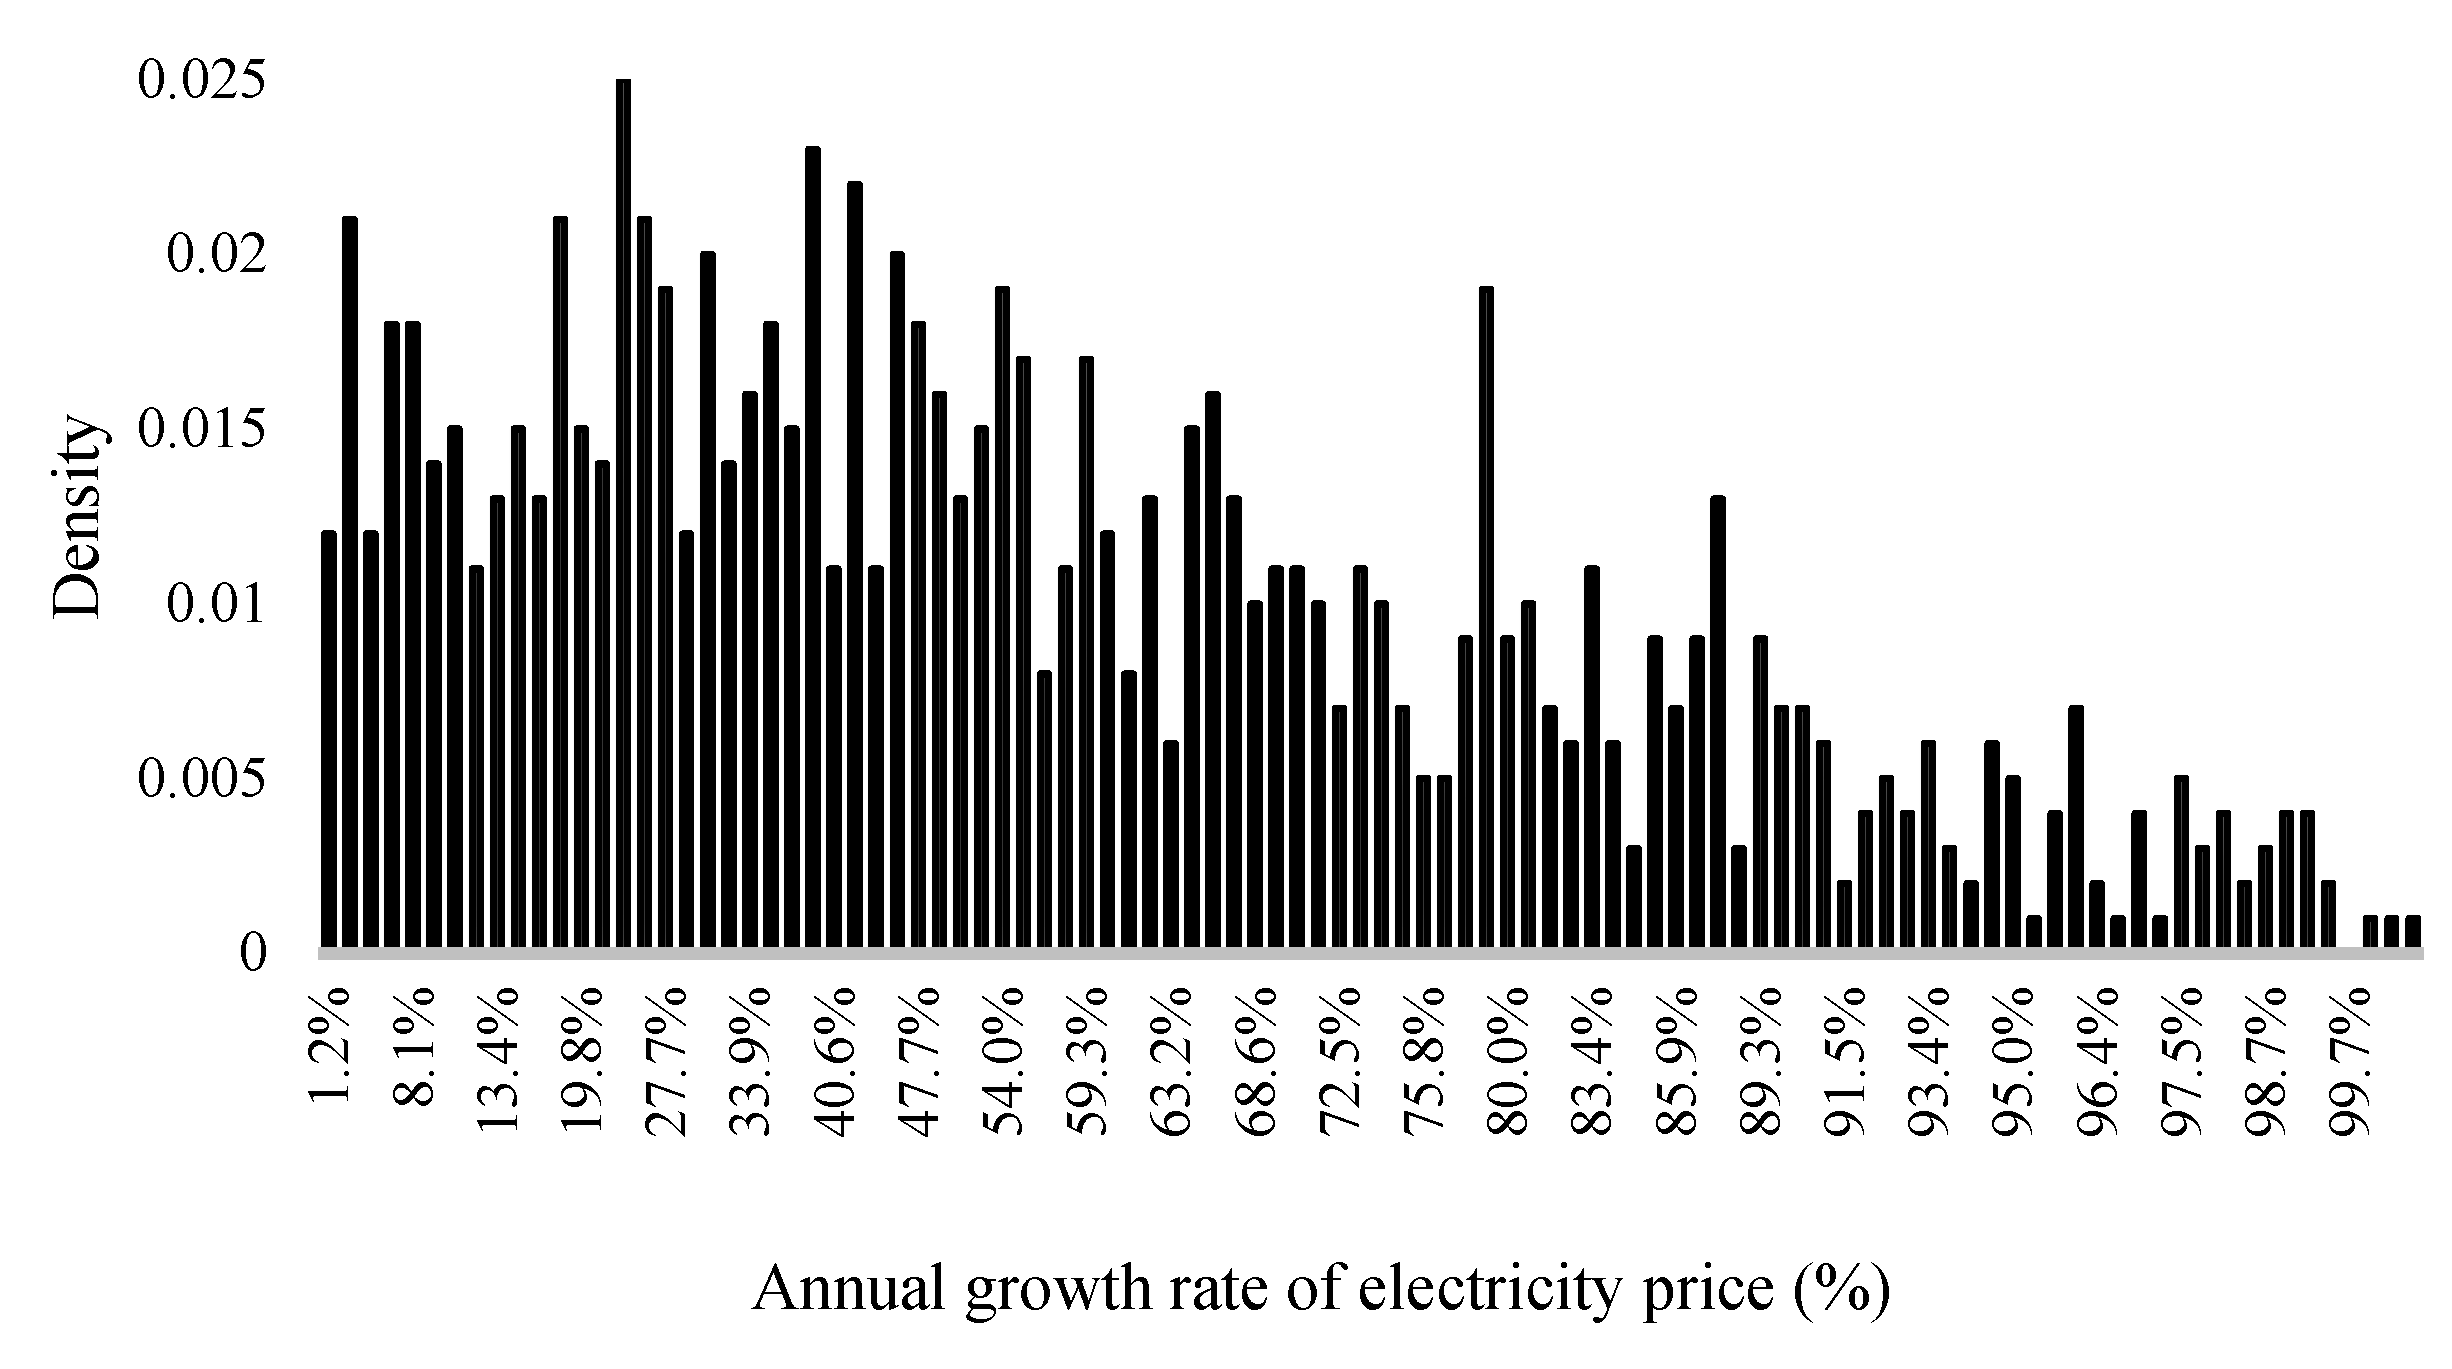
Then, by applying the probability density distribution of the IF based on its historical data due to the information of the statistical center of Iran, the probability density distribution of the annual growth of electricity price is achieved, as shown in Figure 9. Then, multiplying the probability density distribution of the annual growth of electricity price by the present electricity price will lead to the probability density distribution of the electricity price in the next years and will be used in the calculations in the considered period.

3. Results and Discussion

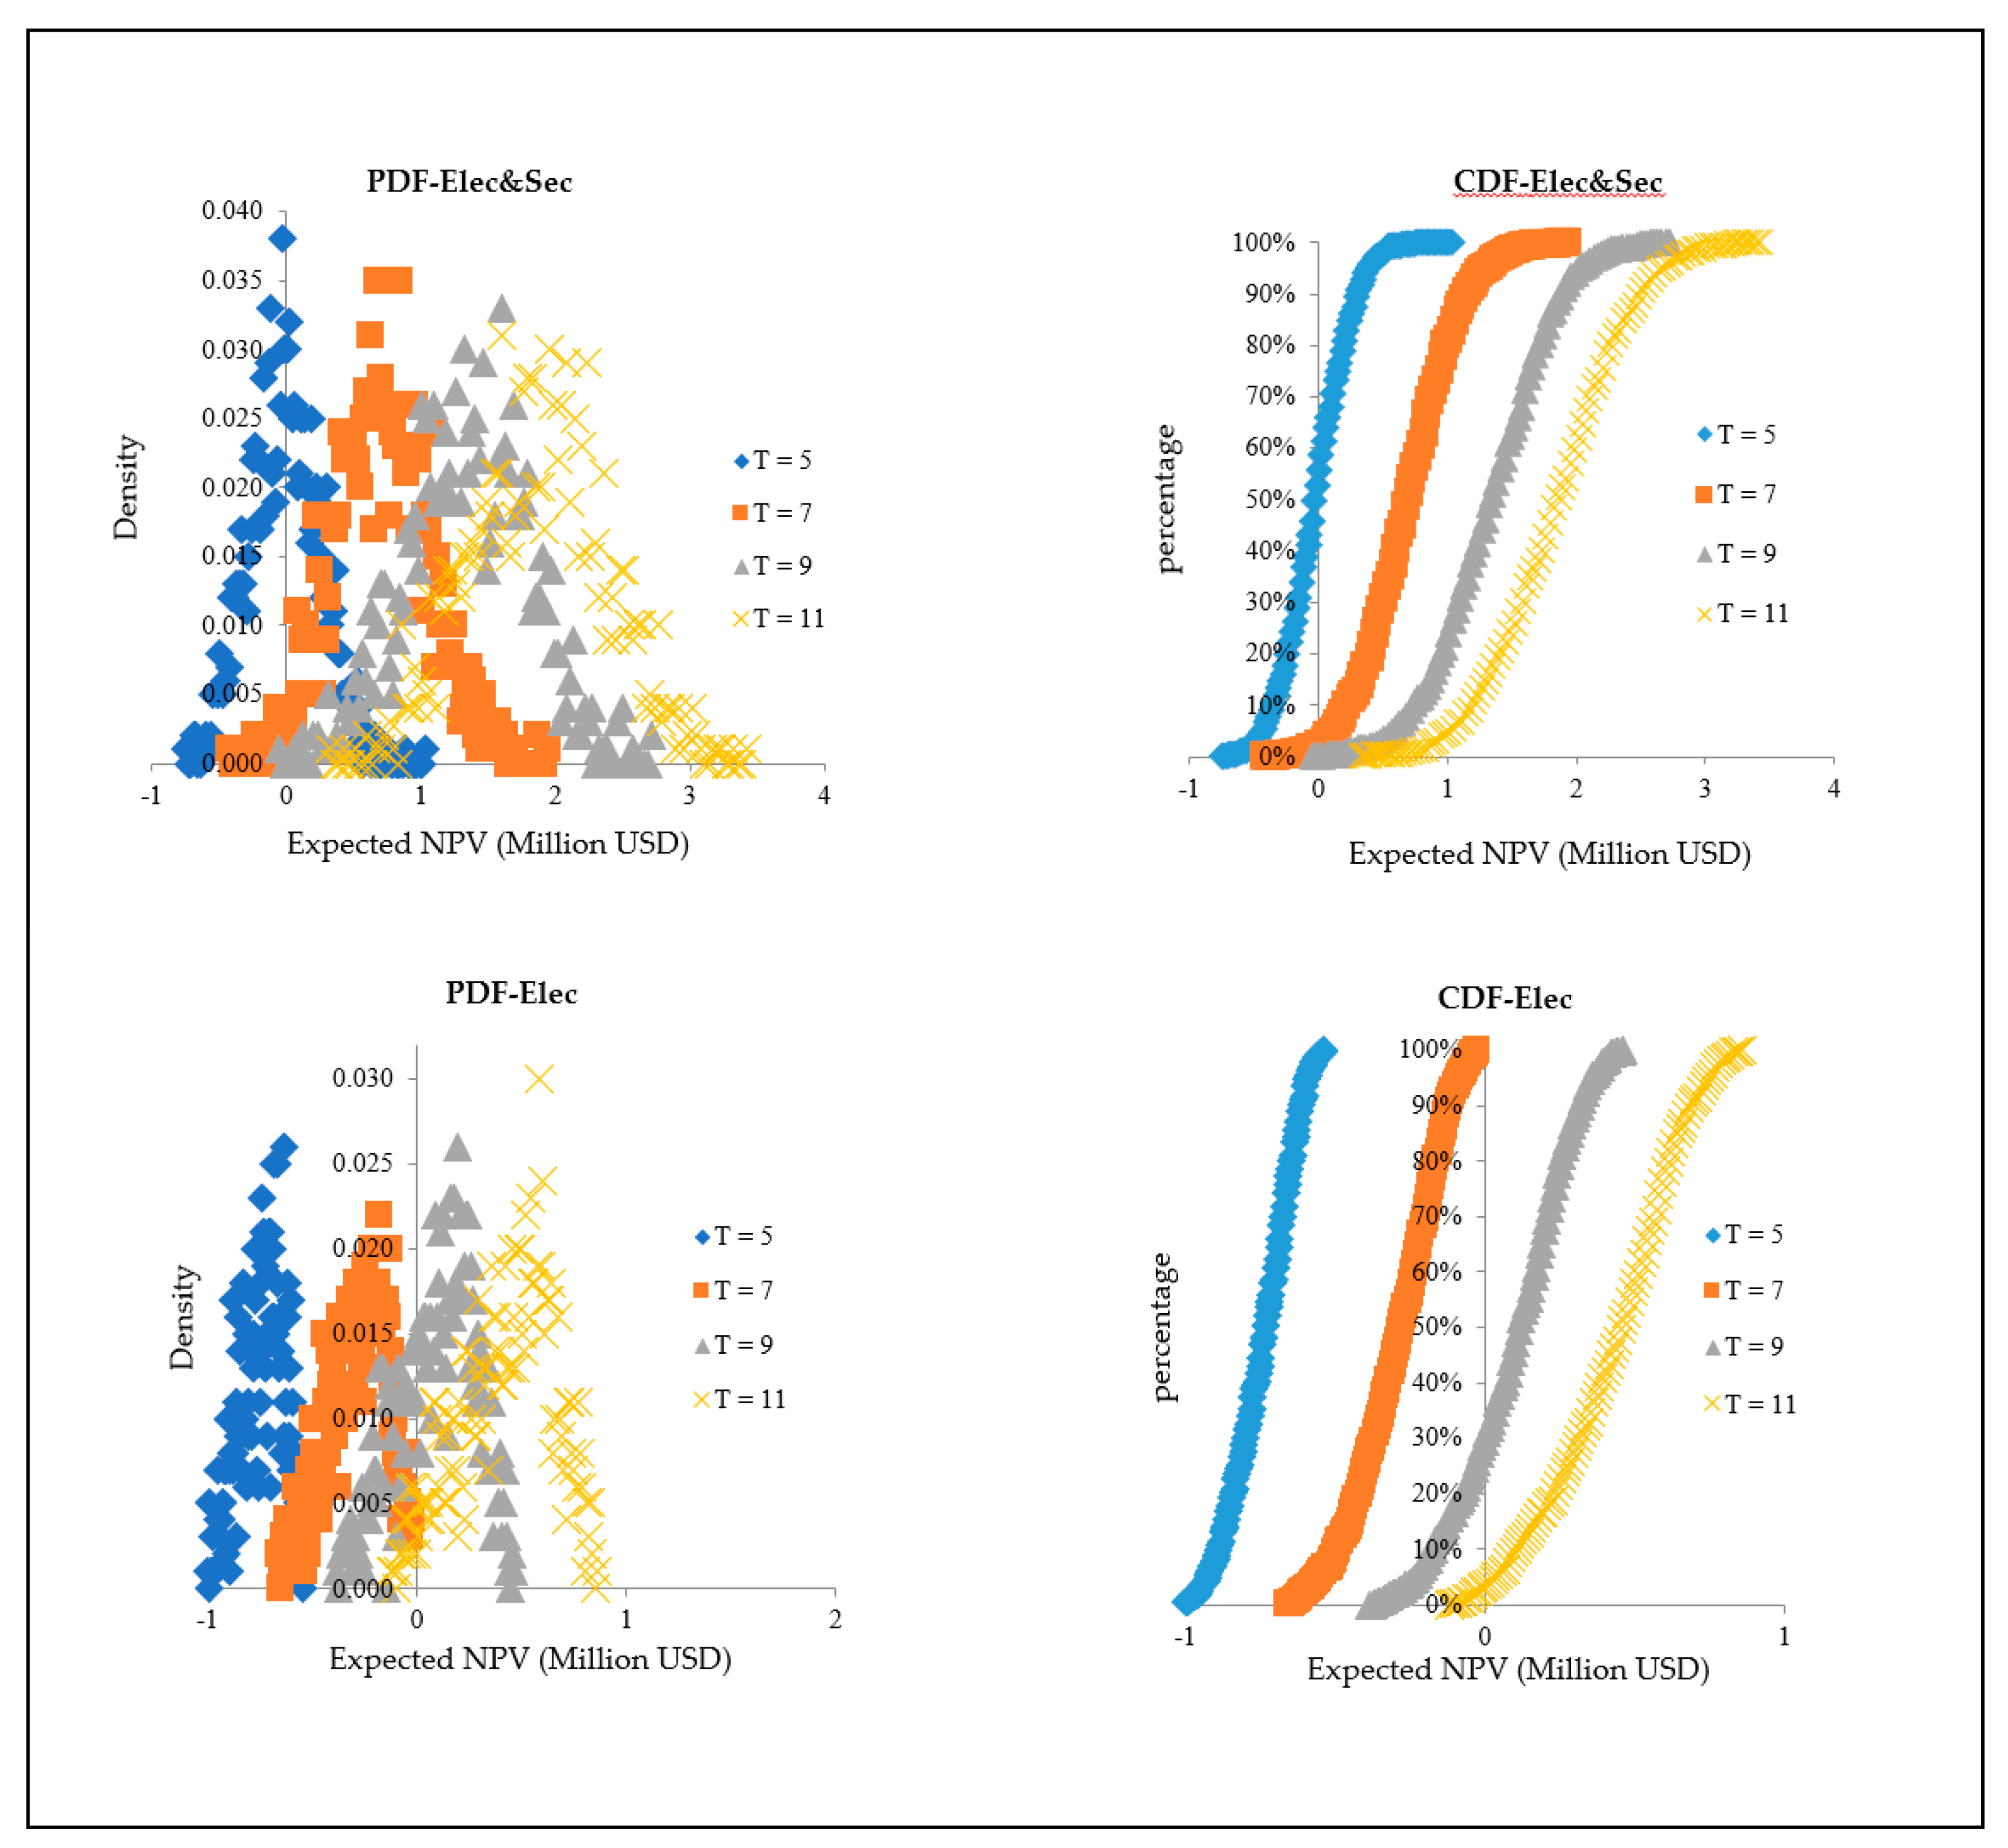
By applying the extracted probability density distributions and related assumptions in the NPV function, the probability distributions of the NPV in both density (PDF) and cumulative (CDF) forms are obtained, as presented in Figure 10.
The upper graphs represent the case which ESCO benefit was just obtained based on the produced electricity (Elec), but in the lower graphs, the benefit of the sold certificates has been included as well (Elec&Sec). The calculations have been done during the periods of 5, 7, 9, and 11 years as the periods that the ESCO is allowed by the regulator to sell the certificates in the market. The shift of the probability distributions to the right in the lower graphs compared with the upper graphs, indicates the considerable effectiveness of the certificates sale on risk reduction that is expressed by the numerical criteria in Table 5.
So, now the important issue is to find the appropriate time period that should be specified by the market regulator for selling the certificates. For this purpose, the following two cases have been compared for different time periods.

3.1. Non-Consideration of the Benefit of the Energy Efficiency Certificates

During the periods of five and seven years, there is no chance of achieving positive NPV. Even reducing the consequences of uncertainties will not lead to positive NPV for these periods since the maximum values are negative. During the periods of 9 and 11 years, the probability of achieving positive NPV are 71.6% and 96.7% with the expected value of 0.1 and 0.43 million dollars for the NPV, respectively. However, according to the investment cost that was expressed in the assumption section (2 million dollars for a 1 MW capacity), the magnitude of NPV/I is not appropriate in these intervals as it is less than 1.0. So, the implementation of ORC technology in Iran’s petrochemical industry is not justifiable without consideration of the benefit of certificates based on the related assumptions.

3.2. Consideration of the ESC Market Benefit

If the benefit of the ESC market is added to the benefit of the generated electricity, there would be a probability of achieving positive NPV during all the periods of 5, 7, 9, and 11 years. The probability of achieving positive NPV during the periods of 5 and 7 years are 44% and 99.1%, respectively, and during the periods of 9 and 11 years, it will be carried out with certainty due to the considered assumptions in the calculations. The expected value of NPV during the periods of 5, 7, 9, and 11 years are −0.02, 0.71, 1.34, and 1.87 million dollars, respectively, which are better from the NPV/I viewpoint compared to the case where the certificates sale is not considered.
Although the expected NPV/I increased considerably by the benefit of certificates, it is less than the one in the mentioned time periods. This means, the market regulator or ESCO should perform other actions to improve it further. As mentioned at the beginning of the article, an ESCO should remain motivated to try for better solutions such as developing more cost-effective technologies, and because of this, the market regulator should make a decision to include or not include more support by consideration of how the risk in ESCO projects changes by implementation of the different risk management methods that ESCO or market regulators can implement. So, if the ESCO is able to manage the risk by practical and exceptional solutions, it is better that more supports are avoided. Otherwise, the regulator can consider more supports such as setting the floor price for certificates to limit its price volatility.
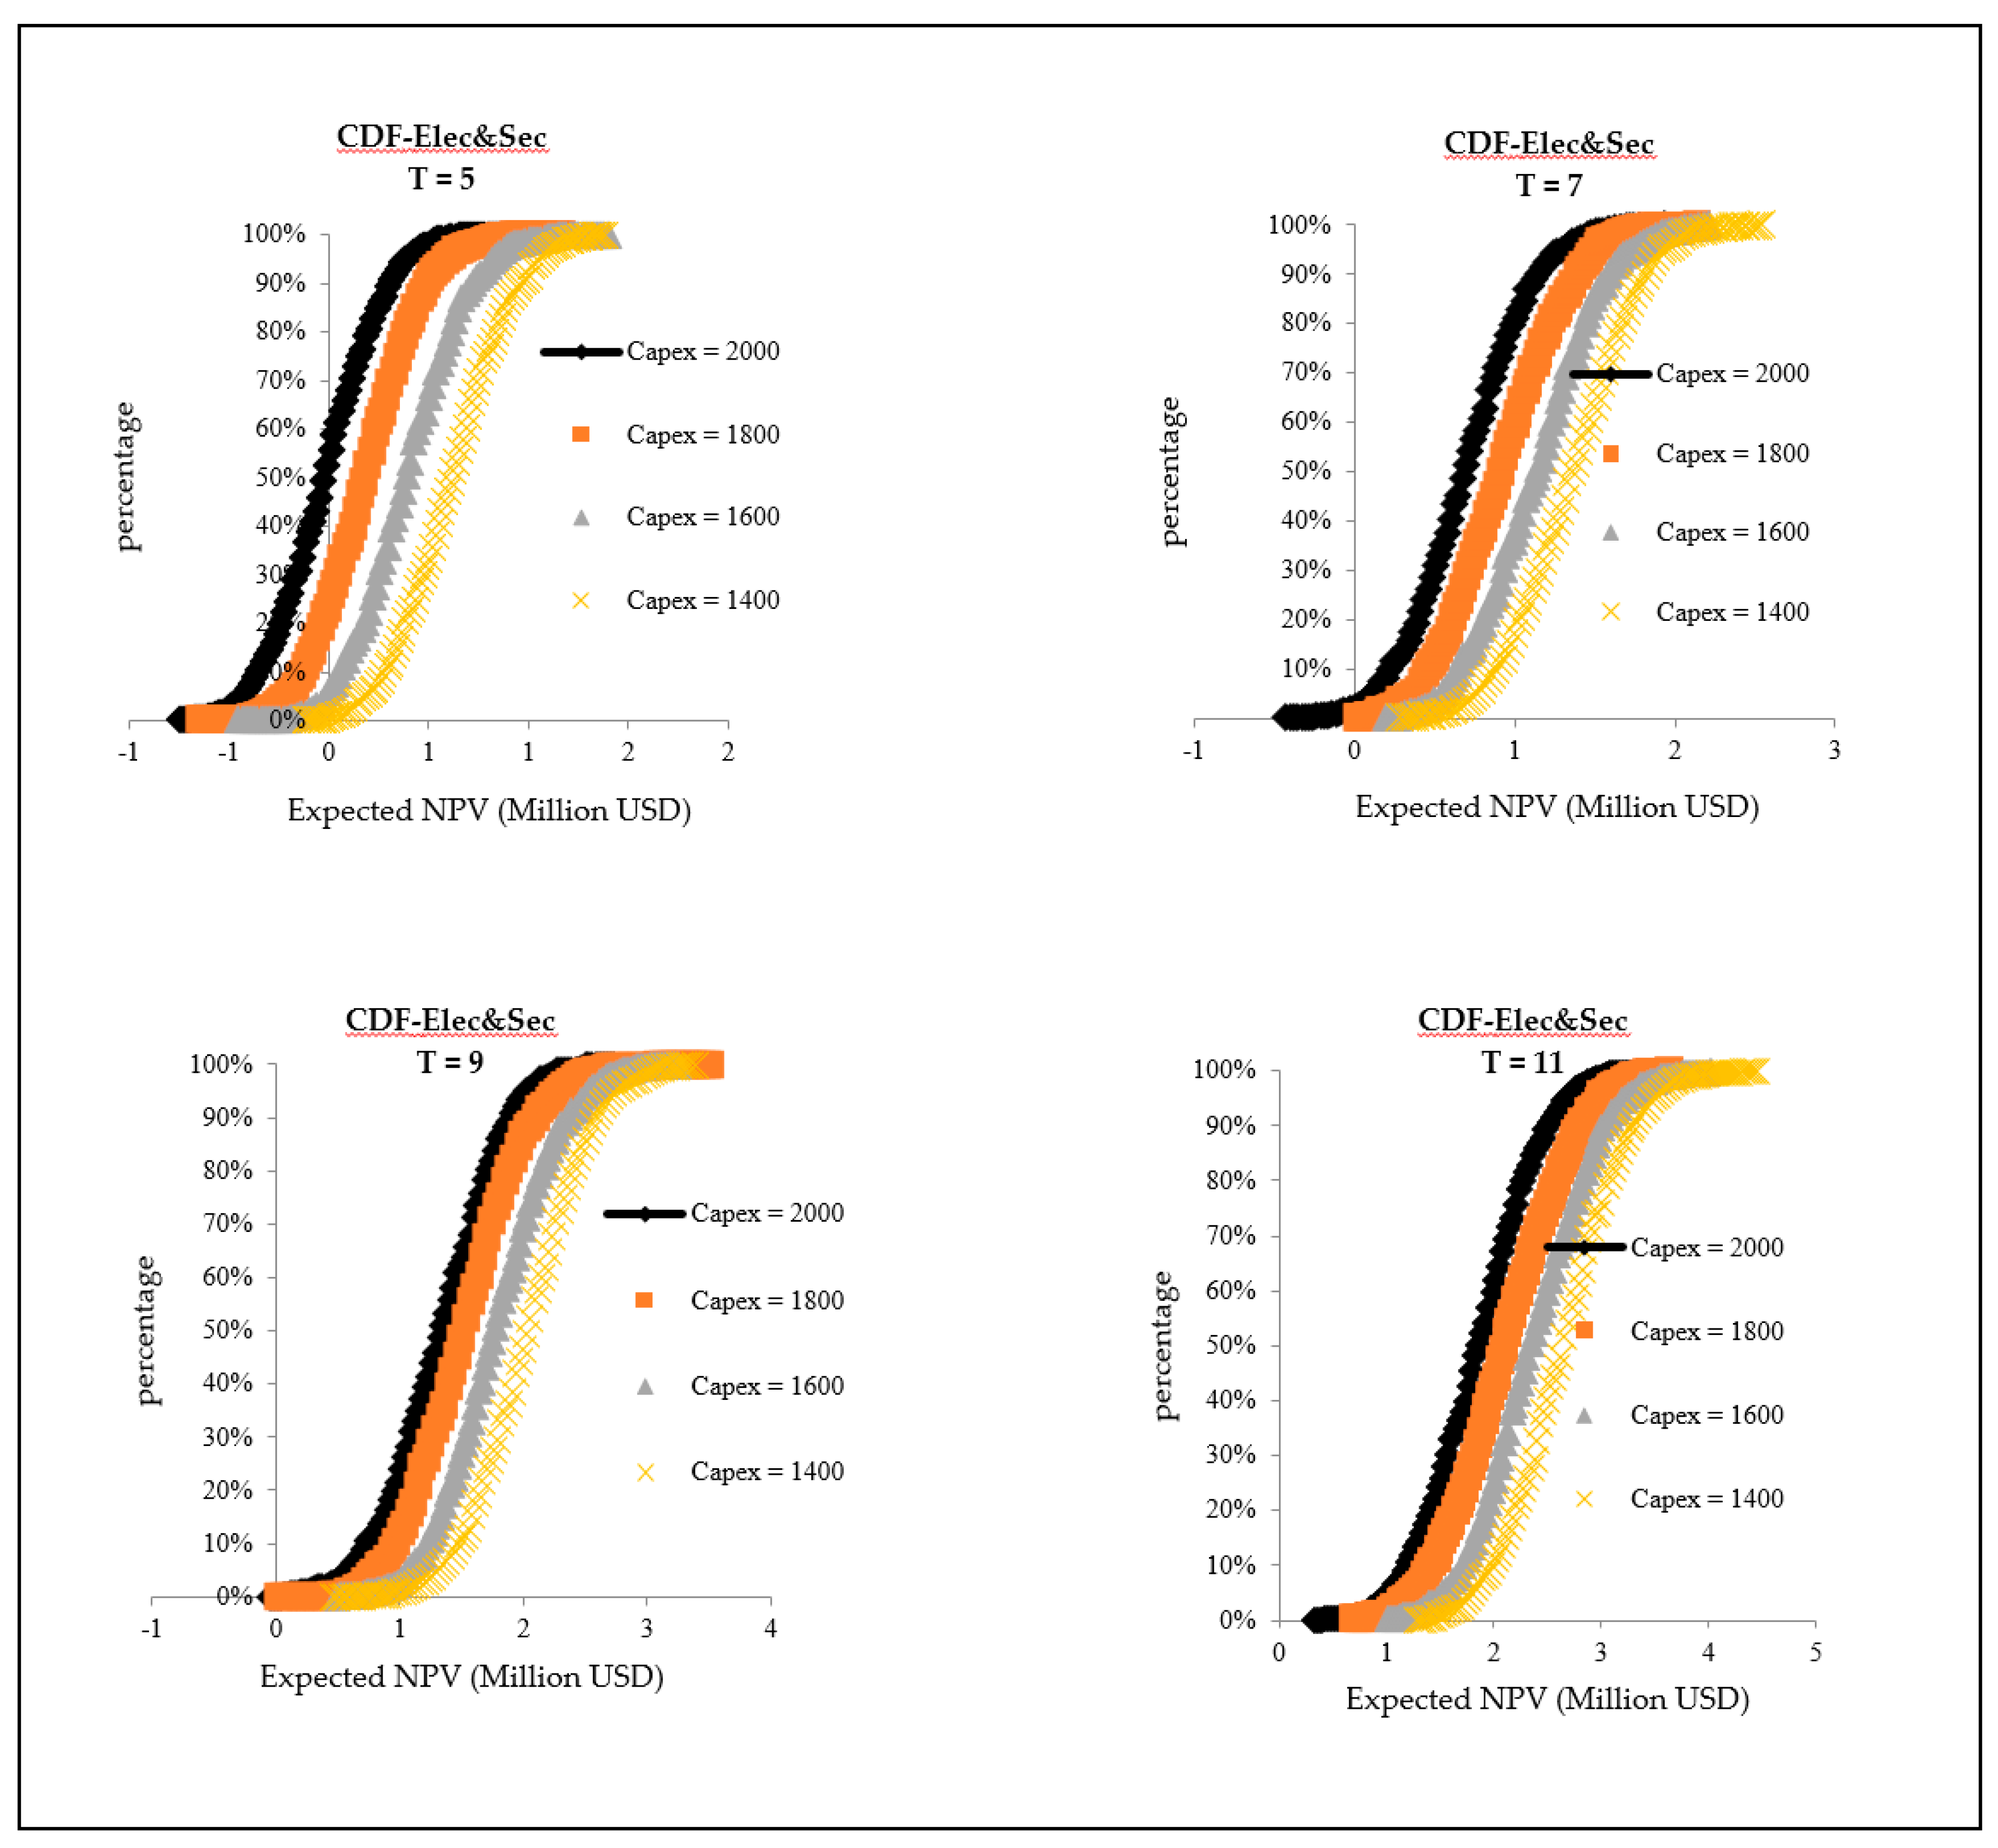
In this study, the effect of the reduction of the investment cost of ORC is analyzed as a risk management action of ESCO and is shown in Figure 11. To investigate this issue, 10%, 20%, and 30% reduction in the investment cost of ORC were applied. The investment cost was considered $2000 per kilowatt in the assumptions that it will be $1800, $1600, and $1400 per kilowatt in these cases, respectively.
With a 30% reduction of the investment cost, the expected value of NPV during the periods of 5, 7, 9, and 11 years will be $0.62 M, $1.37 M, $2.04 M, and $2.65 M, respectively, which leads to a value for NPV/I that is more than one during the 7 and 9 year periods. So, if the regulator determines that this amount of the reduction of investment cost is achievable by the ESCO, then it can determine the right time period by consideration of this issue. It is notable that the recognition of the possibility of reduction of investment cost could be done by analyzing the related issues to the technology such as the historical cost curve of the technologies by the experts.

4. Limitations

The model in this study was developed based on the fundamentals of energy savings certificate market and ESCO business model. Then, usability of the model was validated using data from Iran’s petrochemical industry as well as limiting the market’s main players to this industry. Additionally, we made simplifications and generalizations of the equations and data, as in any other modeling study. Although developed model does not exactly reflect the real system, it is an appropriate approximation and approach for the market regulator to make decision about ESCO for determining the time period for certificates sale, which will be more accurate if more comprehensive data are included in the model.

5. Conclusions

Due to the ESCO business model, which is based on the energy performance contract, its benefit is dependent on the amount of the saved useful energy. This issue involves different uncertainties in the ESCO business that other kinds of energy suppliers such as final energy suppliers do not face normally. So, if the ESCO is supposed to be supported, risk reduction in its business should be considered as the main criterion. Regarding this issue, in this study, a risk assessment model of ESCO was developed to enable the ESC market regulator to determine the appropriate time period for ESCO to sell its certificates in a way that leads to rational risk reduction. The effectiveness of the developed model was assessed by implementation with an energy saving project based on the ORC technology in Iran’s petrochemical industry and by the consideration of different time period effects on the risk reduction in the ESCO project.
Results indicated that the model provides the appropriate decision-making insight for the market regulator to analyze the effects of its decisions from the risk viewpoint in the ESCO project. More importantly, the market regulator can analyze the effects of the risk management actions of an ESCO to limit the support to allow the ESCO to stay motivated for developing better solutions for a energy efficiency project, which is equal to optimal allocation of financial resources that ESCO receives by selling the certificates. In this case, ESCO’s project such as implementation of ORC technology in Iran’s petrochemical industry will be justified from risk and economic viewpoints and will subsequently lead to methane gas saving in this industry, which is currently consumed by low price and considerable wastes.

6. Recommendations and Future Works

In this study, some of the important uncertainties were considered in the calculations since the analysis of usability and the approach of the model was the main priority of this study. In the next studies, the other mentioned uncertainties in Figure 5 can be included with more details. For example, the effective factors on the certificates price such as monopoly can be modeled and included in the calculations. The more consideration of uncertainty in the risk assessment leads to more effective decisions by the market regulator. Additionally, the market regulator should consider the differences between the uncertainties that are controllable and uncontrollable by the ESCO, which is important for determining the time period. For instance, the price fluctuation is not under the control of ESCO and the market regulator can set a minimum price for limiting the decrease of the certificates price or provide infrastructures such as derivative instruments in the market for better risk management.
A furthermore point is the changes in the obligations of the players of a market such as the standards of the energy consumptions and the penalties for violating them, will have different effects on the market from distinct aspects such as certificates supply and price. So, for future studies, the related assumptions to the obligated parties can be included in the analysis of how they affect the market and subsequently their posed risk in ESCO projects.

Author Contributions

Conceptualization, M.A., M.H.; data curation, M.A., M.H., and S.S.; formal analysis, M.A., M.H., S.S., and H.K.; investigation, M.A., M.H.; methodology, M.A., M.H.; software, M.A., M.H., P.R., S.S., S.A., and H.K.; writing—original draft, M.A., M.H., and I.F.; writing—review and editing, M.A., M.H., P.R., S.S., S.A., H.K., and I.F. All authors have read and agreed to the published version of the manuscript.

Funding

Publication of this article was funded in part by the University of Florida Open Access Publishing Fund.

Conflicts of Interest

The authors declare no conflict of interest.

References

  1. Carvallo, J.P.; Murphy, S.P.; Stuart, E.; Larsen, P.H.; Goldman, C. Evaluating project level investment trends for the U.S. ESCO industry: 1990–2017. Energy Policy 2019, 130, 139–161. [Google Scholar] [CrossRef] [Green Version]
  2. Hochman, G.; Timilsina, G.R. Energy efficiency barriers in commercial and industrial firms in Ukraine: An empirical analysis. Energy Econ. 2017, 63, 22–30. [Google Scholar] [CrossRef] [Green Version]
  3. Uz, D. Energy efficiency investments in small and medium sized manufacturing firms: The case of California energy crisis. Energy Econ. 2018, 70, 421–428. [Google Scholar] [CrossRef]
  4. Hansen, S.J.; Langlois, P.; Bertoldi, P. (Eds.) ESCOs Around the World: Lessons Learned in 49 Countries, 1st ed.; CRC Press: Boca Raton, FL, USA, 2009. [Google Scholar]
  5. Carbonara, N.; Pellegrino, R. Public-private partnerships for energy efficiency projects: A win-win model to choose the energy performance contracting structure. J. Clean. Prod. 2018, 170, 1064–1075. [Google Scholar] [CrossRef]
  6. Shang, T.; Zhang, K.; Liu, P.; Chen, Z. A review of energy performance contracting business models: Status and recommendation. Sustain. Cities Soc. 2017, 34, 203–210. [Google Scholar] [CrossRef]
  7. Lee, P.; Lam, P.T.I.; Lee, W.L. Risks in Energy Performance Contracting (EPC) projects. Energy Build. 2015, 92, 116–127. [Google Scholar] [CrossRef]
  8. Shad, R.; Khorrami, M.; Ghaemi, M. Developing an Iranian green building assessment tool using decision making methods and geographical information system: Case study in Mashhad city. Renew. Sustain. Energy Rev. 2017, 67, 324. Available online: http://www.sciencedirect.com/science/article/pii/S1364032116304956 (accessed on 21 March 2020). [CrossRef]
  9. Jozaghi, A.; Alizadeh, B.; Hatami, M.; Flood, I.; Khorrami, M.; Khodaei, N.; Ghasemi Tousi, E. A Comparative Study of the AHP and TOPSIS Techniques for Dam Site Selection Using GIS: A Case Study of Sistan and Baluchestan Province, Iran. Geosciences 2018, 8, 494. Available online: https://www.mdpi.com/2076-3263/8/12/494 (accessed on 21 March 2020). [CrossRef] [Green Version]
  10. Koosha, R.; Shahsavari, F. An Uncertainty and Sensitivity Analysis Tool for Building Thermal Energy Consumption: A Performance Comprehension of Static and Dynamic Response Analyses. American Society of Mechanical Engineers Digital Collection. 2019. Available online: https://nondestructive.asmedigitalcollection.asme.org/IDETC-CIE/proceedings/IDETC-CIE2019/59179/V001T02A077/1069690 (accessed on 21 March 2020).
  11. Franzò, S.; Frattini, F.; Cagno, E.; Trianni, A. A multi-stakeholder analysis of the economic efficiency of industrial energy efficiency policies: Empirical evidence from ten years of the Italian White Certificate Scheme. Appl. Energy 2019, 240, 424–435. [Google Scholar] [CrossRef]
  12. Vine, E.; Hamrin, J. Energy savings certificates: A market-based tool for reducing greenhouse gas emissions. Energy Policy 2008, 36, 467–476. [Google Scholar] [CrossRef]
  13. Duzgun, B.; Komurgoz, G. Turkey’s energy efficiency assessment: White Certificates Systems and their applicability in Turkey. Energy Policy 2014, 65, 465–474. [Google Scholar] [CrossRef]
  14. Aldrich, E.L.; Koerner, C.L. White certificate trading: A dying concept or just making its debut? Part I: Market status and trends. Electr. J. 2018, 31, 52–63. [Google Scholar] [CrossRef]
  15. Bertoldi, P.; Boza-Kiss, B. Analysis of barriers and drivers for the development of the ESCO markets in Europe. Energy Policy 2017, 107, 345–355. [Google Scholar] [CrossRef]
  16. Hatami, M.; Flood, I.; Franz, B.; Zhang, X. State-of-the-Art Review on the Applicability of AI Methods to Automated Construction Manufacturing. Computing in Civil Engineering; American Society of Civil Engineers: Atlanta, GA, USA, 2019; Available online: http://ascelibrary.org/doi/10.1061/9780784482438.047 (accessed on 16 March 2020).
  17. Kamalzadeh, H.; Hahsler, M. POMDP: Introduction to Partially Observable Markov Decision Processes. Package ‘pomdp’. 2019. Available online: https://rdrr.io/cran/pomdp/f/inst/doc/POMDP.pdf (accessed on 7 April 2020).
  18. Kouchesfehani, Z.K.; Tehrani, A.D.; Najafi, M.; Syar, J.E.; Kampbell, E. Adding Additional Reinforcement to Improve the Structural Performance of Spray Applied Pipe Lining Rehabilitation Technology: A Review. In Proceedings of the Pipelines 2019: Multidisciplinary Topics, Utility Engineering, and Surveying, Nashville, TN, USA, 21–24 July 2019; pp. 10–23. [Google Scholar]
  19. Blumberga, A.; Cilinskis, E.; Gravelsins, A.; Svarckopfa, A.; Blumberga, D. Analysis of regulatory instruments promoting building energy efficiency. Energy Procedia 2018, 147, 258–267. [Google Scholar] [CrossRef]
  20. A Guide to Energy Performance Contracting in Public Buildings. Available online: https://www.codema.ie/images/uploads/docs/A_Guide_to_Energy_Performance_Contracting_in_Public_Buildings.pdf (accessed on 30 March 2020).
  21. Morthorst, P.E. Interactions of a tradable green certificate market with a tradable permits market. Energy Policy 2001, 29, 345–353. [Google Scholar] [CrossRef]
  22. Farinelli, U.; Johansson, T.B.; McCormick, K.; Mundaca, L.; Oikonomou, V.; Örtenvik, M.; Patel, M.; Santi, F. “White and Green”: Comparison of market-based instruments to promote energy efficiency. J. Clean. Prod. 2005, 13, 1015–1026. [Google Scholar] [CrossRef]
  23. Bertoldi, P.; Huld, T. Tradable certificates for renewable electricity and energy savings. Energy Policy 2006, 34, 212–222. [Google Scholar] [CrossRef]
  24. Mundaca, L.; Neij, L.; Labanca, N.; Duplessis, B.; Pagliano, L. Market behaviour and the to-trade-or-not-to-trade dilemma in ‘tradable white certificate’ schemes. Energy Effic. 2008, 1, 323–347. [Google Scholar] [CrossRef]
  25. Mundaca, L. Transaction costs of Tradable White Certificate schemes: The Energy Efficiency Commitment as case study. Energy Policy 2007, 35, 4340–4354. [Google Scholar] [CrossRef]
  26. Zhang, B.; Xu, L. Multi-item production planning with carbon cap and trade mechanism. Int. J. Prod. Econ. 2013, 144, 118–127. [Google Scholar] [CrossRef]
  27. Kumar, R.; Agarwala, A. Renewable Energy Certificate and Perform, Achieve, Trade mechanisms to enhance the energy security for India. Energy Policy 2013, 55, 669–676. [Google Scholar] [CrossRef]
  28. De Ayala, A.; Galarraga, I.; Spadaro, J.V. The price of energy efficiency in the Spanish housing market. Energy Policy 2016, 94, 16–24. [Google Scholar] [CrossRef] [Green Version]
  29. Zaroni, H.; Maciel, L.B.; Carvalho, D.B.; de Pamplona, E.O. Monte Carlo Simulation approach for economic risk analysis of an emergency energy generation system. Energy 2019, 172, 498–508. [Google Scholar] [CrossRef]
  30. Lee, P.; Lam, P.T.I.; Lee, W.L. Performance risks of lighting retrofit in Energy Performance Contracting projects. Energy Sustain. Dev. 2018, 45, 219–229. [Google Scholar] [CrossRef]
  31. Moud, H.I.; Shojaei, A.; Flood, I.; Zhang, X.; Hatami, M.; Rinker, M.E. Qualitative and Quantitative Risk Analysis of Unmanned Aerial Vehicle Flights over Construction Job Sites. In Proceedings of the Eighth International Conference on Advanced Communications and Computation (INFOCOMP 2018), Barcelona, Spain, 22–26 July 2018. [Google Scholar]
  32. Kamalzadeh, H.; Ahmadi, A.; Mansour, S. A shape-based adaptive segmentation of time-series using particle swarm optimization. Inf. Syst. 2017, 67, 1. Available online: http://www.sciencedirect.com/science/article/pii/S0306437916302344 (accessed on 21 March 2020). [CrossRef]
  33. Jinrong, H.; Enyi, Z. Engineering Risk Management Planning in Energy Performance Contracting in China. Syst. Eng. Procedia 2011, 1, 195–205. [Google Scholar] [CrossRef] [Green Version]
  34. Wang, L.; Peng, J.; Wang, J. A multi-criteria decision-making framework for risk ranking of energy performance contracting project under picture fuzzy environment. J. Clean. Prod. 2018, 191, 105–118. [Google Scholar] [CrossRef]
  35. Shahmirzadi, H.E. Selecting an Appropriate Strategy to Increase Petrochemical Product Sales (Case Study: Iranian Petrochemical Industry). Bus. Manag. Stud. 2017, 3, 42–54. [Google Scholar] [CrossRef]
  36. Kamalzadeh, H.; Sobhan, S.N.; Boskabadi, A.; Hatami, M.; Gharehyakheh, A. Modeling and Prediction of Iran’s Steel Consumption Based on Economic Activity Using Support Vector Machines. arXiv 2019, arXiv:191202373. Available online: http://arxiv.org/abs/1912.02373 (accessed on 21 March 2020).
  37. Chen, Y.-P.; Sheng, Y.-J.; Dong, C.; Wu, J.-F. Numerical simulation on flow field in circumferential overlap trisection helical baffle heat exchanger. Appl. Therm. Eng. 2013, 50, 1035–1043. [Google Scholar] [CrossRef]
  38. Moshiri, S. The effects of the energy price reform on households consumption in Iran. Energy Policy 2015, 79, 177–188. [Google Scholar] [CrossRef]
  39. Vescovo, R.; Spagnoli, E. High Temperature ORC Systems. Energy Procedia 2017, 129, 82–89. [Google Scholar] [CrossRef]
  40. Mohammadi, K.; Mostafaeipour, A.; Dinpashoh, Y.; Pouya, N. Electricity Generation and Energy Cost Estimation of Large-Scale Wind Turbines in Jarandagh, Iran. J. Energy 2014, 2014, 1–8. [Google Scholar] [CrossRef] [Green Version]
  41. Duffuaa, S.; Ben-Daya, M. Turnaround maintenance in petrochemical industry: Practices and suggested improvements. J. Qual. Maint. Eng. 2004, 10, 184–190. [Google Scholar] [CrossRef]
  42. Daneshmand, A.; Jahangard, E.; Abdollah-Milani, M. A Time Preference Measure of the Social Discount Rate for Iran. Econ. Struct. 2018, 7, 29. Available online: https://journalofeconomicstructures.springeropen.com/articles/10.1186/s40008-018-0127-x (accessed on 16 March 2020). [CrossRef] [Green Version]
  43. Zhuang, J.; Liang, Z.; Lin, T.; Guzman, F.D. Theory and Practice in the Choice of Social Discount Rate for Cost-Benefit Analysis: A Survey; ADB Economics Working Paper Series, Asian Development Bank (ADB); Asian Development Bank (ADB): Metro Manila, Philippines, 2007. [Google Scholar]
Figure 1. The schematic view of the Energy Savings Certificates (ESC) market structure [13].
Applsci 10 02552 g001
Figure 2. The benefits of Energy Service Company (ESCO) and energy consumer from energy reduced cost and certificates sale [20].
Applsci 10 02552 g002
Figure 3. The steps for risk assessment of ESCO in this study (source: categorized by authors).
Applsci 10 02552 g003
Figure 4. The schematic view of the interactions of ESCO with other members of the ESC market (source: authors conception).
Applsci 10 02552 g004
Figure 5. Classification of the risk factors in the ESCO business by consideration of the ESC market (Source: authors classification).
Applsci 10 02552 g005
Figure 6. The schematic view of the certificate issuance process based on a performed project by ORC (Source: authors conception).
Applsci 10 02552 g006
Figure 7. The probability density distribution of a certificate price (source: authors calculation, using Crystal Ball software (Oracle, Redwood Shores, United States).
Applsci 10 02552 g007
Figure 8. The probability density distribution of the activity level of petrochemical plant (source: authors calculation, using Crystal Ball software.
Applsci 10 02552 g008
Figure 9. The probability density distribution of the annual growth rate of electricity price (source: authors calculation, using Crystal Ball software).
Applsci 10 02552 g009
Figure 10. The probability distributions of the NPV (source: authors calculation, using Crystal Ball software).
Applsci 10 02552 g010
Figure 11. The probability distribution of the NPV by 30% reduction of the investment cost (source: authors calculation, using Crystal Ball software).
Applsci 10 02552 g011
Table 1. Main categories of studies about ESC market (source: categorized by authors).
Market Fundamentals
  • Key structural elements of the market [21]
  • Market’s compliance with the country’s regulations and policies [22]
  • Market’s players and their roles [23]
  • Potential, challenges, and further development strategies of the market [24]
Market Benefits and Costs
(Economically, Environmentally, etc.)
  • Transaction cost, benefits of saved energy, and certificates, etc. [25]
  • Emission reduction and clean production [26]
  • Energy security increase [27]
Market Sustainability
and Better Performance
  • Market share of the players and monopoly formation [13]
  • Certificates pricing models and price fluctuations [28]
  • Market trend, status and solutions for improvement [14,22]
Table 2. The variables and assumptions in the Net Present Value (NPV) function.
VariablesFormula
Revenue
Certificates valueVen,cert
Reduce energy costVen,sav
Input cash flowVicf = Ven,cert + Ven,sav
Cost
Certificates issuance feeCsec
Transaction costCtr
Operational costCop
Investment costCinv
Output cash flowCocf = Csec + Ctr + Cop + Cinv
Assumptions
Discount rater
Economic lifeT
Net cash flow NCF = Vicf − Cocf
Net present valueNPV = F(r; T; Vifc; Cocf)
Table 3. The magnitude of cash flows by implementation of one MW ORC.
ItemSubdivisionValue (Million USD)
BenefitsProduced electricity from waste heat0.38
Sold certificates0.24
CostsInvestment cost2
Project’s operational costs, increase of the
certificates issuance cost, transaction cost, etc.
0.1
NPV2
Table 4. Partial derivative of the NPV relative to each of assumed variables.
X i NPV X i
Consumer activity level4.9
Electricity price0.5
Feedstock methane gas price (certificates price)0.14
Table 5. The quantities of the statistical and probabilistic criteria.
ItemUnitT = 5T = 7T = 9T = 11
ElecElec & SecElecElec & SecElecElec & SecElecElec & Sec
The probability of obtaining positive NPVPercentage044099.171.610096.7100
Maximum NPVMillion USD−0.531.04−0.031.950.472.730.863.67
Expected NPVMillion USD−0.74−0.02−0.230.710.11.340.431.87
Standard deviationMillion USD0.10.250.140.360.182.80.210.55