Development of an ESCO Risk Assessment Model as a Decision-Making Tool for the Energy Savings Certificates Market Regulator: A Case Study

 , , and
Abstract
:
1. Introduction
2. Methodology
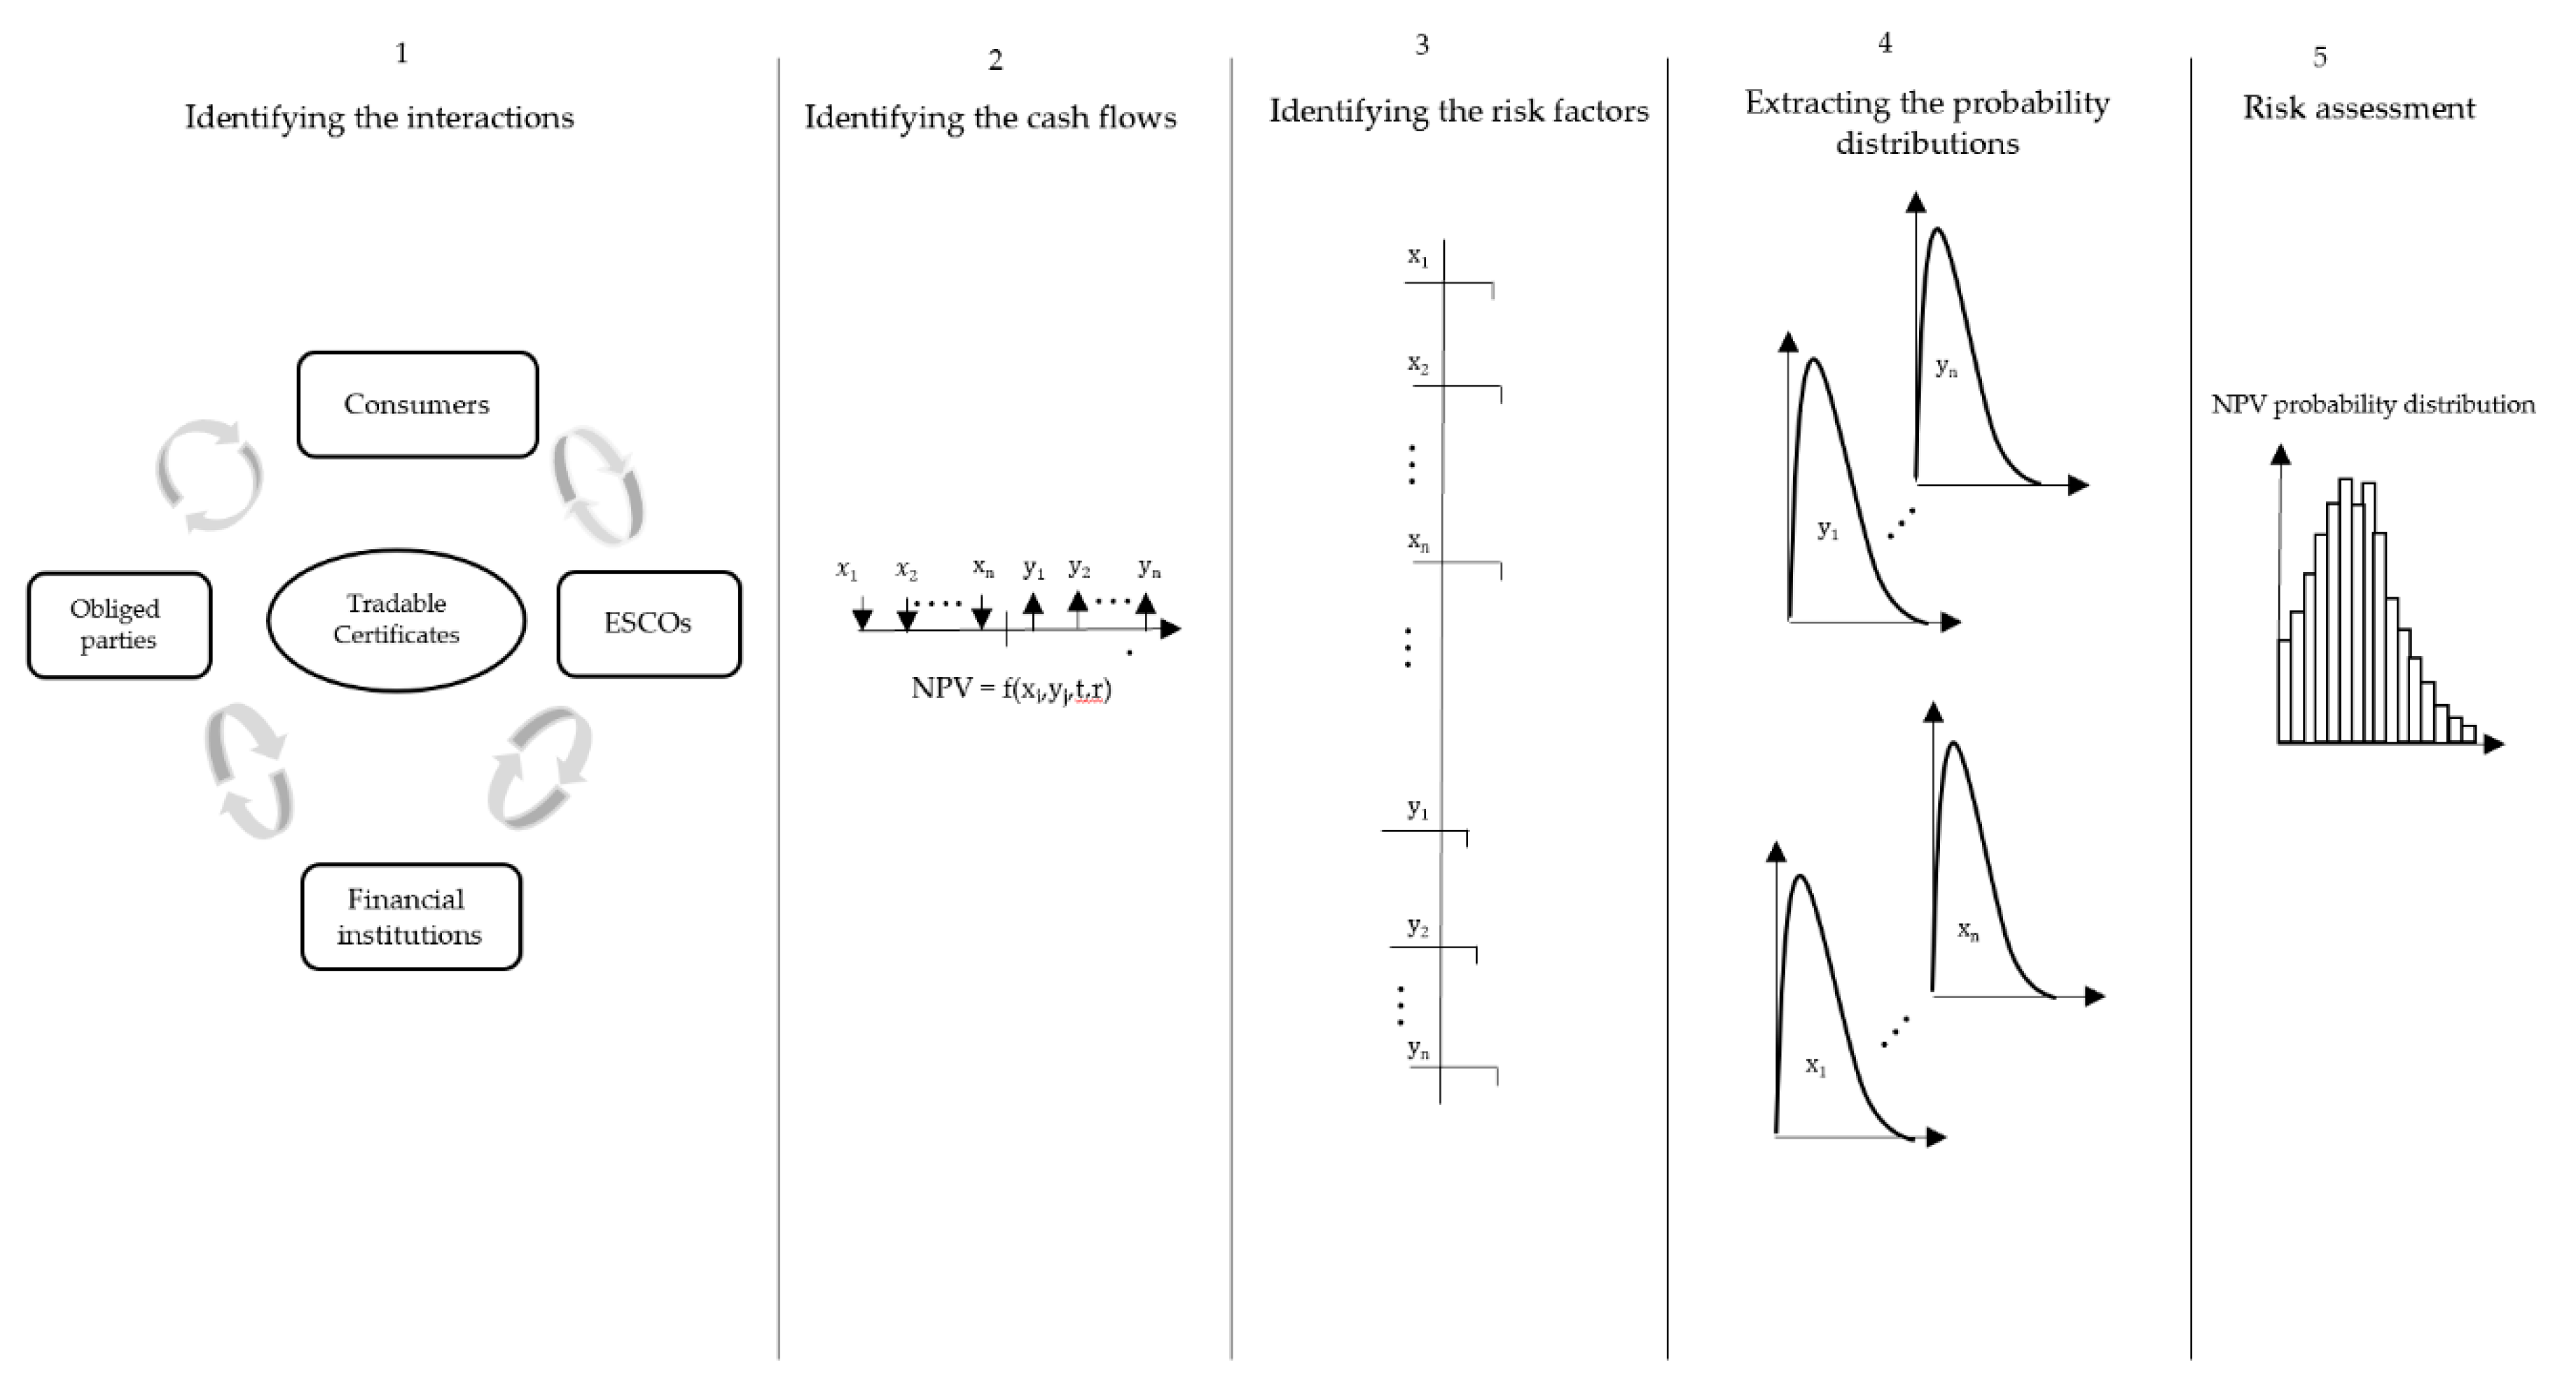
2.1. Modeling
2.1.1. Identification of the Interactions of ESCO in the ESC Market
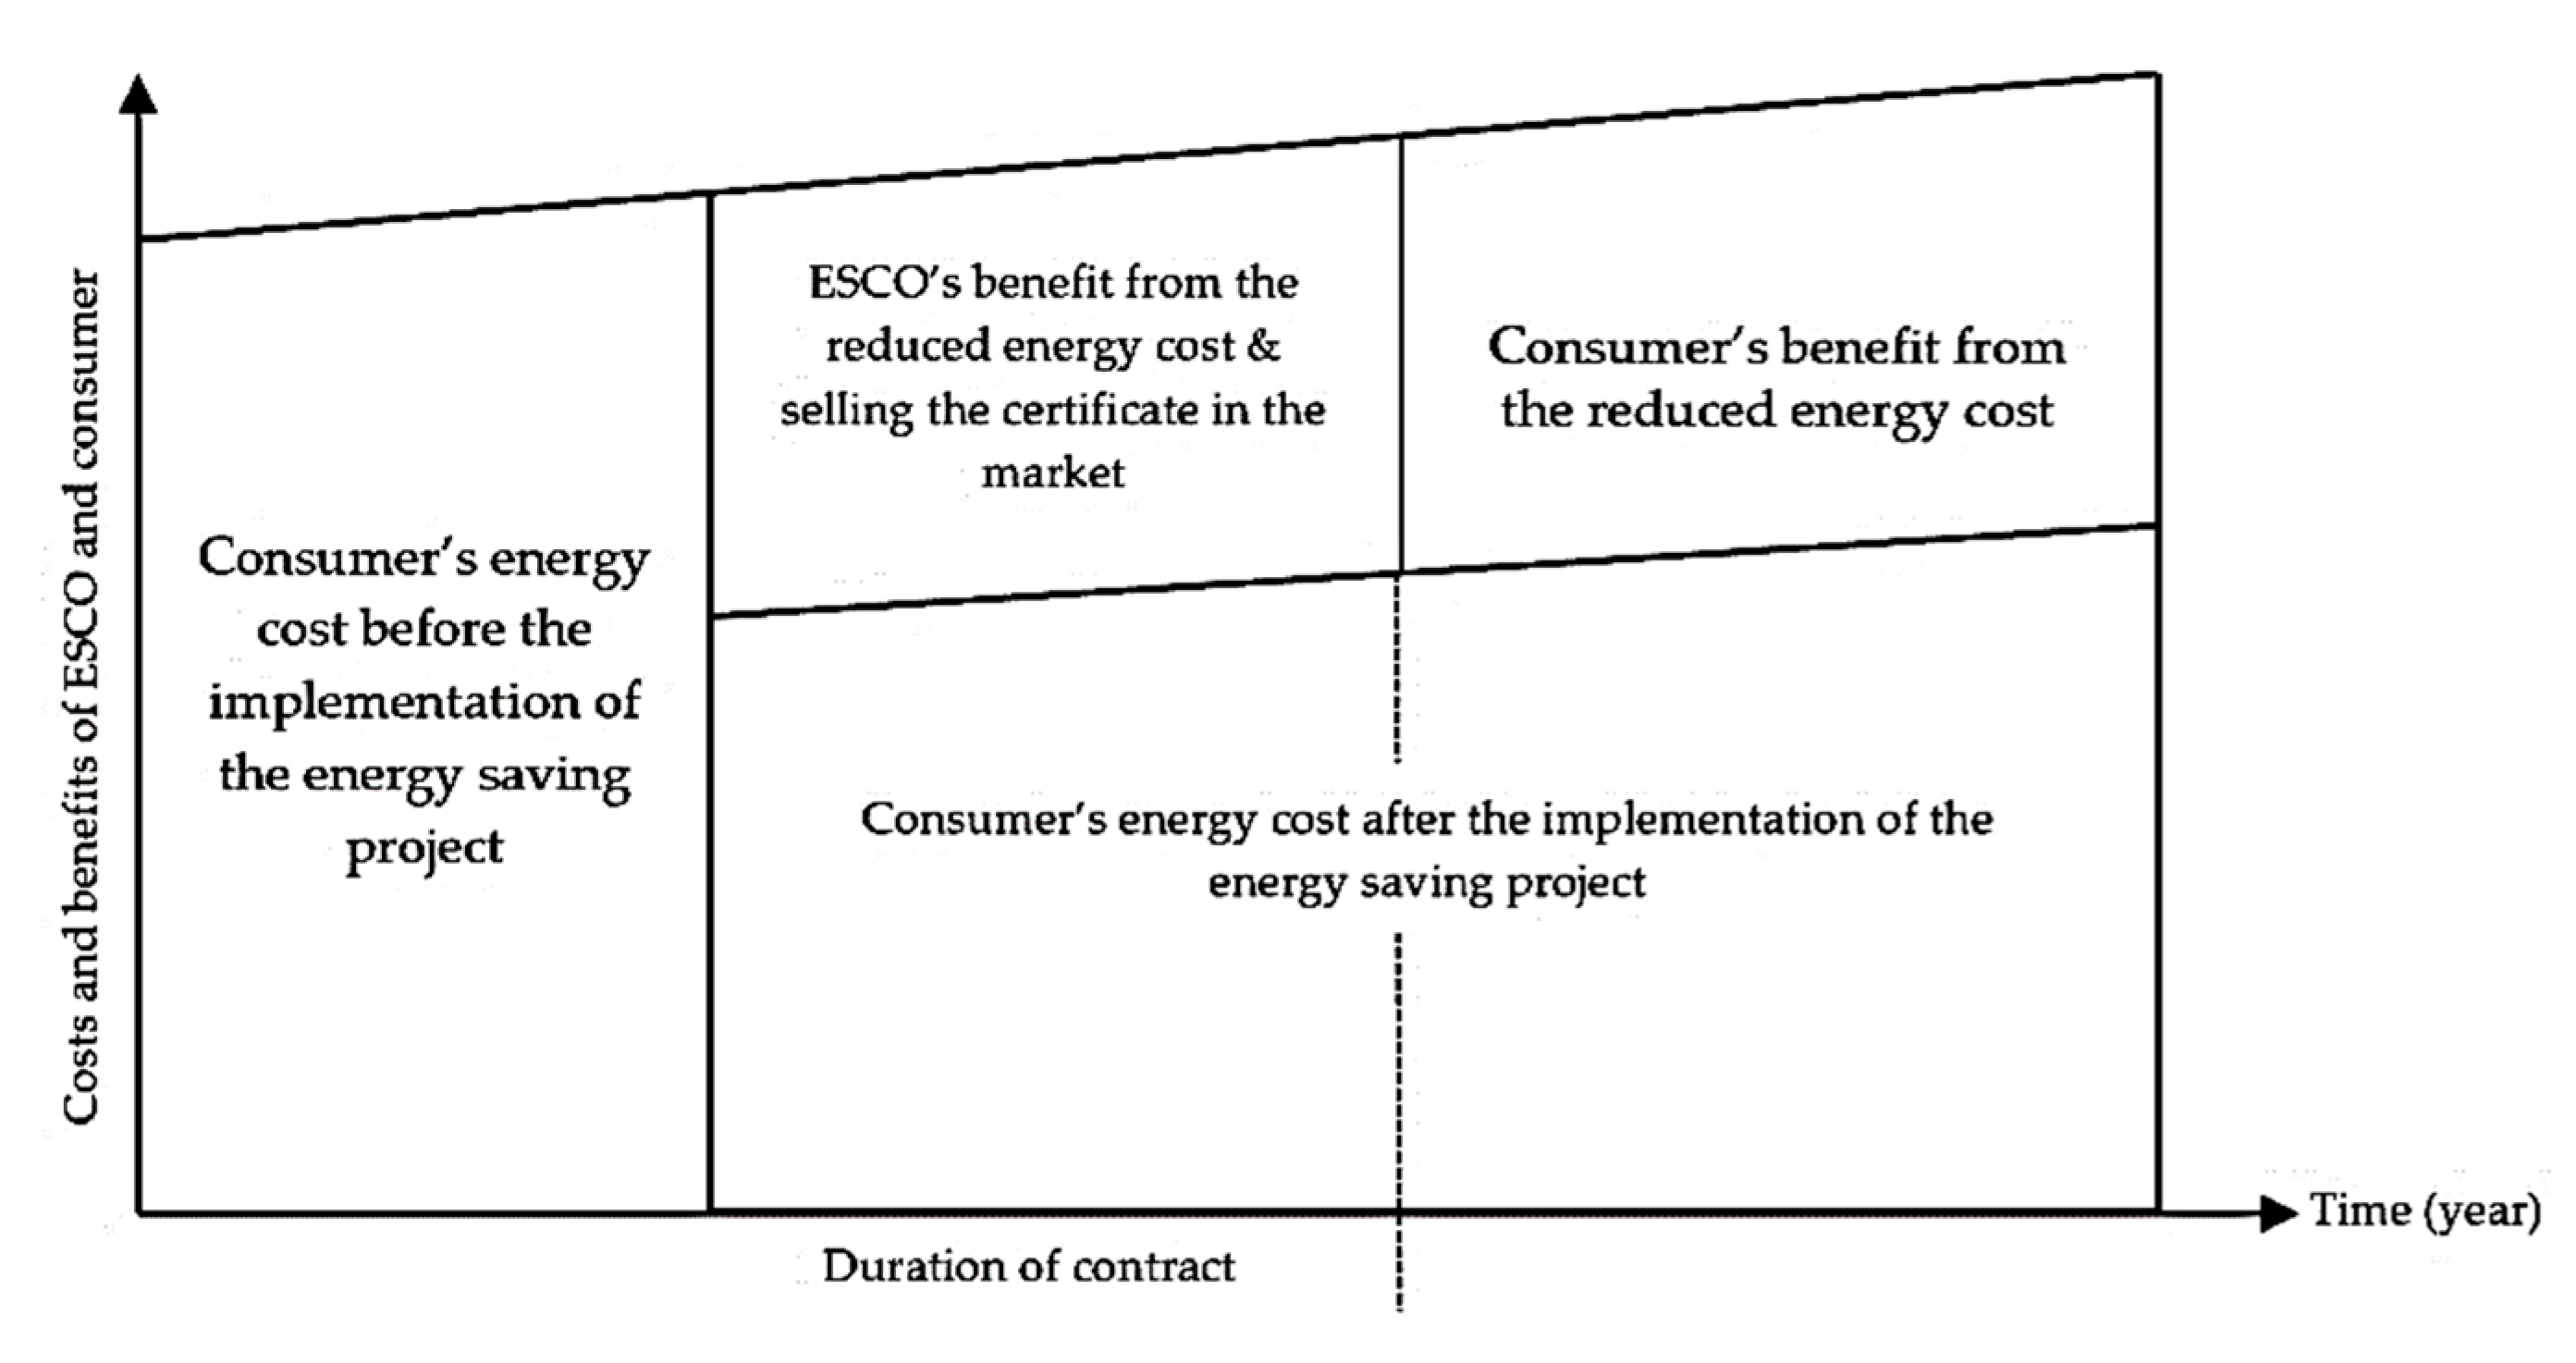
2.1.2. The ESCO Cash Flows
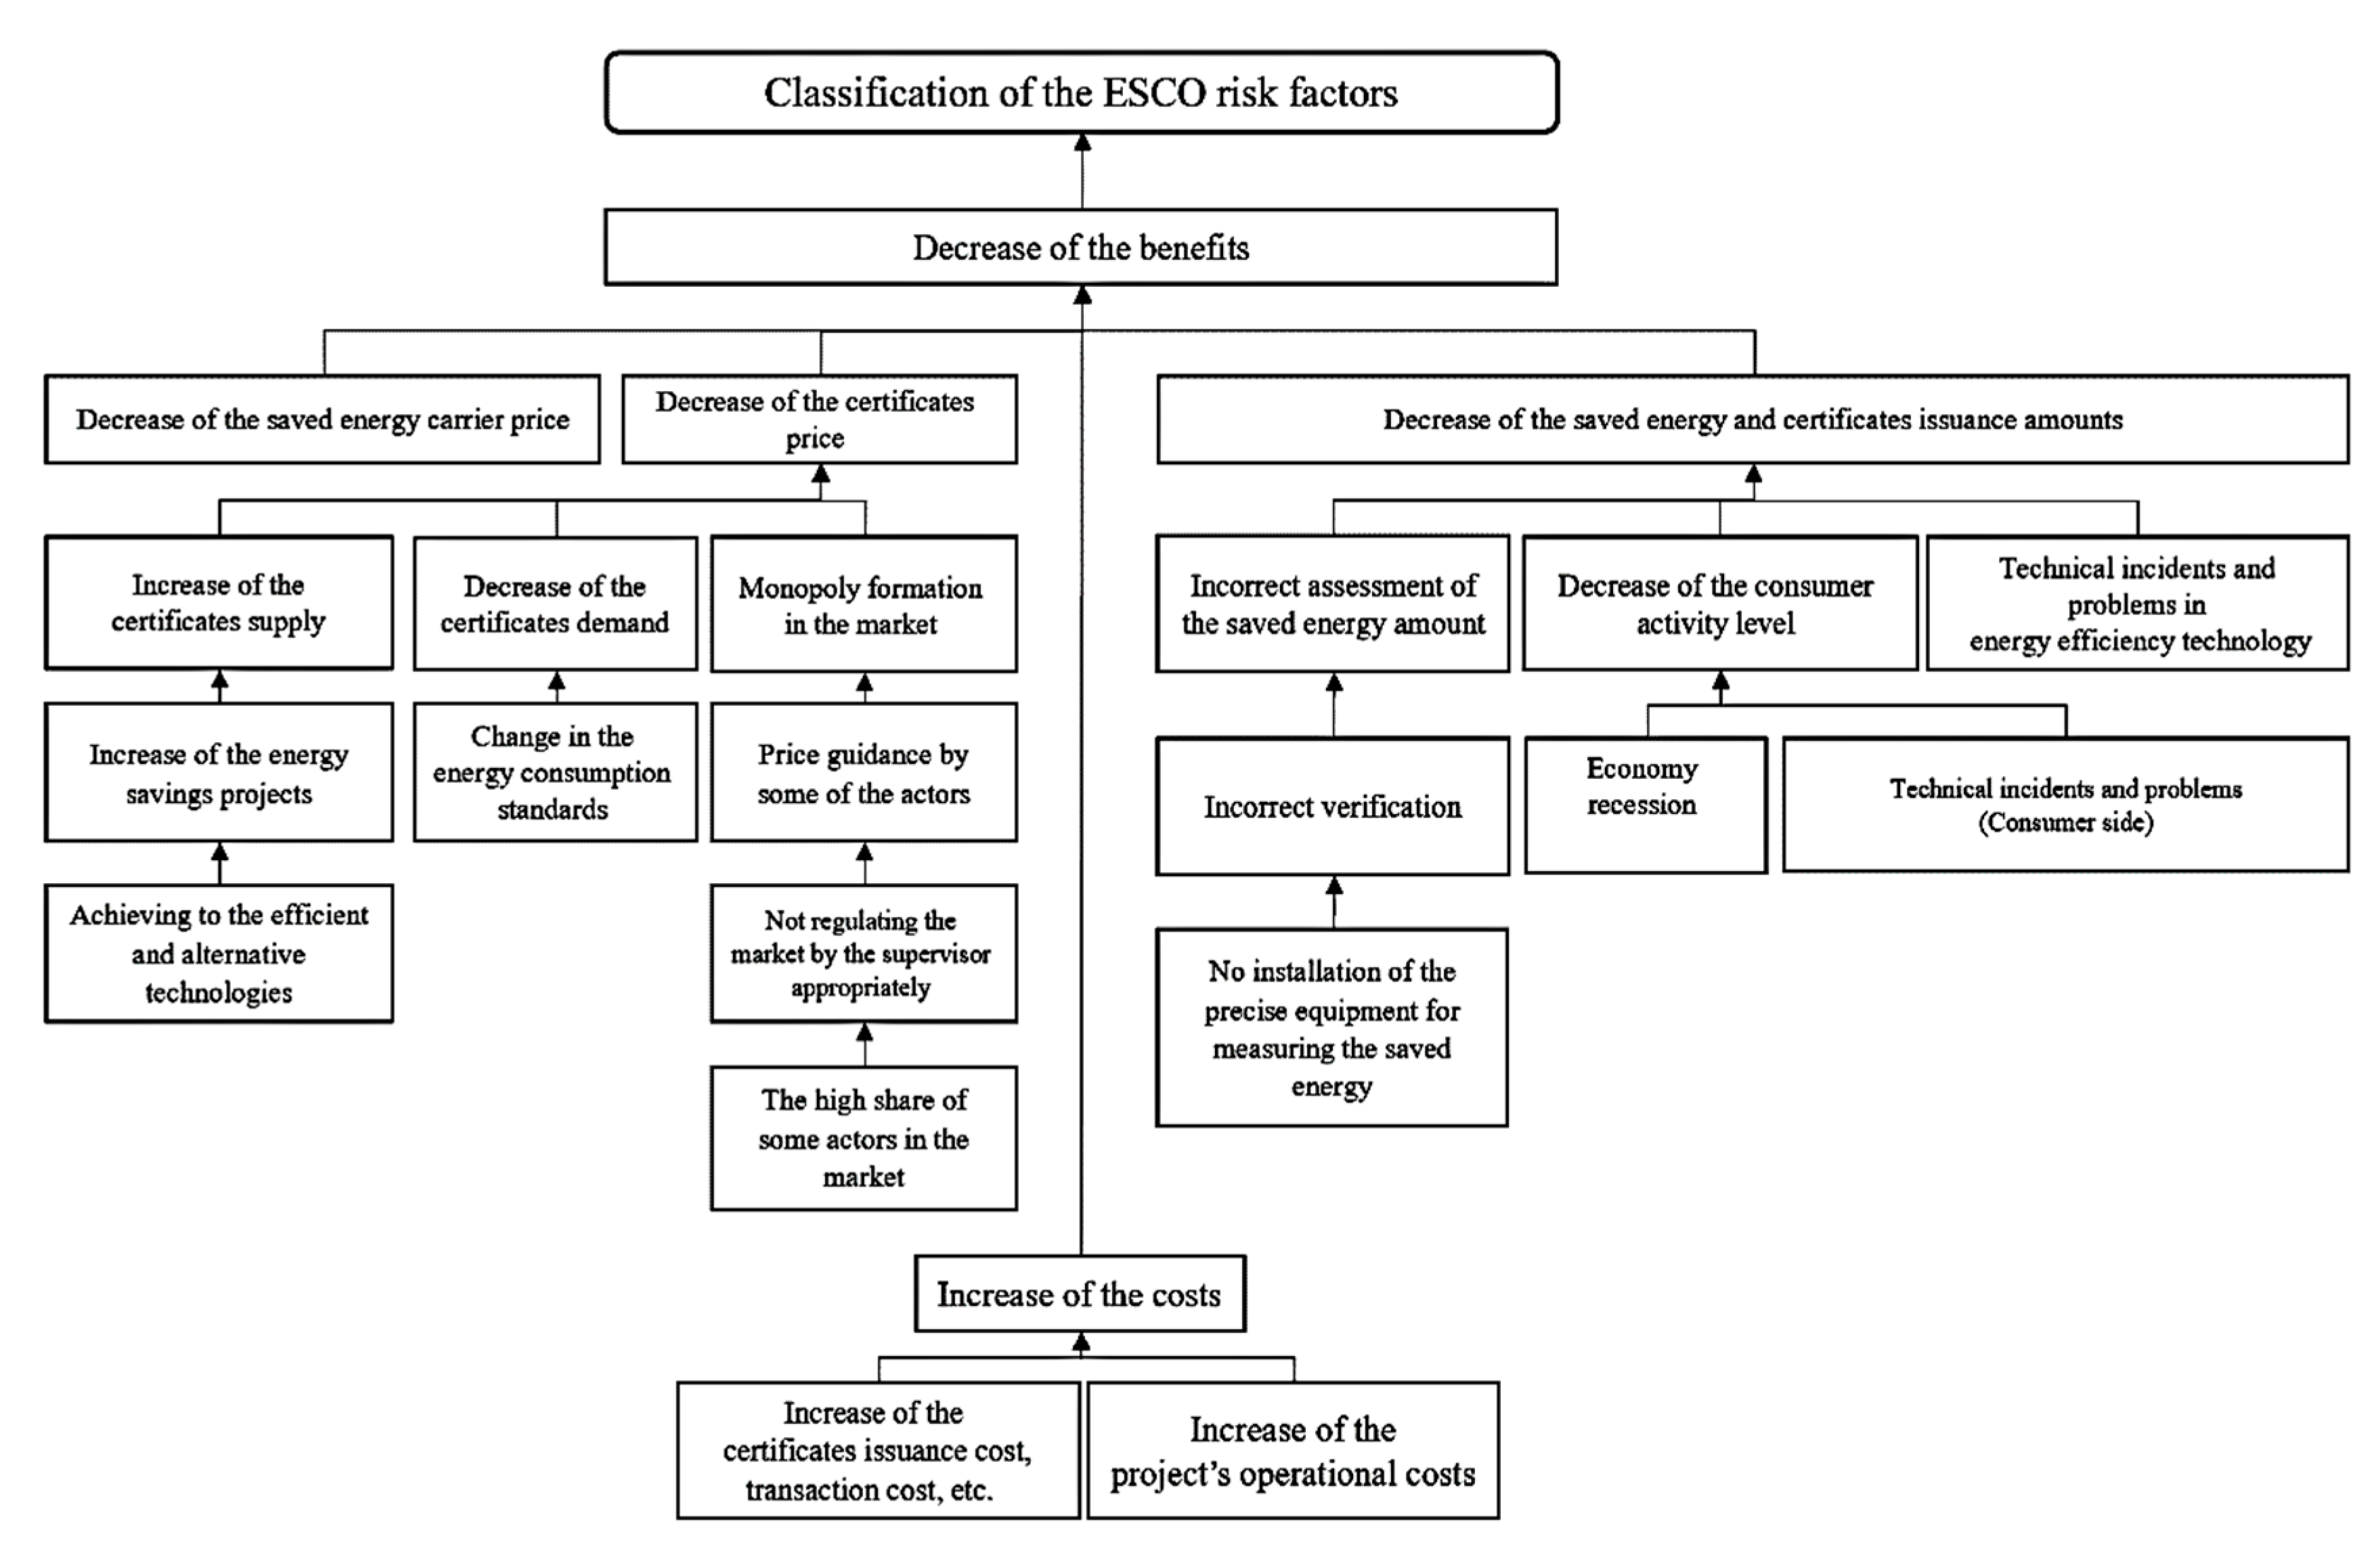
2.1.3. The Major Risks That the ESCO Is Exposed to by Consideration of the Market Structure
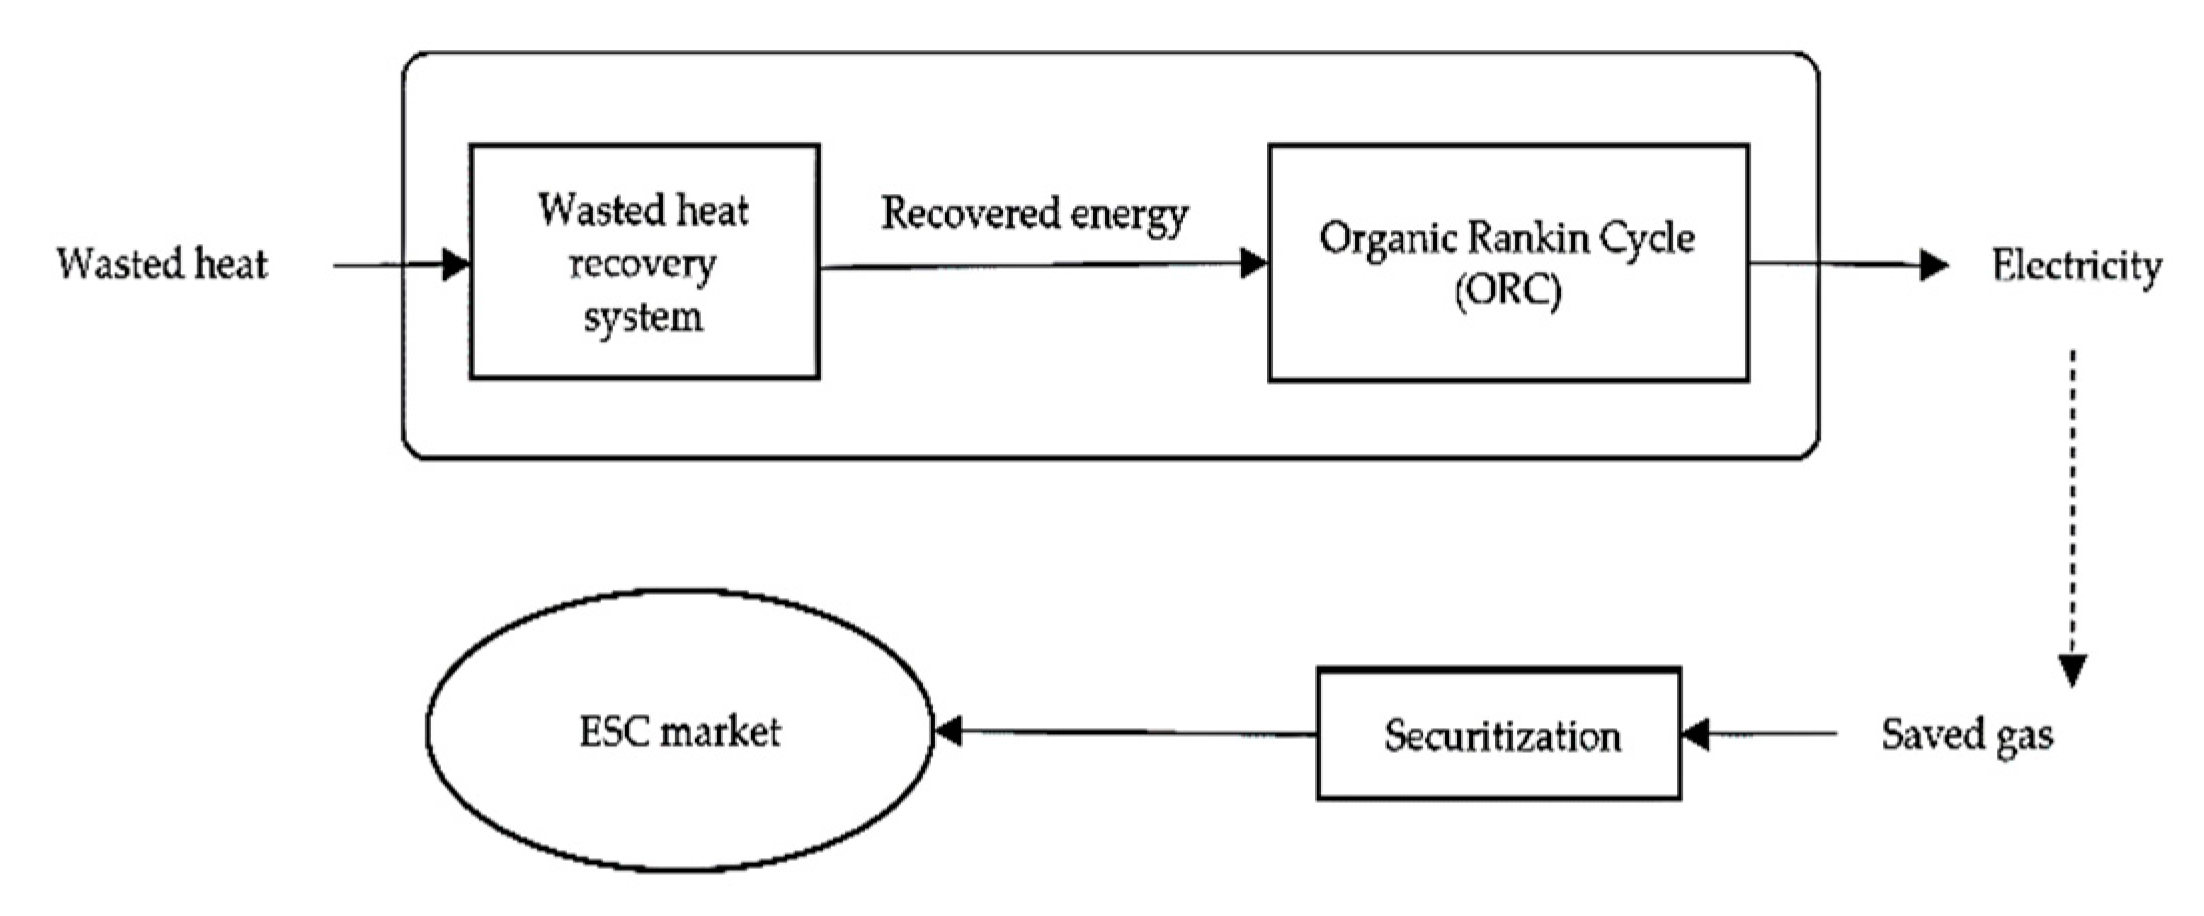
2.2. Study Area
- Implementation of one MW ORC.
- Investment cost equals 2000 dollars per kilowatt [40].
- Construction period of one year and consideration of the benefit for 10 years.
- The time period at which the ESCO sells the certificates and owns the generated electricity are considered equal (see Figure 2).
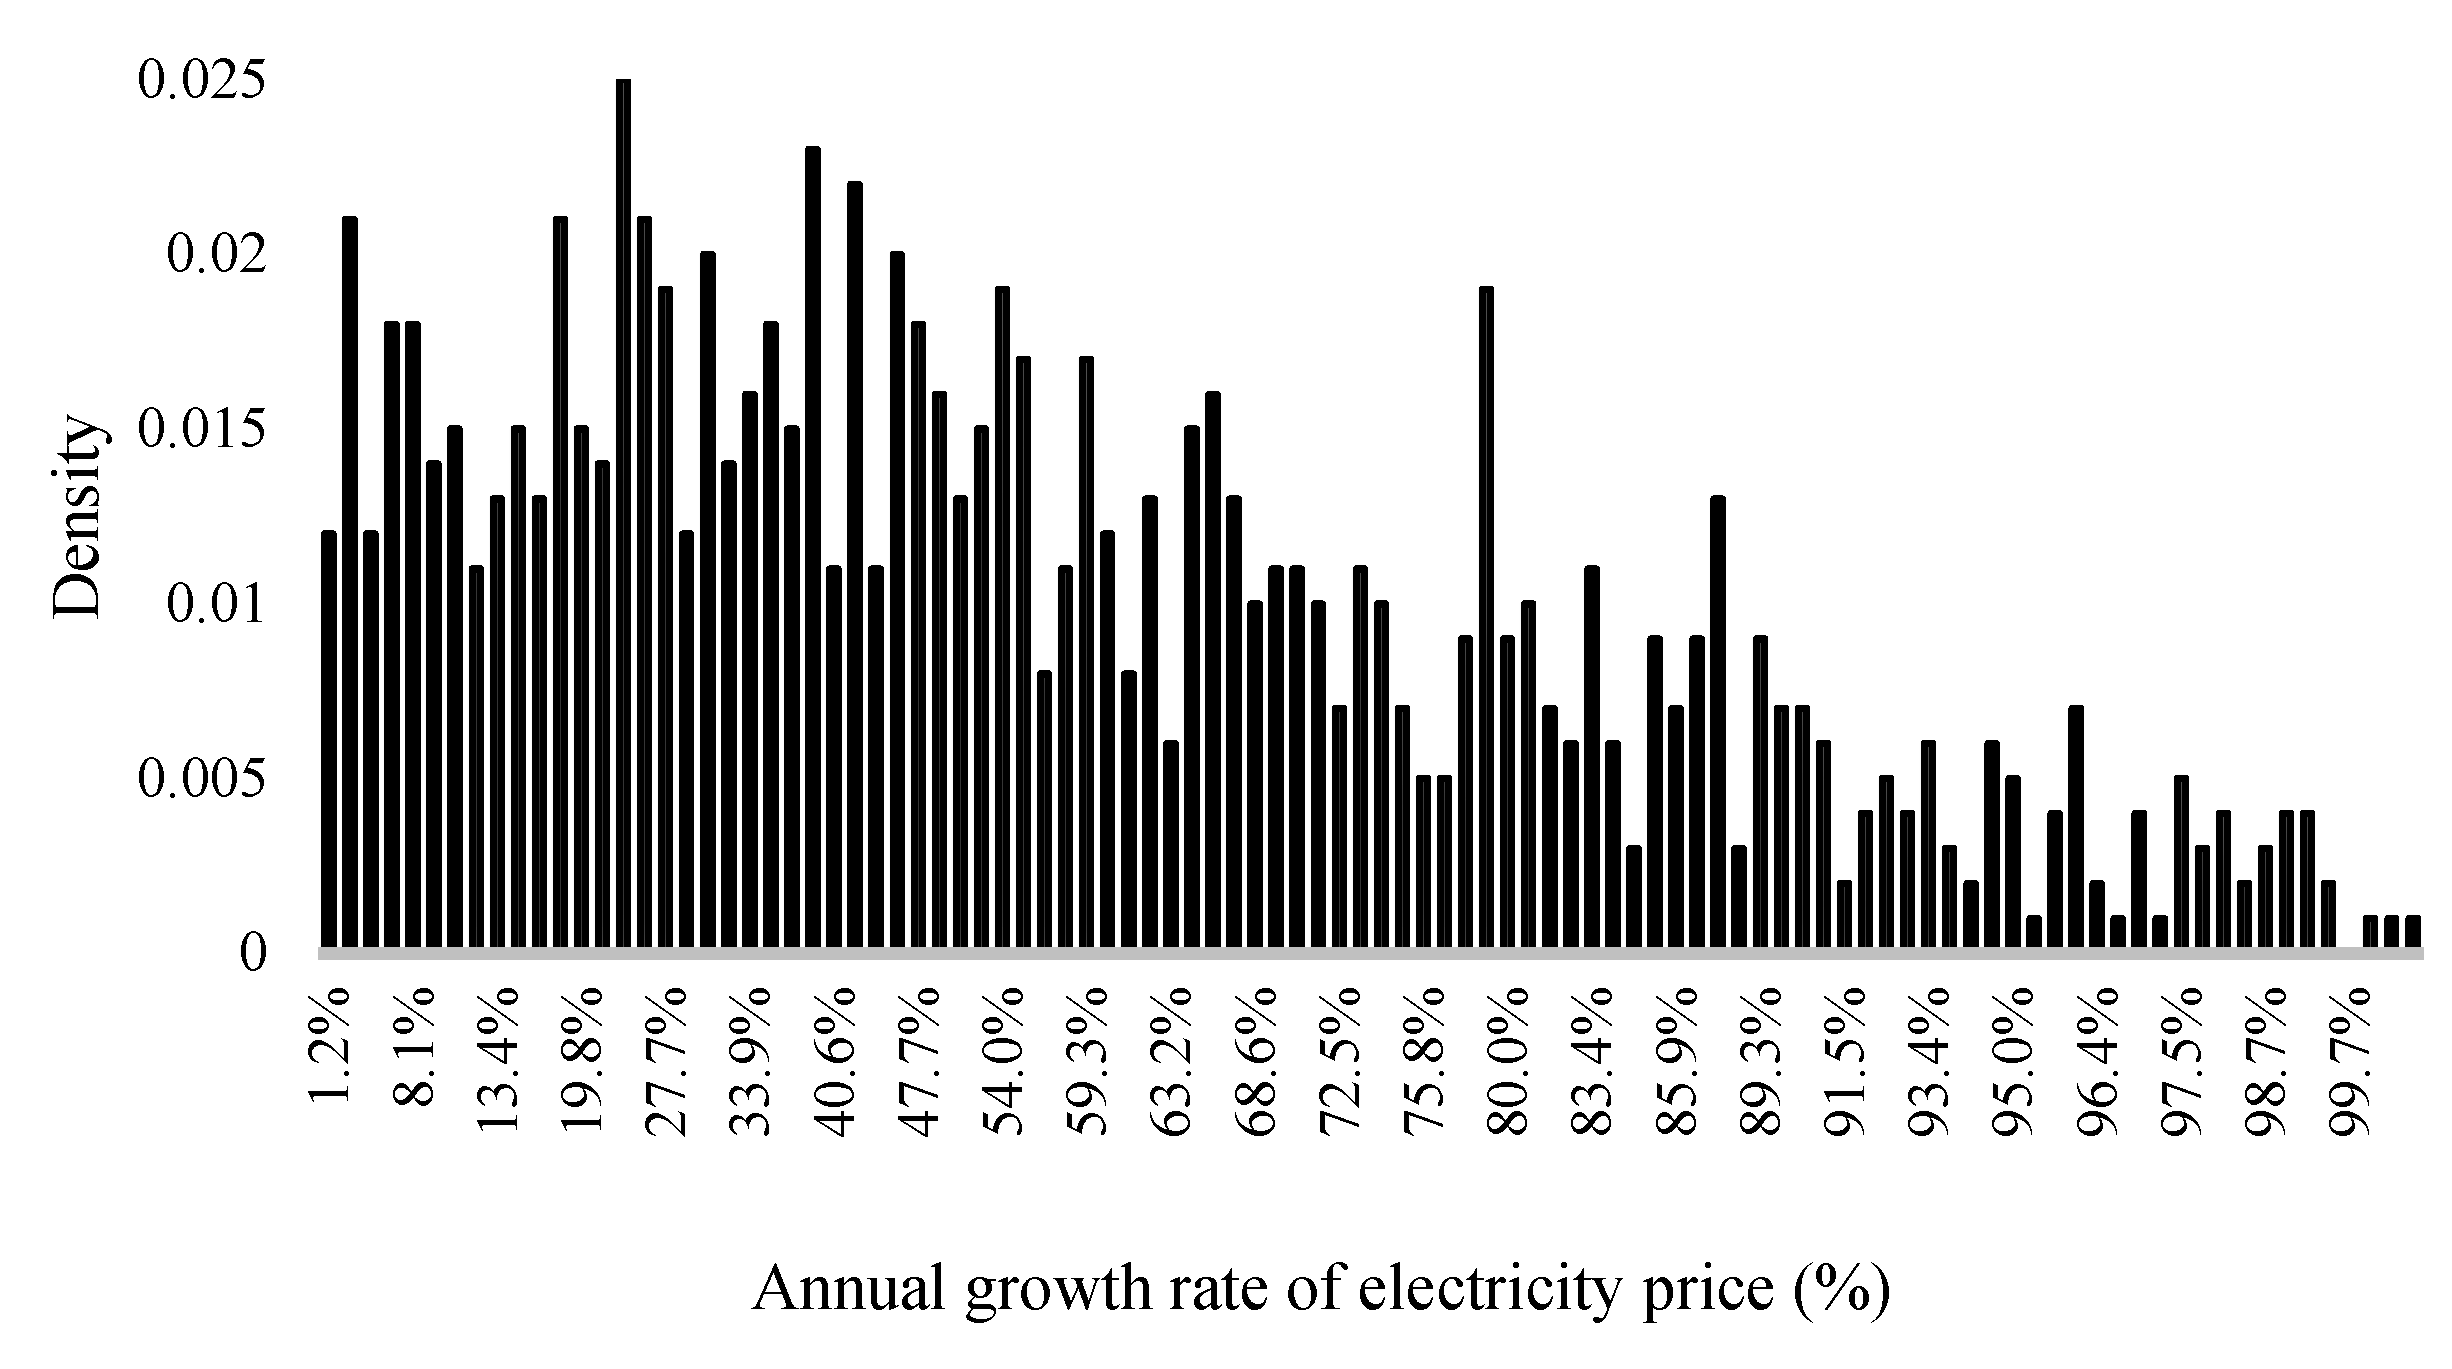
- Electricity price in Asalouyeh equals 6 cents per kilowatt-hour (National Petrochemical Company (NPC), 2016).
- Fuel methane gas savings of 0.28 cubic meters per a kilowatt-hour produced electricity.
- Annual maintenance cost is considered 5% of the investment cost [40].
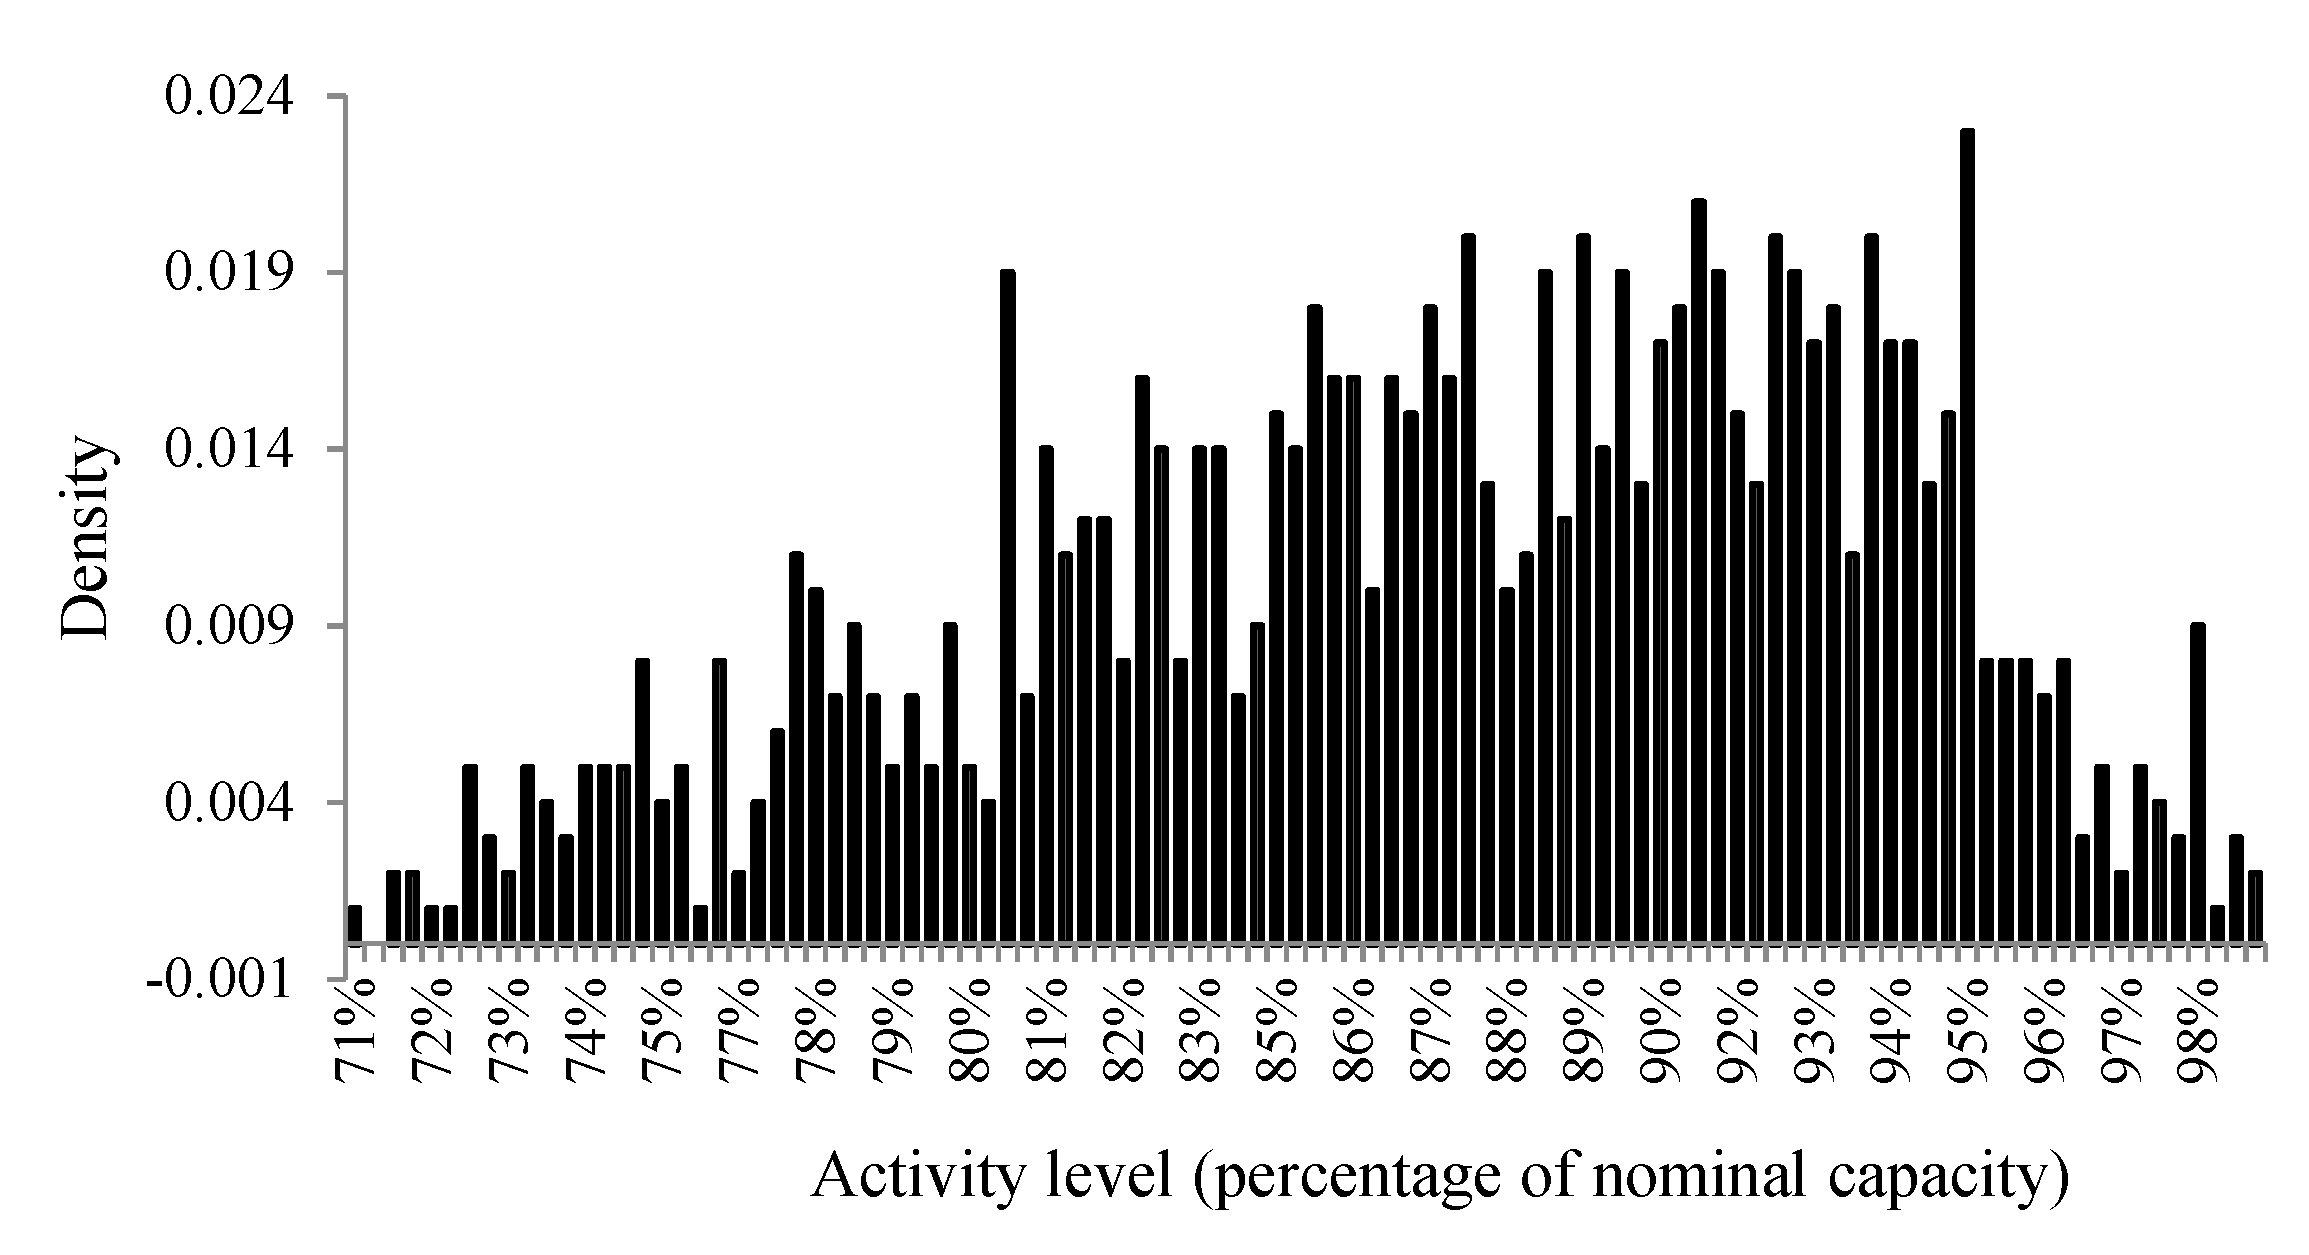
- The activity level is considered 91% of nominal production capacity of a petrochemical plant per year, which is equivalent to 11 months of operation per year [41].
- Discount rate equals 7.8% [42,43]. This discount rate is locally and in all different projects the discount rate must be established according to the local circumstances and it may vary from place to place. For example, if your local study is located in the United States and you are using this formula in April 2020, you have to consider the discount rate of 0.25%.
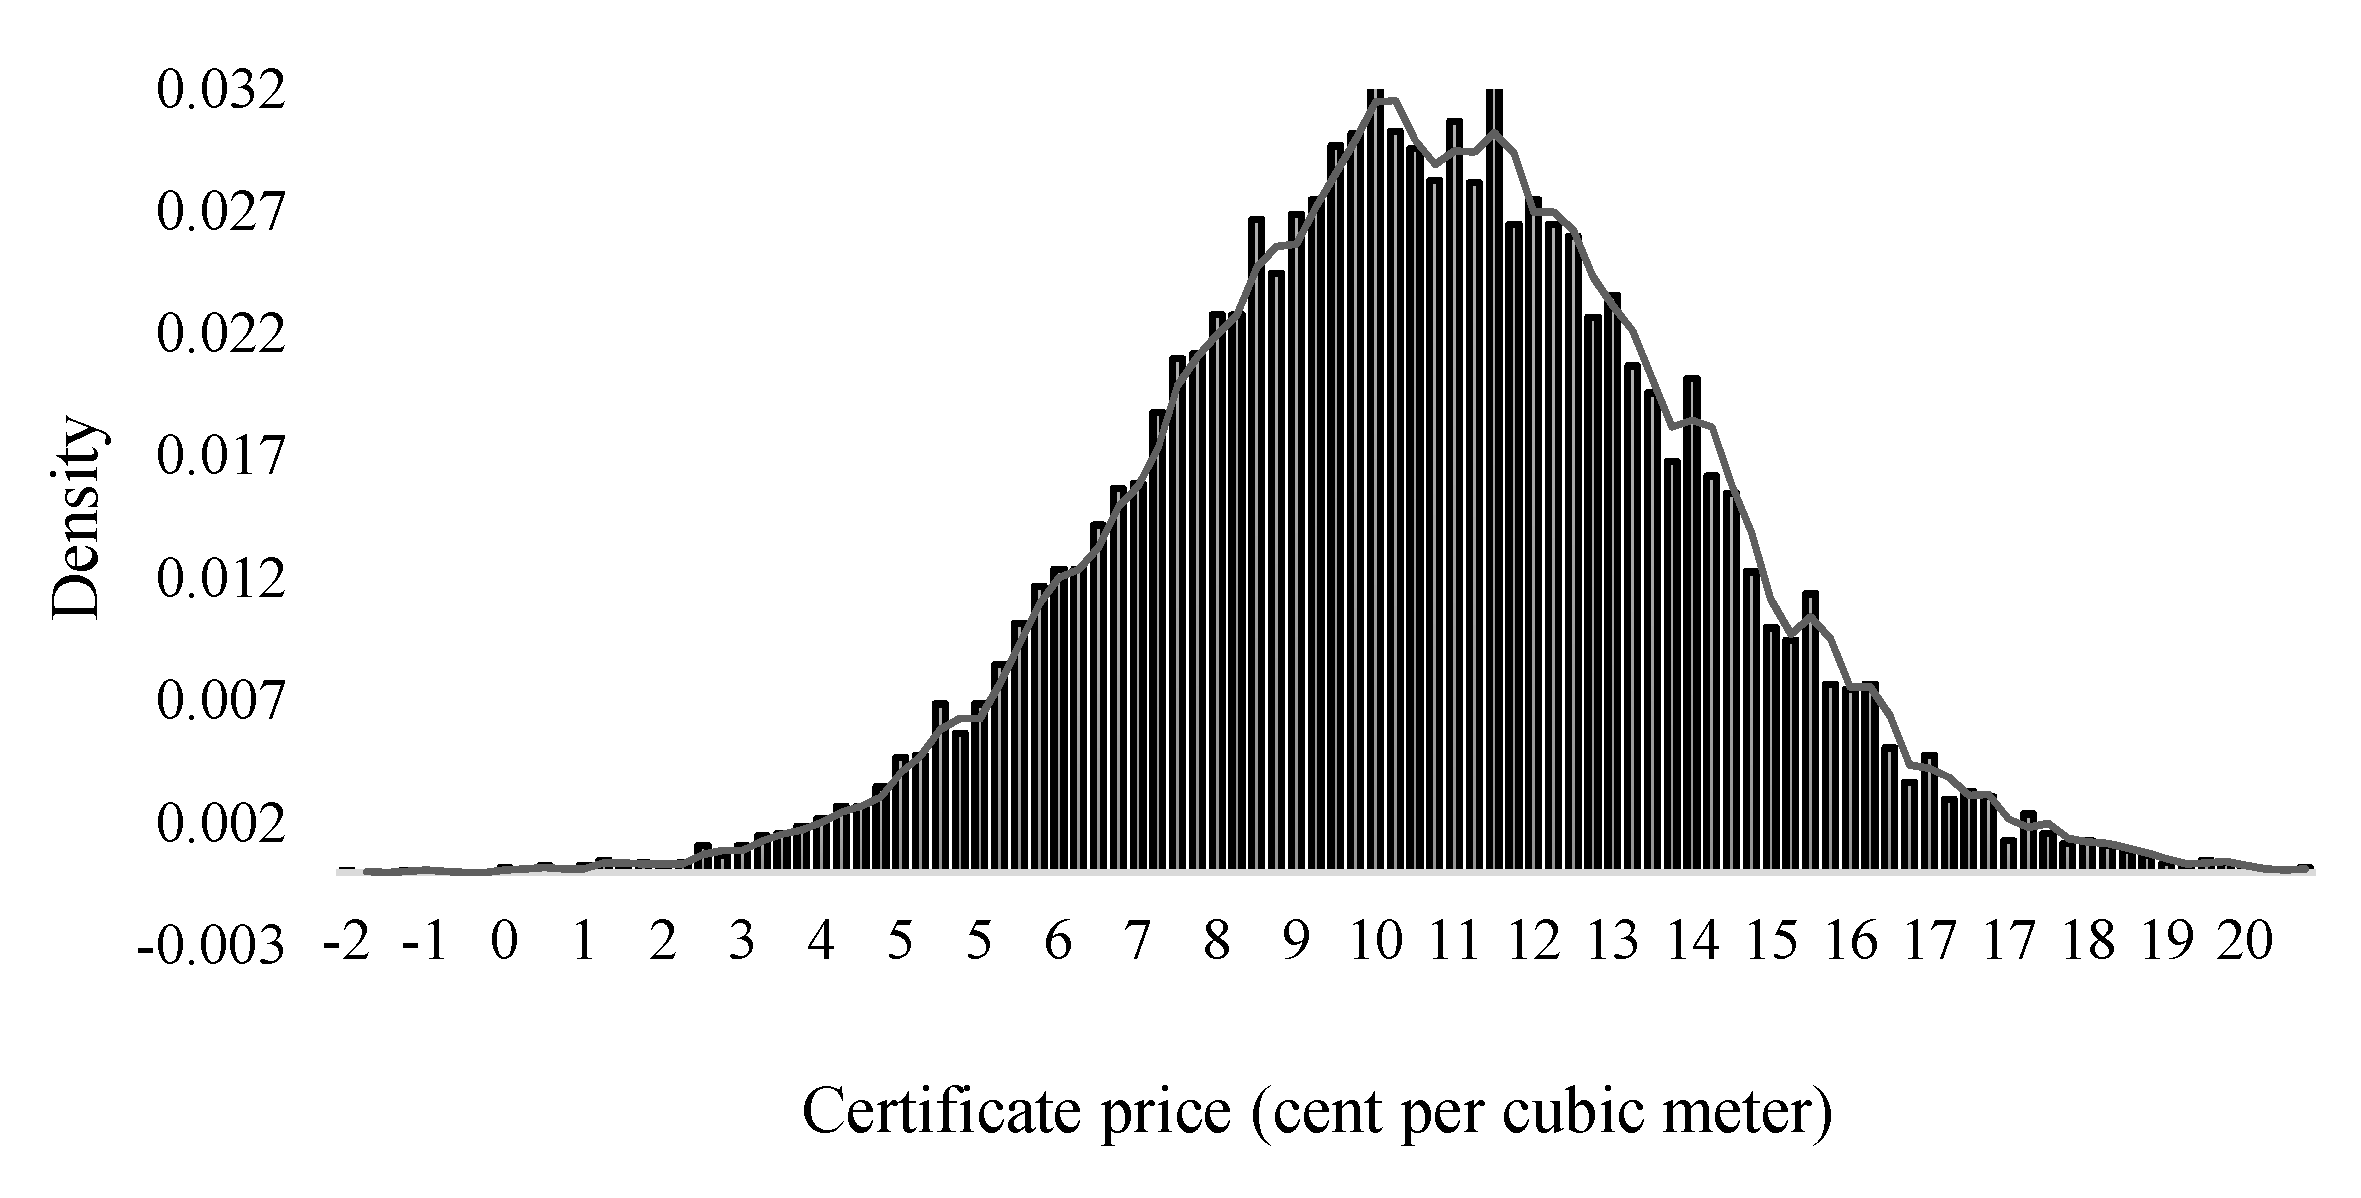
2.2.1. Probability Density Distribution of the Certificates Price
2.2.2. Probability Density Distribution of the Activity Level
2.2.3. Probability Density Distribution of the Electricity Price
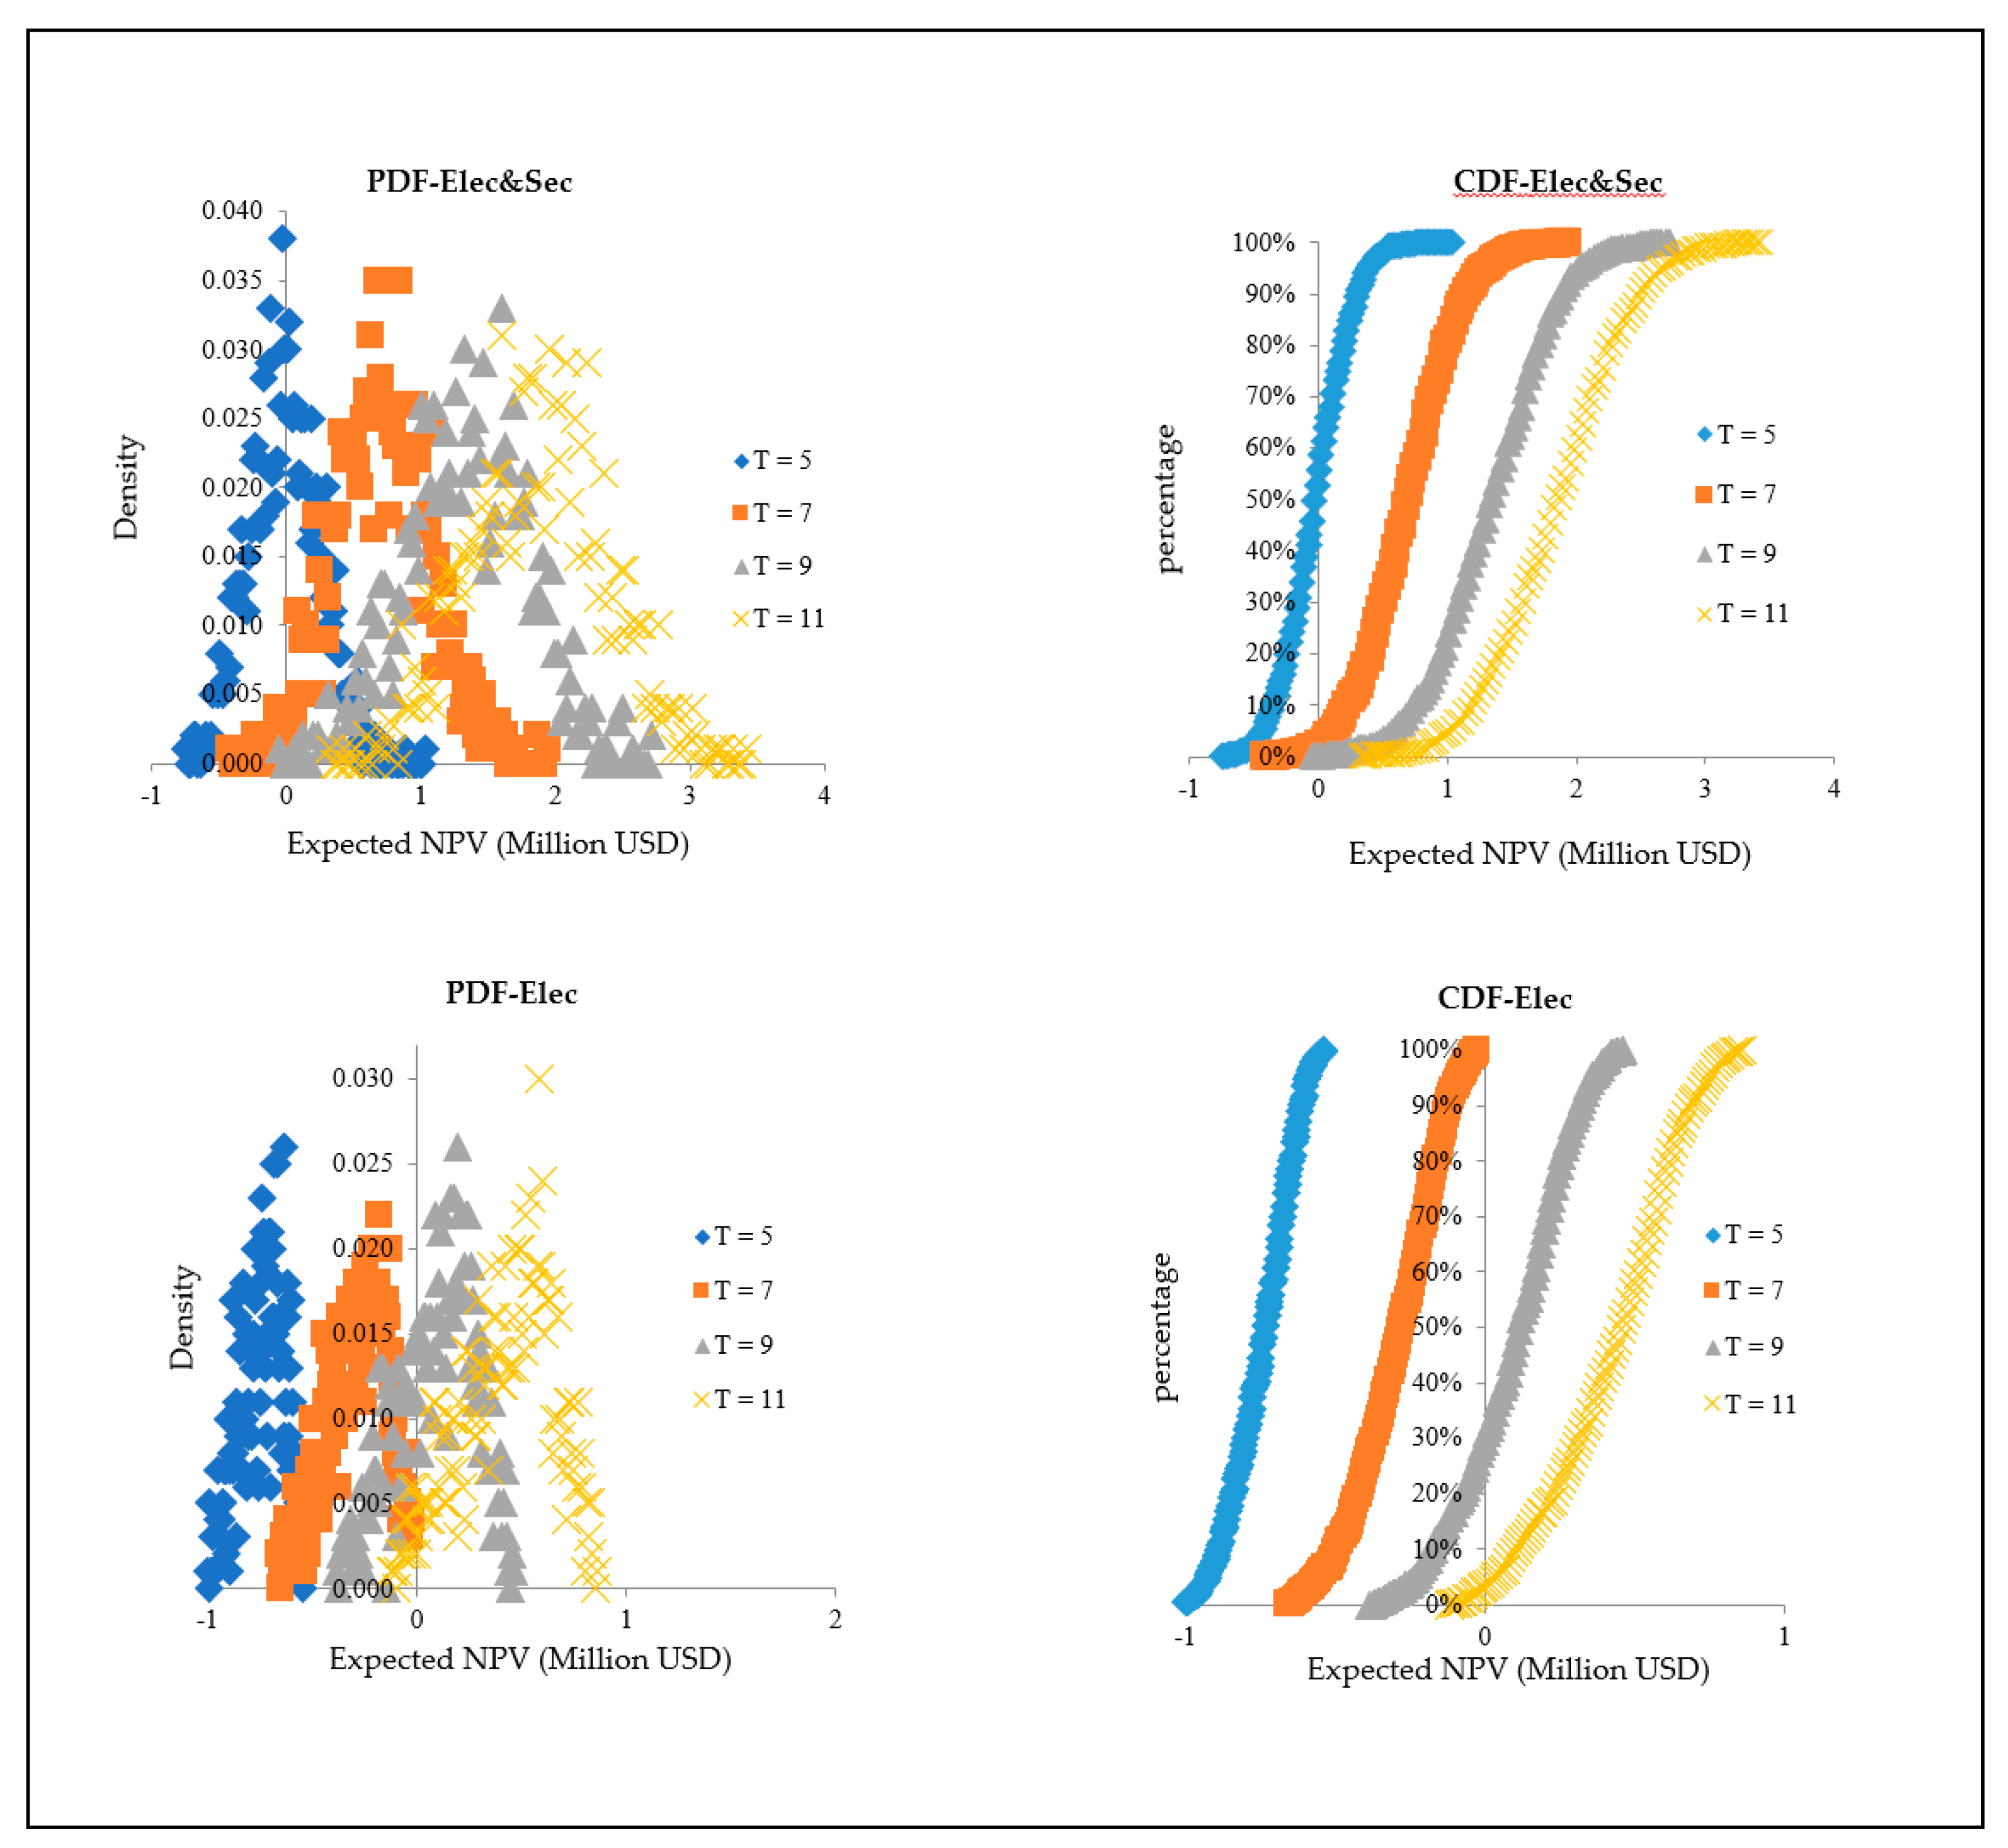
3. Results and Discussion
3.1. Non-Consideration of the Benefit of the Energy Efficiency Certificates
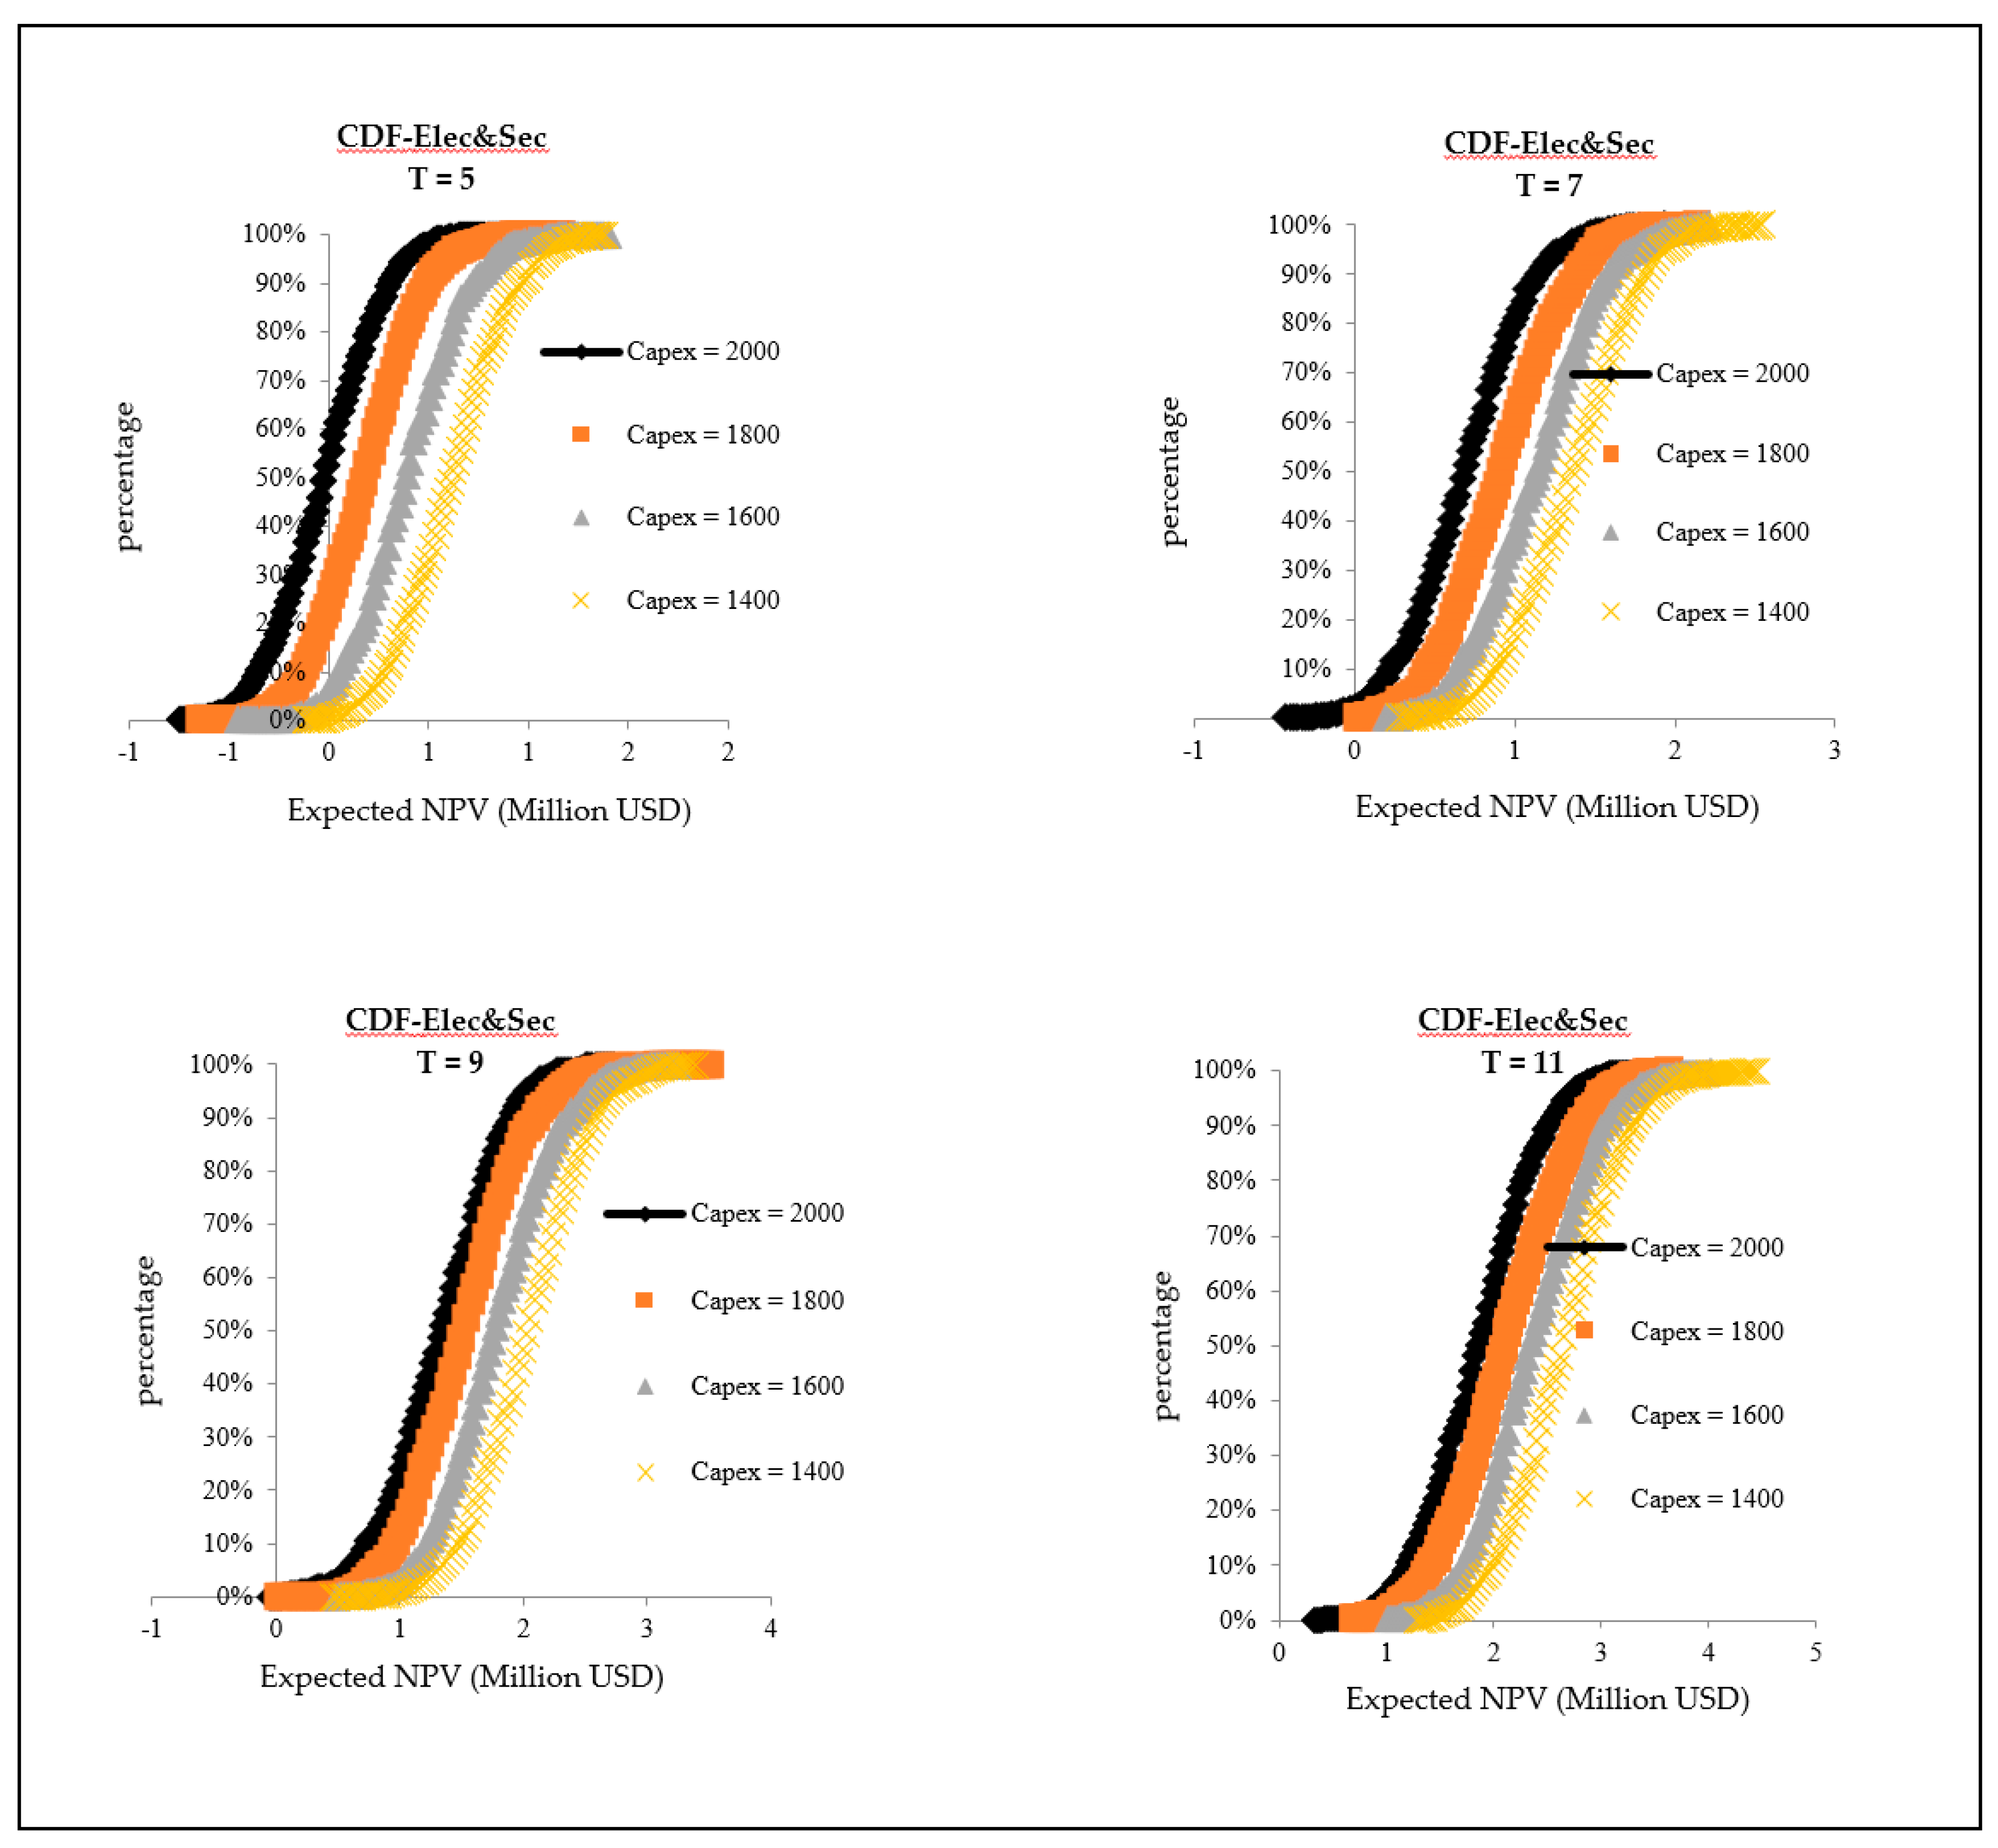
3.2. Consideration of the ESC Market Benefit
4. Limitations
5. Conclusions
6. Recommendations and Future Works
Author Contributions
Funding
Conflicts of Interest
References
- Carvallo, J.P.; Murphy, S.P.; Stuart, E.; Larsen, P.H.; Goldman, C. Evaluating project level investment trends for the U.S. ESCO industry: 1990–2017. Energy Policy 2019, 130, 139–161. [Google Scholar] [CrossRef] [Green Version]
- Hochman, G.; Timilsina, G.R. Energy efficiency barriers in commercial and industrial firms in Ukraine: An empirical analysis. Energy Econ. 2017, 63, 22–30. [Google Scholar] [CrossRef] [Green Version]
- Uz, D. Energy efficiency investments in small and medium sized manufacturing firms: The case of California energy crisis. Energy Econ. 2018, 70, 421–428. [Google Scholar] [CrossRef]
- Hansen, S.J.; Langlois, P.; Bertoldi, P. (Eds.) ESCOs Around the World: Lessons Learned in 49 Countries, 1st ed.; CRC Press: Boca Raton, FL, USA, 2009. [Google Scholar]
- Carbonara, N.; Pellegrino, R. Public-private partnerships for energy efficiency projects: A win-win model to choose the energy performance contracting structure. J. Clean. Prod. 2018, 170, 1064–1075. [Google Scholar] [CrossRef]
- Shang, T.; Zhang, K.; Liu, P.; Chen, Z. A review of energy performance contracting business models: Status and recommendation. Sustain. Cities Soc. 2017, 34, 203–210. [Google Scholar] [CrossRef]
- Lee, P.; Lam, P.T.I.; Lee, W.L. Risks in Energy Performance Contracting (EPC) projects. Energy Build. 2015, 92, 116–127. [Google Scholar] [CrossRef]
- Shad, R.; Khorrami, M.; Ghaemi, M. Developing an Iranian green building assessment tool using decision making methods and geographical information system: Case study in Mashhad city. Renew. Sustain. Energy Rev. 2017, 67, 324. Available online: http://www.sciencedirect.com/science/article/pii/S1364032116304956 (accessed on 21 March 2020). [CrossRef]
- Jozaghi, A.; Alizadeh, B.; Hatami, M.; Flood, I.; Khorrami, M.; Khodaei, N.; Ghasemi Tousi, E. A Comparative Study of the AHP and TOPSIS Techniques for Dam Site Selection Using GIS: A Case Study of Sistan and Baluchestan Province, Iran. Geosciences 2018, 8, 494. Available online: https://www.mdpi.com/2076-3263/8/12/494 (accessed on 21 March 2020). [CrossRef] [Green Version]
- Koosha, R.; Shahsavari, F. An Uncertainty and Sensitivity Analysis Tool for Building Thermal Energy Consumption: A Performance Comprehension of Static and Dynamic Response Analyses. American Society of Mechanical Engineers Digital Collection. 2019. Available online: https://nondestructive.asmedigitalcollection.asme.org/IDETC-CIE/proceedings/IDETC-CIE2019/59179/V001T02A077/1069690 (accessed on 21 March 2020).
- Franzò, S.; Frattini, F.; Cagno, E.; Trianni, A. A multi-stakeholder analysis of the economic efficiency of industrial energy efficiency policies: Empirical evidence from ten years of the Italian White Certificate Scheme. Appl. Energy 2019, 240, 424–435. [Google Scholar] [CrossRef]
- Vine, E.; Hamrin, J. Energy savings certificates: A market-based tool for reducing greenhouse gas emissions. Energy Policy 2008, 36, 467–476. [Google Scholar] [CrossRef]
- Duzgun, B.; Komurgoz, G. Turkey’s energy efficiency assessment: White Certificates Systems and their applicability in Turkey. Energy Policy 2014, 65, 465–474. [Google Scholar] [CrossRef]
- Aldrich, E.L.; Koerner, C.L. White certificate trading: A dying concept or just making its debut? Part I: Market status and trends. Electr. J. 2018, 31, 52–63. [Google Scholar] [CrossRef]
- Bertoldi, P.; Boza-Kiss, B. Analysis of barriers and drivers for the development of the ESCO markets in Europe. Energy Policy 2017, 107, 345–355. [Google Scholar] [CrossRef]
- Hatami, M.; Flood, I.; Franz, B.; Zhang, X. State-of-the-Art Review on the Applicability of AI Methods to Automated Construction Manufacturing. Computing in Civil Engineering; American Society of Civil Engineers: Atlanta, GA, USA, 2019; Available online: http://ascelibrary.org/doi/10.1061/9780784482438.047 (accessed on 16 March 2020).
- Kamalzadeh, H.; Hahsler, M. POMDP: Introduction to Partially Observable Markov Decision Processes. Package ‘pomdp’. 2019. Available online: https://rdrr.io/cran/pomdp/f/inst/doc/POMDP.pdf (accessed on 7 April 2020).
- Kouchesfehani, Z.K.; Tehrani, A.D.; Najafi, M.; Syar, J.E.; Kampbell, E. Adding Additional Reinforcement to Improve the Structural Performance of Spray Applied Pipe Lining Rehabilitation Technology: A Review. In Proceedings of the Pipelines 2019: Multidisciplinary Topics, Utility Engineering, and Surveying, Nashville, TN, USA, 21–24 July 2019; pp. 10–23. [Google Scholar]
- Blumberga, A.; Cilinskis, E.; Gravelsins, A.; Svarckopfa, A.; Blumberga, D. Analysis of regulatory instruments promoting building energy efficiency. Energy Procedia 2018, 147, 258–267. [Google Scholar] [CrossRef]
- A Guide to Energy Performance Contracting in Public Buildings. Available online: https://www.codema.ie/images/uploads/docs/A_Guide_to_Energy_Performance_Contracting_in_Public_Buildings.pdf (accessed on 30 March 2020).
- Morthorst, P.E. Interactions of a tradable green certificate market with a tradable permits market. Energy Policy 2001, 29, 345–353. [Google Scholar] [CrossRef]
- Farinelli, U.; Johansson, T.B.; McCormick, K.; Mundaca, L.; Oikonomou, V.; Örtenvik, M.; Patel, M.; Santi, F. “White and Green”: Comparison of market-based instruments to promote energy efficiency. J. Clean. Prod. 2005, 13, 1015–1026. [Google Scholar] [CrossRef]
- Bertoldi, P.; Huld, T. Tradable certificates for renewable electricity and energy savings. Energy Policy 2006, 34, 212–222. [Google Scholar] [CrossRef]
- Mundaca, L.; Neij, L.; Labanca, N.; Duplessis, B.; Pagliano, L. Market behaviour and the to-trade-or-not-to-trade dilemma in ‘tradable white certificate’ schemes. Energy Effic. 2008, 1, 323–347. [Google Scholar] [CrossRef]
- Mundaca, L. Transaction costs of Tradable White Certificate schemes: The Energy Efficiency Commitment as case study. Energy Policy 2007, 35, 4340–4354. [Google Scholar] [CrossRef]
- Zhang, B.; Xu, L. Multi-item production planning with carbon cap and trade mechanism. Int. J. Prod. Econ. 2013, 144, 118–127. [Google Scholar] [CrossRef]
- Kumar, R.; Agarwala, A. Renewable Energy Certificate and Perform, Achieve, Trade mechanisms to enhance the energy security for India. Energy Policy 2013, 55, 669–676. [Google Scholar] [CrossRef]
- De Ayala, A.; Galarraga, I.; Spadaro, J.V. The price of energy efficiency in the Spanish housing market. Energy Policy 2016, 94, 16–24. [Google Scholar] [CrossRef] [Green Version]
- Zaroni, H.; Maciel, L.B.; Carvalho, D.B.; de Pamplona, E.O. Monte Carlo Simulation approach for economic risk analysis of an emergency energy generation system. Energy 2019, 172, 498–508. [Google Scholar] [CrossRef]
- Lee, P.; Lam, P.T.I.; Lee, W.L. Performance risks of lighting retrofit in Energy Performance Contracting projects. Energy Sustain. Dev. 2018, 45, 219–229. [Google Scholar] [CrossRef]
- Moud, H.I.; Shojaei, A.; Flood, I.; Zhang, X.; Hatami, M.; Rinker, M.E. Qualitative and Quantitative Risk Analysis of Unmanned Aerial Vehicle Flights over Construction Job Sites. In Proceedings of the Eighth International Conference on Advanced Communications and Computation (INFOCOMP 2018), Barcelona, Spain, 22–26 July 2018. [Google Scholar]
- Kamalzadeh, H.; Ahmadi, A.; Mansour, S. A shape-based adaptive segmentation of time-series using particle swarm optimization. Inf. Syst. 2017, 67, 1. Available online: http://www.sciencedirect.com/science/article/pii/S0306437916302344 (accessed on 21 March 2020). [CrossRef]
- Jinrong, H.; Enyi, Z. Engineering Risk Management Planning in Energy Performance Contracting in China. Syst. Eng. Procedia 2011, 1, 195–205. [Google Scholar] [CrossRef] [Green Version]
- Wang, L.; Peng, J.; Wang, J. A multi-criteria decision-making framework for risk ranking of energy performance contracting project under picture fuzzy environment. J. Clean. Prod. 2018, 191, 105–118. [Google Scholar] [CrossRef]
- Shahmirzadi, H.E. Selecting an Appropriate Strategy to Increase Petrochemical Product Sales (Case Study: Iranian Petrochemical Industry). Bus. Manag. Stud. 2017, 3, 42–54. [Google Scholar] [CrossRef]
- Kamalzadeh, H.; Sobhan, S.N.; Boskabadi, A.; Hatami, M.; Gharehyakheh, A. Modeling and Prediction of Iran’s Steel Consumption Based on Economic Activity Using Support Vector Machines. arXiv 2019, arXiv:191202373. Available online: http://arxiv.org/abs/1912.02373 (accessed on 21 March 2020).
- Chen, Y.-P.; Sheng, Y.-J.; Dong, C.; Wu, J.-F. Numerical simulation on flow field in circumferential overlap trisection helical baffle heat exchanger. Appl. Therm. Eng. 2013, 50, 1035–1043. [Google Scholar] [CrossRef]
- Moshiri, S. The effects of the energy price reform on households consumption in Iran. Energy Policy 2015, 79, 177–188. [Google Scholar] [CrossRef]
- Vescovo, R.; Spagnoli, E. High Temperature ORC Systems. Energy Procedia 2017, 129, 82–89. [Google Scholar] [CrossRef]
- Mohammadi, K.; Mostafaeipour, A.; Dinpashoh, Y.; Pouya, N. Electricity Generation and Energy Cost Estimation of Large-Scale Wind Turbines in Jarandagh, Iran. J. Energy 2014, 2014, 1–8. [Google Scholar] [CrossRef] [Green Version]
- Duffuaa, S.; Ben-Daya, M. Turnaround maintenance in petrochemical industry: Practices and suggested improvements. J. Qual. Maint. Eng. 2004, 10, 184–190. [Google Scholar] [CrossRef]
- Daneshmand, A.; Jahangard, E.; Abdollah-Milani, M. A Time Preference Measure of the Social Discount Rate for Iran. Econ. Struct. 2018, 7, 29. Available online: https://journalofeconomicstructures.springeropen.com/articles/10.1186/s40008-018-0127-x (accessed on 16 March 2020). [CrossRef] [Green Version]
- Zhuang, J.; Liang, Z.; Lin, T.; Guzman, F.D. Theory and Practice in the Choice of Social Discount Rate for Cost-Benefit Analysis: A Survey; ADB Economics Working Paper Series, Asian Development Bank (ADB); Asian Development Bank (ADB): Metro Manila, Philippines, 2007. [Google Scholar]


| Market Fundamentals | |
| Market Benefits and Costs (Economically, Environmentally, etc.) | |
| Market Sustainability and Better Performance |
| Variables | Formula |
|---|---|
| Revenue | |
| Certificates value | Ven,cert |
| Reduce energy cost | Ven,sav |
| Input cash flow | Vicf = Ven,cert + Ven,sav |
| Cost | |
| Certificates issuance fee | Csec |
| Transaction cost | Ctr |
| Operational cost | Cop |
| Investment cost | Cinv |
| Output cash flow | Cocf = Csec + Ctr + Cop + Cinv |
| Assumptions | |
| Discount rate | r |
| Economic life | T |
| Net cash flow | NCF = Vicf − Cocf |
| Net present value | NPV = F(r; T; Vifc; Cocf) |
| Item | Subdivision | Value (Million USD) |
|---|---|---|
| Benefits | Produced electricity from waste heat | 0.38 |
| Sold certificates | 0.24 | |
| Costs | Investment cost | 2 |
| Project’s operational costs, increase of the certificates issuance cost, transaction cost, etc. | 0.1 | |
| NPV | 2 | |
| Consumer activity level | 4.9 |
| Electricity price | 0.5 |
| Feedstock methane gas price (certificates price) | 0.14 |
| Item | Unit | T = 5 | T = 7 | T = 9 | T = 11 | ||||
|---|---|---|---|---|---|---|---|---|---|
| Elec | Elec & Sec | Elec | Elec & Sec | Elec | Elec & Sec | Elec | Elec & Sec | ||
| The probability of obtaining positive NPV | Percentage | 0 | 44 | 0 | 99.1 | 71.6 | 100 | 96.7 | 100 |
| Maximum NPV | Million USD | −0.53 | 1.04 | −0.03 | 1.95 | 0.47 | 2.73 | 0.86 | 3.67 |
| Expected NPV | Million USD | −0.74 | −0.02 | −0.23 | 0.71 | 0.1 | 1.34 | 0.43 | 1.87 |
| Standard deviation | Million USD | 0.1 | 0.25 | 0.14 | 0.36 | 0.18 | 2.8 | 0.21 | 0.55 |
© 2020 by the authors. Licensee MDPI, Basel, Switzerland. This article is an open access article distributed under the terms and conditions of the Creative Commons Attribution (CC BY) license (http://creativecommons.org/licenses/by/4.0/).
Share and Cite
Ahmadi, M.; Hatami, M.; Rahgozar, P.; Shirkhanloo, S.; Abed, S.; Kamalzadeh, H.; Flood, I. Development of an ESCO Risk Assessment Model as a Decision-Making Tool for the Energy Savings Certificates Market Regulator: A Case Study. Appl. Sci. 2020, 10, 2552. https://doi.org/10.3390/app10072552
Ahmadi M, Hatami M, Rahgozar P, Shirkhanloo S, Abed S, Kamalzadeh H, Flood I. Development of an ESCO Risk Assessment Model as a Decision-Making Tool for the Energy Savings Certificates Market Regulator: A Case Study. Applied Sciences. 2020; 10(7):2552. https://doi.org/10.3390/app10072552
Chicago/Turabian StyleAhmadi, Mohsen, Mohsen Hatami, Peyman Rahgozar, Salar Shirkhanloo, Shahriar Abed, Hossein Kamalzadeh, and Ian Flood. 2020. "Development of an ESCO Risk Assessment Model as a Decision-Making Tool for the Energy Savings Certificates Market Regulator: A Case Study" Applied Sciences 10, no. 7: 2552. https://doi.org/10.3390/app10072552