Article

A Novel Bionic Structure Inspired by Luffa Sponge and Its Cushion Properties

College of Packaging and Material Engineering, Hunan University of Technology, Zhuzhou 412007, Hunan, China
*
Author to whom correspondence should be addressed.
Appl. Sci. 2020, 10(7), 2584; https://doi.org/10.3390/app10072584
Submission received: 11 March 2020 / Revised: 5 April 2020 / Accepted: 6 April 2020 / Published: 9 April 2020
(This article belongs to the Section Materials Science and Engineering)

Abstract

:
The luffa sponge shows excellent cushion properties. This paper presents a bio-inspired structure of the luffa sponge. The geometry of the bionic structure was built based on the fractal theory by Python programming language and prepared by a 3D printer. Then a series of quasi-static compression tests and finite element analysis were carried out to determine the cushion properties. An optimization design was adopted to determine the best design parameter. The results showed that the influence of length ( a ) on specific energy absorption was more important than the degree ( θ ). The best parameter was found to be length less than 4 mm and angle around 11 degrees. The bionic structure of luffa sponge may show a novel perspective on natural cellular material. The findings demonstrate the great potential for designing hierarchical cellular structures and broad application prospects in the field of cushioning and energy absorption.

1. Introduction

Over millions of years, some natural structures have achieved more carrying capacity with lower energy consumption [1,2,3]. With the rapid development of the aerospace and transportation industries, high-strength, lightweight structures are in great need [4,5]. The energy-absorbing structure with minimum weight and higher strength has becomes the focus of several studies [1,6,7].
Existing bionic objects include durian, palm, beetle Coleoptera, mother-of-pearl, fish scales, insect’s forepaws, etc. [8,9,10,11]. For example, the honeycomb structure is widely used in the aerospace industry and heavy packaging. Inspired by the unique microstructure of pomelo peel, Zhang et al. [11] researched a new type of hierarchical honeycomb structure, and studied the compressive and energy absorption properties of this structural material. Combining theory and finite element analysis (FEA) research, the energy absorption properties of the pomelo peel can be improved by increasing the structural hierarchy. The research results of pomelo peel bionic honeycomb materials provide a new perspective for the excellent mechanical properties of natural honeycomb materials and provide new ideas for the application of bionic engineering materials. Ha et al. [9] used durian shell material as an alternative green material and imitated its structural characteristics to design a bionic packaging structure. The peel layer and spines in durian are important components of energy absorption because they protect the pulp during the durian landing process. Therefore, many researchers have been inspired by nature to obtain a structure with excellent mechanical performance.
Luffa sponge is a natural fibrous network structure obtained by removing the outer skin and seeds of mature luffa fruits. Luffa sponge consists of four parts, which are O (out layer), M (middle layer), I (inner layer) and C (core layer) respectively, including the three main directions in Figure 1.
Luffa sponge has excellent mechanical properties. Fan et al. [12] were inspired by the porous model in the central part of the luffa cylinder. The foamed aluminum material was improved by inserting the carbon fiber composite thin-walled tube into the foamed aluminum. The experimental results show that the improved material has stronger energy absorption performance. Shen et al. [13] tested the mechanical properties of luffa sponge samples for the first time. The results show that the stiffness, strength and energy absorption properties of luffa sponge can be compared with metals such as aluminum foam and Ni-P microcrystalline alloys at the same density. Xie et al. [14] researched quasi-static compression test on luffa sponge, and the results showed that there were three deformation stages for the stress-strain curve of the luffa sponge, the elastic stage, the plateau stress stage, and the densification stage. It has a long plateau stress stage which means excellent buffer material. Shen et al. [15] further investigated the dynamic mechanical properties of the luffa columnar samples. It was found that the compressive strength, plateau stress and specific absorption energy of luffa sponge showed obvious strain rate effects. In a word, luffa sponge is an environmentally friendly lightweight porous engineering material with great development potential.
Nowadays, fractal structures have been studied and enhance mechanical properties. The essence of the fractal theory is to describe some grossly irregular and fragmented facets of nature [16]. It is more convenient than other methods to describe some natural growing plants and can be used to design a bionic structure. At present, the fractal theory has achieved some success in guiding the design of bionic structures. Zhang et al. [17] observed the structure of spider webs, and used fractal theory to design bionic thin-walled tubular structures. Using the regular hexagon of the spider web as the basic structural unit, small hexagonal structures are placed at the apex positions of each hexagon. Based on the principle of symmetry and self-similarity using fractal theory, a bionic thin-walled tubular structure is designed. The parametric design combined with FEA, energy absorption of fractal structures. Wang et al. [18] established a thin-walled buffer structure model based on the Koch fractal structure, mixed basic Koch fractal structures with circles and hexagons, and designed a variety of mixed fractal structures. Each mixed fractal structure was designed by repeating the basic fractal element. The result shows that hybrid Koch absorbers have higher crashworthiness. Fractal structures tend to have a high self-similarity and symmetry [19], which is consistent with the observed features in natural luffa sponge and can be used to guide structural design.
The current study of luffa sponge focuses onits mechanical properties. Wang et al. [20] studied the compression behavior of luffa-filled tubes and regard luffa sponge as a part. However, they did not mention the contribution of the I layer. By observing the fiber texture of the I layer, it can be found that the fibers were arranged along the axis, and a few fibers were arranged along the circumferential direction. The O layer of fiber is mainly in accordance with the circumferential arrangement. The M layer fibers lie in between and grow in both directions. Chen et al. [21] separately extracted four different structural parts and single luffa fibers of columnar luffa samples, and studied their structure and mechanical properties. The results show that Young’s modulus and breaking strength of single fiber of luffa sponge are equivalent to wood fiber, which are about 2.3 GPa and 103 MPa respectively, and the average mechanical strength of the inner section of luffa sponge are about 1.6 times of the core part.
Inspired by the excellent mechanical structure of the I layer, this paper aims to prepare a bionic structure with excellent cushioning properties by studying the hierarchical structure of a luffa sponge. The main flow chart of this paper is shown in Figure 2. Firstly, the morphology of luffa sponge is observed and determines the main cushioning section. Then, a three-dimensional model is built according to the feature structure by the fractal theory and Python programming, and prepared by 3D printing. Then, FEA and quasi-static compression experiments are carried out to obtain the cushion properties. Finally, an optimization method is adopted to find the best design parameter to improve energy absorption.

2. Materials and Methods

2.1. Geometry of Bionic Structure

The luffa sponge used in this experiment were purchased from Yiwu Nuannuan Products Co., Ltd. (Zhejiang, China). To ensure the uniformity of experimental samples, this study selected a luffa sponge with as similar a structure as possible. In this study, the texture of the luffa sponge was analyzed by micro-computed tomography (micro-CT) technology (AX-2000 CT, Always Imaging Co., Ltd., Shanghai, China) to observe the internal morphology of the luffa sponge. The three-hole luffa sponge was selected for observation. The sizes of luffa sponge slices were similar in height (50 mm) and diameter (70 mm).
The results of the micro-CT show that the I layer is more densely arranged in three high-density areas, as shown in Figure 3. Arranged along the circle of the cross-section of the luffa sponge, density of the C layer and the rib part connected to the I layer is lower. Generally, for porous materials, the higher the density, the stronger the resistance to external forces. It is found that the fiber arrangement in the I layer shows a certain regularity in the random arrangement of local fibers. Secondary fibers are continuously split from the primary fibers, and there are crossovers and splits between the secondary fibers. Extracting the fiber texture of the I layer can be simplified into a tree-like structure, similar to the trunk and branches of a tree. In our experiment, it is observed that the fiber of the I layer is stronger than other sections, and the local texture has a certain self-similarity relationship with the overall texture, which is a satisfied fractal theory. More details can be seen in Appendix A, Figure A1.
In this section, we used Python 3.7 programming language to design a fractal 2D structure and then import it into CAD software and get a 3D fractal model. By mirroring and arraying the left and right representative volume element (RVE), the final bionic model is obtained, as shown in Figure 4.
The bionic model was designed by fractal theory based on the morphology of the luffa sponge I layer. The RVE of the bionic model is shown in Figure 5. RVE model is composed of three order layers, corresponding to 1 s t , 2 n d , 3 r d . Every rib orientates θ degrees along the axis of symmetry. The first order contains only one rib, corresponding to a ; the second-order contains two ribs, corresponding to b 1 and b 2 ; the third-order contains four ribs, corresponding to c 1 , c 2 , c 3 and c 4 . The length and width of REV correspond to l and w respectively, and a = b 1 = b 2 , l > l 2 > l 1 .
In order to understand RVE model and calculate the length and angle, the RVE model is simplified to simple geometry as shown in Figure 5b, but that doesn’t represent real RVE model. RVE is parameterized by lengths a , b , c , l , w and angle θ . More details can be seen in Appendix B.

2.2. Sample Preparation

The mechanical property of thermoplastic polyurethane (TPU) is similar to luffa sponge, which can be restored under large deformation [22]. So TPU material was adopted in this research. In this study, a 3D printing method of fused deposition modeling (FDM) was used to prepare a bionic structure. In order to ensure the uniformity of the experiment and reduce the error interference of 3D printing, the room temperature, and humidity are set to 25 °C and 40% RH. The printing parameters of all models are described in Table 1.

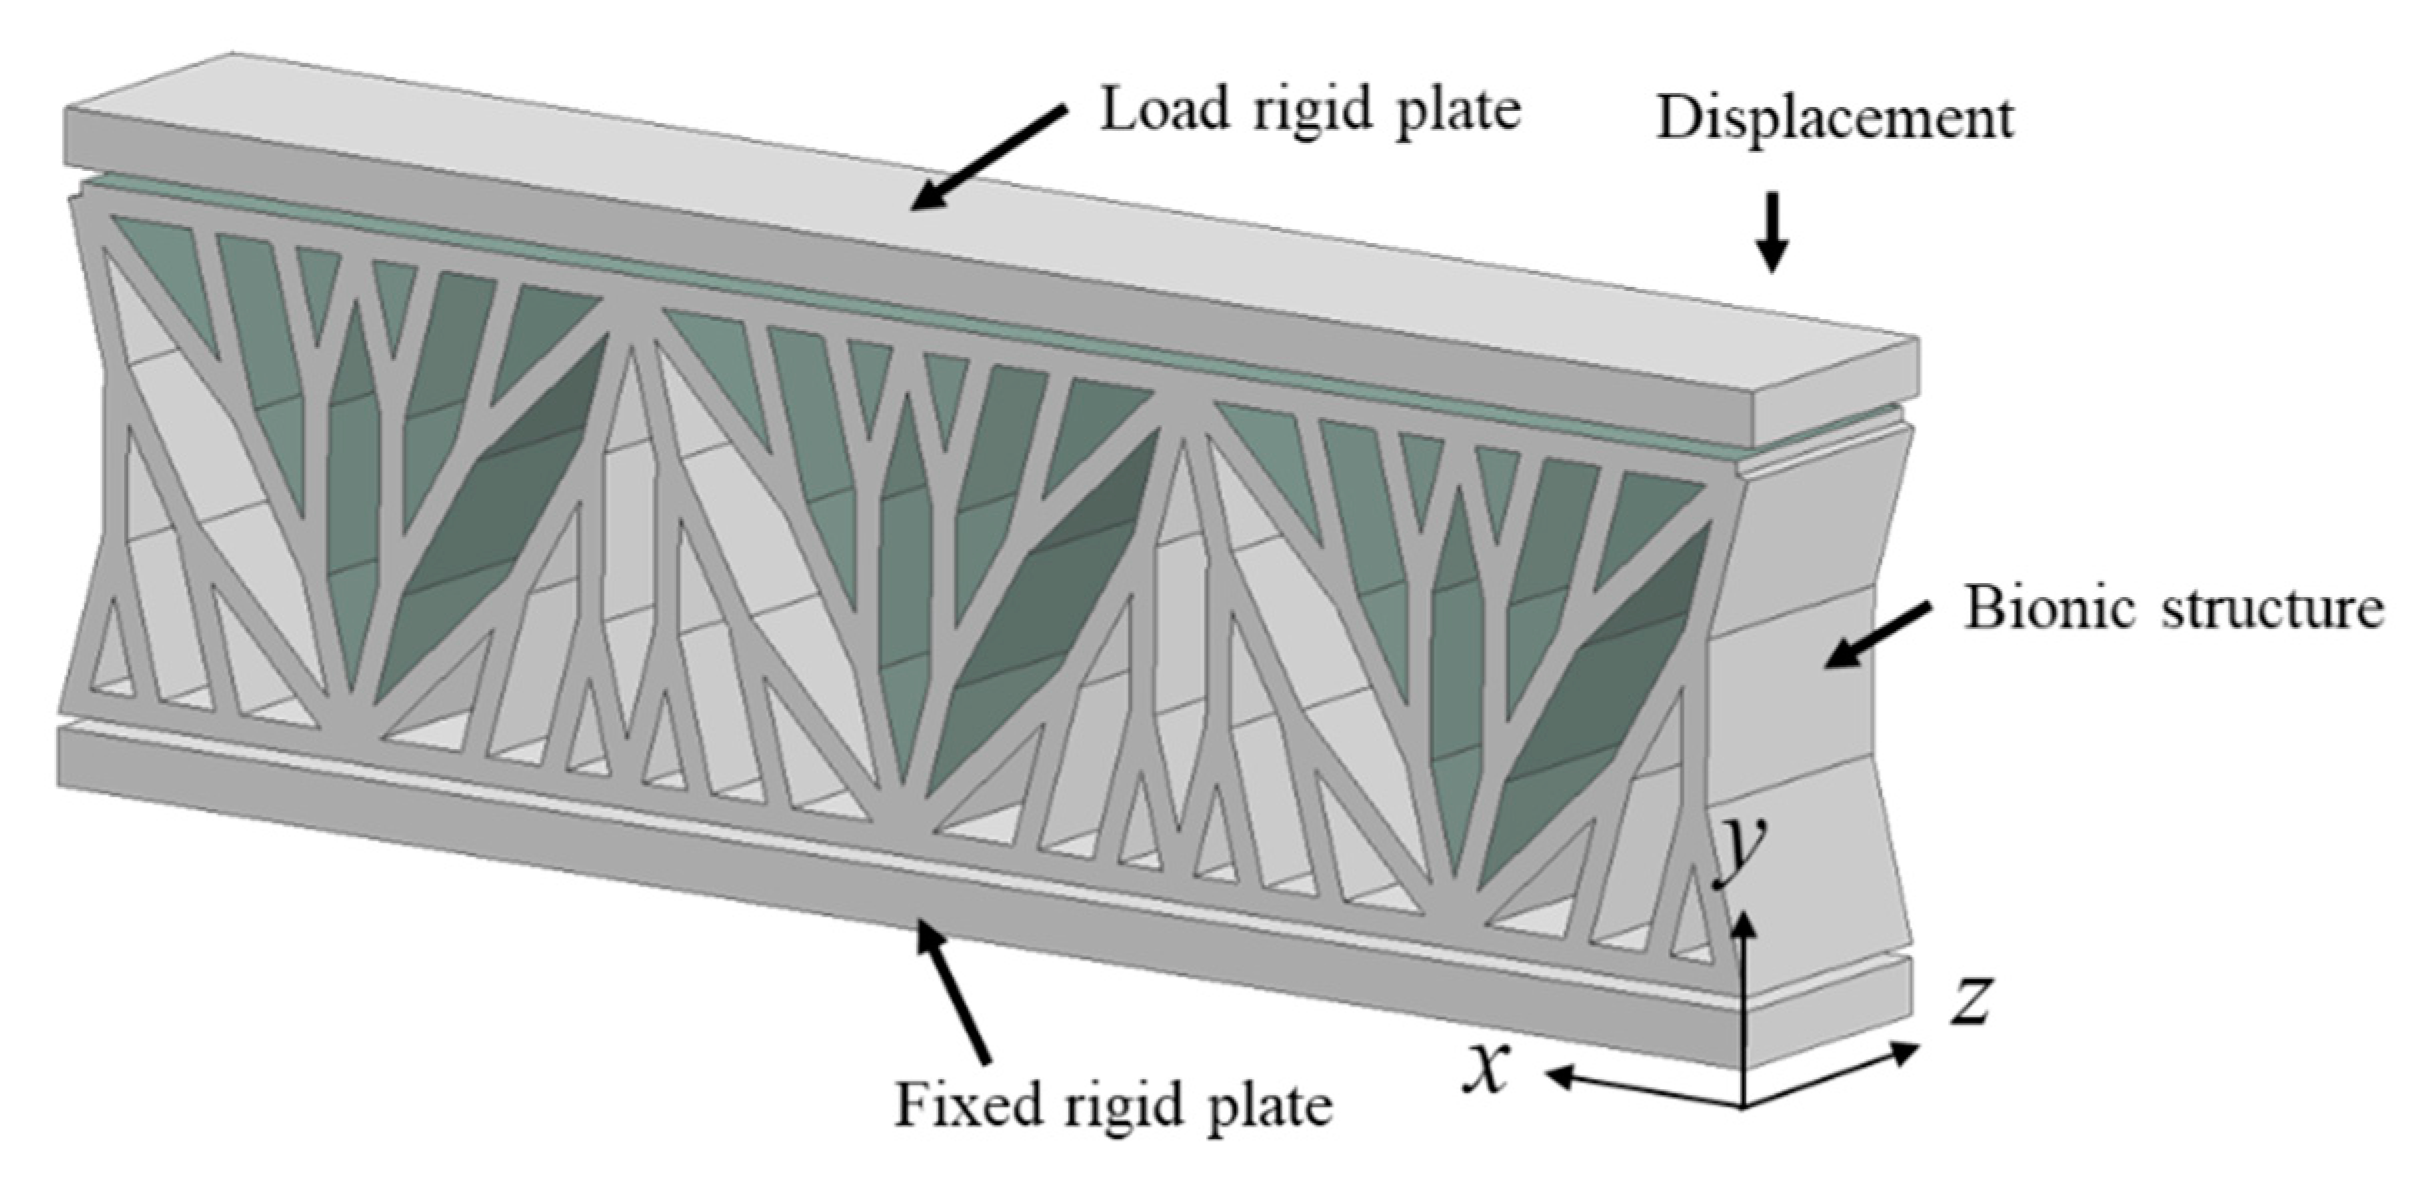
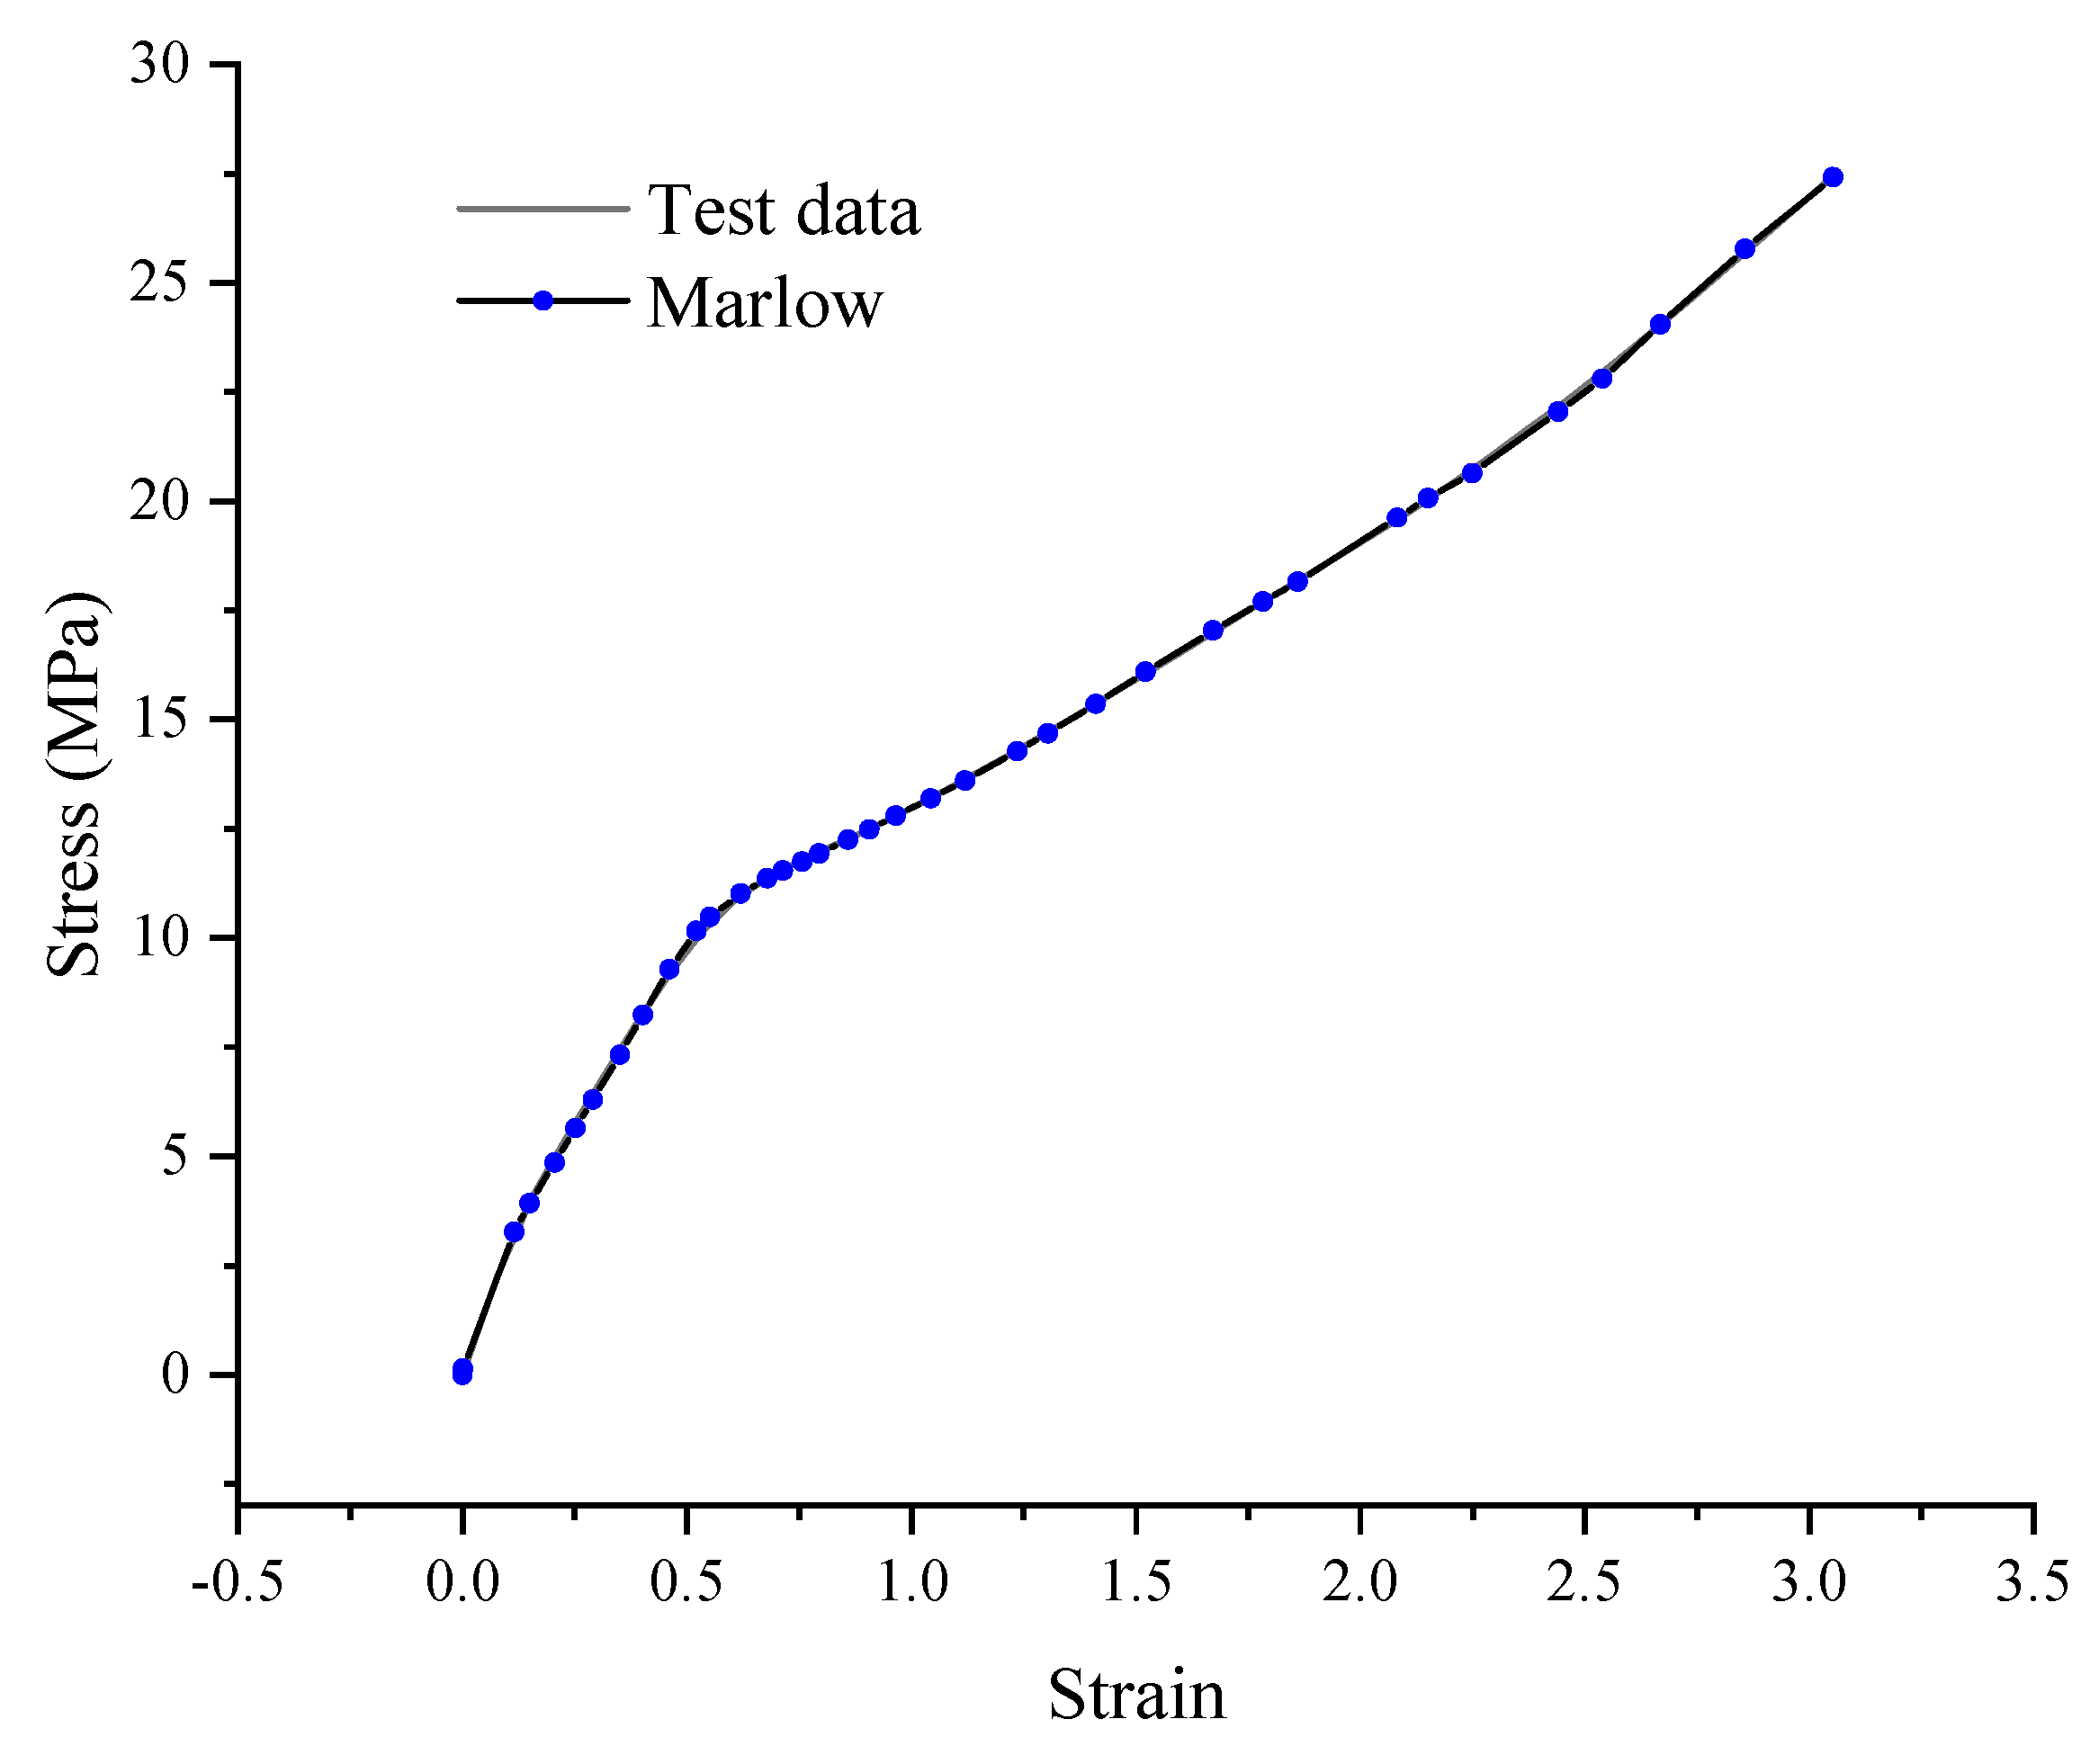
2.3. Finite Element Modelling

In this study, ABAQUS/Explicit was used for investigating the bionic structure. The FEA model consisted of the shell elements and discrete rigid plates, as shown in Figure 6. Discrete rigid plates were adopted to load and support the model. All models arrayed three RVE along x direction. R3D4 element was selected as a rigid plate and the S4R element was considered by the TPU model. The TPU model was arrayed by repeating the RVE model with the dimension of 67.69 mm × 18.59 mm.
As TPU is a high elastic and high strain material, its compression deformation is similar to rubber material [23]. Here, the Marlow criterion is selected to describe the mechanical properties of materials. In Figure 7, dog-bone samples were printed by a 3D printer (HORI E5, Beijing Hui Tian Wei Technology Co., Ltd., Beijing, China) according to ISO 527-2:1993 standard. Directly input the stress and strain value of the dog-bone sample under quasi-static test, and get the parameter by fitting input data as Figure 8.
The strain energy for Marlow as:
U = U d e v ( I ¯ 1 ) + U v o l ( J e l )
I ¯ 1 = λ ¯ 1 2 + λ ¯ 2 2 + λ ¯ 3 2
λ ¯ i = J 1 3 λ i
where the U is energy per unit of reference volume, with U d e v as its deviatoric part, U v o l as its volumetric part; I ¯ 1 is the first deviatoric strain invariant; J e l is the elastic volume ratio; λ i are the principal stretches [23].
Also, we applied a general contact to the model and to ensure without initial penetration. The tangential contact friction was set as 0.3 and normal contact was defined as hard contact. The fixed rigid plate was constrained fully. X- and z-directions of freedom of load rigid plate were constrained, y-direction is free. A displacement constraint was adopted, as shown in Figure 6. A smooth step amplitude was used in this paper to minimize the dynamic effects, which is applied to the displacement of the top plate. An average loading rate of 1 m/s was used to ensure that the quasi-static results were obtained by the convergence study on the loading rates. In this study, different mesh sizes were set to observe the mesh sensitivity. In terms of balance calculation accuracy and calculation time cost, 1 mm mesh was selected by the TPU model and 4 mm mesh was adopted by a rigid plate in this paper to be an integral multiple of the geometric size of the model.

2.4. Quasi-Static Compress

Quasi-static compression tests were carried out by a universal testing machine with a capacity of 10 kN (CMT4104, Wance Technology Co., Ltd., Shenzhen, China) at strain rates of 5 mm/min, to get quasi-static mechanical properties. All samples were treated under the same temperature and humidity. The force and displacement were automatically recorded by a computer and calculated the stress and strain values.

2.5. Indicator of Cushion Properties

Energy absorption ( E A ): Energy absorption is used to estimate an energy absorber’s ability to dissipate crushing energy through plastic deformation. It can be written as follows:
E A ( d ) = 0 d F ( x ) d x
where F ( x ) is the crushing force with the x displacement, d denotes the effective deformation distance.
Specific energy absorption ( S E A ): The absorbed energy by a structure per unit mass is given by [1]:
S E A = E A ( d ) m
where m is the mass of the energy absorber. This indicator is used to compare the energy-absorbing ability of different structures.
Specific energy absorption per unit volume ( S E A v ): This denotes the energy absorption by unit volume and equals to the area under the stress–strain curve. The specific energy absorption can be written as [1]:
S E A v = E A ( d ) V
Energy absorption efficiency ( η ): This denotes the efficiency of the energy dissipation, which can be written as [24]:
η = 0 ε d σ ( ε ) d ε σ a ,   0 ε a 1
d η ( ε a ) d ε | ε a = ε i = 0 , 0 ε i 1
Let σ a denote stress, when η reaches the max value, the corresponding densification strain is ε d , the plateau stress σ p l is calculated as [13]:
σ p l = 0 ε d σ ( ε ) d ε ε d

3. Results and Discussion

3.1. Numerical Analysis Results

Each RVE undergoes a regular stable crushing, which is the ideal mode of energy absorption. Underthe compression process, the axial deformation starts from the top and gradually expands to the bottom. The ribs are squeezed and deformed with each other. The overall deformation of the 15 degrees TPU model is shown in Figure 9. After the model is subjected to the load, the rib plate of the middle support of the model begins to squeeze and accumulate, which is consistent with the phenomenon observed in the actual experiment. The comparison between the experimental results and the prediction results show that the FE model better reflects the deformation characteristics under different crushing displacements. In addition, Figure 10 shows the corresponding stress-strain curves of the luffa sponge, FEA and TPU models. As the crushing continues, there are no periodic fluctuations at regular intervals. This result shows that the thin-walled structure always deforms, so maintaining a stable state is an ideal deformed state.
By analyzing the stress-strain curves, there are good agreements between FEA, experiment and luffa sponge at the initial stage. At the stage of plateau stress, TPU experiment stress is higher than luffa sponge, but FEA and luffa sponge are similar. Experiment and FEA densification strain values are lower than luffa sponge. However, there are some errors between these differences. The main reason is the flexibility of TPU material under large deformation. In addition, the 3D printing process also leads to the difference. Lastly, the mechanisms are similar between the TPU experiment and FEA. Therefore, the FE model has now been validated and can be used to study the cushion properties of the new model in subsequent studies.

3.2. The Energy Absorption Properties of Bionic Structure

During the compression process, parts of the rib plates were distorted and bonded together to form three circular regions. The compression continues to reach the densification stage, all plates bend and compress together. When the load cell was removed, and the shape of the model was restored to 96% in one minute.
In Figure 11, the stress-strain curve is divided into three regions: elastic region, plateau region, and densification region. When the energy absorption efficiency ( η ) reaches the max value, densification strain ( ε d ) is 39.44%, and the plateau stress ( σ p l ) is 0.53 MPa. Elastic modulus ( E s ) is 9.4 MPa. In this study, when the deformation reaches densification stage, it cannot absorb energy well, so we set the densification as the energy absorption endpoint. By fitting the curves of stress-strain, specific energy absorption per unit volume ( S E A v ) is 192.16 kJ/m3, and specific energy absorption per unit mass ( S E A ) is 0.31 J/g of 15 degrees TPU model.
The energy absorption efficiency curves were investigated between FEA, experiment and luffa sponge, as shown in Figure 12. The corresponding relationship of the FEA result confirms the agreement of the experiment of the 15 degrees TPU model. The energy absorption efficiency of the luffa sponge is higher than the other model, which is up to 47.28%. In addition, S E A v and S E A were investigated in this study. From Figure 13, S E A v and S E A are similar in the FEA and experiments. However, there are some differences between luffa sponges. From the S E A results, the luffa sponge can absorb more energy by unit mass than the bionic structure. From the S E A v results, the values of FEA and Exp are 205.25 kJ/m3 and 192.16 kJ/m3 respectively and luffa sponge is 274.83 kJ/m3, which means the cushion property of the FEA model is the same as the Exp. However, there is still a little gap with the luffa sponge.
The quasi-static compression of the bionic structure as a whole shows lateral expansion. However, the local sections were contracted in the lateral direction, which is similar to the deformation of negative Poisson’s ratio material. The structure of bionic rib is similar to the re-entrant hexagon honeycomb structure. This honeycomb structure is a negative Poisson’s ratio material. Large deformations in the local concave corners completely overlap. The model shrinks in both the vertical and horizontal direction. The local density of the material instantly increases, which leads to resistance of the impact force. This may also be the main reason for the bionic model entering the densification stage earlier than the luffa sponge.

3.3. The Influence of Design Degree

By parametric design, it is necessary to find the influence on crashworthiness under compression tests. In this research, the relative density method is adopted to control the parameter of the TPU model. Relative density is defined as the area of the material divided by the total area of the RVE. In this study, relative density is considered to be constant at 42%. According to the design principle of the relative density method, the model is designed by varying angles and thicknesses of the shell. They are designed in four kinds of TPU models, as shown in Table 2.
The test conditions of 9, 11 and 13 degrees TPU models are the similar with the 15 degrees TPU model for mechanical performance testing. As shown in Figure 14, the stress-strain curves of the four models are basically consistent. The 11 degrees TPU model has obvious upper and lower yield points, which is not always true for other models. The corresponding elastic modulus is the lowest.
According to Table 3, the results show that the elastic modulus, yield strength, plateau stress are all close. However, the elastic modulus of the 11 degrees TPU model is the lowest, and the elastic modulus of the remaining three groups of models is relatively close. The yield point corresponding to the 11 degrees TPU model is also the lowest, but it is close to that of 9 degrees and 13 degrees. The yield strength of 15 degrees TPU model is the highest, and the corresponding relationship also has the plateau stress stage. Observing specific energy absorption by unit mass ( S E A ), the values fluctuate with design degrees, and specific energy absorption by unit volume ( S E A v ) stays the same. The results show that specific energy absorption will change as the design degree varies, while more regularity is required to design the experiments.

3.4. Optimization of Bionic Structure

Since the mechanical properties are non-linear in the geometric structure of the bionic structure, the experiment is designed based on DOE (Design of experiment), and optimized by the response surface method (RSM) [25]. Optimization goals can be simplified to:
Opt .   {   Max : SEA 8 θ 16 4 a 8
The design takes the energy absorbed per unit mass ( S E A ) as the objective function and constraints on length ( a ) and angle ( θ ). The value of a ranges from 4 to 8 mm, and the value of θ ranges from 8 to 16 degrees. As is shown in Figure 15, with the same deformation angle, the specific energy absorption value increases significantly as the value of length continuously decreases. With the same length, as the angle increases, the specific energy absorption value fluctuates. When the length varies from 7 to 8 mm, the specific energy absorption value is the highest, which corresponds to 12 degrees. When the range is between 5 and 7 mm, the specific energy absorption values around 8 degrees and 16 degrees are the lowest, but those around 12 degrees are higher. When the range is between 4 and 5 mm, the specific energy absorption value is inclined to lower degrees. Changing the design angle has little effect on the specific energy absorption value of the model. The reduced length improves the specific energy absorption value. The best length is less than 4 mm. The best angle is around 11 degrees. The exact value also depends on the preparation cost and processing accuracy. Generally, the size of the model continues to decrease, and the corresponding manufacturing costs continue to increase. The size mainly refers to the manufacturing accuracy rather than the macro volume. In the actual manufacture of 3D printing process, a higher precision corresponds to more expensive equipment investment and more time. It ensures that the model details are accurate enough. The optimization of bionic structure points out the direction for the design of the bionic structure in the future.

3.5. Comparison and Discussions

The specific energy absorption values of the bionic structure are compared in Figure 16. The specific energy absorption value of the bionic structure is close to that of the luffa sponge. With the same specific energy absorption value, the bionic structure corresponds to a higher specific strength, but there is still a gap compared with foam-filled metal honeycomb and rubber lattice structures. The research in this paper is mainly based on a quasi-static compress. The velocity effect under dynamics needs further study. Many existing studies have shown that velocity has an impact on the mechanical properties of materials [15,26]. In addition, TPU filament was used in this study, and its density was 1200 kg/m3. The advantage is that the TPU material is a kind of hot-melt material, which is easy to process, has excellent resilience performance and can be reused. It can effectively reduce the single-use cost with more time. However, the high density limits its mechanical properties. TPU is not the most suitable material, and the properties of the material itself have a great influence on the mechanical properties. The lateral comparison of using other materials is the main content of the next stage in order to find the most suitable material. The bionic structure is similar to the tree structure, where the latter has been widely used in the building field [27]. However, this type of structure is rarely used in the design of cushioning, shock absorption and packaging structure. As an application example, we present a concept of transport pallet based on the luffa sponge bionic structure, as shown in Figure 17. The new pallet adopts the bionic structure parts instead of the traditional solid wood pad to bear the main load. Due to its good resilience, it can provide lasting protection for products, so it is greatly suitable for the transportation of precision instruments. The bionic structure has been greatly expanded due to the study of the luffa sponge, which is a potential research direction in the future.

4. Conclusions

In this study, inspired by luffa sponge, the bionic structure of the luffa sponge was designed based on fractal theory and prepared by 3D printing technology. The bionic structure was subjected to mechanical experiment and FEA, from which we can draw the following main conclusions:
  • Fractal theory can be used to successfully design a bionic structure and enrich the ideas and methods of bionic structure design.
  • The quasi-static compression experiment and FEA results of the bionic structure are in good agreement; and the cushion performance of the bionic structure is close to that of luffa sponge according to S E A and specific strength map.
  • By optimization designing, the influence of design degrees ( θ ) on energy absorption was less than length ( a ). So, the length is a key parameter to design geometry and enhance energy absorption.
In the future, our study will focus on improving the cushioning properties of the bionic structure and preparing them by using different materials. The bionic structure inspired by luffa sponge may show a novel perspective on natural cellular material and broad application prospects.

Author Contributions

The bionic structure was designed and researched by Y.X. and H.B., Z.L. and N.C. contributed to the data collection and model design. H.B. mainly contributed to FE analysis and organized the results. The authors contributed equally to writing the paper and through reading. All authors have read and agreed to the published version of the manuscript.

Funding

This research was funded by National Nature Science Foundation of China (61170101), Green Packaging and Security Special Research Fund of China Packaging Federation grant number [2016ZBLY06].

Acknowledgments

The financial support by National Nature Science Foundation of China (61170101), Green Packaging and Security Special Research Fund of China Packaging Federation (2016ZBLY06) is gratefully acknowledged.

Conflicts of Interest

The authors declare that they have no conflict of interest.

Abbreviations

The following abbreviations and nomenclature are used in this manuscript:
θ Design degree of bionic structure
t Thickness of model shell
l The length of RVE model
w The width of RVE model
a The length of 1 s t order rib
b The length of 2 n d order rib
c The length of 3 r d order rib
ε d Densification strain
σ p l Plateau stress
E s Elastic modulus
η Energy absorption efficiency
U Energy per unit of reference volume in Abaqus
E A Energy absorption
S E A v Specific energy absorption per unit volume
S E A Specific energy absorption per unit mass
D Fractal dimension
N r The number of box

Appendix A

In this section, the fractal dimension of the I layer’s fiber texture has been used to describe the texture of the fiber. Firstly, four groups of luffa sponge specimens were randomly selected and named A/B/C/D. Every specimen was cut into four groups, each size 10 mm × 10 mm, and captured with a digital camera (Nikon D5300). It was ensured that the parameter of the camera was consistent. Then, all fractal pictures were saved into the TIFF format. Then, the fractal pictures were transformed into an 8-bit binary picture by the ImageJ software [29], which is a open-source software and be used for free. Lastly, we imported fractal pictures into a fractal box-counting module of ImageJ software and calculated fractal dimension.
This paper adopts the method of the box-counting approach to calculate the fractal dimension of the luffa sponge. The basic principle of the box-counting approach is to cover the fractal pattern with the square grid. The number of grids increases as the length of the grid decreases. In the limit for a fractal curve, the rate at which the proportion of filled squares decreases gives the fractal dimension. The log of the number is plotted against the log of the grid size. The relationship between number and grid size is plotted [30,31]:
N r = a r D
D = log ( N r ) log ( 1 / r )
where N r is the number of box, r is the size of box-edge length, a is a factor, D is the slope of the plot of log ( N r ) vs. log r and D is the fractal dimension.
The result as shown in Figure A1, the mean of all fractal dimensions is 1.93. The higher fractal dimension means the texture more complicated. According to Figure A1, it is found that the fractal dimension of the I layer of the luffa sponge is the same, and will not be changed by the positional change, which also ensures the reliability of the fractal theory. Also, we calculated the fractal dimension of the bionic model and the mean is 1.82, a value lower than the luffa sponge. However, we consider that the fractal algorithm can be used to design the bionic model because their fractal dimensions are very close.
Figure A1. (a) The fractal dimension of four kinds of luffa sponge; (b) specimen from luffa sponge’s I layer.
Applsci 10 02584 g0a1

Appendix B

All bionic structure parameters can be calculated through the following equation:
a = b 1 = b 2
w = w 1 + w 2 + w 3
w = 2 a cos θ + a
w 1 = a cos θ
w 2 = a cos ( 2 θ )
w 3 = a ( 1 + cos θ cos ( 2 θ ) )
l 1 = a sin θ
l 2 = a sin ( 2 θ ) + l 1
l = w 3 tan ( 3 θ ) + l 2

References

  1. Ha, N.S.; Lu, G. A review of recent research on bio-inspired structures and materials for energy absorption applications. Compos. Part B Eng. 2020, 181, 1–38. [Google Scholar] [CrossRef]
  2. Hao, P.; Du, J.X. Energy absorption characteristics of bio-inspired honeycomb column thin walled structure under impact loading. J. Mech. Behav. Biomed. Mater. 2018, 79, 301–308. [Google Scholar] [CrossRef] [PubMed]
  3. Peng, M.; Wen, Z.; Xie, L.; Cheng, J.; Jia, Z.; Shi, D.; Zeng, H.; Zhao, B.; Liang, Z.; Li, T.; et al. 3D Printing of Ultralight Biomimetic Hierarchical Graphene Materials with Exceptional Stiffness and Resilience. Adv. Mater. 2019, 31, 1–9. [Google Scholar] [CrossRef] [PubMed]
  4. Yang, J.; Gu, D.; Lin, K.; Yang, Y.; Ma, C. Optimization of bio-inspired bi-directionally corrugated panel impact-resistance structures: Numerical simulation and selective laser melting process. J. Mech. Behav. Biomed. Mater. 2019, 91, 59–67. [Google Scholar] [CrossRef]
  5. Xie, Y.; Gao, Y.; Zhang, S.; Bai, H.; Liu, Z. Sustainability Evaluation of Product Packaging System with a Three-Stage Network Data Envelopment Analysis Methodology. Appl. Sci. 2019, 9, 246. [Google Scholar] [CrossRef] [Green Version]
  6. Yang, K.; Xu, S.Q.; Shen, J.H.; Zhou, S.W.; Xie, Y.M. Energy absorption of thin-walled tubes with pre-folded origami patterns: Numerical simulation and experimental verification. Thin Walled Struct. 2016, 103, 33–44. [Google Scholar] [CrossRef]
  7. Fleck, N.; Deshpande, V.S.; Ashby, M.F. Micro-architectured materials: Past, present and future. Proc. R. Soc. A Math. Phys. Eng. Sci. 2010, 466, 2495–2516. [Google Scholar] [CrossRef]
  8. Arjangpay, A.; Darvizeh, A.; Tooski, M.Y. Effects of Structural Characteristics of a Bionic Dragonfly Wing on Its Low Velocity Impact Resistance. J. Bionic Eng. 2018, 15, 859–871. [Google Scholar] [CrossRef]
  9. Ha, N.S.; Lu, G.; Shu, D.; Yu, T.X. Mechanical properties and energy absorption characteristics of tropical fruit durian (Durio zibethinus). J. Mech. Behav. Biomed. Mater. 2019, 104, 1–13. [Google Scholar] [CrossRef]
  10. Hao, P.; Du, J.X. Mechanical properties of bio-mimetic energy-absorbing materials under impact loading. J. Mater. Sci. 2018, 53, 3189–3197. [Google Scholar] [CrossRef]
  11. Zhang, W.; Yin, S.; Yu, T.X.; Xu, J. Crushing resistance and energy absorption of pomelo peel inspired hierarchical honeycomb. Int. J. Impact Eng. 2019, 125, 163–172. [Google Scholar] [CrossRef]
  12. An, X.Y.; Fan, H.L. Hybrid design and energy absorption of luffa-sponge-like hierarchical cellular structures. Mater. Des. 2016, 106, 247–257. [Google Scholar] [CrossRef]
  13. Shen, J.H.; Xie, Y.M.; Huang, X.D.; Zhou, S.W.; Ruan, D. Mechanical properties of luffa sponge. J. Mech. Behav. Biomed. Mater. 2012, 15, 141–152. [Google Scholar] [CrossRef] [PubMed]
  14. Xie, Y.; Liu, L.; Gao, Y.F.; Zhang, S.H. Study on Energy Absorption Property of Luffa Sponge Under Static Load. Packag. J. 2017, 9, 39–44. (In Chinese) [Google Scholar] [CrossRef]
  15. Shen, J.H.; Xie, Y.M.; Huang, X.D.; Zhou, S.W.; Ruan, D. Behaviour of luffa sponge material under dynamic loading. Int. J. Impact Eng. 2013, 57, 17–26. [Google Scholar] [CrossRef]
  16. Mandelbrot, B. The Fractal Geometry of Nature. J. R. Stat. Soc. Ser. A 1984, 147, 170–180. [Google Scholar] [CrossRef]
  17. Zhang, Y.; Wang, J.; Wang, C.; Zeng, Y.; Chen, T. Crashworthiness of bionic fractal hierarchical structures. Mater. Des. 2018, 158, 147–159. [Google Scholar] [CrossRef]
  18. Wang, J.; Zhang, Y.; He, N.; Wang, C.H. Crashworthiness behavior of Koch fractal structures. Mater. Des. 2018, 144, 229–244. [Google Scholar] [CrossRef]
  19. Zhang, Y.; Lu, M.H.; Wang, C.H.; Sun, G.Y.; Li, G.Y. Out-of-plane crashworthiness of bio-inspired self-similar regular hierarchical honeycombs. Compos. Struct. 2016, 144, 1–13. [Google Scholar] [CrossRef]
  20. Wang, X.J.; Shen, J.H.; Zuo, Z.H.; Huang, X.D.; Zhou, S.W.; Xie, Y.M. Numerical investigation of compressive behaviour of luffa-filled tubes. Compos. Part B Eng. 2015, 73, 149–157. [Google Scholar] [CrossRef]
  21. Chen, Q.; Shi, Q.; Gorb, S.N.; Li, Z.Y. A multiscale study on the structural and mechanical properties of the luffa sponge from Luffa cylindrica plant. J. Biomech. 2014, 47, 1332–1339. [Google Scholar] [CrossRef]
  22. Lin, T.; Lou, C.-W.; Lin, J.-H. The Effects of Thermoplastic Polyurethane on the Structure and Mechanical Properties of Modified Polypropylene Blends. Appl. Sci. 2017, 7, 1254. [Google Scholar] [CrossRef] [Green Version]
  23. Hamzehei, R.; Kadkhodapour, J.; Anaraki, A.P.; Rezaei, S.; Dariushi, S.; Rezadoust, A.M. Octagonal auxetic metamaterials with hyperelastic properties for large compressive deformation. Int. J. Mech. Sci. 2018, 145, 96–105. [Google Scholar] [CrossRef]
  24. Li, Q.M.; Magkiriadis, I.; Harrigan, J.J. Compressive Strain at the Onset of Densification of Cellular Solids. J. Cell. Plast. 2006, 42, 371–392. [Google Scholar] [CrossRef]
  25. de la Rosa, Á.; Ruiz, G.; Poveda, E. Study of the Compression Behavior of Steel-Fiber Reinforced Concrete by Means of the Response Surface Methodology. Appl. Sci. 2019, 9, 5330. [Google Scholar] [CrossRef] [Green Version]
  26. Wang, D.M.; Bai, Z.Y. Mechanical property of paper honeycomb structure under dynamic compression. Mater. Des. 2015, 77, 59–64. [Google Scholar] [CrossRef]
  27. Rian, I.M.; Sassone, M. Tree-inspired dendriforms and fractal-like branching structures in architecture: A brief historical overview. Front. Archit. Res. 2014, 3, 298–323. [Google Scholar] [CrossRef] [Green Version]
  28. Yin, H.; Liu, Z.; Dai, J.; Wen, G.; Zhang, C. Crushing behavior and optimization of sheet-based 3D periodic cellular structures. Compos. Part B Eng. 2020, 182, 1–16. [Google Scholar] [CrossRef]
  29. Schneider, C.A.; Rasband, W.S.; Eliceiri, K.W. NIH Image to ImageJ: 25 years of image analysis. Nat. Methods 2012, 9, 671–675. [Google Scholar] [CrossRef]
  30. Smith, T.G.; Lange, G.D.; Marks, W.B. Fractal methods and results in cellular morphology--dimensions, lacunarity and multifractals. J. Neurosci. Methods 1996, 69, 123–136. [Google Scholar] [CrossRef] [Green Version]
  31. Sarkar, N.; Chaudhuri, B.B. An efficient differential box-counting approach to compute fractal dimension of image. IEEE Trans. Syst. Man Cybern. 1994, 24, 115–120. [Google Scholar] [CrossRef] [Green Version]
Figure 1. The structure of luffa sponge: (a) Nature luffa; (b) Four main parts of luffa sponge; O (out layer), M (middle layer), I (inner layer) and C (core layer); (c) Three main directions of luffa sponge.
Applsci 10 02584 g001
Figure 2. The flow chart of bionic research.
Applsci 10 02584 g002
Figure 3. The micro-computed tomography (micro-CT) scan picture of luffa sponge: (a) Cross section of luffa sponge; (b) Three high-density areas of luffa sponge; (c) Cross section of nature luffa; (d) Vertical section of luffa sponge; (e) Texture of I layer; (f) Simplified structure of I layer.
Applsci 10 02584 g003
Figure 4. The evolution of bionic structures: (a) Three different fractal styles by Python programming; (b) Mirror representative volume element (RVE) model; (c) Array model of 15 degrees bionic structure.
Applsci 10 02584 g004
Figure 5. RVE model of bionic structure: (a) RVE model; (b) Simplified model of RVE.
Applsci 10 02584 g005
Figure 6. Finite element (FE) model of 15 degrees bionic structure.
Applsci 10 02584 g006
Figure 7. (a) Geometry of dog-bone sample; (b) The dimension of dog-bone sample.
Applsci 10 02584 g007
Figure 8. The fitting data of thermoplastic polyurethane (TPU) material with Marlow criterion.
Applsci 10 02584 g008
Figure 9. The deformation of 15 degrees TPU model under quasi-static compress: (a) The model at the initial position; (b) Compressive displacement equal 1.55 mm; (c) Compressive displacement equal 7.37 mm.
Applsci 10 02584 g009
Figure 10. Stress-strain curves of luffa sponge, TPU, experiment and finite element analysis (FEA) model.
Applsci 10 02584 g010
Figure 11. The stress-strain curve and energy absorption efficiency of 15 degrees TPU model.
Applsci 10 02584 g011
Figure 12. The comparison of energy absorption efficiency ( η ) between FEA, experiment and luffa sponge.
Applsci 10 02584 g012
Figure 13. S E A v and S E A between FEA, experiment and luffa sponge.
Applsci 10 02584 g013
Figure 14. Stress-strain curves and energy absorption efficiency curve of four bionic models.
Applsci 10 02584 g014
Figure 15. Specific energy absorption ( S E A ): (a) 3D surface; (b) 2D contour plot.
Applsci 10 02584 g015
Figure 16. Comparison of S E A and specific strength among bionic structures and the other materials [11,28].
Applsci 10 02584 g016
Figure 17. The application of bionic structure in pallet.
Applsci 10 02584 g017
Table 1. 3D printing parameter.
Diameter of NozzleLayer HeightMesh Fill RatesNozzle Temperature
0.4 mm0.72 mm40%210 °C
Table 2. The size of TPU model.
θ (°)9111315
t (mm)0.660.760.891.00
Table 3. The mechanical property of TPU model.
d E s σ y σ p l η S E A S E A v
(°)(MPa)(MPa)(MPa)%(J/g)(kJ/m3)
99.530.480.4525.960.46191.94
118.390.440.4024.240.26126.20
139.620.470.3923.910.1690.43
159.400.550.5325.410.31192.16

