Featured Application
Environmental protection in mining subsidence areas.
Abstract
The surface discontinuous deformation caused by coal mining has great damage to the ecological environment and threatens the safety of human lives. Focusing on the problem of discontinuous deformation (ground fissures and collapsed pits) in mining areas with a thick loess and thin bedrock, this paper uses a coal panel in southern Shanxi in China as research background, and uses field investigation, theoretical analysis and the particle flow code 2D (PFC2D) numerical simulation method to study the movement of overburden and discontinuous ground deformation of mining areas with a thick loess layer and a thin bedrock. The results show that with the continual advance of the working face, the failure of the overlying rock, the changing of force chain shape and the development of cracks under this geological and mining condition have their unique rules. This study analyzes the law of movement of overburden in coal seam mining, explains why discontinuous deformation of the surface occurs in case of a thick loess layer and thin bedrock, and provides reference for the prediction of fracture development under the same geological conditions and the application of the PFC2D in coal seam mining in different geological conditions.
1. Introduction
Coal is the largest, most widely distributed and cheapest energy source in the world, mainly concentrated in the United States, Russia, China, Australia, India, Germany, South Africa, Ukraine, Kazakhstan, Poland, Brazil and other countries [1,2,3,4]. Mining subsidence causes the overburden to move, deform, and be destroyed [5], especially in thick loess layers and thin bedrock areas. When the bedrock is thin, a fracture in the main roof spread to the surface, causing its discontinuous deformation, ground cracks, collapse pits and landslides, that in turn cause the destruction of surface buildings, interruptions to railways and highways, a decline in the level of shallow water, and the occurrence of geological disasters. For a long time, the problem has engaged academia, and many scholars have made outstanding progress in these areas [6,7,8,9]. Current research on the law of movement of mined surface rock strata has focused on the continuous law of the deformation of the mining subsidence, and few studies have examined the law of discontinuous movement of overlying rock strata in coal seams with a thick loess layer and thin bedrock [10].
Ground cracks, collapse pits and landslides are the most common discontinuous deformation, which may be caused by metal mining, groundwater mining, salt mining, stone mining and coal mining [5], etc. This paper mainly studies the above discontinuous deformation caused by underground coal mining, especially ground cracks. Ground cracks caused by underground coal mining are worldwide, such as in China [11,12], Poland [13,14], India [15], Romania [16], etc. These countries have studied the measurement methods, formation mechanism, and prediction methods of mining ground fractures. Ground collapse pits formed by underground mining are also the main forms of discontinuous deformation, which occur less in China, mainly in Poland [17,18,19,20,21,22], India [23,24,25,26], South Africa [27,28], UK [29,30], Japan [31], Spain [32], Korea [33], Turkey [34], etc. Taking Poland as an example, the monitoring, formation mechanism and prediction model of coal mining collapse pit are focused on. The third type of discontinuous deformation caused by mining is landslides, such as in China [35], India [36], Spain [37], Australia [38], Czech Republic [39], Turkey [40], Greece [41], Russia [42], Slovakia [43], etc. Well mining and open-pit mining cause surface landslides, while open-pit mining induces more landslides. The research on mining landslides mainly focuses on monitoring technology, early warning methods and the formation mechanism of the landslide.
Research on discontinuous surface deformation caused by underground mining is usually carried out by means of simulations, field measurements, theoretical analysis, and numerical calculation. In recent decades, with the development of computer technology, numerical simulations have been widely used to model the discontinuous deformation of the surface. The particle flow code (PFC) is a commercial numerical software developed by Peter Cundall using the theory of mesodiscrete elements (also called particle flow theory). Compared with the numerical simulation software based on a continuous medium, PFC2D/3D can accurately reproduce the development process of mining fracture caused by the instability of overburden structure and can track the exact position of overburden fracture. The disadvantage is that the model construction of practical engineering is more complex and the macroscopic mechanical behavior is difficult to describe. Many scholars have used PFC to carry out numerical simulation studies on coal mining [44,45,46], slope failure [47], excavation of the foundation pit [48], and demonstrated the feasibility of this method for practical engineering. Taking a long wall coal mine of Queensland as an example, Poulsen [44] used PFC to simulate the fissures change of overburden during mining, through calculating the fracture strength and porosity index, the length of the permeable fracture zone above the goaf was determined, and the variation range of permeability was predicted. Zhao [47], taking the Madaling landslide in Guizhou Province, China as an example, used PFC2D to study the failure mechanism and development law of the slope during underground coal seam mining. Jia [48] found, based on particle flow to simulate the excavation of the foundation pit and focusing on the analysis of soil settlement outside the foundation pit and other changes, the results showed that the excavation of the foundation pit and its influence on the surrounding soil can be simulated from the particle mesoparameters and the change of mesostructure can be monitored dynamically.
In this paper, the PFC2D is used to simulate the collapse, fracture development, force chain, and displacement of overlying strata in a panel in southern Shanxi province of China. Through this analysis, the law of discontinuous deformation of the overlying strata and surface is studied, and the dynamic evolution of fractures is tracked and compared with engineering practice. The main contribution of this paper is that it analyzes the discontinuous movement of overlying rock in coal seam mining based on a numerical simulation to explain the mechanism of surface step subsidence, and to analyze the process of evolution of fracture in the mining process. This paper provides a reference for the application of the PFC in coal seam mining under different geological conditions.
2. Materials and Methods
2.1. Overview of Study Area
The coal panel was located in the south of Shanxi province in China, and had a length of 242 m, width of 118 m, and an average mining depth of 160 m. Figure 1 shows the simplified distribution of overlying strata above the working face. The coal seam was 8 m thick. The characteristics of geological occurrence were as follows: The loess layer was thick (125 m), the bedrock was thin (average thickness, 30 m), and was composed of mudstone and siltstone. The coal seam floor is gritstone with an average thickness of 10 m. The lithology was soft, and the average speed of advance of the working face was 33 m per month. The surface slope was 20°.
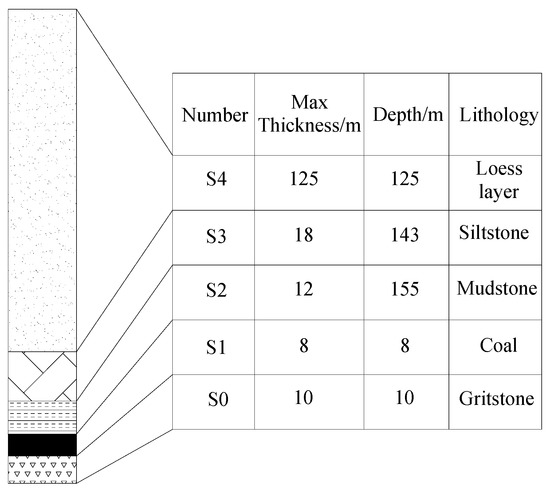
Figure 1.
Simplified distribution of overlying strata above the working face.
The investigation was carried out above the goaf of the working face, and the surface crack was measured by global navigation satellite system real-time kinematic(GNSS-RTK) to obtain its position and shape, and the relationship between the surface crack and terrain and the position of the working face is obtained, as shown in Figure 2. Because of the complex field conditions, the investigators used steel tape to measure the crack width and height, and used an SLR camera to obtain the field crack photos, as shown in Figure 3.
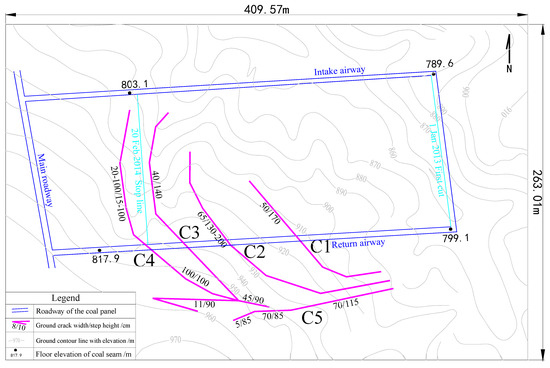
Figure 2.
Position relationship between surface cracks and topography, with working face.
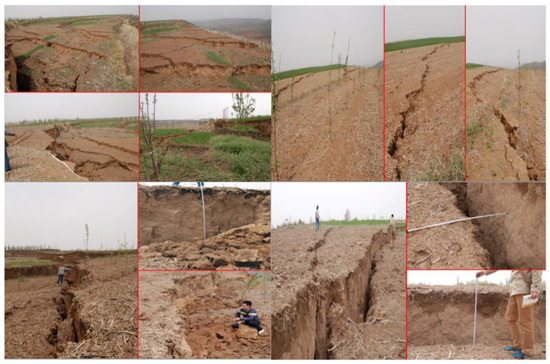
Figure 3.
Surface damage caused by underground mining.
Figure 2 shows five main serious cracks C1–C5 extend from about 35–40 m outside the boundary of the coal panel to the inside, and C1–C4 are roughly parallel to the topographic contour. Crack C1: width 50 cm, length 136 m, step height 170 cm, distance to the first cut line 125m. Crack C2: width 50 cm, length 220 m, step height 120–170 cm, distance to the first cut line 178 m. Crack C3: width 40 cm, length 179 m, step height 140 cm, near the stop line. Crack C4: width 20 cm, length 153 m, step height 100 cm, near the stop line. Crack C5: width 15 cm, length 83 m, step height 100 cm, C5 is parallel to the return airway, and the distance is about 53 m. Therefore, the damage range of surface cracks was large, and the surface collapse and cracks were very serious, as shown in Figure 3.
2.2. Force Analysis on the Structure of Rock Block of the MAIN roof
Aiming at the ground damages under the above geological mining conditions, viz. the main surface cracks were distributed in parallel, and the direction of fracture development was perpendicular to the direction of the slope, and was significantly affected by the surface slope, as shown in Figure 2, we try to explain the mechanism of the above phenomenon by analyzing the failure process of mechanical structures of overburden caused by underground mining.
According to the “arch beam” structure established by Huang for the initial collapse of the surface of thick sandy soil [49] (see Figure 4), the collapse and failure of the overlying strata with the advancing of the working face developed from the bottom to the “arch” shape, forming the “beam” above and the “arch”-type temporary structure below. Considering the thin bedrock in the study area, under the large load of the thick loess layer, once the surface had completely collapsed, the main roof of the thin bedrock burst periodically to form a “step rock beam” structure [50] (see Figure 5). Therefore, the mechanism of ground step sinking can be analyzed by studying the dynamic change of overburden during working face mining.
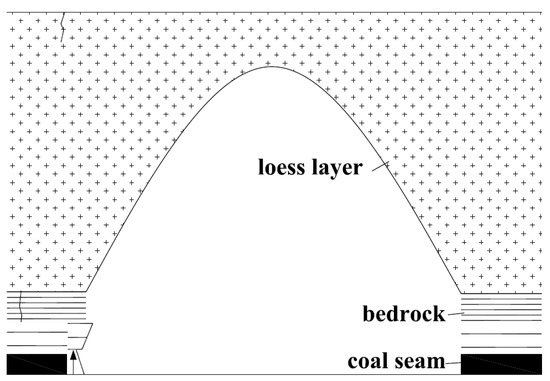
Figure 4.
Schematic of arch beam model.
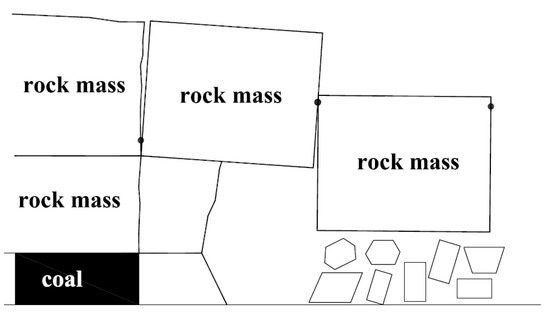
Figure 5.
Schematic of step rock beam.
The structural stability of the two states of initial breaking and periodic weighting on the main roof caused by mining was analyzed by theoretical analysis [51].
2.2.1. The First Fault in the Structure of the Block of Rock of the Main Roof
As the working face advanced, the first caving of the main roof occurred, and blocks m and n, and n and o, respectively, formed the Voussoir beam structure as shown in Figure 6. The rotational motion of block n determined the extent of motion of the main roof.
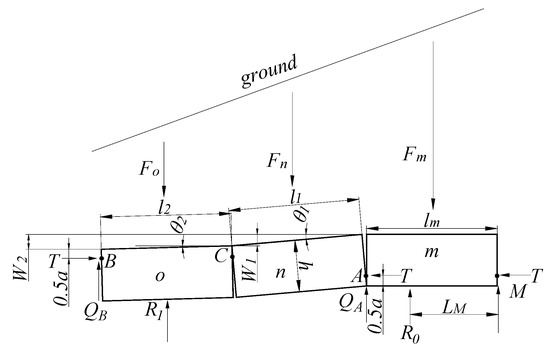
Figure 6.
Structural mechanical model of rock block during first caving of the main roof.
According to the moment balance of block m at hinge point M, as shown in Figure 7,
that is,
where Fm represents the bearing loads of block;
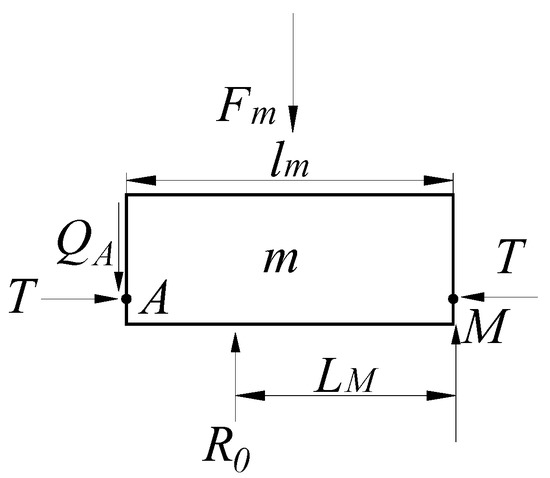
Figure 7.
The mechanical model of rock block m.
- lm is the length of block m;
- QA is the shear force of contact hinge A;
- T is the inter-block horizontal pressure;
- R0 is the bearing support force of block m;
- LM and R0 are action point distances from point M.
According to the literature [51], R1 = 1.03 F0, and is approximated as R1 = F0 as shown in Figure 8.
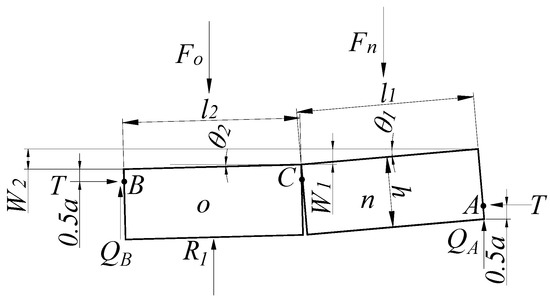
Figure 8.
The mechanical model of rock blocks n and o.
We take for block n and obtain:
We take for block o and to obtain:
Using Equation (5) in Equation (3), we get T:
From the geometry of Figure 8,
According to the literature [51], then,
Considering that the thickness and length of the rock block determine its stress state, in this paper, , (i1 and i2 denote the block indices of the blocks o and n, respectively):
QA indicates the shear force of rock n and the unbroken rock, and R0 is the bearing support force of block m. The stability of the main roof depends on the magnitudes of QA and T. The magnitude of R0 reflects the sharpness of the ore pressure above the coal pillar during the advancement of the working face.
When the rock block index i1 = i2,
When Ttanφ ≥ QA (tanφ indicates the coefficient of friction between the blocks of rock), the structure of the roof at point A does not become unstable and slide. According to the literature [52], the friction coefficient tanφ is generally preferred to be set to 0.5:
where Fn and Fo represent the bearing loads of the relevant blocks;
- R1 is the bearing support force of blocks o;
- h is the thickness of the rock;
- θ1 and θ2 are the angles of blocks n and o, respectively;
- a is the height of the contact surface;
- QB are the shear force of contact hinge B;
- l1, and l2 are the lengths of blocks n, and o, respectively;
- W1 and W2 are the subsidences of blocks n and o, respectively;
- i1 and i2 are the block indices of the blocks n and o, respectively.
According to the results of the numerical simulation θ1 = 10°, when I ≤ 0.75, the roof structure does not slip and lose stability at point A. Considering that the rock block index of shallow coal seam is generally above one, the roof slipped and lost stability.
2.2.2. The Structure of Block of Rock with Periodic Weighting of the Main Roof
When the main roof was subjected to periodic weighting, it formed a block hinged like a “step rock beam” as shown in Figure 9, and subsidence-induced motion between these blocks determined the movement of the overlying strata.
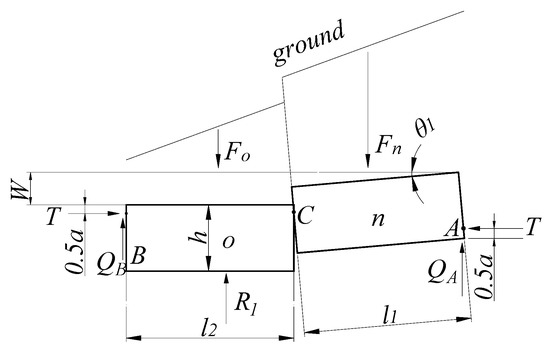
Figure 9.
Structural force model of block of rock with periodic weighting of the main roof.
The rock block o in the structure completely collapsed onto the strata, with the working face continuing to advance. When n rotated, it was supported by rock block o at point C. Because o was in a compact state at the time, , and the subsidence of block o was:
where is the total thickness of the immediate roof, in meters, m is the mining height, in meters, and is the coefficient of fracture and expansion of rock.
The difference in height between blocks n and o was:
We take and get
Because , we take for block rock o and obtain:
By , we get:
When Equation (20) is introduced into Equation (18), we can obtain T:
When the angle of rotation of block rock n reaches its maximum, we get:
When Equation (22) is introduced into Equation (21), we can obtain T:
For periodic weighting, the condition whereby the roof does not slip and lose stability is as follows:
When Equation (23) is introduced into Equation (24), we can get:
According to the results of the numerical simulation, we take Kp = 1.5 m = 8 m, l1 = 24 m, and θ1 = 10°, and incorporate them into Equation (25). When i1 ≤ 0.92, the roof was not prone to sliding and instability.
According to the literature [51], during the periodic weighting of shallow buried coal seam, the rock block index i is generally above one; because of this, the step rock beam structure is prone to instability, and results in a steplike subsidence of the surface.
2.3. Numerical Simulation
2.3.1. Simulation Mechanism using Particle Flow Code (PFC)
Particle flow was used to simulate the motion and interaction of circular particulate media by the discrete element method. Unlike continuous media, particle flow theory starts from bulk media, which links the change in the mesostructure of soil to the macroscopic mechanical characteristics of soil, and makes the numerical simulation to approximate better to the mechanical properties of materials. The particle flow model represents the entire macroscopic stress state arising through interaction between particles. Particle flow code (PFC) is a discrete element code, and the intact rock is simulated by a dense packing of spherical or circular particles bonded together at their contact points. The generated material is called the bonded particle model (BPM) and the mechanical behavior of the BPM is governed by the micro-properties of its constituents: particles and bonds. Failure of bonds under normal or shear stresses results in the generation of tensile or shear cracks between particles which enable this numerical approach to study the crack initiation and propagation under different loading regimes. Thus, there is no grid and mesh concept like in the finite element method in PFC. Compared to other discrete elements methods, PFC has three advantages: (1) the numerical model is composed of particles and the block can be broken; (2) the contact detection between circular objects is simpler and more efficient than angular objects; (3) there is no limit to the magnitude of displacement that can be simulated. However, because the model is composed of particles, the block boundary in the calculation results is often not smooth. During PFC2D calculation, Newton’s second law determines the motion of each particle, while the law of force–displacement constantly updates the contact force between particles, and simulates the interaction between particles by alternating the law of force–displacement with Newton’s second law. Figure 10 shows its computational cycling process [53,54].
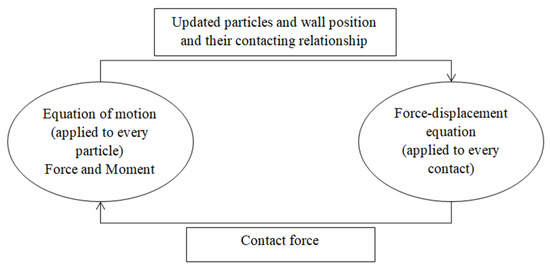
Figure 10.
Calculation cycle process of Particle flow code (PFC).
2.3.2. Establishing the Model
Based on the geometry of the longwall face, the ratio of the first weighting interval of the main roof to the panel width is 0.2, while the ratio of the periodic weighting interval of the main roof to the panel width is within 0.1–0.18. Therefore, the longwall face can be simplified as a plane problem [53,54,55]. Hence, a 400 × 173 m2 PFC2D numerical model of the midspan of the longwall face along its width direction was built, as shown in Figure 11. From the top, the model was divided into five layers: the loess layer, siltstone, mudstone, coal, and gritstone. In the computation, 22 particles at different positions on the surface (loess layer) were monitored in real time to record the dynamic change in particles on the surface. The open-off cut distance to the left boundary was 50 m, the upper boundary is free, and the left and right boundaries constrained horizontal lateral displacement and allowed vertical movement. The mining height was 8 m, each advance was 8 m, and gravitational acceleration was 9.8 m/s2.
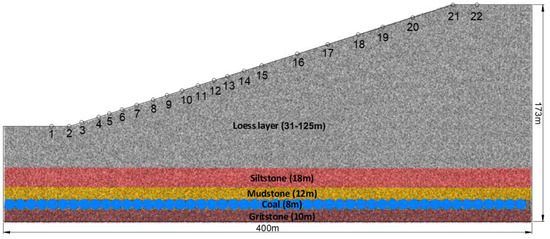
Figure 11.
Numerical model of particle flow in the studied working face.
Each rock stratum in the model has the same particle radius; the minimum radius is 20 cm and the maximum minimum radius ratio is 1.6, with a total of 206,899 particles. A common method used to generate model particles is the expansion method. Although it is simple, the coefficient of expansion is difficult to control when the particle is generated, resulting in a high overlap among particles that often causes a particle overflow boundary. Therefore, the model in this study was established using the brick technique (surrounding block technique), with individual blocks in equilibrium within space. Although the time needed for the model to obtain equilibrium increased with its size, when a model is composed of blocks already in equilibrium, it does not take long for it to reach equilibrium, which facilitates the establishment of a large-scale model.
With the advance of the working face, the overlying strata undergoes dynamic processes, such as deformation and collapse. To be more consistent with engineering practice, during the advance process, blocks that collapsed and accumulated in the coal seam floor were not eliminated (the collapsed blocks will influence the development of fractures inside the rock formation). To determine whether each advance phase of the face was in equilibrium, the model was considered to be in equilibrium under the following conditions [55]: (1) The average unbalanced force ratio was less than or equal to 10−4, where the average unbalanced force ratio was defined as the ratio of the average value of the sum of the contact force of all particles and the body force to the sum of all externally applied loads and body force. (2) The rate of crack growth was less than or equal to five per 1,000 steps. (3) The displacement and stress regions of all measuring points were in equilibrium.
2.3.3. Calibrating Mesoparameters of Rock Mass
In problems in rock fracture mechanics, most scholars use the parallel bond model. Chen [56] used the PFC2D to carry out a uniaxial compression test based on the parallel bond model and flat joint model, and compared their results with those of a laboratory test. They found that the flat joint model is more suitable for studying the mechanical characteristics of rock because the parallel bonding model has the defect of a large tensile strength ratio, which is inconsistent with the material of the rock and cannot be used to adequately simulate its mechanical properties. Therefore, the flat joint model was used in this paper.
In the simulation analysis with PFC, there is indeed a problem of particle sensitivity. A sample height–diameter ratio of 2 was used for the calibration of the micro-properties, with height equal to the thickness of the corresponding rock strata layer. In this way, particle sensitivity problems can be avoided [55]. The assignment of the mesoparameters of the particle model was performed using a calibration method. Many scholars have studied the correlation between the macroscopic and the mesoscopic mechanical parameters by establishing numerical models for compression experiments through the PFC, and empirical functions between the parameters [57]. In this paper, based on the physical parameters of the rock strata in this area, a uniaxial compression test was carried out on the established model of rock and soil particle flow, and the parameters were adjusted continuously until the simulated stress–strain curve was consistent with the measured curve (see Figure 12). The values of bond stiffness and bonding strength at this time were taken as the corresponding mesoscopic mechanical parameters of different strata in the numerical simulation of coal seam excavation. Table 1 shows the mesoparameters for the calibration of rock mass in different strata.
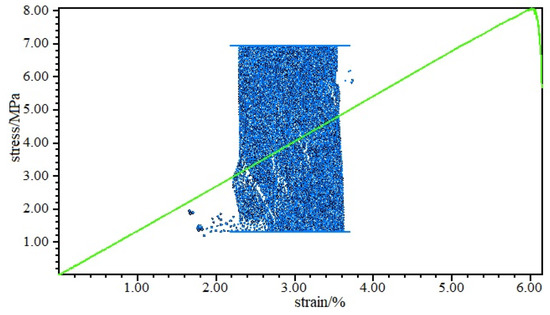
Figure 12.
Calibration of parameters of PFC model.

Table 1.
Microscopic mechanical parameters of rock formation.
3. Results
3.1. Analyzing Development and Evolution of Caving and Fracture due to Overburden
3.1.1. Analyzing Development and Evolution of Caving due to Overburden
In the process of coal seam mining, the overlying strata deform to varying degrees. The field distribution of their failure due to overburdening during the process of advance of the working face is shown in Figure 13.
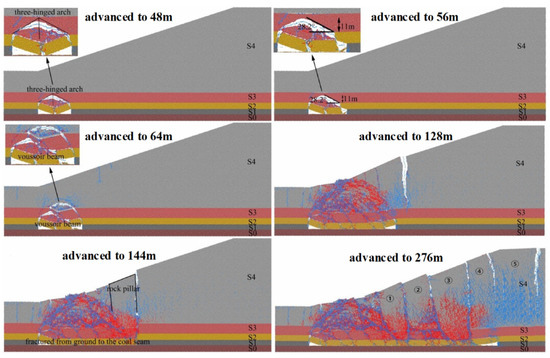
Figure 13.
Evolution of collapse of overlying strata during the advance of the working face.
The working face advanced along an upward slope of the surface from the open-off cut. As shown in Figure 13, when the working face had advanced 48 m, initial fracture occurred in the two strata of the main roof, exhibiting the general state of the “Voussoir beam,” and the block of rock after fracture formed a relatively stable structure of a “three-hinged arch.” When the working face had advanced 56 m, the initial collapse of strata S2 and S3 occurred, where the height of the collapse was 11 m and the angle of collapse was 28.2°. The collapsed blocks of rock were stacked at the bottom of the coal seam. At this time, the mining fissures were mainly distributed in the two strata S2 and S3. When the face had advanced 64 m, the mining fissure began to develop on the surface of the body of the slope, and a longitudinal tension-induced crack appeared above the coal wall, ahead of the direction of advancement of the working face, and above the side of the open-off cut. As the working face kept advancing, the overlying strata of coal seam were destroyed by the Voussoir beam. When the face had advanced 128 m, the collapse zone was close to the surface, and the arched support developed to the surface. Because of the load of the loess layer, the blocks of rock of the overlying strata were continuously crushed, filling the goaf and compacting overlying rocks in the middle of the collapse zone. When the face had advanced 144 m, the first periodic weighting of the main roof occurred. Following this, because the surface load layer continued to thicken, the original Voussoir beam structure could not withstand the pressure of the overlying rock layer, and the two strata S2 and S3 of the main roof gradually lost their supporting capacity and completely collapsed on the coal seam floor. The Voussoir beam structure was destroyed and the main roof formed the “step beam” structure.
When the working face had advanced 188 m, 212 m, and 236 m, the second, third and fourth periodic weightings occurred on the main roof, respectively, and the step distance of periodic weighting was reduced from 44 to 24 m. When the working face had advanced 276 m, its movement in the numerical simulation was complete because the step beam structure of the main roof had become unstable, the ground finally shown the failure of the step shape, and a total of five rock columns were formed. The length of advance (276 m) of the numerically simulated working face was larger than that of the actual working face (246 m).
3.1.2. Analyzing Development and Evolution of Mining Fractures
During the mining of the face along the uphill direction, the body of the slope was subjected to the actions of mining and stretching, and cracks appeared on its surface. With the advancement of the working face, fractures between the strata of the main roof gradually developed to the surface of the slope. The evolution of the fracture with the advance of the working face is shown in Figure 14.
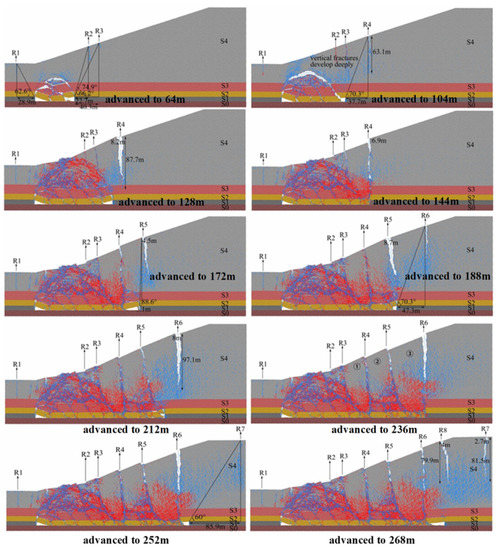
Figure 14.
Dynamic development of fractures caused by mining.
When the working face had advanced 64 m, longitudinal tension-induced fractures appeared ahead of the face and above the open-off cut. Three fractures R1, R2, and R3 are analyzed. The angle between R1 and the coal pillar was 62.6°, the horizontal distance between R2 and the side of the open-off cut was 28.9 m, the boundary angle between R2 and the advancing side was 74.9°, the distance between them was 22.7 m, the angle of fracture R3 was 66.2°, and the crack advanced by 40.3 m.
When the working face had advanced 104 m, the body of the slope produced fracture R4 with a fracture angle of 70.3°, and an advance fracture distance of 37.7 m. Fractures R2 and R3 developed deep. With the advancement of the working face, fractures formed by mining in the overlying rock became arched.
When the working face was pushed to 128 m, the vault of the crack developed to the surface, and then, fracture development was no longer arched. Fracture R4 developed from rock formation S4 to S3, extending from 63.1 to 87.7 m with a width of 8.2 m.
When the working face had advanced 144 m, the first periodic weighting of the main roof occurred, and mining-induced fractures appeared in the body of the slope periodically. Due to the subsidence of the two strata of the main roof, the width of fractures R2 and R3 increased, and rock mass on both sides of R4 formed a step with a height of 6.9 m.
When the working face had advanced 172 m, fractures R2, R3, and R4 began to close, and the coal panel was critical (the ratio of width to depth was 1.06). The vertical fracture R5 was produced above the working face, and the angle between R5 and the boundary of the panel was 88.6°, horizontal distance was 3.1 m from the boundary of the panel, and the width of the fissure was 4.5 m.
When the working face had advanced 188 m, the second periodic weighting of the main roof occurred, R2, R3, and R4 were closed, and R5 widened to 8.7 m. Fracture R6 formed above the working face with a crack angle of 70.3° and advancing crack distance of 47.3 m.
When the working face had advanced 212 m, the third periodic weighting of the main roof occurred, and fracture R5 was closed. The depth of R6 increased to 97.1 m and its width to 8 m.
When the working face had advanced 236 m, the fourth periodic weighting of the main roof occurred, and the surface was characterized by three distinctly fractured rock columns.
When the working face had advanced 252 m, the fracture R6 stopped developing. The entire fissure ran through the surface to the bottom of the coal seam, and a new fissure R7 appeared above the working face (top of the slope); the crack angle was 60°, and the advancing crack distance was 85.9 m.
When the working face had advanced 268 m, the fracture R6 gradually closed, and the width of fracture R7 developed to 2.7 m and its depth to 81.5 m. Because the advance distance was closer to the top of the slope, it intensified the movement of the previously formed step toward the panel, and tensile stress between the step rock mass and the top fracture produced a new vertical fissure R8—its width was 4 m and length was 79.9 m.
When the working face had advanced 276 m, the mining was stopped and the fractures stopped developing, R8 became 2.8 m wide and 86 m deep, and R7 grew to 5.5 m wide and 106.3 m deep. Finally, the boundary of the panel formed a permanent crack, and the surface of the body of the slope formed a step.
According to the above analysis, based on their development and position, the fractures can be divided into three categories. The first consists of surface cracks in front of the working face that appeared after the initial breaking of the main roof and before periodic weighting, such as R2 and R3. Once the main roof had collapsed, with the continuous advance of the working face, the number of fractures of the overlying rock strata increased, and the body of the slope exhibited cracks due to tensile action in the process of its movement. The second category of fractures featured connectivity cracks, such as R4, R5, and R6, which were produced with the periodic weighting of the main roof.
As shown in Figure 15, the ground cracks formed by these three groups were similar—that is, with the advance of the working face, a tensile area was formed in front of the direction of advance, and surface cracks appeared on the face. The width and depth of the cracks increased, but when periodic weighting occurred, the width decreased and the depth reached the coal seam. The cracks penetrated the ground through to the coal seam and formed prominent steps on the ground. The third category of fractures consisted of mining fractures near the open-off cut and stopping line, mainly affected by the stretching of rock and soil due to mining. The fractures and depths generally increased in this case.
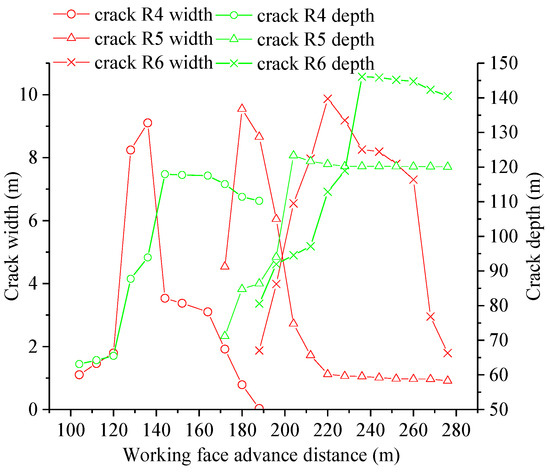
Figure 15.
Variations of width and depth of fractures R4–6 with advancing working face.
3.2. Analyzing Force Chain and Deformation due to Overburden
3.2.1. Analyzing Evolution of Force Chain
The results for the particulate matter show that the soil particles were usually densely distributed, and contact between the adjacent particles formed many paths for transferring external loads. The path was usually a quasi-linear chain structure called the force chain. Several force chains intersected one another to form a network that passed the weight and external load of the particle system, and the complex dynamic response of the force chain network determined the macroscopic mechanical properties of the particle system, which is its basic physical image [58]. In the numerical simulation, the force chain, as the chainlike characteristic of the rate of contact force between particles, reflected the transfer of force between broken rocks, and was the main form of load transfer in the discontinuous medium. Figure 16 shows the process of evolution of the force chain as the working face advanced.
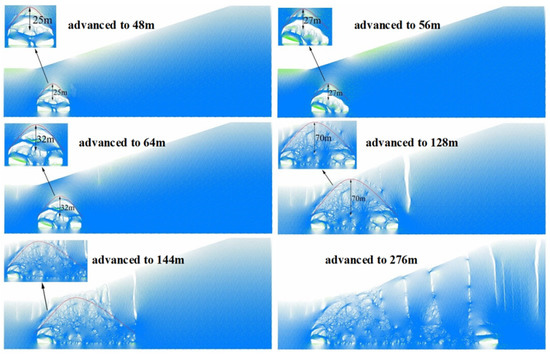
Figure 16.
Numerical simulation of evolution of force chain.
When the working face had advanced 48 m, initial fracture occurred in the main roof, the initial force chain state affected by mining was broken, and a horizontal force chain arch was formed above the panel. The arch height was 25 m and led to a slight separation. The force chain arch bore the weight of the overlying strata in the panel and rebalanced around it. The foot of the front arch of the force chain was on the side of the open-off cut coal wall, and the foot of the rear was located at the coal wall in the direction of advance of the face. The distribution of the force chain in the unexploited area of the working face remained irregular, as shown in Figure 16.
When the working face had advanced 56 m, with an increase in the area of influence of the mining, the height of the force chain arch around the panel increased to 27 m, as did its span. Due to the increase in the arch span of the upper force chain in the panel, the shape of the force chain at the lower level gradually developed from the original arch to a horizontal state, and a new force chain arch appeared in the higher strata. With the increase in the span of the force chain arch, it broke, the main roof collapsed, and some layer separation appeared above the panel.
When the working face had advanced 64 m, the body of the slope began to show cracks, the span of the force chain arch increased further, and the arch height increased to 32 m.
With the continuous advance of the working face, the span and height of the force chain arch continue to increase. When the working face had advanced 128 m, the force chain arch developed to the surface, and the arch height was 70 m at this time. After that, because the surface load layer was thicker and the force chain arch was not uniform, the force chain arch height no longer increased, and the span continued to increase.
When the working face had advanced 144 m, the first periodic weighting occurred on the main roof, and the span of the force chain arch further increased. As the load on the overburden layer exceeded its own bearing limit, fracture and instability occurred, and the rock layer above the panel recorded a large area of collapse, where the collapsed rock mass continued to fill the mined-out area. Due to the fracture of the force chain arch, a large number of cracks appeared in the overlying rock layer and penetrated the surface load layer, and the ground began to sink. With the advance of the working face and the continuous collapse of the overlying rock layer, the arched force chain structure above the panel disappeared, the force chain continued to move forward of the working face, and the horizontal force chain was mainly above the panel.
When the working face had advanced 276 m, mining was stopped, and the development of the force chain ceased. At a low position above the panel, the distribution of the force chain changed to a flat state due to the destruction of the force chain arch. In front of the mined-out area, the force chain was distributed in a vertical state. In the fissures formed by the overlying rock layer, the distribution of the force chain was horizontal owing to the collapsed rock mass on the side of the rock layer.
According to the above analysis, the curve before the instability of the force chain arch was approximately a parabola, as shown in Figure 17, and the front arch leg of the force chain arch is the coordinate origin. The parabolic equation is:
where a is the coefficient to be determined, L0 is the distance at different stages of advancement of the working face of the force chain arch, harch is the vertical coordinate of the track of the force chain arch, and Ladvance is the change in the advanced distance of the working face of the force chain arch at a certain stage. The interval is (0, L0).
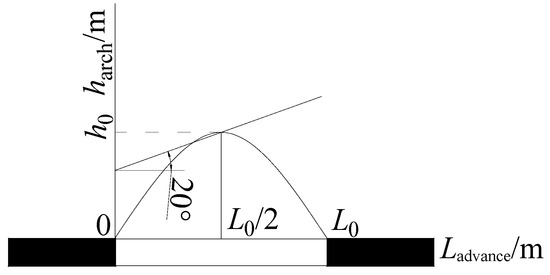
Figure 17.
Curve track of force chain arch.
When the working face advanced L0, the arch height of the force chain was Harch = h0, and the equation satisfied , a substitution was obtained:
The relationship between the advanced distance of the working face and the arch height of the force chain is shown in Figure 18. It is clear that they satisfy the exponential relationship approximately:
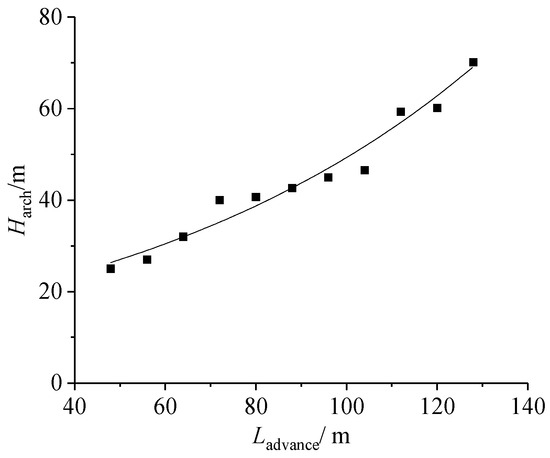
Figure 18.
The relation between the advanced distance and the arch height of the force chain.
From Equations (26)–(28), the trajectory of the force chain arch is as follows:
The force chain arch was the main form of bearing for the overlying rock layer. Due to the slope of the surface, the two sides of the force chain arch were subjected to an inhomogeneous load. A structural model of the force chain arch in this condition was established as shown in Figure 19. The left arch load was composed of a homogeneously distributed load of part q1 and a triangular load of part max q2. The right arch load was composed of a homogeneously distributed load of part q2 and a triangular load of part max q3. The right arch bore more than the left arch; q1 indicates the load of the overlying rock and the loess of a certain height, and q2 and q3 indicate the triangular loess loads with changes in the inclination angle:
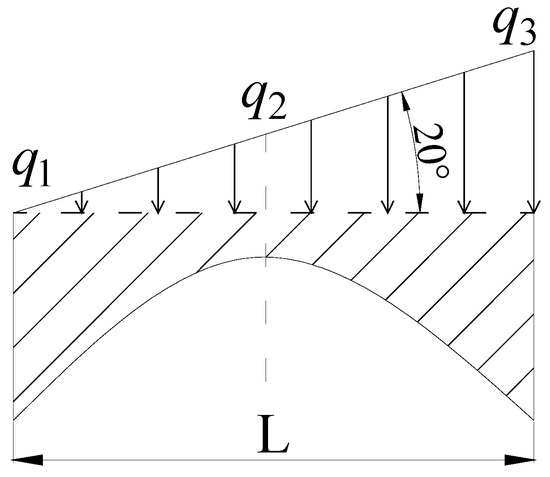
Figure 19.
Structural model of force chain arch.
When the force chain arch developed to the surface, its further development ceased; as the working face continued to advance, the load on the right side of the arch continued to increase to exceed the bearing limit of the force chain arch, leading to failure due to instability.
According to the above analysis, the force chain evolved continuously under the influence of mining. The form of the force chain underwent the dynamic process of the formation of the force chain arch, and its development and failure. Force was the main form for bearing the weight of the overlying rock, and when it developed to the surface, the force chain arch appeared fractured. As the surface load layer thickened, the failure of the force chain arch ceased to develop, which led to the periodic weighting of the working face. The rock layer under the force chain arch completely failed to the coal seam floor, which was the root cause of the step sinking on the surface.
3.2.2. Analyzing Movement of Overburden and Surface
(1) Overburden movement
Coal seam excavation causes the displacement, deformation, and destruction of the overlying strata. Figure 20 shows a map of the displacement field of the overlying strata during the advance of the working face, viz. horizontal and vertical displacements respectively. The color variation of the numerical model indicates the constant change of the magnitude of the displacement of overburden, and the same color indicates the same magnitude of the displacement in the region.
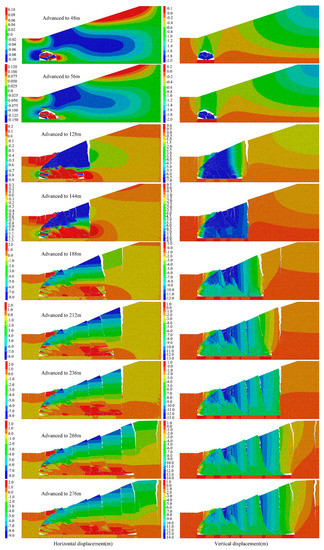
Figure 20.
Horizontal and vertical displacements caused by mining.
When the working face had advanced 48 m, the main roof broke for the first time. Because of the small excavation space, the change in displacement of the rock layer was small, and the upper part of the panel appeared to bend and sink. A slight separation phenomenon was observed, and the rock layer surrounding the panel moved to the panel due to the action of self-weight and horizontal stress.
When the working face had advanced 56 m, the first collapse of the main roof occurred because the excavation space became bigger, the phenomenon of some layer separation appeared above the panel, and the surface is cracked by extrusion.
When the working face had advanced 128 m, the separation from the top of the panel was significant because the force chain arch developed to the surface, and the surface load layer occupied a large area of subsidence. The horizontal displacement of the overlying rock above the panel was opposite to that of the loess layer because the surface loess layer was affected by the sliding of the slope downhill, as the overlying rock layer filled the panel with the advance of the working face.
When the working face had advanced 144 m, because the load of the overlying rock layer exceeded its own bearing limit, fracture instability occurred, and the period of the basic roof occurred to press. At this time, the upper rock layer of the panel collapsed over a large area. In the vertical direction, the farther the rock layer was from the coal seam, the greater its sinking value was, because after, the main roof occurred the period of pressure, which lead to the increase of the surface subsidence.
(2) Surface movement
Figure 21 shows the curve of the surface subsidence of the coal seam during the mining process. With the expansion of the mining area, the subsidence and area of influence of the surface increased gradually. With the advancement of the working face, the subsidence curve assumed a “V” shape, which was not symmetrical at the center of the panel. The maximum subsidence inclined to the upward slope, and the curve of surface subsidence as a whole showed a trend of the basin edge being small and the basin center being large.
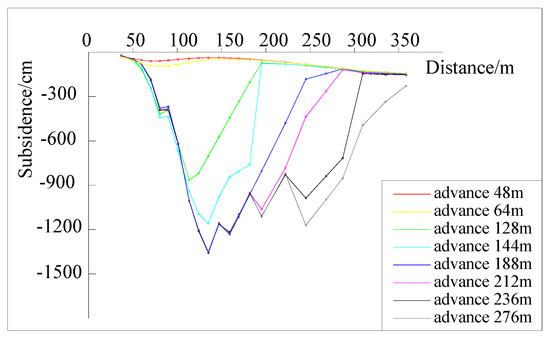
Figure 21.
Subsidence curve.
When the working face had advanced 48 m, the first half of the surface observation line followed the law of the general subsidence curve. The maximum subsidence was located at point 4, at 0.595 m. The second half of the observation line did not accord with the law of the general subsidence curve because, following the first break of the main roof, the rock layer in the area was filled with the panel under weight and horizontal stress, and exhibited the trend of moving toward the panel. As the working face continued to advance, the maximum subsidence point shifted to the center of the panel.
When the working face had advanced 128 m, the top of the panel collapsed to the surface, and the vault of the arch structure developed to it. The overlying rock layer of the coal seam lost its support, and the subsidence of the surface increased dramatically. Four mutations occurred in the surface subsidence curve in the mining process of the working face due to the steplike subsidence of the surface after the periodic weighting of the main roof. With each periodic weighting, the surface added a new step, and the subsidence of the corresponding monitoring point above the step rock mass increased drastically, resulting in a sudden change in the subsidence curve.
Figure 22 shows the curve of the horizontal surface displacement of coal seam mining. With the advance of the working face, the range of this displacement and surface influence increased gradually, and the maximum and minimum values of the horizontal surface displacement gradually moved toward the edge of the basin. The moving horizontal curve of the surface was not antisymmetric around the zero-value point of the horizontal displacement. Its value downhill of the model was large, as was its range of influence. The horizontal moving value downhill was larger than that of the uphill because the body of the slope was affected by mining and slip, and the horizontal displacement had a tendency to slip downhill, which led to a large horizontal displacement in the downhill direction.
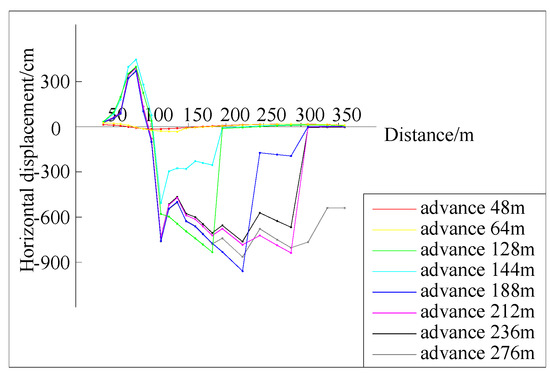
Figure 22.
Horizontal displacement curve.
When the working face had advanced 48 m, the first half of the surface observation line followed the law of the general horizontal moving curve, and the positive value of the observation value in the second half of the observation line was due to the continuous filling of the blocks of rock on the coal seam to the panel after mining; considering that the surface was loose, it was prone to slip. To fill the space left by the rock mass above the coal seam, the deformation value of the surface moving horizontally was positive. The rock beneath the top of the slope to fill the space formed above the panel led to positive values of horizontal surface displacement. During the advancement process, the surface point of the maximum positive value was stable at point 4, and the point of the maximum negative value was always changing. The horizontal displacement curve of the surface had four mutations, as did the subsidence curve, because the surface was characterized by the destruction of steps after the periodic weighting of the main roof. The horizontal component of motion of the corresponding surface monitoring point suddenly increased, resulting in a mutation in the horizontal curve of motion.
When the working face had advanced 276 m, panel mining was complete, and the horizontal value of motion of the monitoring point on top of the slope changed suddenly because the working face was closer to the top of the slope. This led to the continuous movement of rock below the top of the slope toward the panel, causing it to be filled. The expansion of the crack on top of the slope aggravated the increase in the value of the horizontal motion on top.
According to the analysis, the surface movement basin is changing with the advance of the working face, and the influence range is increasing. The subsidence curve shows a “V” shape curve which is not symmetrical to the center of the panel, and the surface horizontal displacement curve is not antisymmetric about the zero point of horizontal displacement as well. Because of the influence of body of the slope slip and mining, the horizontal displacement of the lower direction will be larger than that of the upper slope, and the values of the subsidence curve and the horizontal movement curve will change with the periodic weighting of the working face advance.
4. Discussion
In this paper, based on field data, a numerical simulation of the PFC was established, and the laws of dynamic evolution of mining overlying strata and discontinuous surface movements in the presence of a thick loess and thin bedrock were studied. The main discussions are as follows:
(1) With the advance of the working face, the failure of the overlying rock underwent a process of the breaking of the main roof, and its caving and periodic weighting. As the overburden moved forward with the arch structure until a force chain arch developed to the surface, steplike failure of the surface occurred with periodic pressure. Based on the stress state of the main roof, a model of the mechanical structure of the main roof during the initial breaking and periodic weighting was established, and provided the basis for the analysis of the mechanism of overburden-induced movement in the mining process.
(2) In the presence of a thick loess and thin bedrock, the process of fracture owing to mining overburden was a surface fracture at the front of the working face after the first breaking of the main roof. With the advance of the working face, the number of mining fractures of the overlying strata increased, and fractures began to appear when the body of the slope was stretched in the process of moving. The working face continued to advance, where the direction of this advance first formed a stretch area; the surface cracked, and its width constantly increased, and the cracks continue to deepen. When periodic weighting occurred, the cracks began to narrow, and those from the ground through to the coal seam formed a more prominent step in the ground.
(3) The form of the force chain underwent the dynamic process of formation of the force chain arch, its development, and failure. When developed to the surface, the force chain arch appeared to fracture. As the surface load layer thickened, the force chain arch could not continue to develop to bear the load, became unstable, and failed. This resulted, in the face of the periodic weighting, in subsidence at the surface in steps. According to the law of the evolution of the force chain, the trajectory equation before the instability of the force chain arch was established. The theoretical analysis showed that the force chain arch was the main bearing capacity system of the rock surrounding the stope, and its fracture and instability was the main cause of the discontinuous deformation of the surface.
(4) During the advance of the working face, the body of the slope was affected by the slip, which caused the direction of the horizontal movement of the loess layer to be opposite to the overlying rock in the panel. Under the influence of slope slip and discontinuous deformation, the subsidence of the surface was two times that of flat land, and the subsidence curve was a V shape that was not symmetrical at the center of the panel. The curve of horizontal surface movement was also asymmetric, and horizontal movement in the downhill direction was larger than that of in the uphill direction. With the periodic weighting of the working face, the surface subsidence and horizontal movement changed suddenly.
The highlights of this study.
Surface discontinuous deformation is a dynamic evolution process, and most of the existing research results from surface fracture distribution characteristics through theoretical analysis to describe the causes of surface discontinuous deformation [6,7,8,9], but this paper has innovative points:
(1) For the first time, the process of fracture development and surface steps formation of mining overburden rock is analyzed by using discrete element PFC software from the view of mining subsidence. The internal cause of discontinuous deformation of mining surfaces under the condition of thick yellow soil and thin bedrock is obtained.
(2) The action and evolution processes of force chain underground mining with thick loess layer and thin bedrock are firstly revealed in this study. By tracing the development law of the force chain, the equation before the loss of the arch of the force chain is established. The analysis shows that the development state of the force chain is closely related to the discontinuous deformation of the surface, and the mechanism of the stepped subsidence of the surface is explained.
The limitations of this study.
(1) With the complex geological and topographic conditions in this field, it is difficult to construct the PFC numerical models exactly as the actual geological conditions, so this study simplifies the division of rock strata and surface morphology when constructing numerical models.
(2) The numerical model constructed by PFC is composed of a large number of particles and the amount of calculation is large, the 2D version of PFC is used in this study, and the variation of horizontal sizes of fracture are not considered when studying the dynamic development law of fracture, which can been solved through 3D version of PFC.
Future research focuses on the law and prediction of surface discontinuous deformation under different geological mining conditions.
5. Conclusions
The discontinuous deformation caused by coal mining, such as cracks, collapses and landslides, is very common in countries around the world where coal resources are mined. The problem was found through the field investigation of underground coal mining under the geological condition of thin bedrock and thick loess layer. By means of mechanical methods, the mechanism of mining failure is analyzed, and the mechanism is verified and analyzed by numerical simulation software PFC2D, and the next research direction is pointed out. The main conclusions are as follows:
(1) The nature of surface discontinuous deformation is the process of overburden movement and intergranular force chain morphology change. With the advance of the working face, the overburden structure is constantly developed, and the corresponding intergranular force chain shape is constantly changing. Due to the increasing weight of the surface load layer, the force chain arch cannot bear the instability of its weight, and the force chain gradually develops from the initial arch to the flat shape. As the main force system of bearing overburden weight, the failure of the arch directly causes the periodic weighting of overburden, the tensile cracks on the surface affected by mining will pass through to the coal seam floor, the surface will eventually show step subsidence, at the same time, the surface subsidence and horizontal movement will also show abrupt change.
(2) PFC has great advantages in simulating mechanical behavior between particles, overburden movement, and discontinuous deformation of the surface. Feasibility of PFC simulated surface discontinuous deformation is proved.
Author Contributions
Conceptualization, X.L.; methodology, X.L., Y.Z. and C.W.; software, Y.Z. and C.W.; validation, J.G.; formal analysis, H.Y. and J.L.; investigation, X.L. and J.G.; resources, X.L.; data curation, X.L., Y.Z. and C.W.; writing—original draft preparation, Y.Z. and H.Y.; writing—review and editing, X.L.; visualization, J.L.; supervision, X.L.; project administration, X.L.; funding acquisition, X.L. All authors have read and agreed to the published version of the manuscript.
Funding
This research was funded by the National Natural Science Foundation of China grant number [51704205], the Shanxi Natural Science Foundation of China grant number [201701D221025], Key R&D Plan projects in Shanxi Province of China grant number [201803D31044] and the Education Department Natural Science Foundation in Guizhou of China grant number [KY (2017) 097]. The APC was funded by [51704205].
Conflicts of Interest
The authors declare no conflict of interest.
References
- Huang, Q.X. Green mining on coal resource. Shaanxi Coal 2008, 27, 18–21. [Google Scholar]
- Wang, G.Q. World coal resources and their distribution characteristics. Prog. Geogr. 1985, 4, 19–24. [Google Scholar]
- Brodny, J.; Tutak, M. Analysing the Utilisation Effectiveness of Mining Machines Using Independent Data Acquisition Systems: A Case Study. Energies 2019, 12, 2505. [Google Scholar] [CrossRef]
- Cicmanec, P.; Hrabovsky, J.; Durove, J.B. Mechanized Mining of Might Coal Seams into Complicated Geological and Underground Conditions. Gospod. Surowcami Miner. 2008, 24, 37–47. [Google Scholar]
- Kratzsch, H. Mining Subsidence Engineering; Springer: Berlin/Heidelberg, Germany, 1983. [Google Scholar]
- Liu, H.; He, C.G.; Deng, K.Z.; Bian, Z.F.; Fan, H.D.; Lei, S.G.; Zhang, A.B. Analysis of forming mechanism of collapsing ground fissure caused by mining. J. Min. Saf. Eng. 2013, 30, 380–384. [Google Scholar]
- Huang, Q.X.; Du, J.W.; Hou, E.K.; Yang, F. Research on overburden and ground surface cracks distribution and formation mechanism in shallow coal seams group mining. J. Min. Saf. Eng. 2019, 36, 11–19. [Google Scholar]
- Guo, W.B.; Deng, K.Z.; Zou, Y.F. Research progress and prospect of the control technology for surface and overlying strata subsidence. China Saf. Sci. J. 2005, 1, 9–13. [Google Scholar]
- Qian, M.G.; Xu, J.L.; Liao, X.X. The Key Layer Theory and its Application of Strata Control; China Academic Journal Electronic Publishing House: Beijing, China, 2001. [Google Scholar]
- Zhang, G.B. Study and Application on Deformation Failure Characteristics of Overlying Strata Under Thick Alluvium and Thin Bedrock. Ph.D. Thesis, Shandong University of Science and Technology, Qingdao, China, 2014. [Google Scholar]
- Xu, Y.K.; Wu, K.; Li, L.; Zhou, D.W.; Hu, Z.Q. Ground cracks development and characteristics of strata movement under fast excavation: A case study at Bulianta coal mine, China. Bull. Eng. Geol. Environ. 2019, 78, 325–340. [Google Scholar] [CrossRef]
- Liu, H.; Deng, K.Z.; Zhu, X.J.; Jiang, C.L. Effects of mining speed on the developmental features of mining-induced ground fissures. Bull. Eng. Geol. Environ. 2019, 78, 6297–6309. [Google Scholar] [CrossRef]
- Hejmanowski, R.; Malinowska, A.A. The Impact of Deep Underground Coal Mining on Earth Fissure Occurrence. Acta Geodyn. Geomater. 2016, 13, 321–330. [Google Scholar]
- Malinowska, A.A.; Misa, R.; Tajduś, K. Geomechanical modeling of subsidence related strains causing earth fissures. Acta Geodyn. Geomater. 2018, 15, 197–204. [Google Scholar] [CrossRef]
- Ghosh, G.K.; Sivakumar, C. Application of underground microseismic monitoring for ground failure and secure longwall coal mining operation: A case study in an Indian mine. J. Appl. Geophys. 2018, 150, 21–39. [Google Scholar] [CrossRef]
- Tudor, G.; Catalin, N.M.; Camelia, B.; Diana, M. Impacts of mining activities on surface deformation. In Proceedings of the International Multidisciplinary Scientific GeoConference Surveying Geology and Mining Ecology Management, SGEM, Florence, Italy, 23–26 October 2018; Volume 18, pp. 489–495. [Google Scholar]
- Malinowska, A.A.; Witkowski, W.T.; Hejmanowski, R.; Chang, L.; Leijen, F.J.; Hanssen, R.F. Sinkhole occurrence monitoring over shallow abandoned coal mines with satellite-based persistent scatterer interferometry. Eng. Geol. 2019, 262, 105336. [Google Scholar] [CrossRef]
- Kotyrba, A.; Łukasz, K. Sinkhole hazard assessment in the area of abandoned mining shaft basing on microgravity survey and modelling—Case study from the Upper Silesia Coal Basin in Poland. J. Appl. Geophys. 2016, 130, 62–70. [Google Scholar] [CrossRef]
- Chudek, M.; Strzałkowski, P. Assessment of the hazard level posed to a post-mining area by discontinuous surface deformations. IOP Conf. Ser. Earth Environ. Sci. 2019, 261, 012004. [Google Scholar] [CrossRef]
- Motyka, Z.; Jelle, B.P. System model for spatial mapping of anthropogenic sinkholes and subsidence basins in mining areas applying 2D laser scanner technique. E3s Web Conf. 2019, 106, 7. [Google Scholar] [CrossRef]
- Strozik, G.; Jendrus, R.; Manowska, A.; Popczyk, M. Mine Subsidence as a Post-Mining Effect in the Upper Silesia Coal Basin. Pol. J. Environ. Stud. 2016, 25, 777–785. [Google Scholar] [CrossRef]
- Piwowarski, W.; Strzałkowski, P. Modeling of discontinuous deformations over shallow post-mining voids in the rock mass. Acta Geodyn. Geomater. 2019, 16, 253–256. [Google Scholar] [CrossRef]
- Lokhande, D.R.; Murthy, V.M.S.R.; Vellanky, V.; Singh, B.K. Assessment of pot-hole subsidence risk for Indian coal mines. Int. J. Min. Sci. Technol. 2015, 25, 185–192. [Google Scholar] [CrossRef]
- Kalendra, B.S.; Bharat, B.D. Sinkhole subsidence due to mining. Geotech. Geol. Eng. 1997, 15, 327–341. [Google Scholar]
- Ritesh, L.D.; Murthy, V.M.S.R.; Kalendra, S. Semi-empirical model for predicting pot-hole depth in underground coal mining. Curr. Sci. 2018, 115, 1761–1769. [Google Scholar] [CrossRef]
- Sahu, P.; Pradhan, M.; Jade, R.K.; Lokhande, R.D. Study the variations of sinkhole depth with respect to working height in underground coal mines. Recent Adv. Rock Eng. 2016, 91, 547–551. [Google Scholar]
- Isiaka, A.I.; Durrheim, R.J.; Manzi, M.S.D. High-Resolution Seismic Reflection Investigation of Subsidence and Sinkholes at an Abandoned Coal Mine Site in South Africa. Pure Appl. Geophys. 2019, 176, 1531–1548. [Google Scholar] [CrossRef]
- Van Der Merwe, J.N. Effects of coal mining on surface topography in South Africa—Updates and extensions. J. South. Afr. Inst. Min. Metall. 2018, 118, 777–786. [Google Scholar] [CrossRef]
- Salmi, E.F.; Karakus, M.; Nazem, M. Assessing the effects of rock mass gradual deterioration on the long-term stability of abandoned mine workings and the mechanisms of post-mining subsidence—A case study of Castle Fields mine. Tunn. Undergr. Space Technol. 2019, 88, 169–185. [Google Scholar] [CrossRef]
- Edmonds, C. Five decades of settlement and subsidence. Q. J. Eng. Geol. Hydrogeol. 2018, 51, 403–416. [Google Scholar] [CrossRef]
- Aydan, Ö.; Ito, T. The effect of the depth and groundwater on the formation of sinkholes or ground subsidence associated with abandoned room and pillar lignite mines under static and dynamic conditions. Proc. Int. Assoc. Hydrol. Sci. 2015, 372, 281–284. [Google Scholar] [CrossRef][Green Version]
- Castañeda, C.; Gutiérrez, F.; Manunta, M.; Galve, J.P. DInSAR measurements of ground deformation by sinkholes, mining subsidence, and landslides, Ebro River, Spain. Earth Surf. Process. Landf. 2009, 34, 1562–1574. [Google Scholar] [CrossRef]
- Deb, D.; Choi, S.O. Analysis of sinkhole occurrences over abandoned mines using fuzzy reasoningm: A case study. Geotech. Geol. Eng. 2006, 24, 1243–1258. [Google Scholar] [CrossRef]
- Geniş, M.; Akçın, H.; Aydan, Ö.; Bacak, G. Investigation of possible causes of sinkhole incident at the zonguldak coal basin, Turkey. Geomech. Eng. 2018, 16, 177–185. [Google Scholar]
- Fan, Y.B.; Li, S.H.; Zhou, Y. Lessons Learned from the Landslides in Shengli East Open-Pit Mine and North Open-Pit Mine in Xilinhot City, Inner Mongolia Province, China. Geotech. Geol. Eng. 2016, 34, 425–435. [Google Scholar]
- Tiwari, A.; Narayan, A.B.; Dwivedi, R.; Swadeshi, A.; Pasari, S.; Dikshit, O. Geodetic investigation of landslides and land subsidence: Case study of the Bhurkunda coal mines and the Sirobagarh landslide. Surv. Rev. 2018, 52, 134–149. [Google Scholar] [CrossRef]
- Ignacio, Z.; Antonio, M.; Jonathan, B.L.; Lázaro, S.C.; José, F.M.D. Stabilization by geomorphic reclamation of a rotational landslide in an abandoned mine next to the Alto Tajo Natural Park. Eng. Geol. 2019, 264, 105321. [Google Scholar]
- Trong, N.D.; Wu, J.H. Simulating a mining-triggered rock avalanche using DDA: A case study in Nattai North, Australia. Eng. Geol. 2019, 264, 105386. [Google Scholar]
- Vanneschi, C.; Eyre, M.; Burda, J.; Žižka, L.; Francioni, M.; Coggan, J.S. Investigation of landslide failure mechanisms adjacent to lignite mining operations in North Bohemia (Czech Republic) through a limit equilibrium/finite element modelling approach. Geomorphology 2018, 320, 142–153. [Google Scholar] [CrossRef]
- Aksoy, C.O.; Uyar, G.G.; Ozcelik, Y. Comparison of Hoek-Brown and Mohr-Coulomb failure criterion for deep open coal mine slope stability. Struct. Eng. Mech. 2016, 60, 809–828. [Google Scholar] [CrossRef]
- Loupasakis, C. Mining Geohazards at the Perimeter of the Amyntaio Open Pit Coal Mine, West Macedonia, Greece. In Recent Advances in Geo-Environmental Engineering, Geomechanics and Geotechnics, and Geohazards; Springer International Publishing: Berlin/Heidelberg, Germany, 2019. [Google Scholar]
- Zagibalov, A.V.; Okhotin, A.L.; Volokhov, A.V. Resilience Analysis of Face Slopes and Internal Dumps and Causes of their Instability at “Mugunsky” Opencast Coal Mine. IOP Conf. Ser. Earth Environ. Sci. 2017, 87, 072006. [Google Scholar] [CrossRef]
- Vojteková, J.; Vojtek, M.; Boltižiar, M. Impact of mining activities and natural hazards on land use: A case study from Slovakia. In Proceedings of the International Multidisciplinary Scientific Conference on Social Sciences & Arts SGEM, Albena, Bulgaria, 24 August–2 October 2018; Volume 5, pp. 420–423. [Google Scholar]
- Poulsen, B.A.; Adhikary, D.; Guo, H. Simulating mining-induced strata permeability changes. Eng. Geol. 2018, 237, 208–216. [Google Scholar] [CrossRef]
- Wang, G.; Wu, M.; Wang, R.; Xu, H.; Song, X. Height of the mining-induced fractured zone above a coal face. Eng. Geol. 2017, 216, 140–152. [Google Scholar] [CrossRef]
- Li, Z.; Wang, J.A. Accident Investigation of Mine Subsidence with Application of Particle Flow Code. Procedia Eng. 2011, 26, 1698–1704. [Google Scholar]
- Zhao, J.J.; Xiao, J.G.; Lee, M.L.; Ma, Y.T. Discrete element modeling of a mining-induced rock slide. SpringerPlus 2016, 5, 1633. [Google Scholar] [CrossRef][Green Version]
- Jia, M.C.; Wang, L.; Zhou, J. Simulation of Soil Deformation Due to Pit Excavation with Particle Flow Code. J. Tongji Univ. (Nat. Sci.) 2009, 37, 612–617. [Google Scholar]
- Huang, Q.H.; Zhang, P.; Dong, A.J. Mathematical model of “arch beam” of thick sandy soil layer movement in shallow seam. Rock Soil Mech. 2009, 30, 2722–2726. [Google Scholar]
- Huang, Q.X.; Qian, M.G.; Shi, P.W. Structual analysis of main roof stability during periodic weighting in longwall face. J. China Coal Soc. 1999, 24, 581–585. [Google Scholar]
- Qian, M.G.; Shi, P.W.; Xu, J.L. Mining Pressure and Strata Control; China University of Mining and Technology Press: Xuzhou, China, 2010. [Google Scholar]
- Huang, Q.X.; Shi, P.W.; Qian, M.G. Experiment study on the coefficients of friction and inserting of main roof block corner. Rock Soilmechanics 2000, 21, 60–63. [Google Scholar]
- Itasca Consulting Group Incorporated. PFC (Particle Flow Code in 2 and 3 Dimensions); Version 5.0 [User’s Manual]; Itasca Consulting Group Incorporated: Minneapolis, MN, USA, 2016. [Google Scholar]
- Zhou, J.; Chi, Y.; Chi, Y.W.; Xu, J.P. Method of Particle Flow and PFC2D Code. Ph.D. Thesis, Tongji University, Shanghai, China, 2000; pp. 80–83. [Google Scholar]
- Wang, C.L.; Zhang, C.S.; Zhao, X.D.; Liao, L.; Zhang, S.L. Dynamic structural evolution of overlying strata during shallow coal seam longwall mining. Int. J. Rock Mech. Min. Sci. 2018, 103, 20–32. [Google Scholar] [CrossRef]
- Chen, P.Y. Research progress on pfc2d simulation of crack propagation characteristics of cracked rock. J. Eng. Geol. 2018, 26, 253–264. [Google Scholar]
- Zhao, G.Y.; Dai, B.; Ma, C. Study of effects of microparameters on macroproperties for parallel bonded model. Chin. J. Rock Mech. Eng. 2012, 31, 1491–1498. [Google Scholar]
- Sun, Q.C.; Xin, H.L.; Liu, J.G.; Jin, F. Skeleton and force chain network in static granular material. Rock Soil Mech. 2009, 83–87. [Google Scholar] [CrossRef]


© 2020 by the authors. Licensee MDPI, Basel, Switzerland. This article is an open access article distributed under the terms and conditions of the Creative Commons Attribution (CC BY) license (http://creativecommons.org/licenses/by/4.0/).