Article

Development of a Binary Model for Evaluating Water Distribution Systems by a Pressure Driven Analysis (PDA) Approach

by
Attilio Fiorini Morosini
1,*,
Sina Shaffiee Haghshenas
1,
Sami Shaffiee Haghshenas
1 and
Zong Woo Geem
2
1
Department of Civil Engineering, University of Calabria, 87036 Arcavacata, Italy
2
Department of Energy IT, Gachon University, Seongnam 13120, Korea
*
Author to whom correspondence should be addressed.
Appl. Sci. 2020, 10(9), 3029; https://doi.org/10.3390/app10093029
Submission received: 9 April 2020 / Revised: 23 April 2020 / Accepted: 24 April 2020 / Published: 26 April 2020
(This article belongs to the Section Civil Engineering)

Abstract

:
Investigation of Water Distribution Networks (WDNs) is considered a challenging task due to the unpredicted and uncertain conditions in water engineering. When in a WDN, a pipe failure occurs, and shut-off valves to isolate the broken pipe to allow repairing works are activated. In these new conditions, the hydraulic parameters in the network are modified because the topology of the entire system changes. If the head becomes inadequate, the Pressure Driven Analysis (PDA) is the correct approach to evaluate the performance of water networks. Hence, in the present study, the water distribution system was evaluated in pressure-driven conditions for 100 different scenarios and then using a type of neural network called Group Method of Data Handling (GMDH) as a stochastic technique. For this purpose, several most notable parameters including the base demand, pressure, and alpha (the percentage of effective supplied flow) were calculated using simulations based on a PDA approach and applied to the water distribution network of Praia a Mare in Southern Italy. In the second stage, the output parameters were used in a developed binary classification model. Finally, the obtained results showed that the GMDH algorithm can be applied as a powerful tool for modeling water distribution networks.

1. Introduction

Water Distribution Networks (WDNs) are considered as one of the most significant urban infrastructures. Their proper performance leads to an increase in the level of water supply services and also customers’ satisfaction. Hence, the correct management of WDNs is necessary to have a reliable water network system with high performance. When in a network, due to a failure, the pressure in some nodes is not adequate, and it is not possible to guarantee the service to the users [1].
Different scenarios can be modeled by using the Epanet tool and more descriptions of this ability can be found in some previous studies (e.g., [2,3,4]). The Epanet simulates hydraulic networks both in a steady-state and in extended period analysis and validates system behavior by assuming different input parameters. The Epanet Matlab toolkit allows for interfacing the Epanet with Matlab (R2018, MathWorks) to evaluate different hydraulic scenarios also with pressure driven analysis (PDA) based models [5]. Zheng et al. carried out an investigation for the least cost design of looped Water Distribution Systems (WDSs) by proposing a novel optimization approach. Their approach was a combination of a differential evolution algorithm with the traditional deterministic optimization technique which was tested on four looped WDSs. Finally, they proposed an approach with high performance to catch optimal solutions [6]. Morosini et al. proposed a new method to find pipes and nodes having an impact on the hydraulic behavior of the entire system. The obtained results showed that the new method had a suitable capability to solve the problem of network system design with a sensitivity analysis without a high computational cost [7]. A water resource and supply system design optimization model was proposed by Matrosov et al. They used seven simultaneous objectives and visual analytics in their research. The obtained results showed that this approach can be effective for the design of water supply systems [8]. Vicente et al. evaluated the water distribution system using pressure management [9]. Farmani et al. investigated the susceptibility of a pipe to failure in water distribution systems. They considered static and dynamic factors and then they proposed a predicted model to assess pipe failure using the k-means algorithm. Based on their results, the proposed model showed that it can significantly decrease the estimation error of pipe failures [10]. A research was conducted by Morosini et al. to determine the water distribution system behavior in emergency conditions and proposed an approach to define the importance of a pipe in each network [11]. In another research, Morosini et al. carried out an investigation to obtain a reliable system of water distribution networks by analyzing the system’s correct functioning and to define the importance of pipe and node in a real network. According to their results, they clarify that, in emergency conditions, a Pressure Driven Analysis (PDA) is the correct approach to evaluate the real network behavior [12]. Alizadeh et al. evaluated a relationship between fundamental variables of a network and the burst rate. The grasshopper optimization algorithm-based support vector regression, Gaussian process regression, and artificial neural network were used, and a prediction model with highly acceptable degree of accuracy was proposed [13]. A novel convergence trajectory controlled method was proposed by Yan et al. Their results showed that the proposed approach is a reliable system modeling technique for evaluating even several extreme and abnormal boundary conditions [14]. To analyze a WDN by using PDA method, Piller et al. introduced a new approach to solve the steady-state of pressure-dependent models and applied their method to a water network system [15]. The feasibility of real-time control algorithms was investigated for water distribution systems by Galuppini et al. On the basis of their results, they gave some recommendations for decreasing the risk of instability actions and the cost of control [16]. A simple demand prediction model was proposed by Salomons and Housh [17]. They evaluated the accuracy of the proposed model in a real-time optimization framework. Finally, some suggestions were proposed for the control scheme according to their results. Martin-Candilejo et al. carried out an optimization of the design of WDNs based on the Granados system for calculating variable flow rates [18].
Despite the merits of the above-mentioned research studies, the obstacles for a correct management of water network systems still persist. Hence, further studies are needed to provide new solutions to increase the efficiency of a WDS since it is a paramount part of a water supply system. In addition, selecting the method of improving the management of WDSs is considered as a challenging task as the previous studies show because there are many variables unpredicted and uncertain in the management of WDSs, for which traditional methods are incapable of understanding and analyzing. However, in recent years, artificial intelligence methods have shown a high capacity for solving complex and uncertain problems. For this propose, a binary classification model was developed here to investigate WDSs. The GMDH algorithm was used as one of the artificial intelligence methods and the WDS of Praia a Mare in Southern Italy was selected as a case study. It is worth noting that this type of analysis has not been used in previous research studies.
This paper is organized as follows. Section 2 presents a brief outline of the study and then PDA and GMHD algorithms have been explained. Section 3 presents the characteristics of the water distribution systems of the case study. Section 4 includes the binary classification modeling, results, and discussions. Finally, Section 5 closes the paper.

2. Methodology

Recently, artificial intelligence models have been successfully used for modeling the water network systems [19,20]. Hence, using EPANET software, group method of data handling type of neural network algorithm was used in this work. Figure 1 shows the flowchart of steps of conducting the research. According to Figure 1, the water distribution system of the adopted case study was evaluated in the first step and then 100 different scenarios were simulated by EPANET software under two conditions, namely steady-state and extended period simulation. Finally, the obtained results were modeled using the group method of data handling (GMDH) type of neural network algorithm as a stochastic technique.

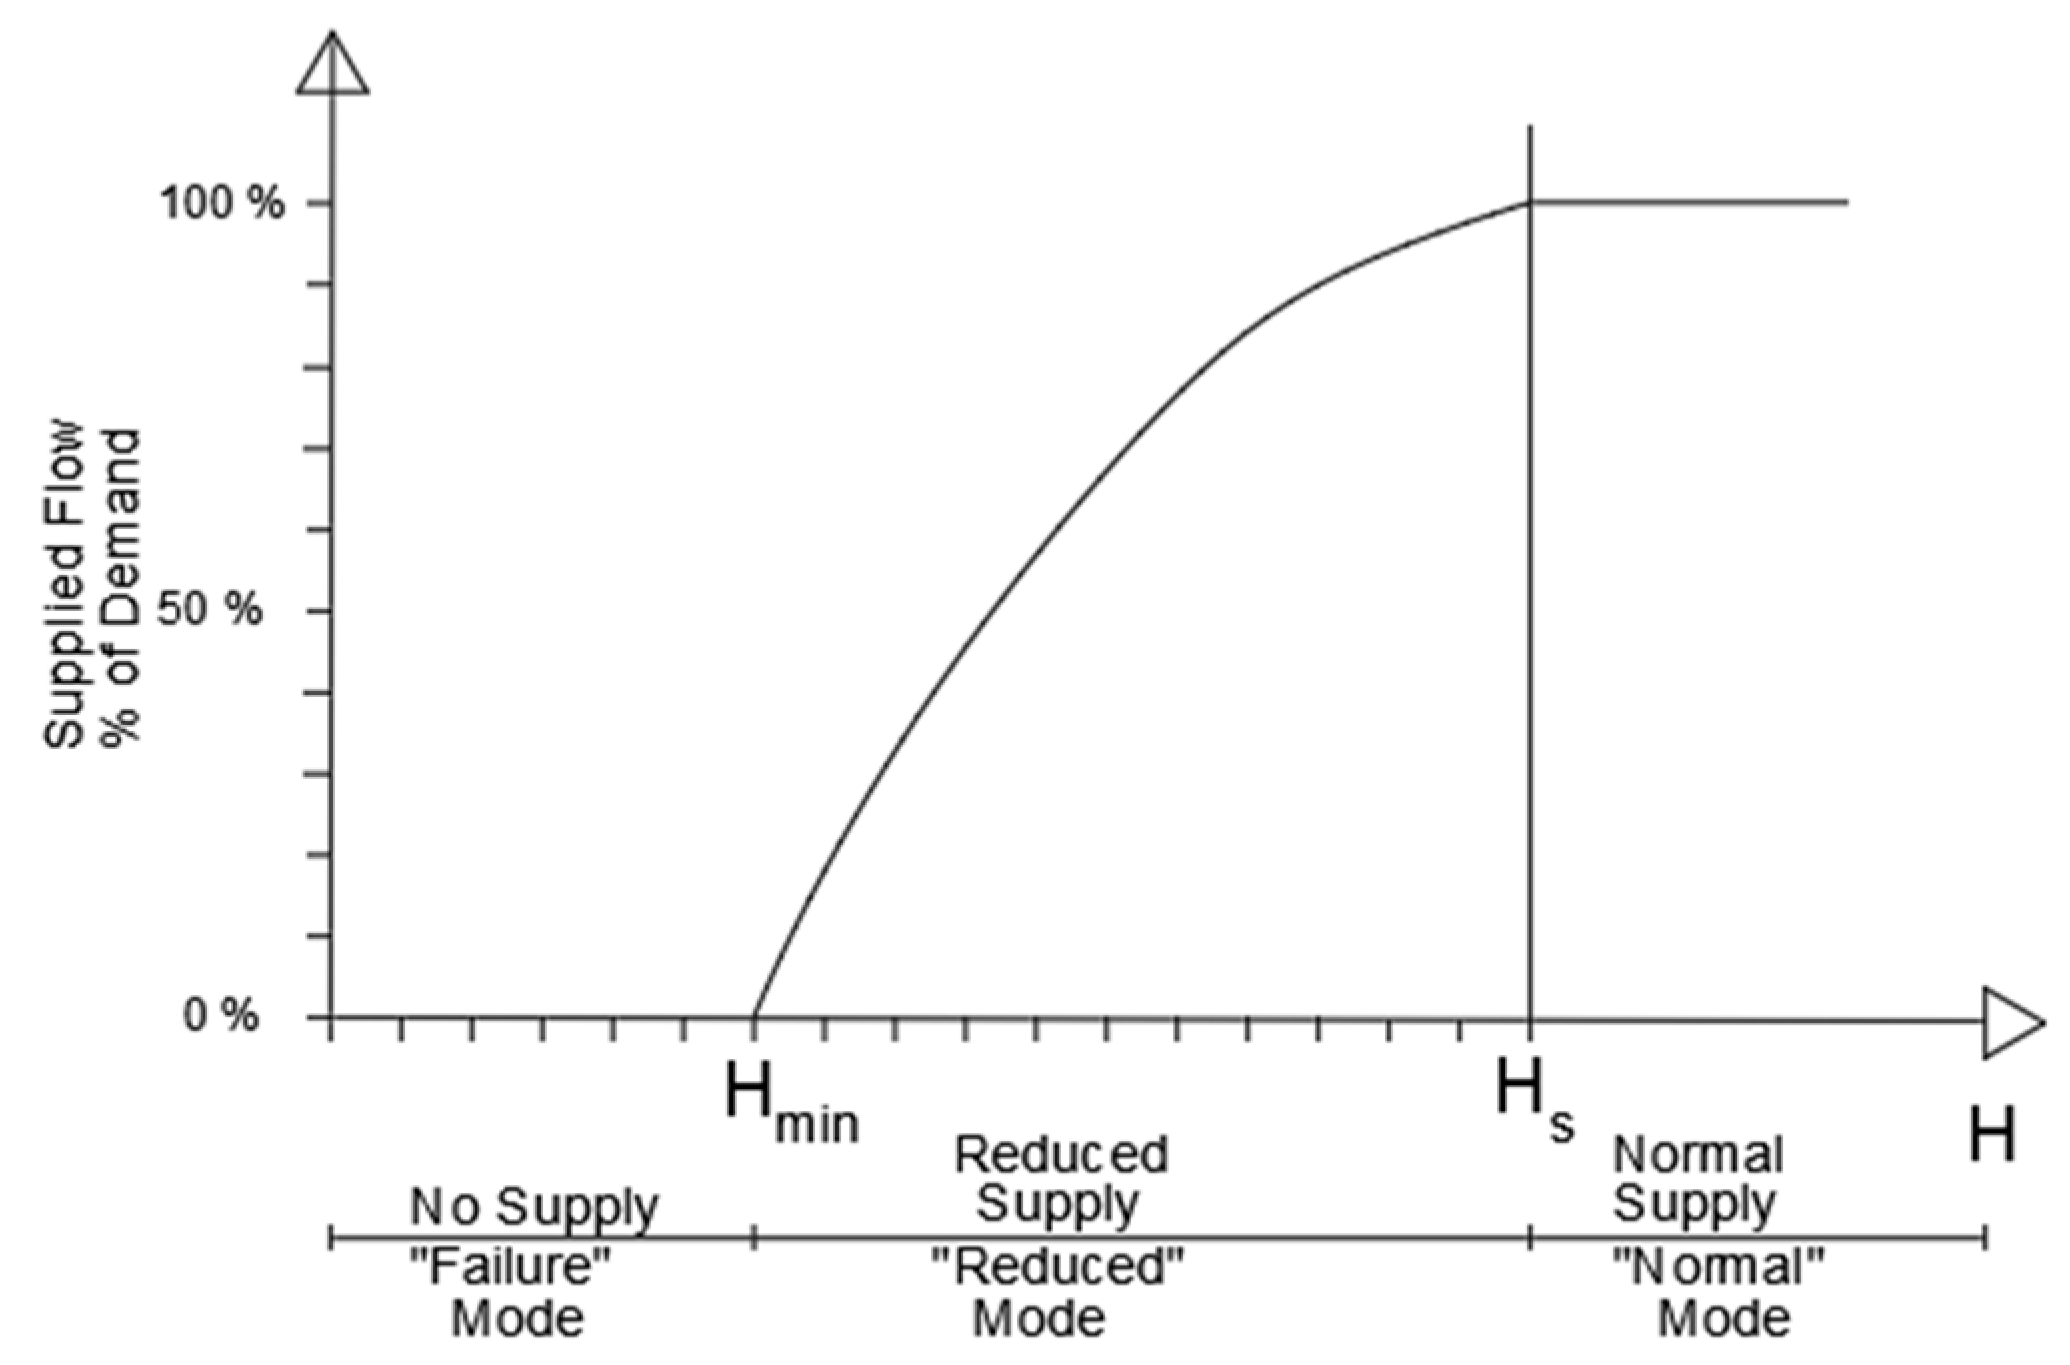
2.1. Pressure Driven Analysis (PDA)

When in a WDS a pipe failure occurs, shut-off valves are used to isolate broken pipes. The new topology modifies the circulating flow and the pressure values in each node change from those operating in normal conditions.
The analysis of the new system is necessary and, if the head at each node becomes inadequate, there is an inefficiency of the whole system and the impossibility to deliver the requested nodal demand to all users.
The effective demand (Base Demand, QBD) from the nodes depends on the real head value that is the sum of elevation (z) and piezometric height (p/γ), i.e., the ratio between pressure (p) and specific weight (γ). A node gives all the requested demand if the head is higher than Hs, which is the service head. It is the service head and depends on the ground level and (Hb) based on Equation (1):
H s = z + p / γ min = z + H b + P m s + P p + P D ,
where:
  • z: elevation of ground level
  • Hb: the height of each supplied building
  • p/γmin is the minimum piezometric head necessary to serve the users; it is related to the height of building Hb;
  • Pms is the minimum pressure necessary in each point of the building, usually 5 m;
  • Pp are the head losses along the riser column;
  • PD are the head losses starting from the network node and ending at the base of each building.
When the calculated head H is lower than Hs, the system works in reduced mode and the effective delivered demand Qreal is lower than assumed Base Demand QBD necessary for customers’ satisfaction. The value of Qreal = 0 if the head is below Hmin with:
Hmin = z + Pms
where Hmin is the head necessary to serve users at ground level.
The value of Qreal can be calculated as:
Qreal = α QBD
The value of α is the ratio between Qreal and QBD, and it represents the percentage of supplied flow. It can be calculated using the relations indicated below [21] and according to Figure 2:
α = 0   if   H H min
α = ( H s H H s H min ) 1 β   if   H min < H < H s
α = 1   if   H H s
where β can be calculated using a calibration model, and it is related to head loss along pipes. This value varies between 1.5 and 2 and generally we assume 2.

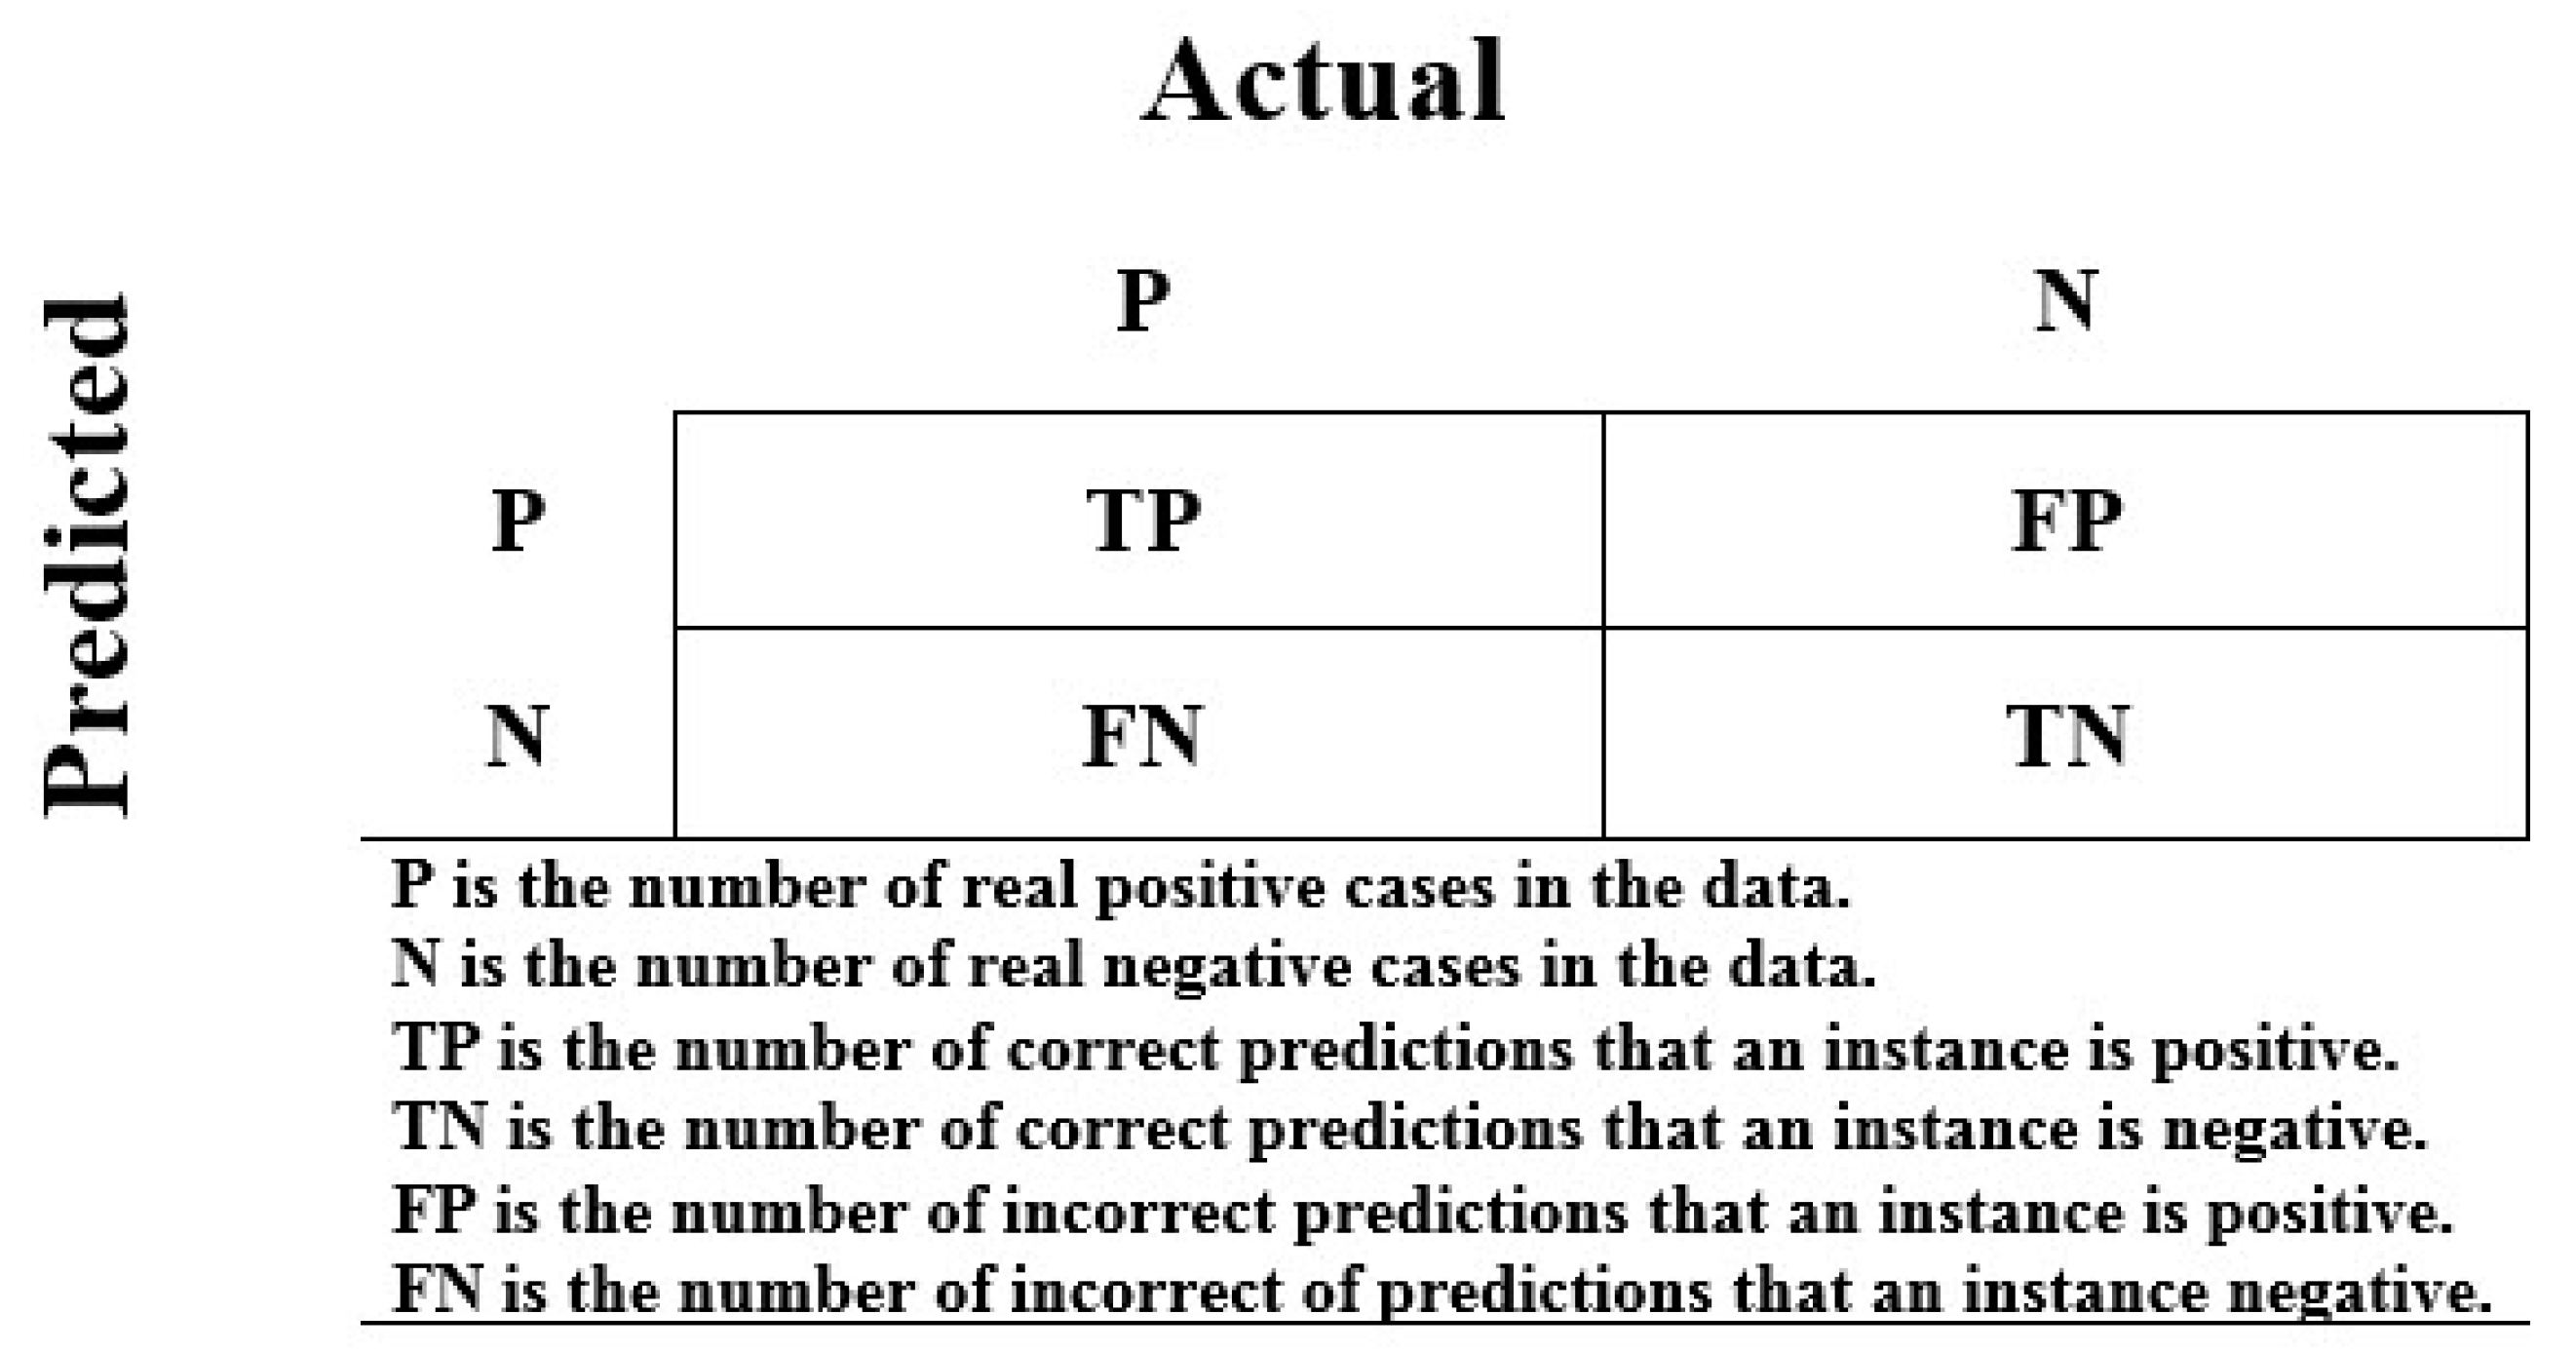
2.2. Group Method of Data Handling (GMDH)

Recently, artificial intelligence has been considered as an alternative tool in solving complex problems if compared to traditional methods. The use of artificial intelligence in a variety of engineering problems is increasing. As an example, the fuzzy set theory and its application [22,23], meta-heuristic algorithms [24,25,26,27,28,29,30,31], hybrid algorithms [32,33,34,35], pattern recognition, and machine learning [36,37,38,39,40] have been adopted. The GMDH type of neural network as a subset of artificial intelligence was proposed by Ivakhnenko [41], and it has a suitable capability for the training of network statistics. This method includes a set of neurons obtained from the connection of different pairs according to a quadratic polynomial that is also called Ivakhnenko polynomial equation [42,43,44]. The models are based upon the dataset and they are self-regulating models. Equation (7) shows the general form of the GMDH basic neural network map according to input and output data [45]:
y   =   a   +   i = 1 m b i   x i   +   i = 1 m j = 1 m c i j   x i   x j   +   i = 1 m j = 1 m k = 1 m d i j k   x i   x j   x k   +   i = 1 m j = 1 m k = 1 m l = 1 m e i j k l   x i   x j   x k   x l   ,        
where y is output and m is the number of data for values of x1, x2, x3, …, xm. By combining the quadratic polynomials of all the neurons for a set of inputs such as X = (xi1, xi2, xi3, …. xim), the approximate function of f ^   with output y ^ with the least possible error compared to output y was reached in the following form:
y   =   f ( x i 1   ,   x i 2   ,   x i 3   ,       x i m   ) i = ( 1 , 2 , 3 , ,   n )
The GMDH has different layers. In the process of GMDH, input data are given to the first layer and, after process and combination of input data, these data are considered as new input for the next layer. This procedure continues until the results of the layer (n+1) are more appropriate if compared to the layer (n) with less error. Therefore, the calculations are stopped. Figure 3 shows the basic structure of the GMDH algorithm. Input data sets are randomly divided into training and testing data sets and also m and n are a number of variables and observations, respectively. It is worth mentioning that, in spite of the fact that there are several classification methods, the GMDH algorithm was selected as an optimization algorithm based on two main reasons in this work. First, it was not used in previous studies. Second, the pattern identification and binary classification are some of the most notable capabilities of GMDH algorithms in different disciplines [46].

3. Case Study

The methodology was applied to a real case related to the water network of Praia a Mare (CS, Italy), a coastal city in the Northern zone of Calabria. The network, consisting of 73 pipes, 53 nodes, and 2 tanks, is shown in Figure 4. The total base demand circulating in the network, in summer conditions, is 47.25 l/s for about 14,000 users. The minimum head Hmin varies from 29 to 68 m and Hs varies from 64 to 98 m assuming for each node p/γmin = 35 m.
The water distribution system has a total length of 18,500 m and the pipe diameters vary in the range 125–250 mm. The volume tank is about 600 m3 for tank 54 and 1500 m3 for tank 55.
Four scenarios depending on the possible pipe failure in the network for pipes 1,2, and 73 outgoing, from the tanks 54 and 55 have been evaluated. The first one assumes that the three pipes are all functioning (scenario OOO). The other scenarios assume the failure of pipe 2 (COO), pipe 1 (OCO), and pipe 73 (OOC).
For each scenario, a steady-state analysis and an extended period simulation have been performed obtaining 25 data sets, one for steady-state simulation and 24 assuming a one hour time step in the extended period simulation.
The PDA analysis furnishes the values of real demand at each node when the calculated head H is lower than Hs and α < 1. For each node, the analysis shows if it works in reduced mode or not, and this condition is assumed as a parameter in this analysis.
Table 1 shows, as an example, the results for steady-state analysis for each scenario.

4. GMDH Modeling and Discussion

For modeling in this research, three effective parameters including base demand, pressure, and alpha were calculated by simulating 100 different data sets of the water distribution network of Praia a Mare with 53 nodes. The nodes were used as input dataset, and the performance distribution network by PDA analysis was used as output data sets.
Before modeling, there are two steps that play a key role in the existence of an efficient model. At the first step, according to the type of model, a suitable performance index should be selected to evaluate the capacity performance of an artificial intelligence model [47]. As previously mentioned, in order to assess water distribution systems under insufficient pressure conditions in this study, binary classification is used by the GMDH algorithm. Hence, a confusion matrix is considered for evaluating models that is a suitable tool for measuring accuracy. The general form of a confusion matrix for evaluating a binary classification model through two classes is showed in Figure 5. Then, according to the results of the confusion matrix, accuracy and error are measured on the basis of the following Equations (9) and (10):
A c c =       T P   +   T N T P + F P + T N + F N                        
E r r o r =       F P   +   F N T P + F P + T N + F N   =     1     A c c  
Finally, it should be noted that the determination of control parameters is an important phase before modeling because they greatly contribute to improve convergence and speed of the algorithm. There are often no specific relationships for these parameters and they are considered based on recent studies, expert opinions, and trial and error [48,49,50,51]. In this work, some of these control parameters were selected on the basis of previous studies and they were checked on the basis of trial and error including the Selection Pressure (SP), Maximum Number of Layers (MNL), and Maximum Number of Neurons in a Layer (MNNL). The SP is a dimensionless parameter, and it plays a key role in the sensitivity of modeling error. The previous studies suggested that the value of this parameter equal to 0.6. According to trial and error, the numbers of MNL and MNNL are determined. Hence, a set of values including 5, 10, and 15 for MNL, and a set of values including 5, 10, 15, and 20 for MNNL were considered, and 12 models were constructed and evaluated. It worth mentioning that the initial model was constructed for the first scenario (OOO) in steady-state conditions and 75% of data sets were also considered as training data and the rest was a testing dataset based on Looney’s research [52]. The results of the binary classification of the first scenario (OOO) are shown in Table 2.
For determining the best structure of the developed binary classification model, a simple ranking method was used [53]. For this purpose, for ranking of the accuracy of training and testing data set, the models were ranked from 12 to 1 from the highest accuracy to lowest accuracy, respectively. For instance, the second and 8th models had the highest accuracy in the training dataset and also both of them were equal. As a result, they were assigned a rank equal to 12. Moreover, the 8th model showed a suitable performance to classify the testing dataset with the highest accuracy among other models with 100%, which achieves a rank equal to 12. Finally, in the last column of Table 3, the values of the ranking of training and testing for each model were added.
According to the results of Table 3, the 8th developed model has the highest rank if compared to other models with a structure including MNL and MNNL equal to 15 and 10, respectively, and it can be concluded that it has the best performance to recognize and predict the system. The confusion matrices of the 8th developed model for training, testing, and total data are shown in Figure 6, Figure 7, and Figure 8, respectively.
According to Figure 6, the accuracy of binary classification for training data was 100%. In this case, for 21 nodes, H<Hs with labels “0” in which 21 nodes were recognized and classified correctly. Also, the proposed model could identify and classify all 19 nodes which did not work in reduced mode. It is worth noting that all testing data sets were classified and recognized with 92.3% accuracy by the proposed model based on Figure 7. Consequently, it can be concluded that the developed model could classify all 53 nodes with 98.1% accuracy, describing its high capability in the identification and binary classification of performance distribution network.
For a better understanding of the 8th developed model’s accuracy, the results of the confusion matrix for training, testing, and all data were evaluated with three other performance indicators, namely the precision, recall, and F1 score, which are known as complementary performance indicators for evaluating the confusion matrix. The precision is used to investigate a particular class. Indeed, it is the ratio between the value of “TP” and the sum of “TP” and “FP”. Moreover, the recall is called the true negative rate, which is the ratio of the value between “TP” and the sum of “TP” and “FN”. In addition, the F1 score considers the effect of precision and recalls together. For more information regarding performance indicators of algorithm, please refer to Faradonbeh et al [54]. The results of this analysis are shown in Figure 9.
According to Figure 9, all performance metrics have values over 80%. Therefore, the 8th developed model has high performance related to classifying data sets. Regarding the developed binary classification model, all calculated data of performance distribution network using a PDA approach for 100 different data sets were modeled, and total accuracy for each data set was calculated. The accuracies of four scenarios under steady-state conditions are shown in Figure 10 and also Figure 11, Figure 12, Figure 13 and Figure 14 showing the total accuracies for 96 different data sets for extended period analysis.
Figure 10, Figure 11, Figure 12, Figure 13 and Figure 14 demonstrate the capability of the developed model in simulating and evaluating water distribution systems by the PDA approach. Based on these figures, the accuracy of developed model was over 90% for four different scenarios based on the steady-state conditions and all time periods based on extended period simulation including 96 different scenarios. Consequently, the results show that the GMDH algorithm can provide highly acceptable degrees of accuracy to find and recognize a meaningful relationship between the base demand, pressure, and α as input and the results obtained by PDA analysis as output. It should be noted that the obtained results of the developed model are unique for only the water distribution network of Praia a Mare and are not directly used for other water distribution networks. In addition, although the GMDH algorithm is highly efficient in solving complex problems, incomplete data in some optimization problems of the water distribution system could occur. As a consequence, it is suggested that other methods of classification such as naive Bayes classifier as a supervised classification method can be used for these types of problems.

5. Conclusions

The ensuring of the performance of the urban water networks plays a key role in urban water management, which will lead to improving service and citizen satisfaction. Hence, in this work, the water distribution network of Praia a Mare in Southern Italy was selected as a case study and the water distribution system of this city was investigated using a pressure-driven analysis approach for 100 different data sets. PDA is a reliable method to evaluate the real performance of water networks. After simulating the water distribution system, three notable parameters including the base demand, pressure, and alpha were calculated. They were used as input data for a developed binary classification model. The GMDH algorithm was used and the developed binary classification model was constructed and then, for each different scenario, it was used. The result shows that all models had an accuracy of over 90%. As a result, it can be concluded that the developed binary classification model has a high performance capacity in classifying and evaluating the water distribution system of the involved urban water network, hence it can be applied as a powerful tool to recognize the performance of the water network. According to the importance of the present topic, other artificial intelligence techniques can be used in future research.

Author Contributions

A.F.M designed the study. A.F.M, S.S.H. (Sina Shaffiee Haghshenas), and S.S.H. (Sami Shaffiee Haghshenas) completed literature review. A.F.M, S.S.H. (Sina Shaffiee Haghshenas), and S.S.H. (Sami Shaffiee Haghshenas) conducted EPANET software analysis and intelligent and statistical analyses in this paper. A.F.M. and Z.W.G. managed the whole process and supervised the work. All authors have read and agreed to the published version of the manuscript.

Funding

This research received no external funding.

Conflicts of Interest

The authors declare no conflict of interest.

References

  1. Khaled, H.; Sendil, U. Relationship between pressure and leakage in a water distribution network. In Proceedings of the AWWA Conference, Toronto, ON, Canada, May 1992. [Google Scholar]
  2. Rossman, L. Computer Models/EPANET. In Water Distribution Systems Handbook; Mays, L., Ed.; McGraw-Hill: New York, NY, USA, 1999. [Google Scholar]
  3. Rossman, L. EPANET2 Users’ Manual; Drinking Water Research Division, Risk Reduction Engineering Laboratory, Office of Research and Development U.S. Environmental Protection Agency: Cincinnati, OH, USA, 2000. [Google Scholar]
  4. Coelho, S.T.; Loureiro, D.; Alegre, H. Modelling and Analysis of Water Supply Systems; Technical Guide n.4, ERSAR; LNEC: Lisbon, Portugal, 2006. (In Portuguese) [Google Scholar]
  5. Demetrios, G.; Eliades, M.K.; Stelios, V.; Marios, M. Polycarpou EPANET-MATLAB Toolkit: An Open-Source Software for Interfacing EPANET with MATLAB. In Proceedings of the IWC—14th International CCWI Conference Computing and Control for the Water Industry Conference, Amsterdam, The Netherlands, 7–9 November 2016. [Google Scholar]
  6. Zheng, F.; Simpson, A.R.; Zecchin, A.C. A combined NLP-differential evolution algorithm approach for the optimization of looped water distribution systems. Water Resour. Res. 2011, 47, 1–8. [Google Scholar] [CrossRef] [Green Version]
  7. Morosini, A.F.; Costanzo, F.; Veltri, P.; Savić, D. Identification of measurement points for calibration of water distribution network models. Procedia Eng. 2014, 89, 693–701. [Google Scholar] [CrossRef] [Green Version]
  8. Matrosov, E.S.; Huskova, I.; Kasprzyk, J.R.; Harou, J.J.; Lambert, C.; Reed, P.M. Many-objective optimization and visual analytics reveal key trade-offs for London’s water supply. J. Hydrol. 2015, 531, 1040–1053. [Google Scholar] [CrossRef]
  9. Vicente, D.J.; Garrote, L.; Sánchez, R.; Santillán, D. Pressure management in water distribution systems: Current status, proposals, and future trends. J. Water Resour. Plan. Manag. 2016, 142, 04015061. [Google Scholar] [CrossRef]
  10. Farmani, R.; Kakoudakis, K.; Behzadian Moghadam, K.; Butler, D. Pipe failure prediction in water distribution systems considering static and dynamic factors. Procedia Eng. 2017, 186, 117–126. [Google Scholar] [CrossRef]
  11. Morosini, A.F.; Caruso, O.; Veltri, P. Management of water distribution systems in PDA condition with isolation valves. Multidiscip. Digit. Publ. Inst. Proc. 2018, 2, 672. [Google Scholar] [CrossRef] [Green Version]
  12. Morosini, A.F.; Caruso, O.; Veltri, P. Management of water distribution systems in PDA conditions using isolation valves: Case studies of real networks. J. Hydroinformatics 2019. [Google Scholar] [CrossRef] [Green Version]
  13. Alizadeh, Z.; Yazdi, J.; Mohammadiun, S.; Hewage, K.; Sadiq, R. Evaluation of data driven models for pipe burst prediction in urban water distribution systems. Urban Water J. 2019, 16, 136–145. [Google Scholar] [CrossRef]
  14. Yan, H.; Wang, Q.; Wang, J.; Xin, K.; Tao, T.; Li, S. A simple but robust convergence trajectory controlled method for pressure driven analysis in water distribution system. Sci. Total Environ. 2019, 659, 983–994. [Google Scholar] [CrossRef]
  15. Piller, O.; Elhay, S.; Deuerlein, J.W.; Simpson, A.R. A Content-Based Active-Set Method for Pressure-Dependent Models of Water Distribution Systems with Flow Controls. J. Water Resour. Plan. Manag. 2020, 146, 04020009. [Google Scholar] [CrossRef] [Green Version]
  16. Galuppini, G.; Magni, L.; Creaco, E. Stability and Robustness of Real-Time Pressure Control in Water Distribution Systems. J. Hydraul. Eng. 2020, 146, 04020023. [Google Scholar] [CrossRef]
  17. Salomons, E.; Housh, M. A Practical Optimization Scheme for Real-Time Operation of Water Distribution Systems. J. Water Resour. Plan. Manag. 2020, 146, 04020016. [Google Scholar] [CrossRef]
  18. Martin-Candilejo, A.; Santillán, D.; Iglesias, A.; Garrote, L. Optimization of the Design of Water Distribution Systems for Variable Pumping Flow Rates. Water 2020, 12, 359. [Google Scholar] [CrossRef] [Green Version]
  19. Haghshenas, S.S.; Faradonbeh, R.S.; Mikaeil, R.; Haghshenas, S.S.; Taheri, A.; Saghatforoush, A.; Dormishi, A. A new conventional criterion for the performance evaluation of gang saw machines. Measurement 2019, 146, 159–170. [Google Scholar] [CrossRef]
  20. Noori, A.M.; Mikaeil, R.; Mokhtarian, M.; Haghshenas, S.S.; Foroughi, M. Feasibility of Intelligent Models for Prediction of Utilization Factor of TBM. Geotech. Geol. Eng. 2020, 1–19. [Google Scholar] [CrossRef]
  21. Wagner, J.M.; Shamir, U.; Marks, D.H. Water distribution reliability: Simulation metods. J. Water Resour. Plan. Manag. 1988, 114, 3. [Google Scholar] [CrossRef] [Green Version]
  22. Haghshenas, S.S.; Haghshenas, S.S.; Mikaeil, R.; Ardalan, T.; Sedaghati, Z.; Kazemzadeh Heris, P. Selection of an Appropriate Tunnel Boring Machine Using TOPSIS-FDAHP Method (Case Study: Line 7 of Tehran Subway, East-West Section). Electron. J. Geotech. Eng. 2017, 22, 4047–4062. [Google Scholar]
  23. Haghshenas, S.S.; Ozcelik, Y.; Haghshenas, S.S.; Mikaeil, R.; Moghadam, P.S. Ranking and assessment of tunneling projects risks using fuzzy MCDM (Case study: Toyserkan doolayi tunnel). In Proceedings of the 25th International mining congress and exhibition of Turkey, Antalya, Turkey, 11 April 2017; pp. 289–297. [Google Scholar]
  24. Mikaeil, R.; Haghshenas, S.S.; Hoseinie, S.H. Rock penetrability classification using artificial bee colony (ABC) algorithm and self-organizing map. Geotech. Geol. Eng. 2018, 36, 1309–1318. [Google Scholar] [CrossRef]
  25. Aryafar, A.; Mikaeil, R.; Haghshenas, S.S.; Haghshenas, S.S. Application of metaheuristic algorithms to optimal clustering of sawing machine vibration. Measurement 2018, 124, 20–31. [Google Scholar] [CrossRef]
  26. Hosseini, S.M.; Ataei, M.; Khalokakaei, R.; Mikaeil, R.; Haghshenas, S.S. Study of the effect of the cooling and lubricant fluid on the cutting performance of dimension stone through artificial intelligence models. Eng. Sci. Technol. Int. J. 2019, 22, 71–81. [Google Scholar] [CrossRef]
  27. Hosseini, S.M.; Ataei, M.; Khalokakaei, R.; Mikaeil, R.; Haghshenas, S.S. Investigating the role of coolant and lubricant fluids on the performance of cutting disks (case study: Hard rocks). Rud. Geološko-Naft. Zb. 2019, 34, 13–24. [Google Scholar] [CrossRef]
  28. Mikaeil, R.; Bakhshinezhad, H.; Haghshenas, S.S.; Ataei, M. Stability analysis of tunnel support systems using numerical and intelligent simulations (case study: Kouhin Tunnel of Qazvin-Rasht Railway). Rud. -Geološko-Naft. Zb. 2019, 34, 1–10. [Google Scholar] [CrossRef] [Green Version]
  29. Dormishi, A.; Ataei, M.; Mikaeil, R.; Khalokakaei, R.; Haghshenas, S.S. Evaluation of gang saws’ performance in the carbonate rock cutting process using feasibility of intelligent approaches. Eng. Sci. Technol. Int. J. 2019, 22, 990–1000. [Google Scholar] [CrossRef]
  30. Mikaeil, R.; Haghshenas, S.S.; Sedaghati, Z. Geotechnical risk evaluation of tunneling projects using optimization techniques (case study: The second part of Emamzade Hashem tunnel). Nat. Hazards 2019, 97, 1099–1113. [Google Scholar] [CrossRef]
  31. Park, J.H.; Yu, J.S.; Geem, Z.W. Optimal Project Planning for Public Rental Housing in South Korea. Sustainability 2020, 12, 600. [Google Scholar] [CrossRef] [Green Version]
  32. Mikaeil, R.; Haghshenas, S.S.; Haghshenas, S.S.; Ataei, M. Performance prediction of circular saw machine using imperialist competitive algorithm and fuzzy clustering technique. Neural Comput. Appl. 2018, 29, 283–292. [Google Scholar] [CrossRef]
  33. Moradi, E.; Naderpour, H.; Kheyroddin, A. An artificial neural network model for estimating the shear contribution of RC beams strengthened by externally bonded FRP. J. Rehabil. Civ. Eng. 2018, 6, 88–103. [Google Scholar] [CrossRef]
  34. Gnawali, K.; Han, K.H.; Geem, Z.W.; Jun, K.S.; Yum, K.T. Economic Dispatch Optimization of Multi-Water Resources: A Case Study of an Island in South Korea. Sustainability 2019, 11, 5964. [Google Scholar] [CrossRef] [Green Version]
  35. Alsharif, M.H.; Yahya, K.; Geem, Z.W. Strategic Market Growth and Policy Recommendations for Sustainable Solar Energy Deployment in South Korea. J. Electr. Eng. Technol. 2019, 1–13. [Google Scholar] [CrossRef]
  36. Kutyłowska, M. Prediction of water conduits failure rate–comparison of support vector machine and neural network. Ecol. Chem. Eng. A 2016, 23, 147–160. [Google Scholar] [CrossRef]
  37. Piasecki, A.; Jurasz, J.; Kaźmierczak, B. Forecasting Daily Water Consumption: A Case Study in Torun, Poland. Period. Polytech. Civ. Eng. 2018, 62, 818–824. [Google Scholar] [CrossRef] [Green Version]
  38. Kidando, E.; Moses, R.; Sando, T.; Ozguven, E.E. An application of Bayesian multilevel model to evaluate variations in stochastic and dynamic transition of traffic conditions. J. Mod. Transp. 2019, 27, 235–249. [Google Scholar] [CrossRef] [Green Version]
  39. Behnood, A.; Golafshani, E.M. Machine learning study of the mechanical properties of concretes containing waste foundry sand. Constr. Build. Mater. 2020, 243, 118152. [Google Scholar] [CrossRef]
  40. Golafshani, E.M.; Behnood, A.; Arashpour, M. Predicting the compressive strength of normal and High-Performance Concretes using ANN and ANFIS hybridized with Grey Wolf Optimizer. Constr. Build. Mater. 2020, 232, 117266. [Google Scholar] [CrossRef]
  41. Ivakhnenko, A.G. Polynomial theory of complex systems. IEEE Trans. Syst. Manand Cybern. 1971, 364–378. [Google Scholar] [CrossRef] [Green Version]
  42. Ivakhnenko, A.G. Self-Organizing Methods in Modelling and Clustering: GMDH Type Algorithms. Systems Analysis and Simulation I; Springer: New York, NY, USA, 1988; pp. 86–88. ISBN 978-0-387-97091-2. [Google Scholar] [CrossRef]
  43. Sezavar, R.; Shafabakhsh, G.; Mirabdolazimi, S.M. New model of moisture susceptibility of nano silica-modified asphalt concrete using GMDH algorithm. Constr. Build. Mater. 2019, 211, 528–538. [Google Scholar] [CrossRef]
  44. Dag, O.; Karabulut, E.; Alpar, R. GMDH2: Binary Classification via GMDH-Type Neural Network Algorithms—R Package and Web-Based Tool. Int. J. Comput. Intell. Syst. 2019, 12, 649–660. [Google Scholar] [CrossRef] [Green Version]
  45. Dag, O.; Kasikci, M.; Karabulut, E.; Alpar, R. Diverse classifiers ensemble based on GMDH-type neural network algorithm for binary classification. Commun. Stat. Simul. Comput. 2019, 1–17. [Google Scholar] [CrossRef]
  46. Mikaeil, R.; Haghshenas, S.S.; Ozcelik, Y.; Gharehgheshlagh, H.H. Performance evaluation of adaptive neuro-fuzzy inference system and group method of data handling-type neural network for estimating wear rate of diamond wire saw. Geotech. Geol. Eng. 2018, 36, 3779–3791. [Google Scholar] [CrossRef]
  47. Mikaeil, R.; Beigmohammadi, M.; Bakhtavar, E.; Haghshenas, S.S. Assessment of risks of tunneling project in Iran using artificial bee colony algorithm. Sn. SN. Appl. Sci. 2019, 1, 1711. [Google Scholar] [CrossRef] [Green Version]
  48. Aryafar, A.; Mikaeil, R.; Shafiee Haghshenas, S. Utilization of soft computing for evaluating the performance of stone sawing machines, Iranian Quarries. Int. J. Min. Geo-Eng. 2018, 52, 31–36. [Google Scholar] [CrossRef]
  49. Mohammadi, J.; Ataei, M.; Kakaei, R.K.; Mikaeil, R.; Haghshenas, S.S. Prediction of the production rate of chain saw machine using the multilayer perceptron (MLP) neural network. Civ. Eng. J. 2018, 4, 1575–1583. [Google Scholar] [CrossRef] [Green Version]
  50. Dormishi, A.R.; Ataei, M.; Khaloo Kakaie, R.; Mikaeil, R.; Shaffiee Haghshenas, S. Performance evaluation of gang saw using hybrid ANFIS-DE and hybrid ANFIS-PSO algorithms. J. Min. Environ. 2019, 10, 543–557. [Google Scholar] [CrossRef]
  51. Pirouz, B.; Shaffiee Haghshenas, S.; Shaffiee Haghshenas, S.; Piro, P. Investigating a Serious Challenge in the Sustainable Development Process: Analysis of Confirmed cases of COVID-19 (New Type of Coronavirus) Through a Binary Classification Using Artificial Intelligence and Regression Analysis. Sustainability 2020, 12, 2427. [Google Scholar] [CrossRef] [Green Version]
  52. Looney, C.G. Advances in feedforward neural networks: Demystifying knowledge acquiring black boxes. IEEE Trans. Knowl. Data Eng. 1996, 8, 211–226. [Google Scholar] [CrossRef]
  53. Zorlu, K.; Gokceoglu, C.; Ocakoglu, F.; Nefeslioglu, H.A.; Acikalin, S. Prediction of uniaxial compressive strength of sandstones using petrography-based models. Eng. Geol. 2008, 96, 141–158. [Google Scholar] [CrossRef]
  54. Faradonbeh, R.S.; Haghshenas, S.S.; Taheri, A.; Mikaeil, R. Application of self-organizing map and fuzzy c-mean techniques for rockburst clustering in deep underground projects. Neural Comput. Appl. 2019, 1–15. [Google Scholar] [CrossRef]
Figure 1. Flowchart of research steps.
Applsci 10 03029 g001
Figure 2. Relation between supplied flow and head at each node [21].
Applsci 10 03029 g002
Figure 3. Schematic structure of the GMDH algorithm [46].
Applsci 10 03029 g003
Figure 4. The water network of Praia a Mare (CS, Italy).
Applsci 10 03029 g004
Figure 5. The basic form of confusion matrix with two classes.
Applsci 10 03029 g005
Figure 6. The results of confusion matrix for training data.
Applsci 10 03029 g006
Figure 7. The results of confusion matrix for testing data.
Applsci 10 03029 g007
Figure 8. The results of confusion matrix for all data.
Applsci 10 03029 g008
Figure 9. A comparison between the results of accuracy and other performance metrics.
Applsci 10 03029 g009
Figure 10. The accuracies of four different data sets analyzing network in the steady-state conditions.
Applsci 10 03029 g010
Figure 11. The accuracies of the data set of the OOO analyzing network in extended period conditions.
Applsci 10 03029 g011
Figure 12. The accuracies of the data set of the COO analyzing network in extended period conditions.
Applsci 10 03029 g012
Figure 13. The accuracies of the data set of OCO analyzing network in extended period conditions.
Applsci 10 03029 g013
Figure 14. The accuracies of scenario of the OOC analyzing network in extended period conditions.
Applsci 10 03029 g014
Table 1. The analysis results in steady-state conditions.
ScenarioPipe FailureH < HminHmin < H < HsH > Hs
OOO-02528
COO203221
OCO102924
OOC7328196
Table 2. The effect of different values of two control parameters on the accuracy of training and testing datasets.
Model No.SPMNLMNNLAccuracy of Training (%)Accuracy of Testing (%)
10.6559592.3
20.651097.592.3
30.65159390.9
40.610596.992.3
50.610109593
60.6101596.990.5
70.61559792.5
80.6151010092.3
90.6151596.391
100.620596.392.3
110.6201094.699
120.620159391.2
Table 3. Ranking developed binary classification models.
Model No.SPMNLMNNLThe Rank of Accuracy of TrainingThe Rank of Accuracy of TestingTotal Rank
10.6557916
20.651011920
30.65155611
40.61059918
50.6101071118
60.610159514
70.6155101020
80.6151012921
90.615158715
100.62058917
110.6201061218
120.620155813

