Article

Validity of Anchorage Zone Design for Post-Tensioned Concrete Members with High-Strength Strands

Department of Architectural Engineering, Kyung Hee University, Deogyeong-Daero 1732, Yongin 17104, Korea
*
Author to whom correspondence should be addressed.
Appl. Sci. 2020, 10(9), 3039; https://doi.org/10.3390/app10093039
Submission received: 2 April 2020 / Revised: 24 April 2020 / Accepted: 24 April 2020 / Published: 27 April 2020
(This article belongs to the Section Civil Engineering)

Abstract

:
This paper evaluated the validity of a design method for anchorage zones in post-tensioned concrete members using Grade 2400 strands from American Concrete Institute (ACI) Building Code, ACI 318-19 and Association of State Highway and Transportation Officials (AASHTO) codes. For this purpose, the behaviors of anchorage zones in ten specimens were investigated and compared with ACI 318-19 and AASHTO codes, considering the jacking force and ultimate flexural load. The anchor shape, number of strands, and reinforcement details of the anchorage zone were considered as variables. The test results showed that ACI 318-19 and AASHTO codes could not predict where the maximum bursting force would occur. In addition, they calculated bursting force by summation of the pre-stressing forces from the individual strands, whereas the experimental results were not linearly proportional to the number of strands. The ACI 318-19 and AASHTO standards were inadequate to calculate bearing force of post-tensioned members using high-strength strands. Furthermore, additional stress in the anchorage zone occurred as the flexural load increased, which may have been caused by a failure in the anchorage zone. The experimental results indicated that the method used to predict stress and design of anchorage zone in current codes should be improved to consider stress distribution and additional stress in post-tensioned concrete members using high-strength strands.

1. Introduction

In post-tensioned concrete members, the pre-stressing force is transferred to the concrete through an anchorage device at the end of the member as a compression force. The high stresses caused by compression force, such as the bearing force and bursting force, are generated in the anchorage zone, as shown in Figure 1. If the stress in the anchorage zone exceeds the compressive strength of the concrete, cracks and failures may occur in the anchorage zone, which can cause corrosion of the strands and reduce the structural performance of the members. Therefore, it is important to accurately predict the bearing and bursting stresses generated in the anchorage zone; appropriate reinforcements are required to allow the anchorage zone to resist these concentrated stresses. Design codes such as American Concrete Institute (ACI) Building Code, ACI 318-19 [1] and Association of State Highway and Transportation Officials (AASHTO) [2] suggest methods for calculating stress and design of anchorage zones. However, many researchers have pointed out the inaccuracy of these design criteria and have focused on methods to predict stress accurately and prevent failures in the anchorage zones using experiments and nonlinear finite element analysis. Yun [3] conducted a nonlinear analysis based on a strut-and-tie model to investigate the validity of the AASHTO approximate stress analysis and design method for bursting and bearing stresses. Yun and Liu [4] proposed a bursting force equation that considered concentricity, eccentricity, and tendon inclination using compression–dispersion models. The proposed equation was verified in a comparison with the AASHTO design codes using finite element analysis and experimental results. Zhou et al. [5] proposed an equation for transverse stresses and bursting forces based on an updated model using an infinite number of isostatic lines of compression; the authors evaluated the proposed equation by comparing it with the results of a finite element analysis, equations from previous research [4,6], and AASHTO specifications. Axson [7] investigated thirty-two lightweight concrete specimens with different bearing plate sizes, amounts of reinforcing bar, and forms of reinforcing bar in the anchorage zone. The experimental results were used to determine the reinforcement details for the post-tensioned anchorage zone in lightweight concrete by considering the ratio of the area of the supporting concrete to the bearing area and the lateral confining reinforcement. Cervenka and Ganz [8] conducted a case study of numerical simulations of anchorage tests using nonlinear finite element analysis. The results showed that the basic rules for designing ETAG 013 anchorage zones of post-tensioned concrete structures have limitations related to the shape of anchorage devices and the size of members, and investigation revealed that spiral confinement reinforcement effectively resisted stress in the anchorage zone. Recently, high-strength strands of Grade 2400 MPa have been developed to provide a 29% increase in tensile strength compared to conventional strands of Grade 1860 MPa. In the high-strength strands, a higher concentrated load is applied to the anchorage device. In addition, the magnitude of pre-stress force in pre-stressed concrete member may change the natural vibration frequencies [9]; therefore, the current design methods for post-tensioned anchorage zone need to be verified. This study assessed the applicability of the design method specified in the design standards [1,2] for the anchorage zone of post-tensioned concrete members with high-strength strands, considering the shape of the anchorage, number of strands, and reinforcement details.

2. Design Method for the Anchorage Zone

The bursting force equation in ACI 318-19 calculates the bursting force and location of the bursting force as shown in Equations (1) and (2), which are based on the bursting force equation proposed by Mörsch [10]. It was assumed that the pre-stressing force acting on the bearing plate was applied to the centroid, which was one-quarter of the upper and lower surfaces of the bearing plate, and that the reaction force of the concrete was acting at the centroid of the concrete. The ACI 318-19 design standard estimated that the location of the maximum bursting force would occur at half of the depth from the end when there was no eccentricity, regardless of anchorage shape. In Equations (1) and (2), P p u is the sum of the forces from the individual tendons, h is the depth of the anchorage device, and e a n c is the eccentricity of the anchorage device.
F b u r s t , A C I = 0.25 P p u ( 1 h a n c h )
d b u r s t , A C I = 0.5 ( h 2 e a n c )
The bearing force was considered in the ACI 318-19 design standard so that the design strength of ϕ P c exceeded the factored pre-stressing force at the anchorage device, P p u . P p u and ϕ P c were then calculated as shown in Equations (3) and (4).
P p u , A C I = γ p ( 0.80 f p u ) A p s
ϕ P c , A C I = 0.85 f c i A p t
where γ p is a load factor of 1.2, 0.80 f p u is a permissible tensile stress in the pre-stressed reinforcement, ϕ is a strength reduction factor, f c i is the specified compressive strength of the concrete at the time of initial pre-stress, and A p t is the area of the bearing plate.
The AASHTO requirements were established based on Burdet’s [11] study, which estimated the bursting forces as shown in Equations (5) and (6). Burdet proposed a bursting force equation that considered the angle and eccentricity of the strands from Mörsch’s equation [10], which was based on elastic stress analysis. In Equations (5) and (6), α is the angle of the strands.
F b s t , A A S H T O = 0.25 P p u ( 1 a h ) + 0.5 P p u s i n α
d b s t , A A S H T O = 0.5 ( h 2 e ) + 5 e s i n α
The AASHTO states that the bearing force should not exceed the coefficient of ultimate strength calculated using Equation (7). The allowable bearing strength of concrete in Equation (7) was determined to be the smaller of the values calculated from Equations (8) and (9).
P r , A A S H T O = Φ f n A b
f n = 0.7 f c i A A g
f n = 2.25 f c i
where ϕ is the resistance factor, f n is the allowable bearing strength of the concrete, A g is the gross area of the bearing plate, A b is the effective net area of the bearing plate (calculated as the area A g minus the area of the openings in the bearing plate), and A is the maximum area of the portion of the supporting surface that is similar to the loaded area and concentric with it, but does not overlap similar areas for adjacent anchorage devices.
The ACI 318-19 and AASHTO codes present the equations for calculating bursting force and bearing force when pre-stressing force is applied as shown in Equations (1)–(9). However, little information is available about a post-tensioned anchorage zone under flexural loading; cracking in fully pre-stressed concrete is not permitted, but on the other hand, in the partially pre-stressed members, the section may be cracked or uncracked depending on the level of the loading and pre-stressing [12]. Furthermore, if a failure occurs in the anchorage zone of post-tensioned concrete members before flexural failure, the member shows brittle fracture behavior. Hence, post-tensioned concrete members should be designed so that a failure of the anchorage zone does not occur until flexural failure. In particular, when unbonded strands are used, the compressive force acting on the anchorage zone increases if a bending moment is applied, causing failure in the anchorage zone.

3. Experimental Section

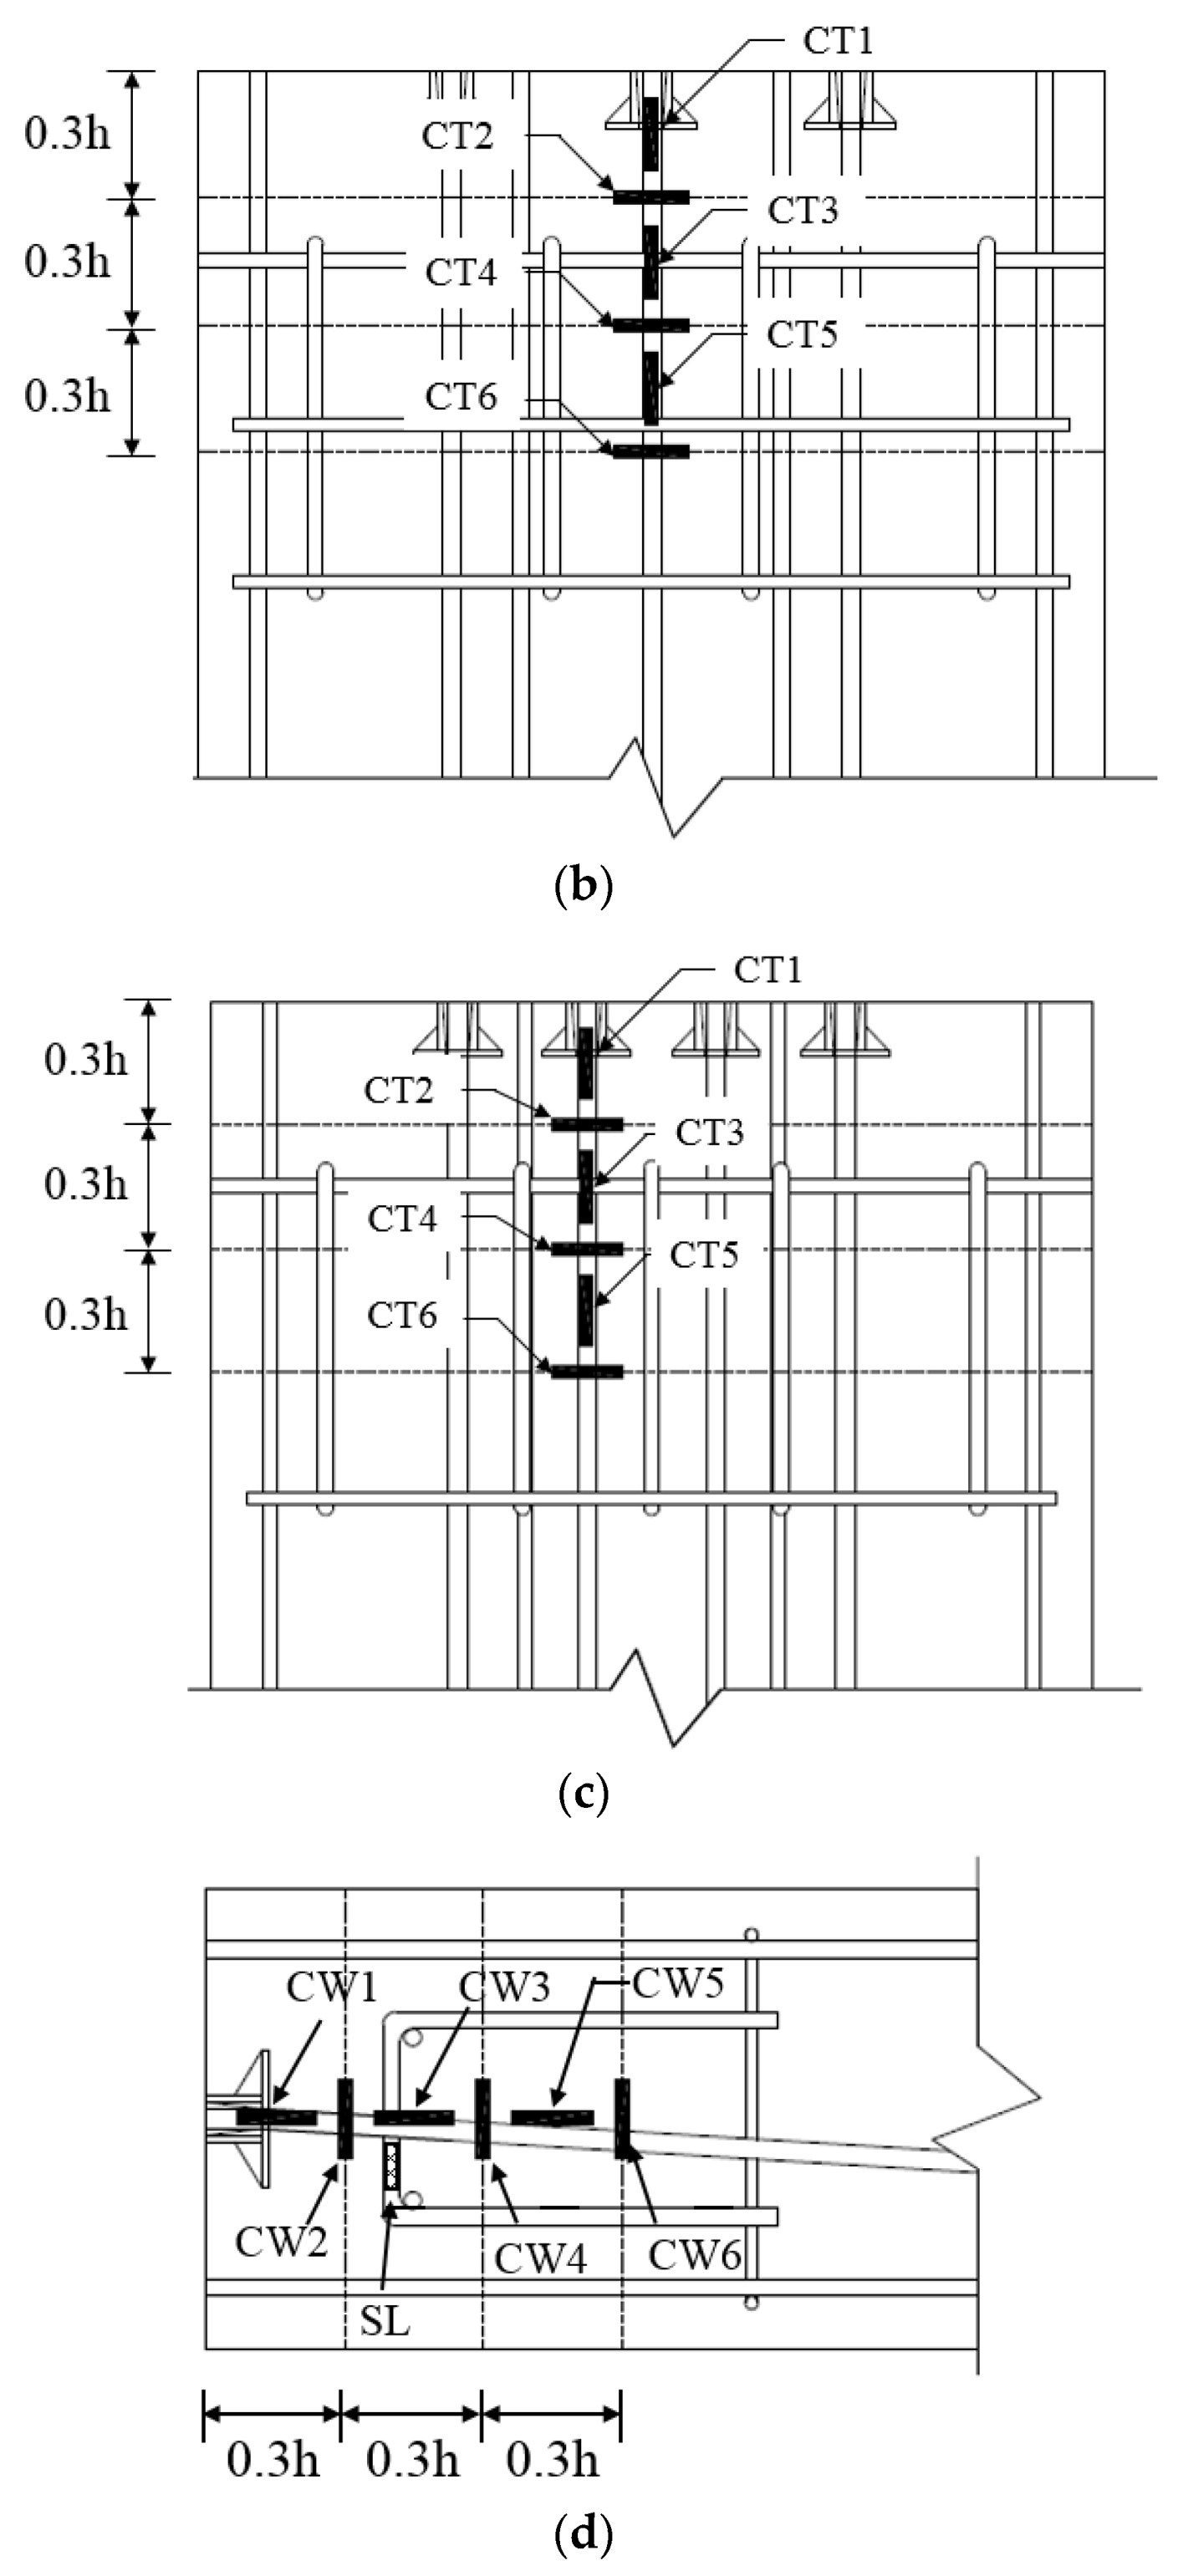
3.1. Specimen Details
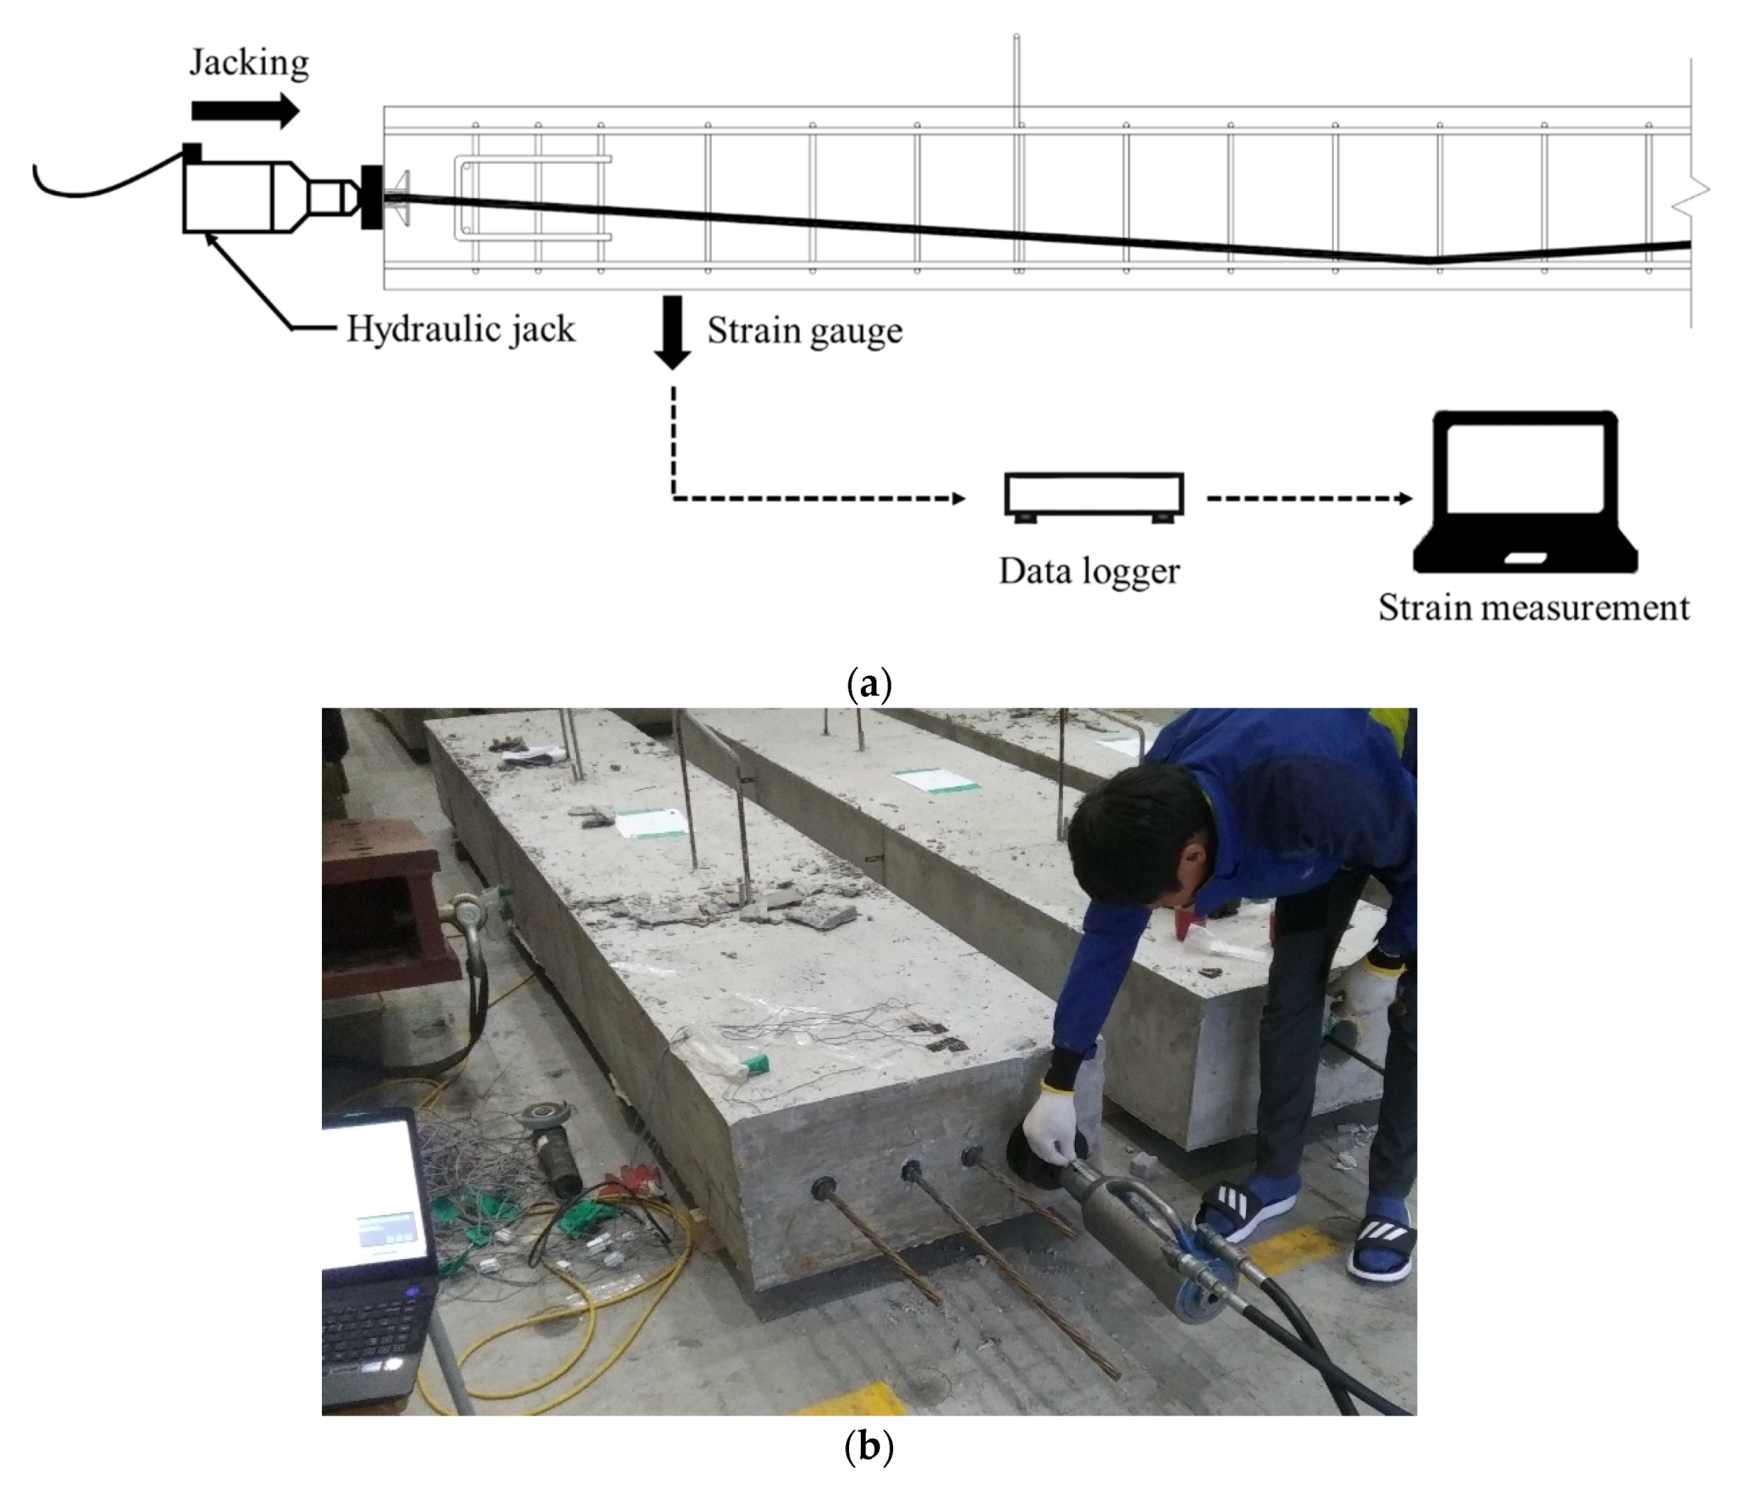
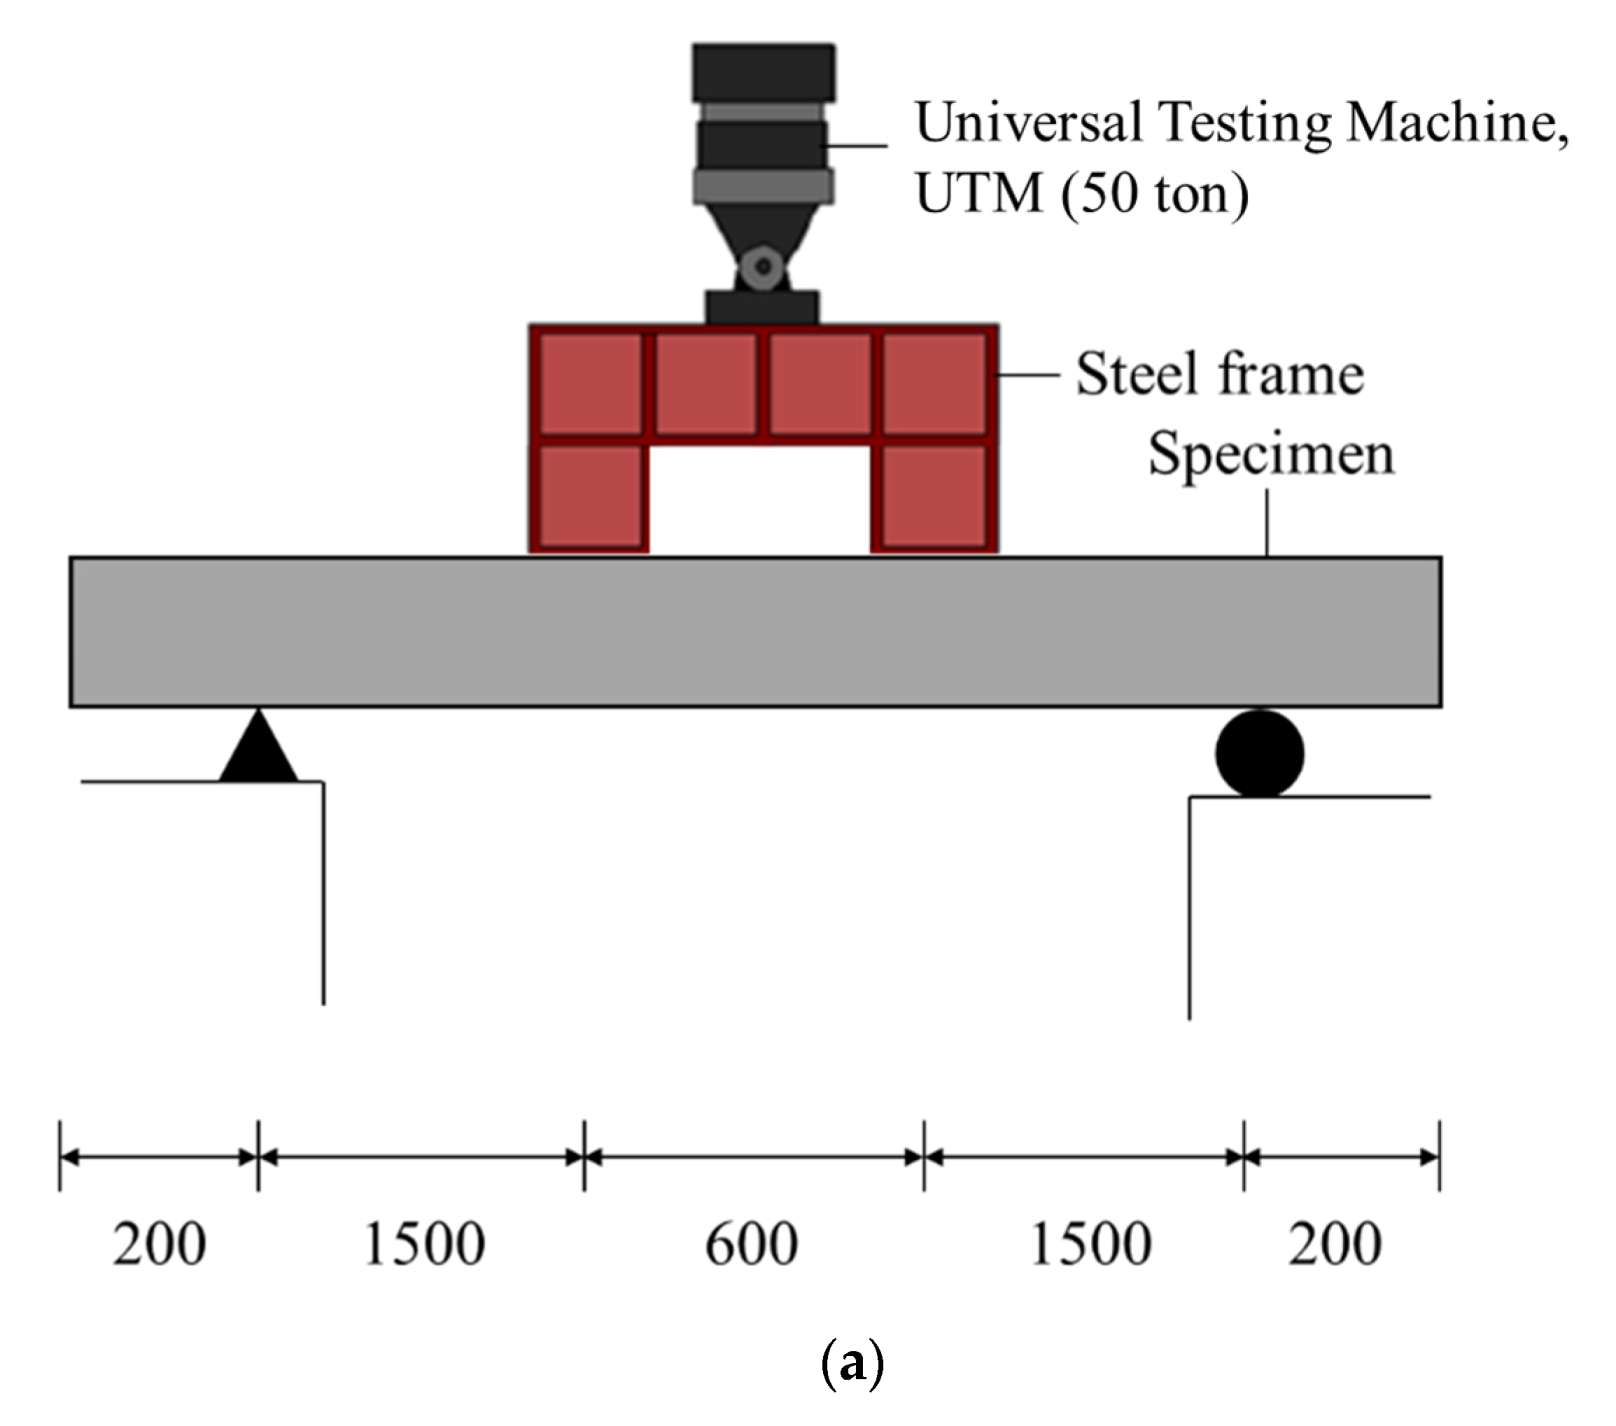
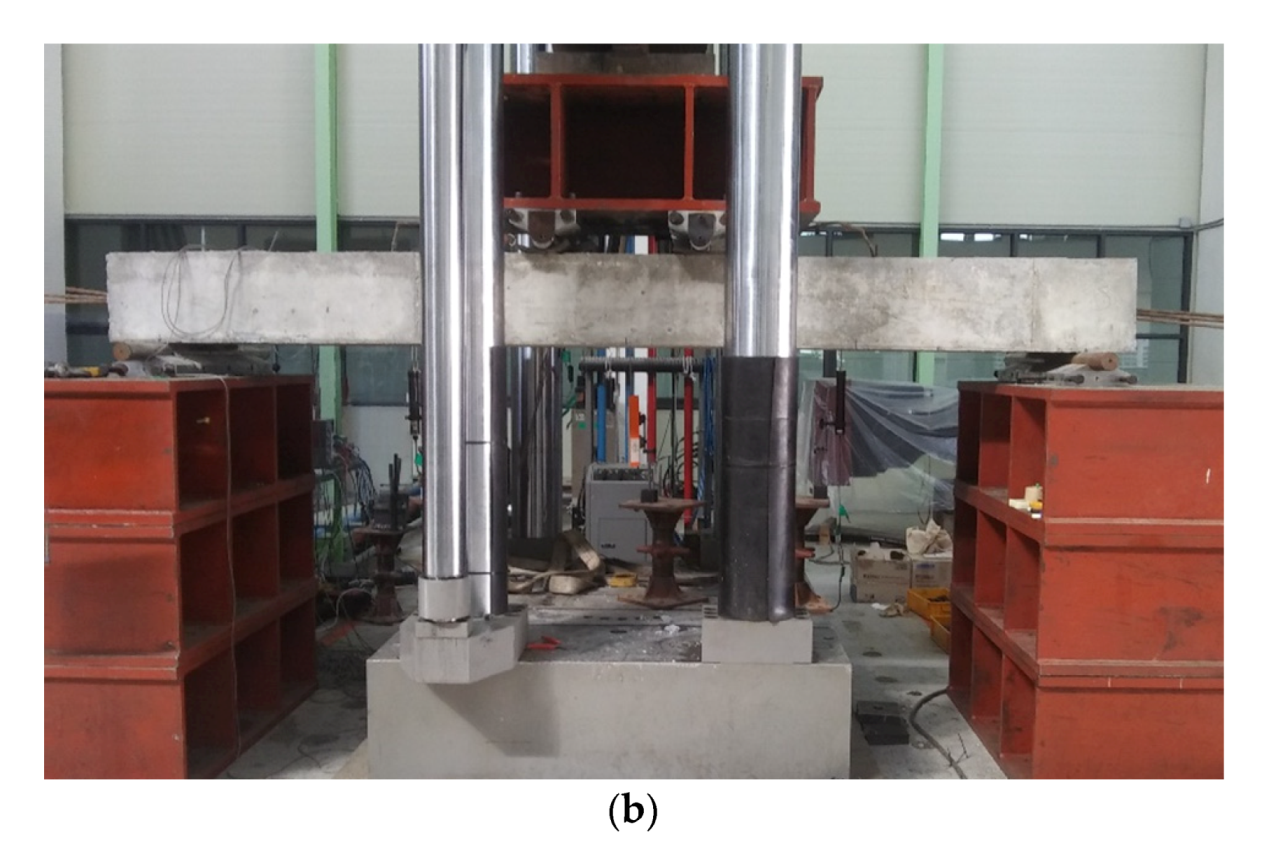
This study analyzed the stress in the anchorage zone of post-tensioned concrete members using unbonded high-strength strands, verified the bursting force and bearing force equations, and also evaluated the methods of design for reinforcing bars in anchorage zone set down in the ACI 318-19 and AASHTO codes. Because many studies have confirmed that the shape of the anchorage affects the bursting force generated in the anchorage zone, this study investigated members with rectangular and circular anchorages. In addition, this study considered the number of strands as a variable to confirm the effect of the number of strands on stress distribution in the entire cross-section. The ACI 318-19 code specifies that the anchorage zone for members using a general shape for the anchorage and mono strand should be reinforced with closed stirrups and a U-shaped hairpin. The test specimens were reinforced by closed stirrups or U-shaped hairpins according to ACI 318-19 requirements.
The dimensions of the specimens were 750 mm × 350 mm × 4000 mm. The compressive strength of the concrete used for fabrication of the specimens was 35 MPa, and the main rebar was a D13 deformed bar with a yield strength of 400 MPa. The ACI 318-19 specifies the use of the minimum bonded reinforcement in a post-tensioned member with unbonded tendons in order to ensure flexural performance. The minimum area of bonded deformed longitudinal reinforcement A s , m i n was calculated by multiplying the area of the cross-section between the flexural tension face and the centroid of the gross section A c t by 0.004. Four tensile rebars and two compressive rebars with yield strengths of 400 MPa and diameters of 13 mm were placed to meet the minimum requirement for bonded reinforcement. To prevent shear failure, minimum shear reinforcement was required when V u was greater than 0.5 V c . The stirrups were designed to use a D10 deformed bar and were arranged with 200 mm spacing according to the minimum shear reinforcement area and maximum spacing of shear reinforcement in ACI 318-19. The number and placement of anchorage zone reinforcements followed the ACI 318-19 requirements. All specimens were pre-stressed with Grade 2400, and had seven wires of 15.2 mm diameter and 138.7 mm2 cross-sectional area. The yield strength of Grade 2400 was 2160 MPa, and the tendon profile was parabolic with 120 mm eccentricities. The details of specimens are summarized in Table 1. Group A classifies the test specimens by anchorage shape, whereas Group B classifies the test specimens according to anchorage zone reinforcement details. Figure 2 shows the notation of the specimens, and Figure 3 shows the details of the specimens.

3.2. Test Setup

To measure the bursting force and bearing force in the anchorage zones, the strain gauges were attached as shown in Figure 4. The strain in the anchorage zone was investigated simultaneously with introduction of pre-stressing force, as shown in Figure 5. The strain gauges for observation of bursting force were CT2, CT4, and CT6, attached to 0.3 h, 0.6 h, and 0.9 h in the transverse direction from the end of the members, respectively. Other concrete gauges were used for bearing force measurement and were attached at 0.15 h, 0.45 h, and 0.75 h in the longitudinal direction of the end of the members. Steel gauges were attached to the legs of the reinforcing bars nearest to the end of the members and were named SL. The pre-stressing force of 266 kN was applied to the specimens when the compressive strength of concrete was 32 MPa. To observe the stress distribution under flexural load, a roller was installed at a point of 200 mm from both ends of the specimens. A two-point loading test was performed with a distance between points of 3600 mm, as shown in Figure 6. The load was applied at a speed of 2 mm/min using a hydraulic Universal Testing Machine (UTM) with a 5000 kN capacity.

4. Experimental Results and Analysis

The stresses generated in the anchorage zone under pre-stressing force were investigated. Table 2 shows the bursting stress when the pre-stressing force was applied. The maximum bursting stress of all specimens occurred at 0.3 h from the end of the specimens, regardless of anchorage shape or anchorage zone reinforcement details. In Group A with variable anchorage shapes, the maximum bursting stresses of RH-2 and CH-2, which had two anchorages, were 0.66 MPa and 0.70 MPa, respectively. The maximum bursting stresses of RH-3 and CH-3, which had three anchorages, and those of RH-4 and CH-4, which had four anchorages, were 1.04 MPa, 1.08 MPa, 1.66 MPa, and 1.72 MPa, respectively. The maximum bursting stresses of the specimens with the circular anchorages were slightly higher than those of the specimens with the rectangular anchorages. However, the difference was approximately 4.5%, so there was no apparent influence on bursting stress according to anchorage shape. With the attached gauge location 0.3 h farther from the end of the specimens, the bursting stresses were 68% and 37% of the maximum bursting stress regardless of anchorage shape. From this observation, it was confirmed that the anchorage shape had no effect on bursting stress distribution in the anchorage zone. The bursting stresses of Group A on the various locations in the specimens are shown in Figure 7. For Group B with anchorage zone reinforcement details as the variable, the maximum bursting stresses of Specimens CS2-3 and CS2-4 reinforced by Type 2 details were the smallest, regardless of the number of anchorages. As shown in Figure 8, the maximum bursting stresses of specimens reinforced with U-shaped hairpins and specimens reinforced with Type 1 details increased by 8.96% and 11.71%, respectively, using two anchorages, and by 4.07% and 6.25% using three anchorages compared with the specimen reinforced by Type 2 details. Although the numbers of reinforcing rebars in the anchorage zones of Group B were the same, it was more effective to place the reinforcing bars up to 0.5 h from the end than to place the reinforcements with equal spacing in the anchorage zone.
The experimental results were compared to the maximum bursting stresses calculated by the current design codes, as shown in Figure 9. The ACI code predicted the maximum bursting stress reasonably well for specimens pre-stressed with two or three strands, while it underestimated the maximum bursting stress by approximately 18% for specimens using four high-strength strands. The AASHTO code overestimated the test results of specimens using two and three strands by an average of 17.3% and 14.1%, respectively, and underestimated the bursting stress of specimens using four strands by approximately 3.9%. This observation implied that the maximum bursting stress occurred 0.3 h from the end in the case of post-tensioned concrete members using high-strength strands; however, the equations in the design standards deal with conventional strands, so the maximum bursting stress was assumed to occur 0.5 h from the end. Additionally, the ACI 318-19 and AASHTO codes do not consider the distribution of bursting stress according to number of tendons, because these design codes calculate the bursting force as the sum of all tensile force applied in members.
The strains due to bearing force when the pre-stressing force was introduced are summarized in Table 3. The maximum strain of all specimens occurred 0.15 h from the end of the members. In Group A, the difference between the bearing force of members with rectangular anchorages and that of those with circular anchorages was 3% when two tendons were applied. The differences in bearing force were 19% and 13% when three and four tendons were applied, respectively. Therefore, the bearing force was greater with rectangular anchorages than with circular anchorages. The strain increased when the number of tendons increased, but the maximum strains of Specimens RH-4 and CH-4 were 0.00135 and 0.0012, respectively, which are smaller than the maximum compressive strain of concrete. In Group B, regardless of the number of anchorages, the strains from the bearing force of Specimens CH-3 and CH-4, which were reinforced by hairpins, were 0.000948 and 0.001195, respectively, and were the smallest. Compared with the specimens that were reinforced with U-shaped hairpins, the strains of specimens that were reinforced by Type 1 and Type 2 details increased by 9.88% and 3.39%, respectively, when two anchorages were applied, and by 15.56% and 2.86% when three anchorages were applied. Therefore, continuous reinforcement with hairpin rebars in the direction of member length was the most effective approach for resisting the bearing force in the anchorage zone. Reinforcement with Type 1 details, which used equally spaced closed stirrups in the anchorage zone, was the worst for resisting the bearing force; resistance decreased as the number of applied tendons increased. Reinforcement with Type 2 details, which used a distance of approximately 0.5 h from the end, showed similar resistance to reinforcement with hairpins as the number of applied tendons increased. The design standards require that the allowable bearing force exceeds the pre-stressing force. The applicability of the methods outlined in the design codes for the design of anchorage zones to resist bearing force when using high-strength strands was evaluated. The allowable bearing force and pre-stressing force according to anchorage shape are shown in Figure 10. For strands with tensile strength of 2400 MPa, the pre-stressing force was equal to 319.6 kN. The allowable bearing forces calculated by the ACI and AASHTO design codes were 224.4 kN and 457.07 kN, respectively, for rectangular anchorages, and 258.5 kN and 529.3 kN for circular anchorages. The allowable bearing force calculated by the ACI design code was smaller than the pre-stressing force regardless of anchorage shape; the compressive strength of the concrete or the bearing plate area should increase when tensile force is applied. However, there were no cracks or failures of concrete from the bearing force, which was smaller than the maximum compressive strain of concrete. The allowable bearing force calculated by the AASHTO design code exceeded approximately 35% of the pre-stressing force. Thus, the post-tensioned concrete members had adequate compressive concrete strength and bearing plate size to resist the pre-stressing force. However, the difference between allowable bearing force and pre-stressing force was quite large. It was inferred that the AASHTO design code is intended for civil structures, and so does not work well for architectural structures, which have smaller members. The ACI design standard considered the bearing plate area when calculating allowable bearing force, while the AASHTO design code assumed that the area where the bearing force is transmitted in the member was larger than the bearing plate area. Therefore, the AASHTO codes calculated a larger allowable bearing force than the ACI code.
In this study, stress distributions were analyzed in the anchorage zone when the ultimate flexural load was applied on a post-tensioned concrete member. The strain was estimated using SL steel gauges, which were attached at the leg of the rebar in the anchorage zone. The concrete gauges CT1 and CT2 are shown in Table 4, where P u is the maximum load on the specimens. The crack patterns and failure aspects after the experiment are shown in Figure 11. In Group A, the concrete strain by bursting force when applying circular anchorages rather than rectangular anchorages decreased by 6.5% when two tendons were applied, and by 74% when four tendons were applied. The concrete strain estimated by bearing force with circular anchorages decreased by 24%, 71%, and 311%, respectively, as the number of strands increased, compared with members using rectangular anchorages. This observation indicates that circular anchorages are more effective than rectangular anchorages at dispersing increasing bearing force and bursting force when flexural load increases. In Group B, there were no obvious tendencies for the strains of concrete and rebar in the anchorage zone according to reinforcement details. However, in Specimen CS1-3, which was reinforced by Type 1 details as shown in Figure 11d, the experiment was terminated because the concrete within the local area was destroyed due to the increase of bearing force. The concrete strain of Specimen CS1-3 was similar to that of Specimen CH-3, which was reinforced by hairpin rebar, but the steel strain of Specimen CS1-3 decreased by 38.3% compared to Specimen CH-3. This is because the distance between the center of the anchorage and the center of the rebar was 195 mm in Specimen CH-3, while that in the case of CS1-3 was 680 mm. Hence, the anchorage reinforcement could not absorb the deformation caused by the stress increase of the concrete in the anchorage zone.

5. Conclusions

In this study, an experiment with ten post-tensioned specimens was performed with the parameters of anchorage shape, number of strands, and details of anchorage zone reinforcement. The stresses generated in the anchorage zone during the introduction of pre-stressing force and under ultimate flexural load were analyzed, and the design methods specified by the design standards were verified. The main conclusions from the study are as follows:
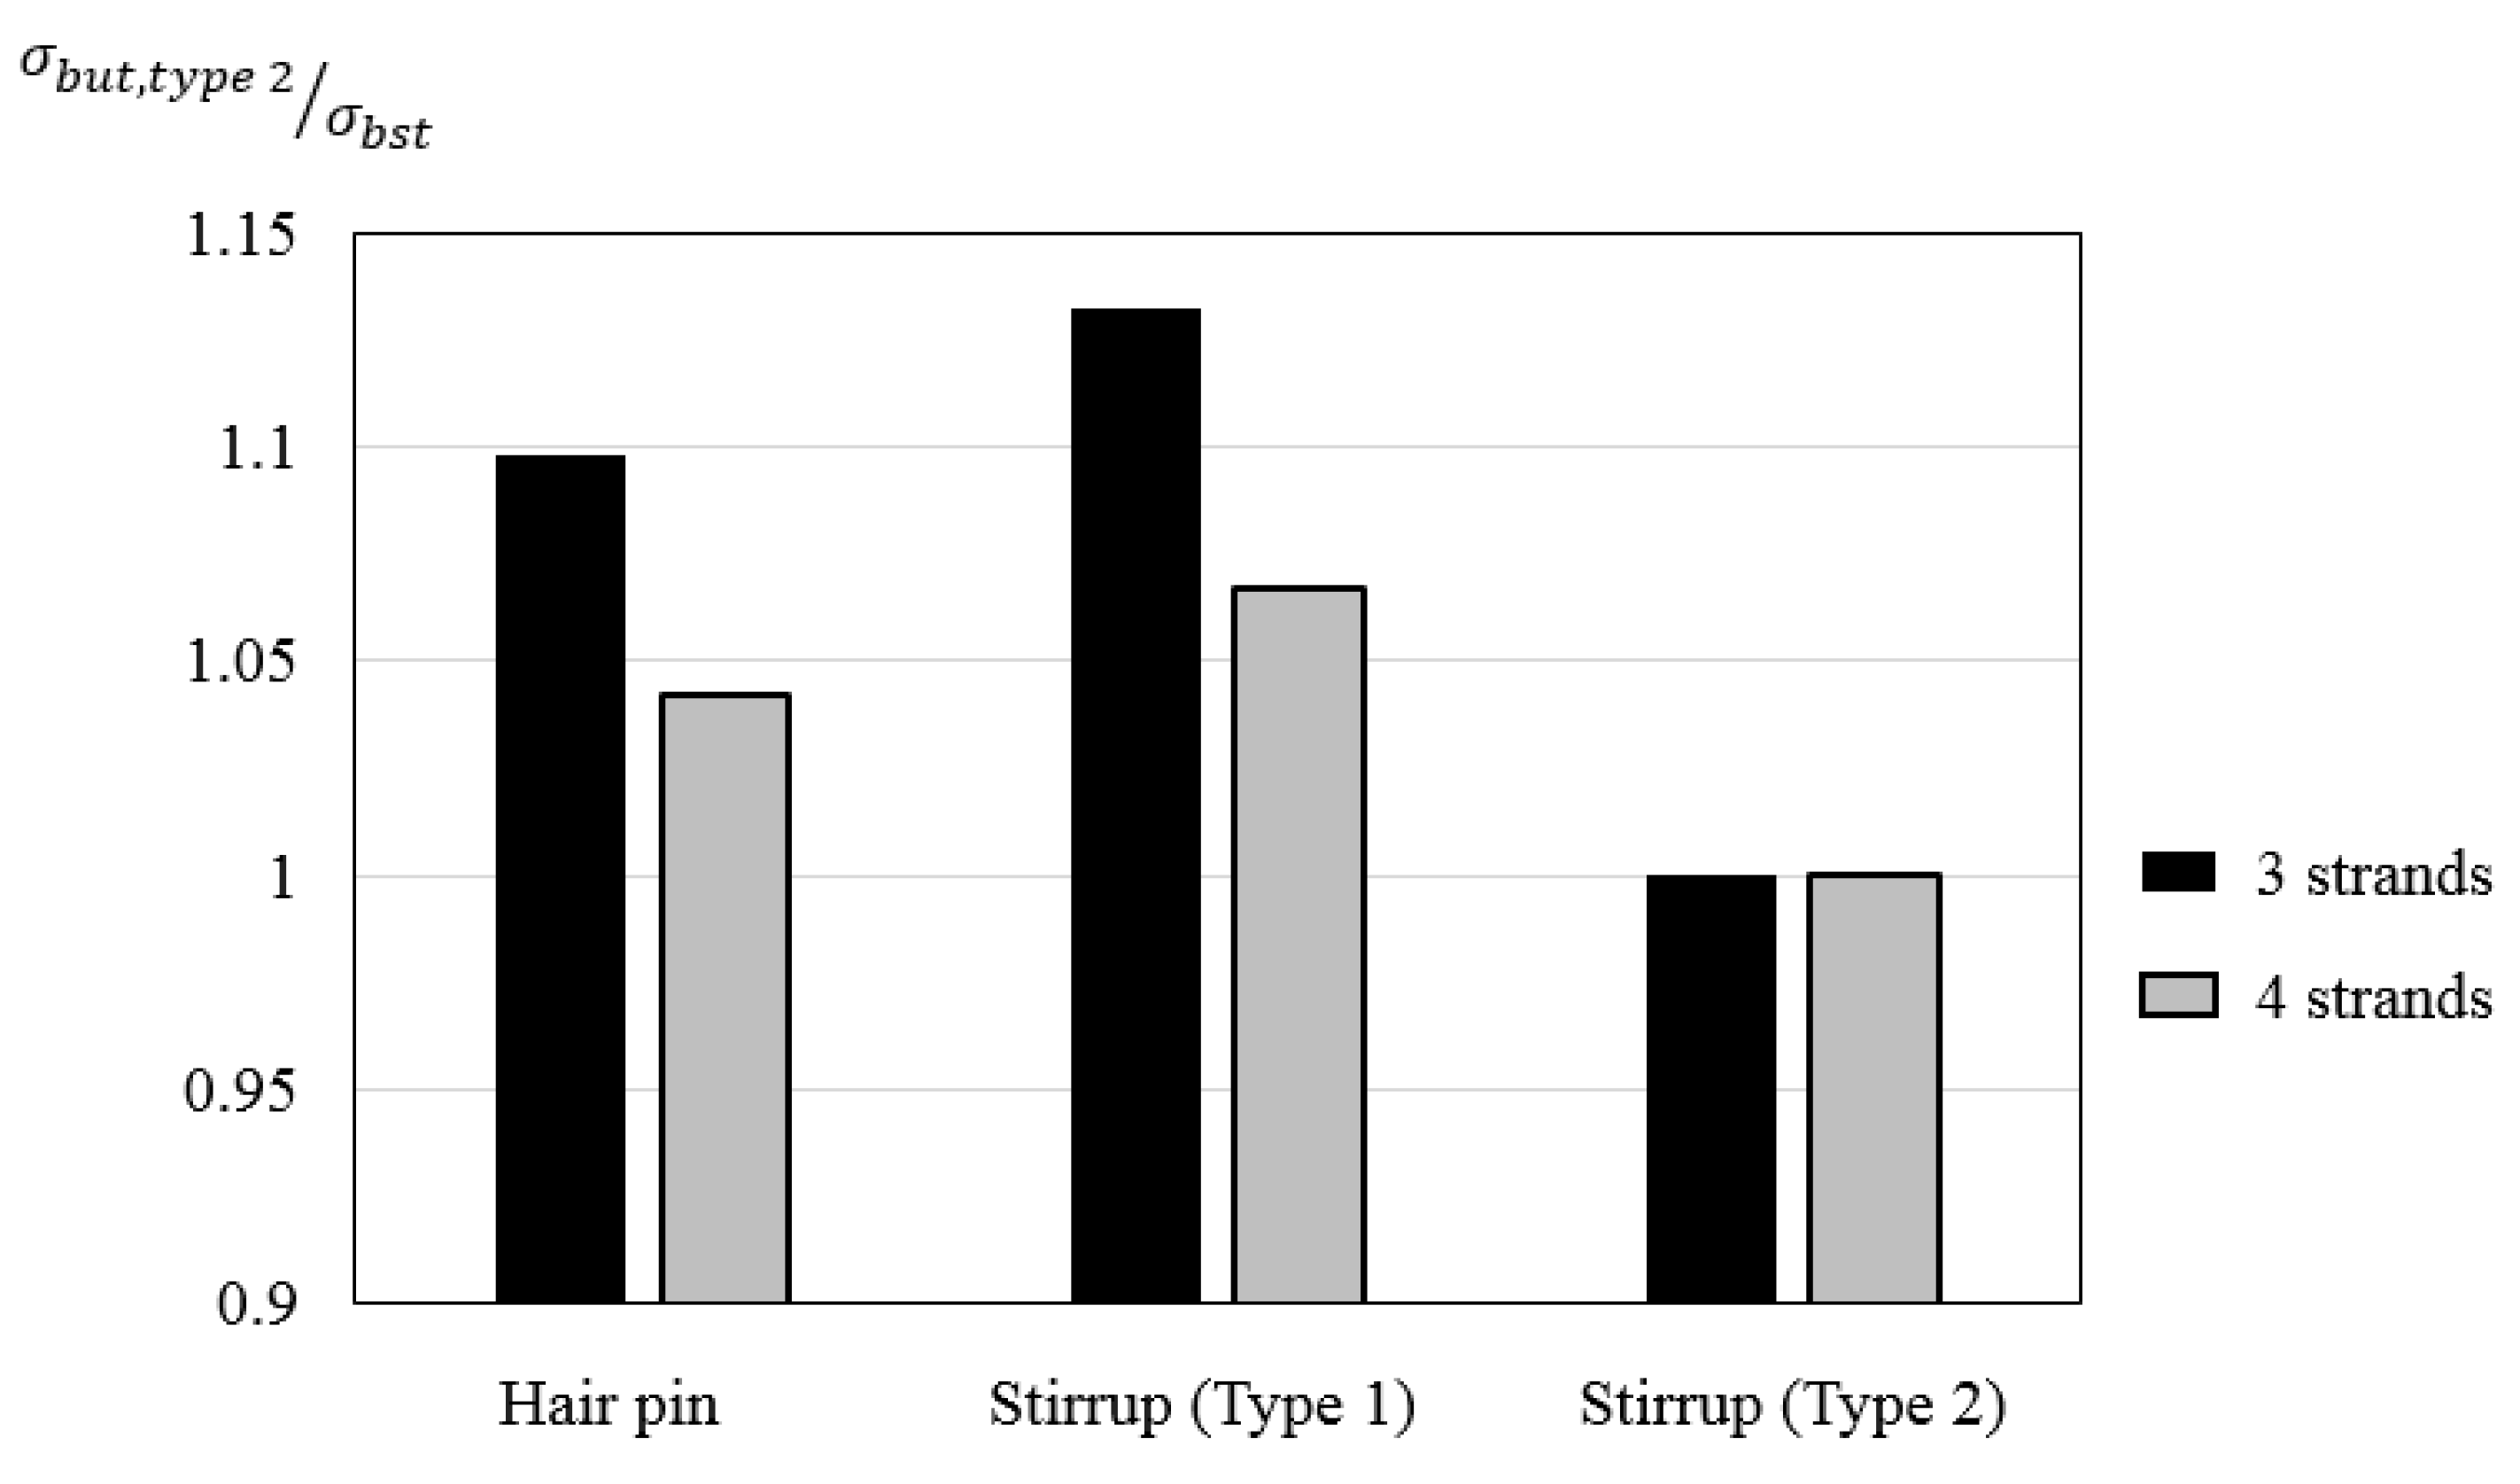
  • The maximum bursting stress occurred at 0.3 h from the end of members, and the distribution aspect of bursting stress in the anchorage zone was similar regardless of anchorage shape when the pre-stressing force was introduced. The design standards assumed that the maximum bursting force occurs at 0.5 h; in addition, the bursting force was estimated as the summation of the tensile forces without considering the offsetting of the bursting stress due to an increased number of strands.
  • The strain due to the bearing force of a member with circular anchorages was 12% smaller than that of a member with rectangular anchorages because the circular anchorage efficiently distributed the bearing force when the pre-stressing force was introduced. As the number of strands increased, the strain due to bearing force increased proportionally. The hairpin reinforcement resisted the bearing force most effectively. The transverse spacing of the stirrups was the main variable in resisting the bearing force when reinforcement used closed stirrups.
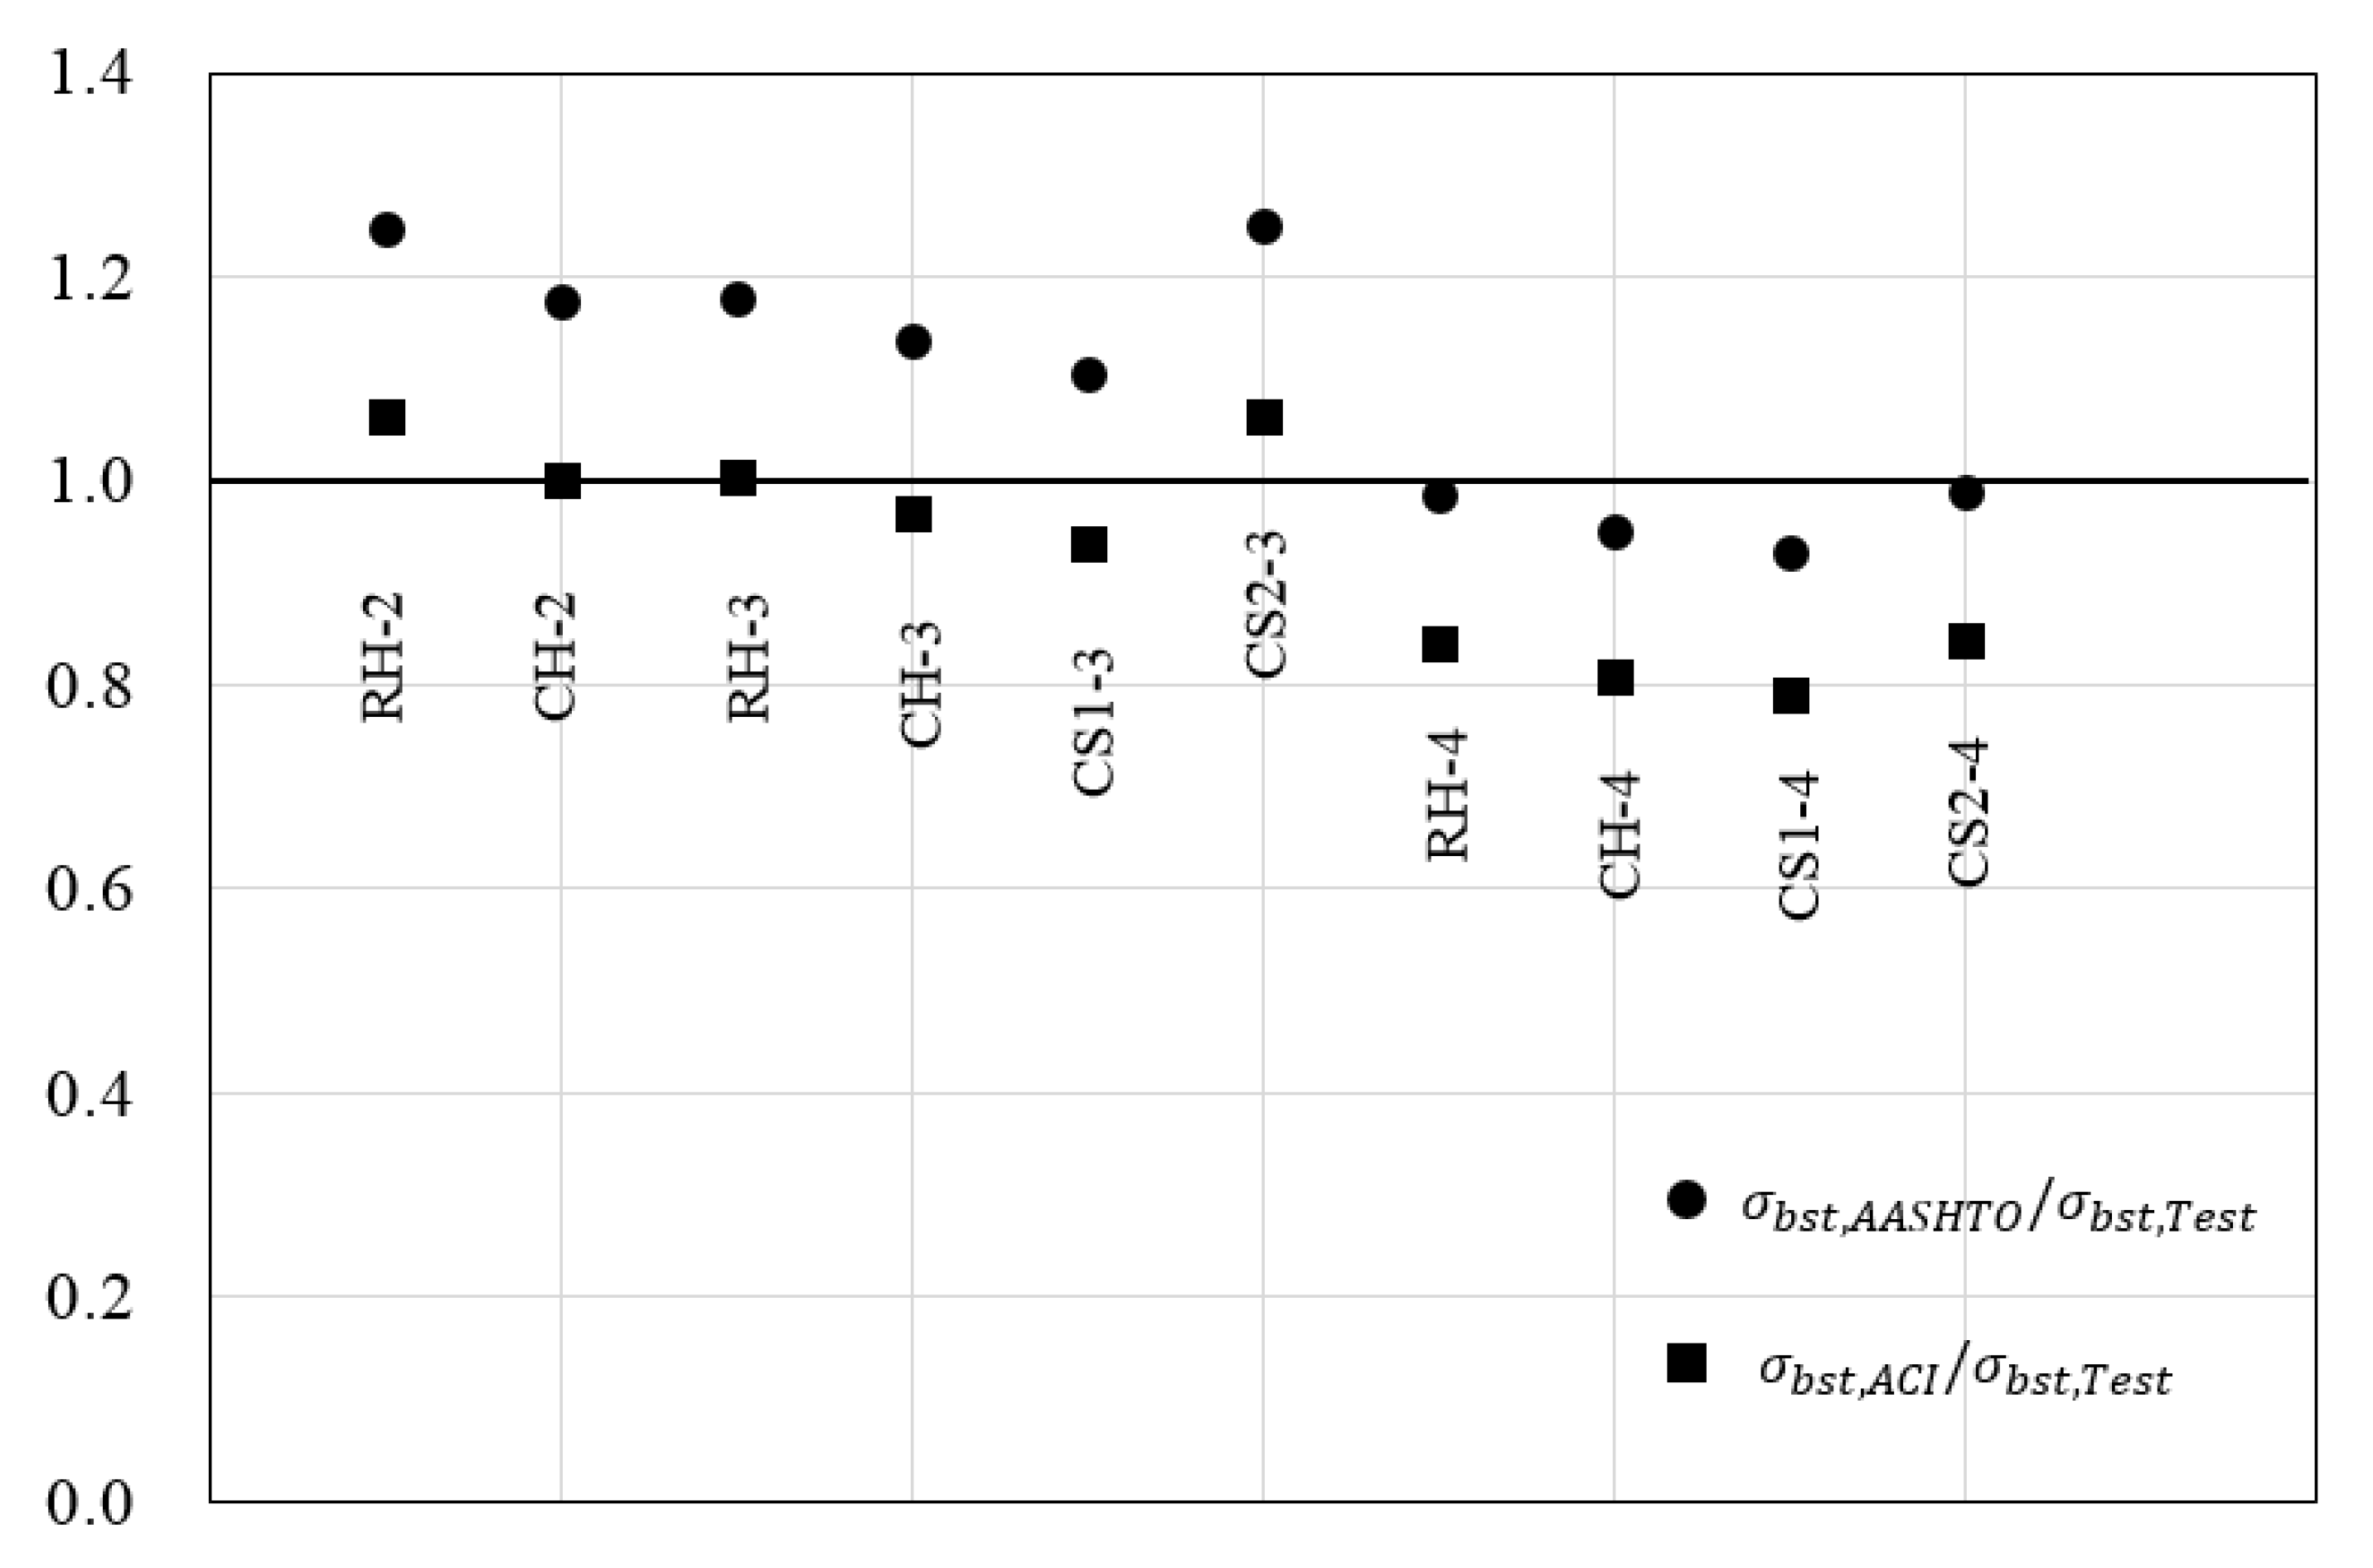
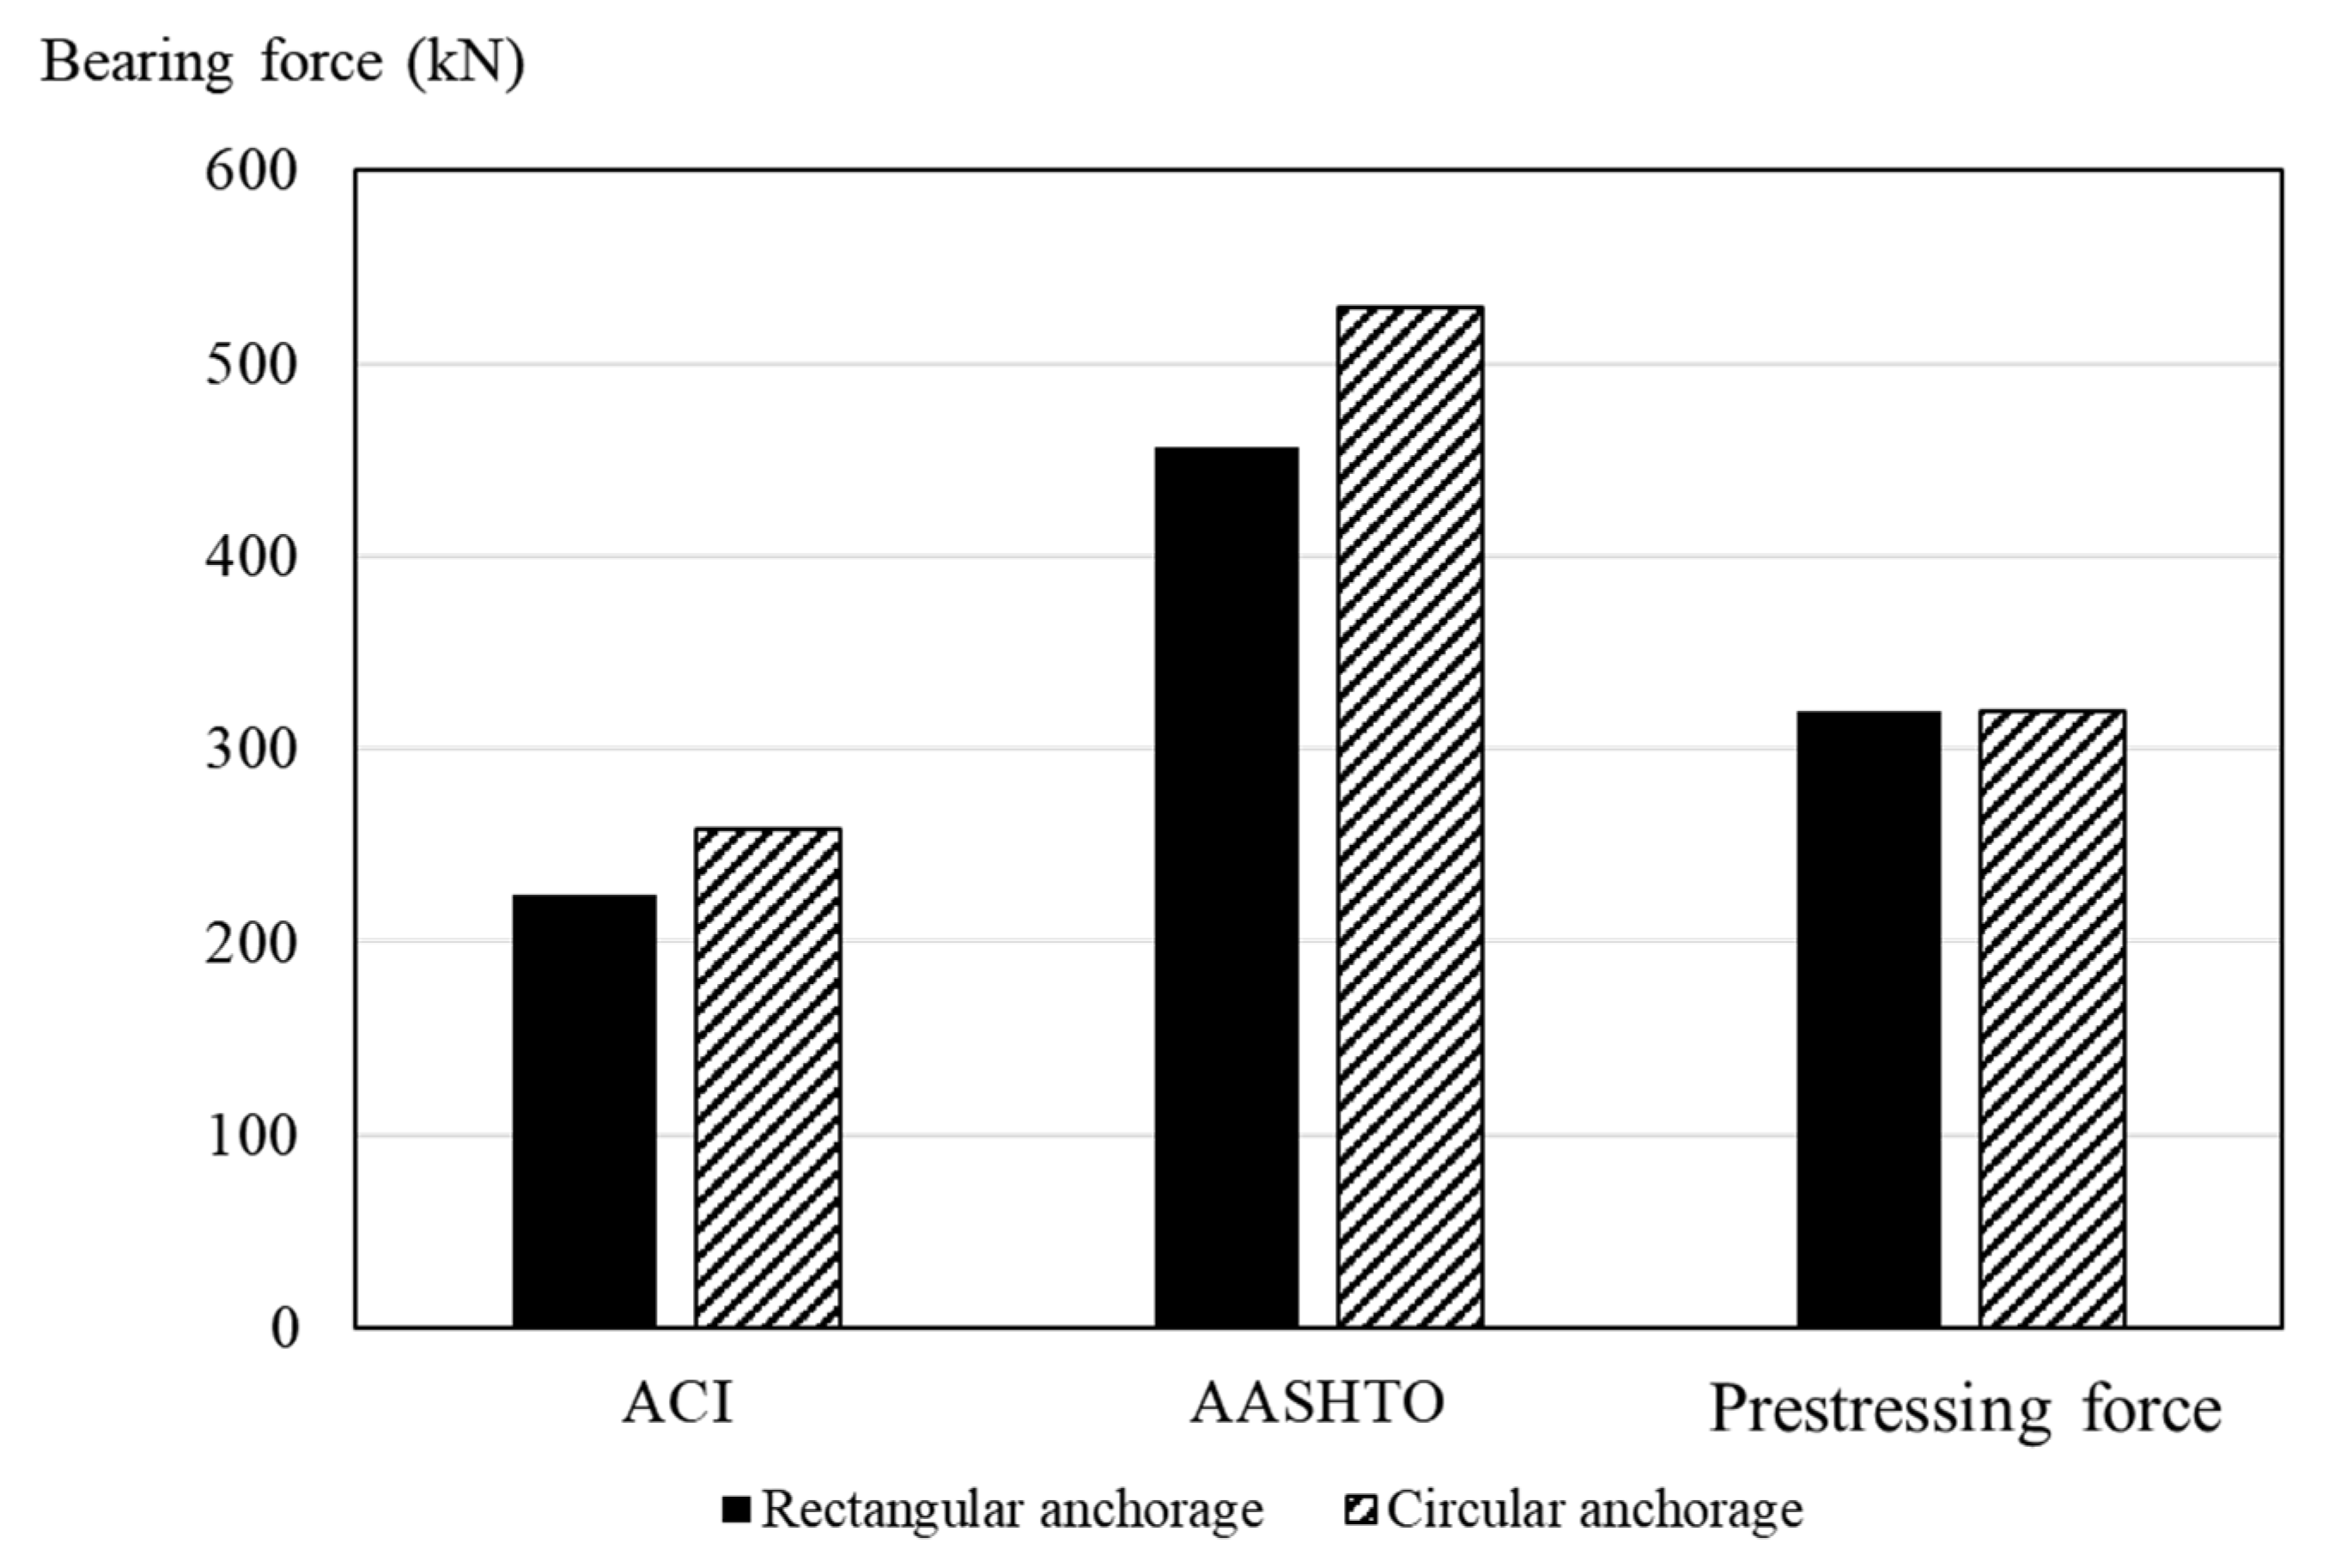
  • The allowable bearing forces calculated by the ACI and AASHTO codes were about 241 kN and 493 kN, respectively, when pre-stressing force was introduced by 320 kN. The ACI code estimated the allowable bearing force to be smaller than the pre-stressing force regardless of anchorage shape. However, the experimental results showed that cracking and failure of the concrete did not occur due to failure to reach the maximum compressive strain. The AASHTO code estimated the allowable bearing force to be approximately 1.5 times the pre-stressing force; this is not suitable for building structures, which have members that are relatively small compared to civil structures.
  • The results of the flexural experiment confirmed that additional stress occurred in the anchorage zone as the flexural load increased, which may have been caused by a failure of the anchorage zone; in addition, the circular anchorages were more effective than rectangular anchorages at dispersing increasing bursting and bearing force when flexural load was applied. The concrete strain estimated by bursting force and bearing force was smaller by 40% and 203% on average when applying circular anchorages rather than rectangular anchorages. The anchorage reinforcement designed using current codes could not resist the increased stress. Therefore, design standards should consider a method for anchorage zone reinforcement under ultimate flexural load.

Author Contributions

K.M.R. conceived the study concepts, designed and carried the experiment, analyzed the experimental results, and took charge of the entire manuscript; M.S.K. and Y.H.L. assisted with the integrity of the entire study, provided the crucial intellectual support, and revised the manuscript. All authors have read and agreed to the published version of the manuscript.

Funding

This work was supported by the National Research Foundation of Korea (NRF) grant funded by the Korean government (MSIT) (No. 2020R1A2C2009351).

Conflicts of Interest

The authors declare no conflict of interest.

References

  1. ACI Committee 318. Building Code Requirements for Reinforced Concrete and Commentary (ACI 318-19); American Concrete Institute: Farmington Hills, MI, USA, 2019; p. 623. [Google Scholar]
  2. AASHTO. Standard Specifications for Highway Bridges; Transportation Officials: Washington, DC, USA, 2015. [Google Scholar]
  3. Yun, Y.M. Evaluation of ultimate strength of post-tensioned anchorage zones. J. Adv. Concr. Technol. 2005, 3, 149–159. [Google Scholar] [CrossRef]
  4. He, Z.Q.; Liu, Z. Investigation of bursting forces in anchorage zones: Compression-dispersion models and unified design equation. J. Bridge Eng. 2010, 16, 820–827. [Google Scholar] [CrossRef]
  5. Zhou, L.Y.; Liu, Z.; He, Z.Q. Further investigation of transverse stresses and bursting forces in post-tensioned anchorage zones. Struct. Concr. 2015, 16, 84–92. [Google Scholar] [CrossRef]
  6. Sahoo, D.K.; Singh, B.; Bhargava, P. Investigation of Dispersion of Compression in Bottle-Shaped Struts. ACI Struct. J. 2009, 106, 178–186. [Google Scholar]
  7. Axson, D.P. Ultimate Bearing Strength of Post-Tensioned Local Anchorage Zones in Lightweight Concrete. Ph.D. Thesis, Virginia Tech, Blacksburg, VA, USA, 2008. [Google Scholar]
  8. Cervenka, V.; Ganz, H.R. Validation of post-tensioning anchorage zones by laboratory testing and numerical simulation. Struct. Concr. 2014, 15, 258–268. [Google Scholar] [CrossRef]
  9. Noble, D.; Nogal, M.; O’Connor, A.; Pakrashi, V. The effect of prestress force magnitude and eccentricity on the natural bending frequencies of uncracked prestressed concrete beams. J. Sound Vib. 2016, 365, 22–44. [Google Scholar] [CrossRef] [Green Version]
  10. Mörsch, E. Über die berechnung der gelenkquader. Beton-und-Eisen 1924, 12, 156–161. [Google Scholar]
  11. Burdet, O. Analysis and Design of Anchorage Zones for Post-Tensioned Concrete Bridges. Ph.D. Thesis, The University of Texas at Austin, Austin, TX, USA, 1990. [Google Scholar]
  12. Karayannis, C.G.; Chalioris, C.E. Design of partially prestressed concrete beams based on the cracking control provisions. Eng. Struct. 2013, 48, 402–416. [Google Scholar] [CrossRef]
Figure 1. Stress distribution at the anchorage zone in a post-tensioned member.
Applsci 10 03039 g001
Figure 2. Notations of specimens.
Applsci 10 03039 g002
Figure 3. Details of specimens(mm): (a) shape of anchorage; (b) top view of RH-2 and CH-2; (c) top view of RH-3 and CH-3; (d) top view of RH-4 and CH-4; (e) side view of specimens reinforced with hair pins; (f) side view of specimens reinforced with Type 1 stirrups; (g) side view of specimens reinforced with Type 2 stirrups.
Applsci 10 03039 g003aApplsci 10 03039 g003bApplsci 10 03039 g003cApplsci 10 03039 g003d
Figure 4. Locations of gauges: (a) specimens with two anchorages; (b) specimens with three anchorages; (c) specimens with four anchorages; (d) side view of specimens.
Applsci 10 03039 g004aApplsci 10 03039 g004b
Figure 5. Test setup at the jacking stage: (a) schematic test setup; (b) photograph of test setup.
Applsci 10 03039 g005
Figure 6. Test setup for two-point loading: (a) Schematic test setup; (b) Photograph of test setup.
Applsci 10 03039 g006aApplsci 10 03039 g006b
Figure 7. Bursting stresses on the various locations in the specimens.
Applsci 10 03039 g007
Figure 8. Comparison of bursting stresses.
Applsci 10 03039 g008
Figure 9. Comparison of bursting stresses from design code and test results.
Applsci 10 03039 g009
Figure 10. Comparisons of bearing force to design code.
Applsci 10 03039 g010
Figure 11. Cracking and failure of specimens (a) RH-4; (b) CH-4; (c) CH-3; (d) CS1-3; (e) CS2-3.
Applsci 10 03039 g011aApplsci 10 03039 g011b
Table 1. Details of experimental specimens.
GroupNoSpecimen f c
(MPa)
f y
(MPa)
f p u
(MPa)
Anchorage ShapeEAe
mm
Anchorage Zone Reinforcement
A1RH-2354002400Rectangular2120Hairpin
2CH-2Circular2
3RH-3Rectangular3
4CH-3Circular3
5RH-4Rectangular4
6CH-4Circular4
B-CH-3Circular3Hairpin
7CS1-33Stirrup (Type1)
8CS2-33Stirrup (Type2)
-RH-44Hairpin
9CS1-44Stirrup (Type1)
10CS2-44Stirrup (Type2)
f c : compressive strength, f y : yield strength, f p u : tensile strength of strand, e: eccentricity of strand.
Table 2. Bursting stress at jacking force.
GroupNoSpecimenBursting Stress (MPa)
Experimental ResultsACIAASHTO
Top ViewSide View
0.3 h0.6 h0.9 h0.3 h0.6 h0.9 h0.5 h0.5 h
A1RH-20.660.430.190.520.410.110.690.82
2CH-20.700.450.180.620.370.14
3RH-31.040.730.480.780.600.421.041.22
4CH-31.080.770.410.890.700.45
5RH-41.661.120.601.270.830.591.391.63
6CH-41.721.160.741.380.910.63
B-CH-31.080.770.410.890.700.451.041.22
7CS1-31.110.580.300.820.530.32
8CS2-30.980.450.270.840.470.30
-CH-41.721.160.741.380.910.631.391.63
9CS1-41.760.820.411.260.720.38
10CS2-41.650.590.341.080.630.19
Table 3. Bearing strain at jacking force.
GroupNoSpecimen Bearing Strain ( 10 6 )
Top ViewSide View
0.15 h0.45 h0.75 h0.15 h0.45 h0.75 h
A1RH-2746.48113.7624.88592.25135.0721.90
2CH-2726.50113.7318.96587.70106.6410.81
3RH-31132.68189.5841.00691.90180.1033.85
4CH-3947.88163.5836.78618.45172.5130.33
5RH-41350.70547.3871.10921.50300.9368.27
6CH-41195.00537.9359.72870.85372.0354.10
B-CH-3947.88163.5836.78618.45172.5130.33
7CS1-31051.78189.6057.35703.76143.1214.93
8CS2-3921.10150.9442.45633.96223.5925.10
-CH-41195.00537.9359.72870.85372.0354.10
9CS1-41415.15456.6026.42959.43428.3049.24
10CS2-41230.19518.8753.58904.16299.0625.47
Table 4. Strain of reinforcement steel and concrete in the anchorage zone.
GroupNoSpecimen P u (kN) Strain ( 10 6 )
SteelConcrete
SL GaugeCT1 GaugeCT2 Gauge
A1RH-2322.68−9020−46
2CH-2287.21−4615.2−43
3RH-3430.16−191136−13
4CH-3420.84−14939N/A
5RH-4461.89−6174−134
6CH-4482.63−10718−35
B-CH-3420.84−14939−103
7CS1-3438.95−9234−26
8CS2-3443.96−2925−45
-CH-4482.63−10718−35
9CS1-4504.05−27627−44
10CS2-4497.31N/A10−25

