Article

Performance Evaluation of Enhanced Bioretention Systems in Removing Dissolved Nutrients in Stormwater Runoff

1
College of Civil Engineering, Nanjing Forestry University, Nanjing 210037, Jiangsu, China
2
Nanjing Municipal Design and Research Institute, Nanjing 210008, Jiangsu, China
3
Faculty of Built Environment, University of New South Wales, Sydney, NSW 2052, Australia
*
Author to whom correspondence should be addressed.
Appl. Sci. 2020, 10(9), 3148; https://doi.org/10.3390/app10093148
Submission received: 10 April 2020 / Revised: 25 April 2020 / Accepted: 27 April 2020 / Published: 30 April 2020
(This article belongs to the Section Civil Engineering)

Abstract

:
Bioretention has great potential in managing and purifying urban stormwater runoff. However, information regarding the removal of nutrients in bioretention systems with the use of media, plants, and saturated areas is still limited. In this study, three devices of control, conventional bioretention (DS), and strengthened bioretention (SZ) were investigated to enhance the simultaneous removal of nitrogen and phosphorus. The experimental column SZ showed the best performance for total phosphorus (TP), ammonia (NH4+-N) and total nitrogen (TN) removal (85.6–92.4%, 83.1–92.7%, 57.1–74.1%, respectively), whereas DS columns performed poorly for NH4+-N removal (43.6–81.2%) under different conditions. For the removal of nitrate, the columns of Control and DS exhibited negative performance (−14.3% and −8.2%) in a typical event. Further evaluation of water quality revealed that in the early stages of rainfall, the effluent of the SZ column was able to reach quality standards of Grade IV for surface water in China. Moreover, although the ion-exchange and phosphate precipitation occurred on the surface of the media, which were placed in the saturation zone, it did not change the surface crystal structure.

Graphical Abstract

1. Introduction

With the growth of urbanization, natural green spaces have been gradually replaced by impervious pavements, resulting in reduced nitrogen retention capacity in many urban areas [1,2,3]. Urban rainfall-runoff often carries high concentrations of nitrogen, phosphorus, nutrients, organic pollutants, and heavy metals [4,5,6]. Studies have shown that half of the nitrogen pollutants in urban rivers come from surface runoff formed during urban rainfall and the concentrations of metal elements in some runoff can exceed more than ten times the limitations for surface water quality [7,8]. Nitrogen, heavy metals, and phosphorus present in the surface runoff lead to the functional degradation of about two-thirds of urban rivers, and the pollutants discharged from this surface runoff present a serious threat to the urban water system [9,10,11,12]. In order to control the amount of nitrogen chemical oxygen demand (COD) and phosphorus in stormwater runoff and prevent the further deterioration of the urban water ecosystem, decentralized management of rainwater becomes critically important [13]. Many countries have adopted different rainwater management systems based on the existing urban structure, such as the Low Impact Development and Best Management Practice (BMP) in the United States, the Water Sensitive Urban Design in Australia, and the Sponge City Concept in China [14,15].
Sponge city manages natural accumulation, infiltration, and purification of rainwater through the combination of natural and artificial facilities and releases rainwater when water is scarce, thus forming a good network of natural circulation. The occurrence of urban stormwater runoff is random and intermittent. Pollution sources are widely distributed and dispersed, and the concentration of the pollutants varies greatly. Thus, one of the keys to solving the problem of urban stormwater pollution is to understand how to collect, purify, and store urban stormwater efficiently [16]. Green infrastructure is considered as one of the BMPs for non-point source pollution, such as rainwater [17]. Among the various green infrastructures, the bioretention system has a strong capacity for runoff saturation and water purification. It has gradually become an essential means of ecological control of stormwater runoff [18,19,20]. The bioretention system has a multi-layer structure, which can maximize the functions of water-saturated utilization, and evapotranspiration. It involves complex physical, chemical, and biological processes.
One of the technical problems in the bioretention system is the removal of nitrogen. The main reason is that the dissolved nitrogen, such as nitrite and nitrate, has high solubility and low adsorption capacity, while nitrogen removal is mainly carried out through plant absorption [21], negative charge adsorption in the soil medium [22], and microbial nitrification-denitrification process [23]. Due to the reoxygenation and the oxygen supply of plant roots, the surface layer of the bioretention system provides an excellent aerobic environment for the nitrifying bacteria and ammoniating bacteria, which promotes nitrification and ammoniation, respectively. The NO3-N formed by the nitrification reaction and NO3-N in the road runoff are partially absorbed by plants, while the other parts are denitrified to produce N2 in an anaerobic environment and removed in the bioretention device [24]. Studies have confirmed that the mechanism of nitrogen removal by plants is different under saturated and unsaturated conditions of the bioconservation system [25,26]. The phosphorus content in the road runoff is mainly divided into particulate phosphorus (PP) and dissolved phosphorus (DP). The PP can be removed by physical methods, such as precipitation and filtration [27]. DP is mostly found in the stormwater runoff, and its primary removal mechanism involves biological utilization, adsorption, and precipitation [28,29]. Although biological methods such as phytoremediation and phosphorus accumulation are widely used, phosphorus absorbed during plant growth will be reabsorbed by the soil through defoliation, and thus phosphorus removal in the bioretention system mainly depends on the media adsorption and chemical precipitation of the metal salts. The adsorption process takes place quickly. Both electrostatic interaction and ion exchange are reversible processes, which occur on the surface of the media [30]. Compared to the adsorption reaction, the precipitation process is relatively slow and may take several hours [28]. Therefore, fast adsorption is an important technique to remove the phosphorus when the runoff flows through the infiltration medium layer. In the rainstorm runoff, the process of dissolution of phosphorus is random and variable. Proper selection of the media layer is the key to improve phosphorus removal. However, only a few published reports have examined the combined mechanism of removal of pollutants using plants, media, and saturated zones in bioretention systems under different conditions [31,32,33]. While higher removal efficiency in bioretention systems provides numerous benefits in urban stormwater management, the impact of bioretention systems on water quality in the groundwater environment cannot be ignored.
The aim of this study is to examine the ecological purification mechanism of stormwater runoff in the bioretention system by employing different coupling systems using plants, media, and saturated areas. This was achieved through the following steps: (a) the Chicago model was used to simulate three different intensities of the storm runoff and to evaluate the removal of nitrogen and phosphorus by three systems; (b) the removal effects of NH4+-N, NO3-N, total nitrogen (TN), and total phosphorus (TP) were stimulated by three systems under different wet-dry cycles, rainfall intensities, and concentrations; (c) fuzzy mathematics was used to evaluate the effluent quality of bioretention systems in regular rainfall events; and, (d) static adsorption, scanning electron microscope (SEM), energy-dispersive X-ray spectroscopy (EDS), and X-ray diffraction (XRD) were combined to determine the pollutant removal mechanisms of different combinations of the bioretention system. On this basis, an optimization strategy is proposed for the simultaneous removal of nitrogen and phosphorus in the bioretention system. The results provide a reliable and scientific reference for improving the performance of the bioretention system and removing organic matter, nitrogen, and phosphorus from the initial road runoff.

2. Materials and Methods

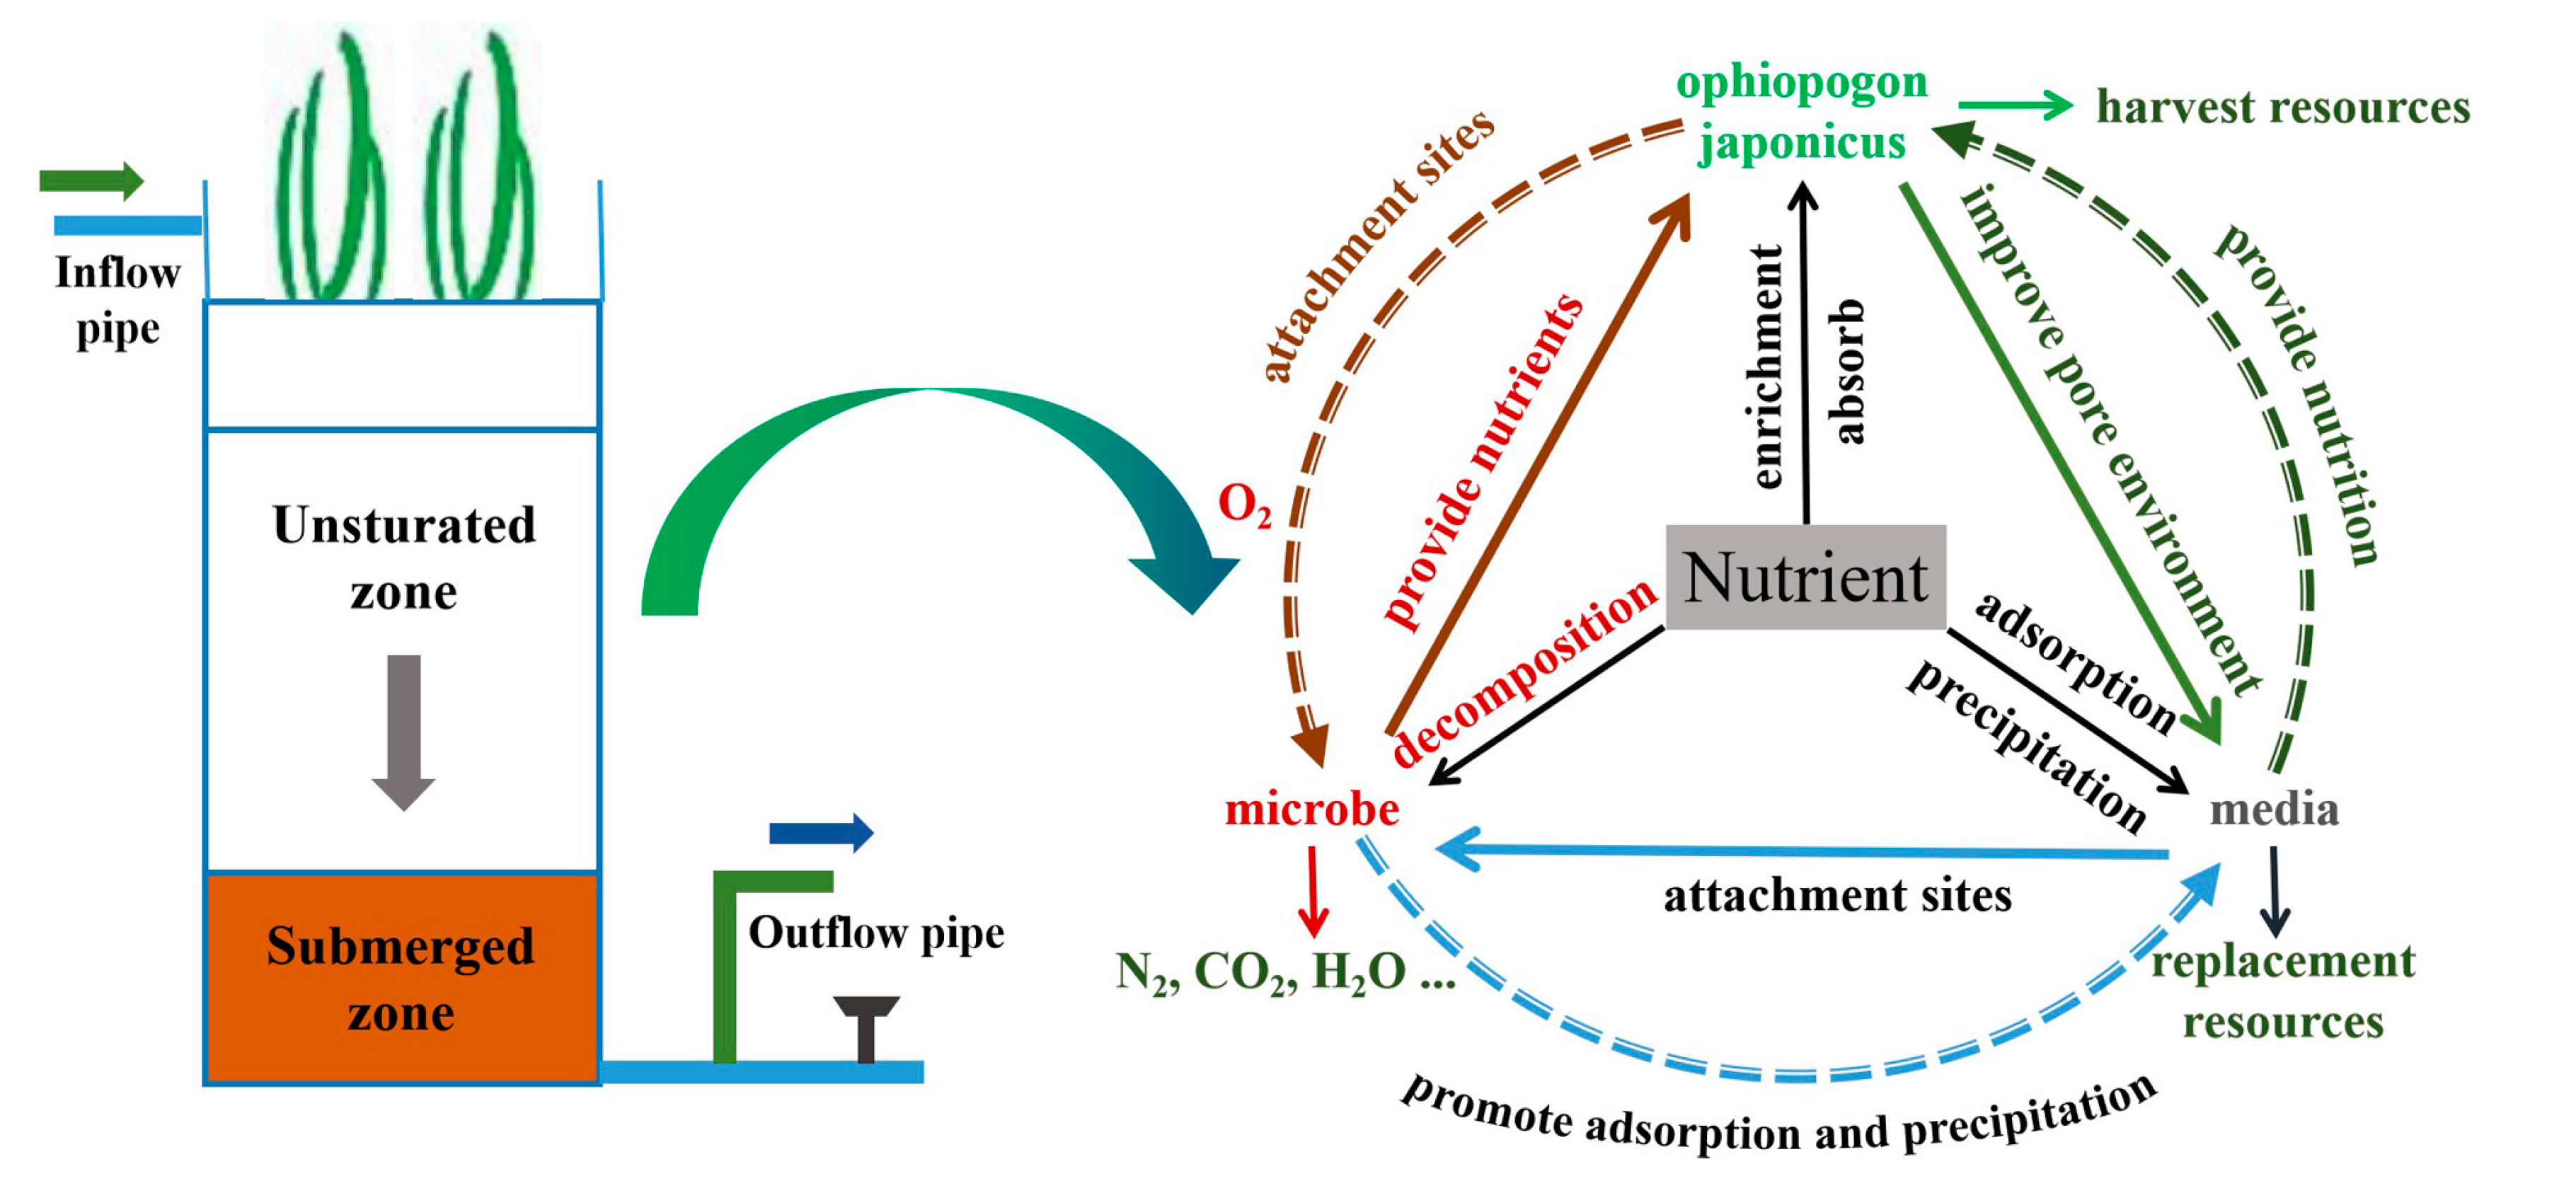
2.1. Set-Up of the Bioretention Columns

The simulated bioretention system includes a peristaltic pump, a water intake bucket, and a bioretention system. The bioretention system is composed of a plexiglass cylinder and a polyethylene pipe with an inner diameter of 10 mm and a height of 80 cm. On 24 May 2019, three setups of simulated bioretention systems were constructed, including the control group, the conventional bioretention (DS) group, and the strengthened bioretention (SZ) group (Figure 1). The control group and the DS group drained water from the bottom. The SZ group drained water 40 cm above the base, and the 40 cm column was in a long-term saturated state. Since phosphorus is easily captured by the physical and chemical adsorption of media during infiltration, only a portion of the nitrogen can be absorbed by the medium, and the rest is removed by nitrification and denitrification. Based on the above theory, the media layer was arranged from top to bottom as the water-retaining layer, adsorption layer, and catchment layer. Landscape plant Ophiopogon japonicus was selected as the model plant for bioretention. The fibrous root of Ophiopogon japonicus is well developed and has a fast growth rate. It can adapt to periodic changes on the surface runoff. In the control group, no plants were grown, while in the DS and SZ groups, Ophiopogon japonicus was planted. The specific configuration is shown in Table 1.

2.2. Synthetic Stormwater Runoff

The concentration of phosphorus and nitrogen in the simulated urban surface runoff refers to the monitoring results of the surface runoff in Shanghai, Nanjing, Wuhan, and Zhenjiang in China [34,35,36]. The rates of removal of DP (PO43−) and dissolved nitrogen (NH4+-N and NO3-N) were analyzed. In order to determine the performance of bioretention in the case of excessive pollutants in contaminated stormwater, two different concentrations of synthetic water runoff were used in the study, as presented in Table 2. The concentration of pollutants in the synthetic runoff for the regular event was designed to be similar to stormwater runoff, as suggested in the literature [31,37]. The experimental conditions for the extreme event were used to evaluate the performance of the bioretention in the case of sudden high concentrations in stormwater.

2.3. Experimental Design

After planting the Ophiopogon japonicus, the plants were watered every three days. The concentrations of TP and TN were 0.062 ± 0.021 mg/L and 0.87 ± 0.26 mg/L, respectively. After two months of cultivation as the plants gradually grew, the bioretention system was tested and monitored in July 2018. The removal efficiency of pollutants was investigated based on rainfall intensity, sunny weather, and concentration.
Based on the empirical model of rainfall intensity for Nanjing (Jiangsu Province, China) in Equation (1), we simulated the rainfall patterns using the Chicago Storm Theory, as provided by Equations (2) and (3) [30]. The rainfall duration (t) was assumed to be 360 min with rain peak using a rain peak coefficient of 0.4. Three different recurrence intervals in years (1a, 5a, 10a) were used, as presented in Table 3 and Figure 2.
i = 64.3 + 53.8 × log P ( t + 32.9 ) 1.001
Before Peak:
i ( t b ) = A [ ( 1 n ) t b r ] + b [ t b r + b ] n + 1
After Peak:
i ( t a ) = A [ ( 1 n ) t a 1 r + b ] [ t a 1 r + b ] n + 1
where i (mm/min) is the rainfall intensity, t (min) is the rainfall duration, p is the recurrence interval, and A, b, and n are the constants dependent on the units employed and the recurrence interval of the storm, r is the coefficient of rain peak.
Next, we calculated the rainwater runoffs associated with different recurrence intervals, based on the drainage criterion (GB50014-2006) in China. The rainwater design flow rate was calculated using Equation (4).
Q s = i × φ × F
where Qs (mL/min) is the design flow rate of the rainwater, φ is the runoff coefficient (assumed to be 0.3 for soil road such as in a suburb), and F (cm2) is the percentage of the catchment area (assumed to be 8% as the ratio of the bioretention area to the catchment area).
In Nanjing, 60% of rainfall is not more than 25.0 mm, daily rainfall is not less than 5.0 mm, and the average interval time between rainfall is seven days. The simulation interval days were set at three levels (i.e., 3, 8, and 14 days), which were used in analyzing the effect of sunny weather on the rate of removal of nitrogen and phosphorus.

2.4. Evaluation of Removal Efficiency by Bioretention

Water sample testing was based on the Standard of Monitoring and Analysis Method of Water and Wastewater (Fourth Edition). The water sample was filtered using a 0.45 µm membrane, and subsequently, ultraviolet spectrophotometry was performed to determine the TN. Phenol disulfonic acid spectrophotometry was employed to determine the NO3-N content. Nessler’s reagent colorimetric method was used to analyze the NH4+-N content. TP was determined using potassium persulfate oxidation and the molybdenum antimony anti-spectrophotometric method. During the test, the cumulative load of pollutants in the bioretention system was calculated as follows:
The removal ratio for different forms of pollutants was calculated by Equation (5):
η = C 0 C e C 0 × 100 %
where η′ (%) is the removal ratio, C0 (mg/L) is the concentrations in the runoff before entering the bioretention system, and Ce (mg/L) is the concentration in the outflow.

2.5. Surface Characterization and Chemical Compositions

To evaluate the changes in morphology, crystal structure, and the chemical compositions of the surface, the materials in the bioretention before and after the simulated rainfall tests were characterized using the SEM, EDS, and XRD. The compositions and distribution of elements on the surface of the substrate were determined by EDS analysis. Before all analytical tests, the materials were dried in an oven at 105 °C for 24 h.

2.6. Water Quality Assessment Based on Fuzzy Water Pollution Index Method

Comprehensive evaluation theory is a method evaluated by fuzzy mathematics. Using the fuzzy theory, the method from a number of factors undertakes a comprehensive evaluation according to subordinate degrees of arbitrated aspects. The fuzzy evaluation method can rank and evaluate objects by the size of the overall evaluation scores and also divide them into different grades [16]. This study uses an analytical decision-making method based on the fuzzy congruity theory. By using the fuzzy theory, some qualitative factors are transformed into quantitative parameters, and the fuzziness and uncertainty of determination are solved [38,39].

2.6.1. Establishing the Model of the Fuzzy Comprehensive Index (FCI) Method

The procedure for constructing the comprehensive evaluation model is as follows [40,41]:
(1)
Identify the factor set U = {u1, u2, ···, un}. Assume that the number of factors related to the evaluated object is n.
(2)
Identify the remark set V = {v1, v2, ···, vn}. Assume that the number of all the possible remarks is m.
(3)
Process the single factor evaluation, which means evaluating every factor ui {i = 1, 2, ···, n}, and getting the single factor evaluation set ri = {ri1, ri2, ···, rim}. Determine the evaluation matrix by the mapping relationship.
R = ( r 11 r 12 r 1 m r 21 r 22 r 2 m r n 1 r n 2 r n m )
(4)
Since every factor’s status is not necessarily equal, there is a need for weighting factors. Assume that the fuzzy set A = {a1, a2, ···, an} represents the weight distribution of every factor and n. The comprehensive evaluation set is: B = A × R = {b1, b2, bi, ···, bm}.

2.6.2. Calculation of the FCI of Water Quality

1. Fuzzy Relation Matrix R
The fuzzy relation matrix represents the subjection degree of each evaluation factor to each water quality grade. In this study, the subjection degree matrix R is calculated by using the simplified half-trapezoidal distribution function and the linear triangle function [42]. The surface water is categorized into six grades (I, II, III, IV, V, worse than V), which is based on the “Environmental quality standard for surface water”. The standard values for each grade are Q(1), Q(2), Q(3), Q(4), Q(5), Q(6). The membership pollution factor rij can be defined as follows in Equation (6):
r i j = 1 X i Q ( j ) Q ( j + 1 ) X i Q ( j + 1 ) Q j Q j < X i Q ( j + 1 ) 0 X i > Q ( j + 1 )
where xi represents the measured value of the i pollution factor; Q(j) represents the j level quality standard of the i pollution factor; Q(j+1) represents the j+1 level quality standard of the i pollution factor.
2. Weight Coefficient
The weight coefficient of pollution factors is used to measure the influence of pollution factors on environmental water quality. In this study, the weight value is determined by calculating the excess ratio. The higher the weight coefficient, the stronger the influence of the factor on water quality. The formula is as follows in Equation (7):
a i j = C i S i i = 1 n C i S i
where Ci is the measured value of the pollution factor i; Si is the arithmetic mean value of environmental quality standards for pollution factors at all levels in i, such that in Equation (8):
S i ¯ = 1 m j = 1 m S i j
3. Fuzzy Composite Index B*
In this study, we use the weighted average principle to calculate the Fuzzy composite index B* in Equation (9):
B = j = 1 m b j k · j j = 1 m b j k
where B* is the relative position of the object in each quality grade; bj is the membership of grade j; and, k is an undetermined coefficient which is used to control the value of bj.

3. Results and Discussion

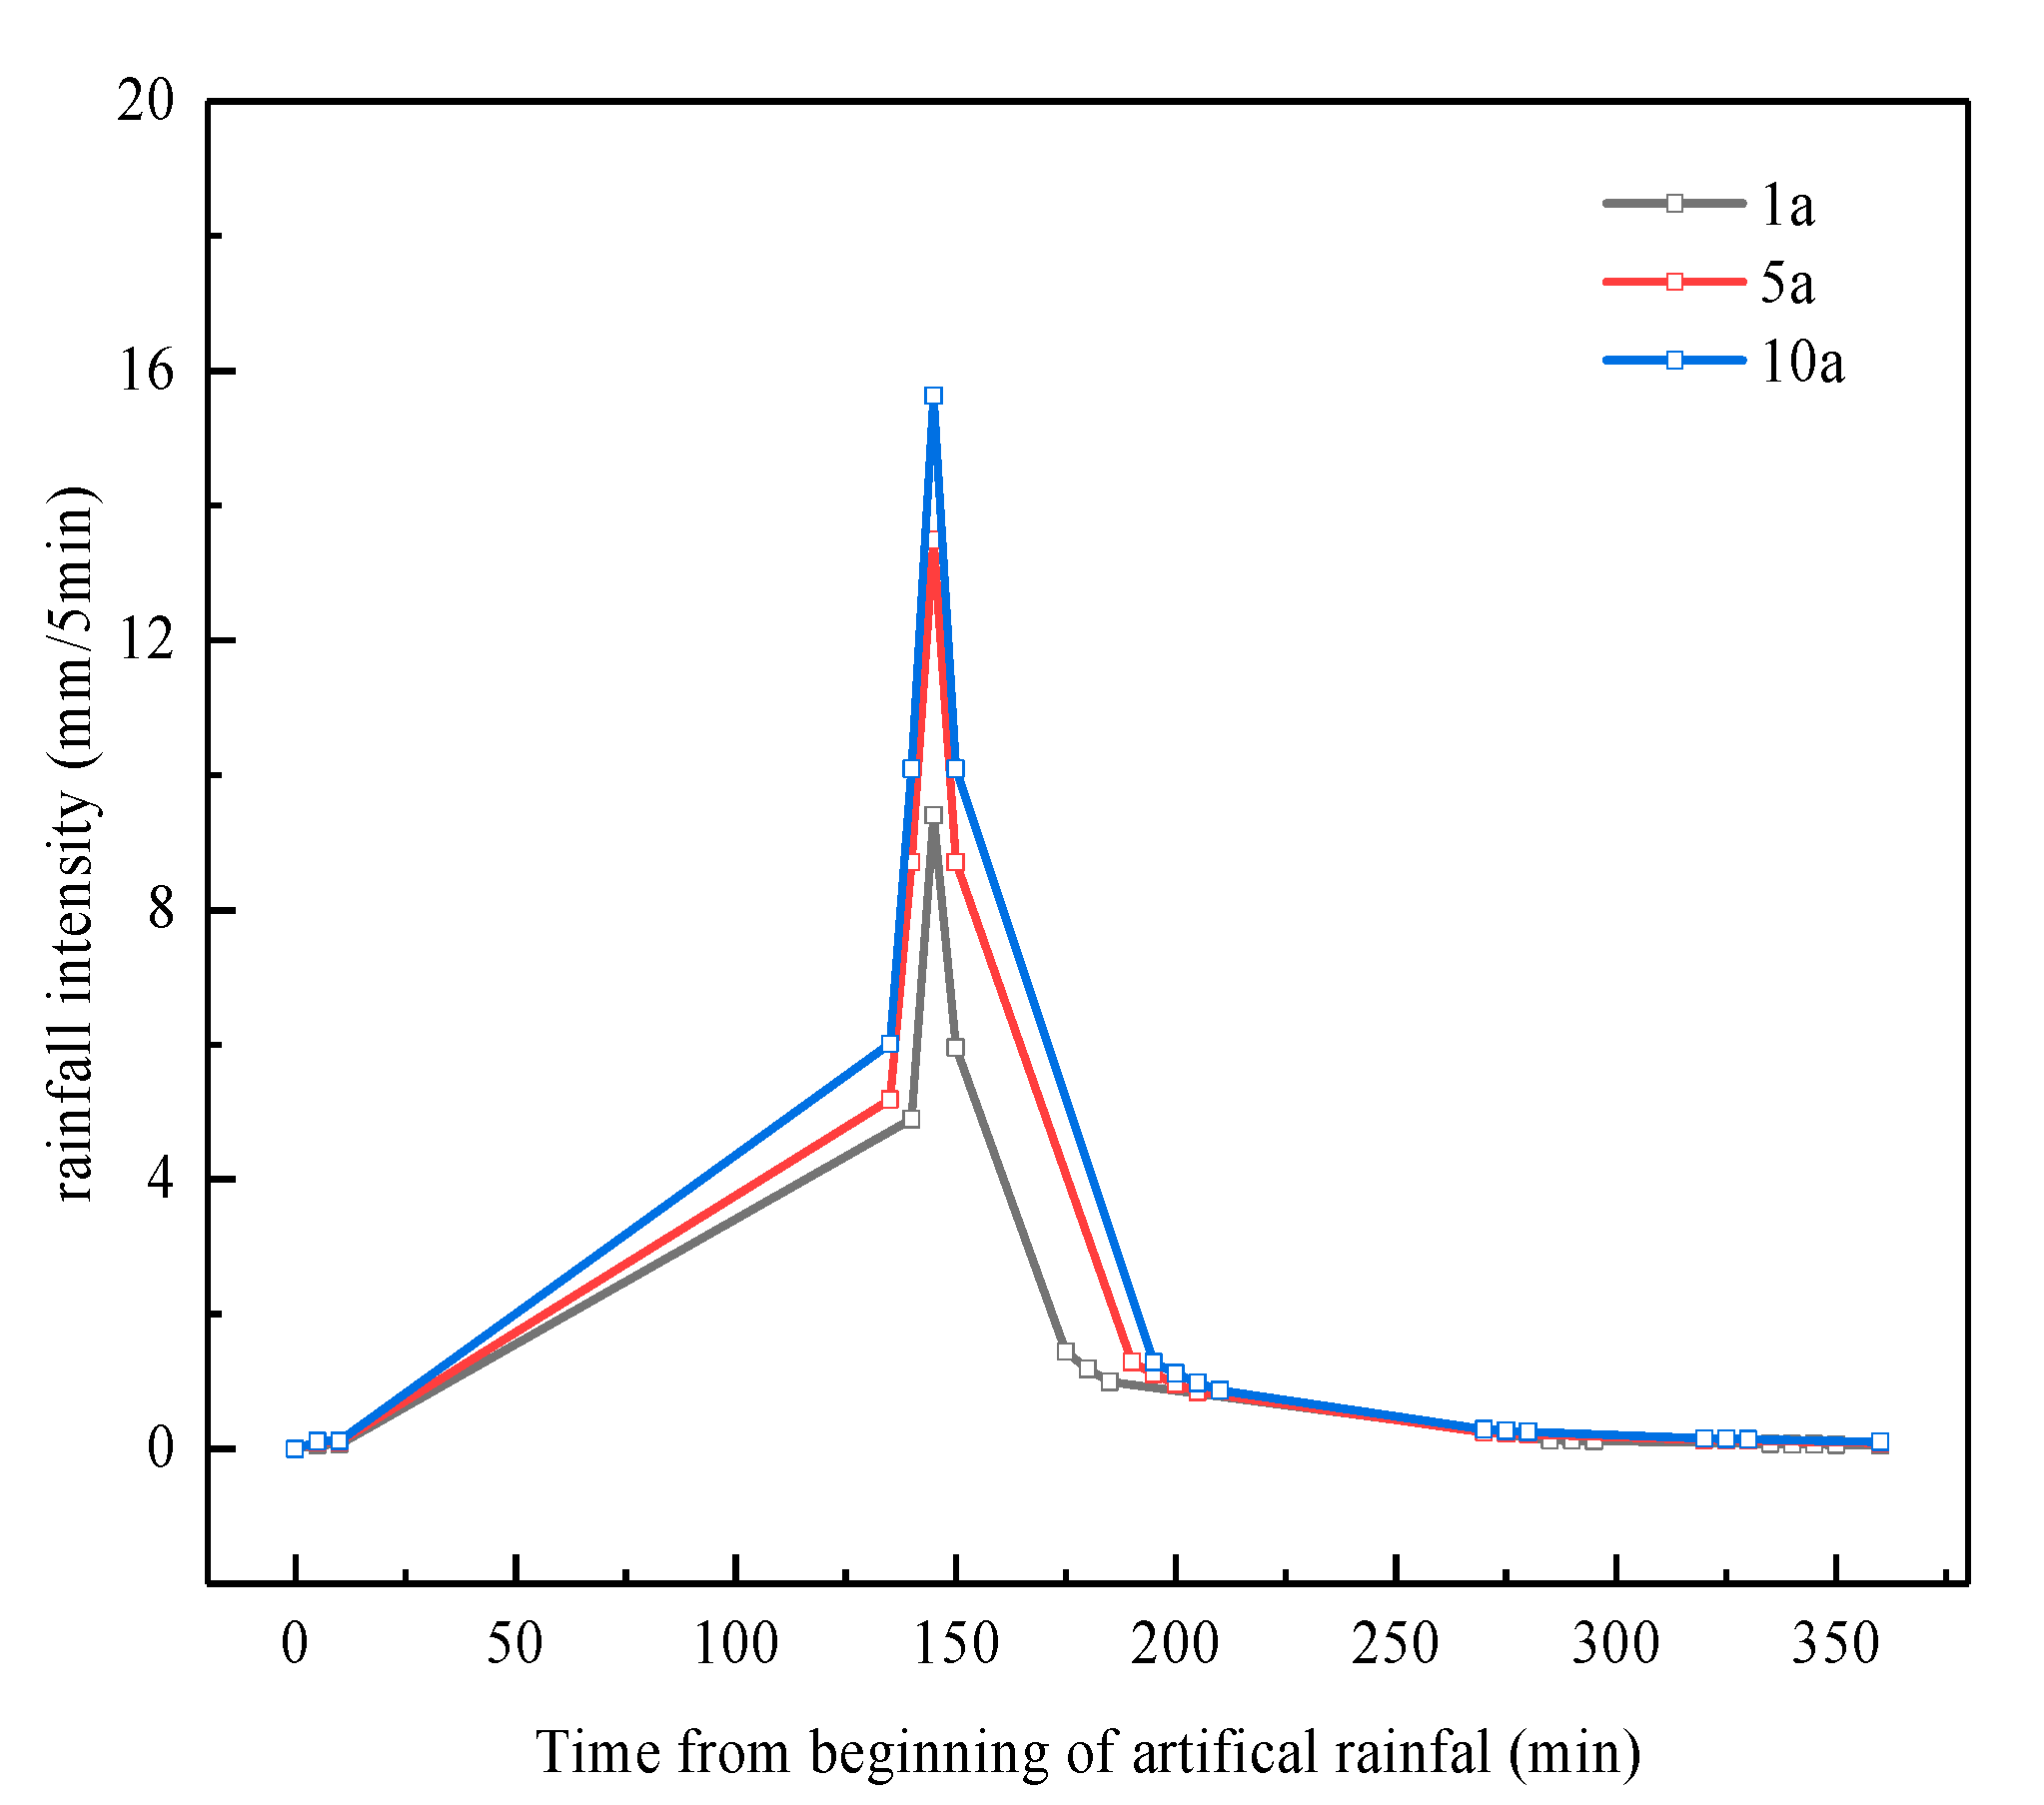
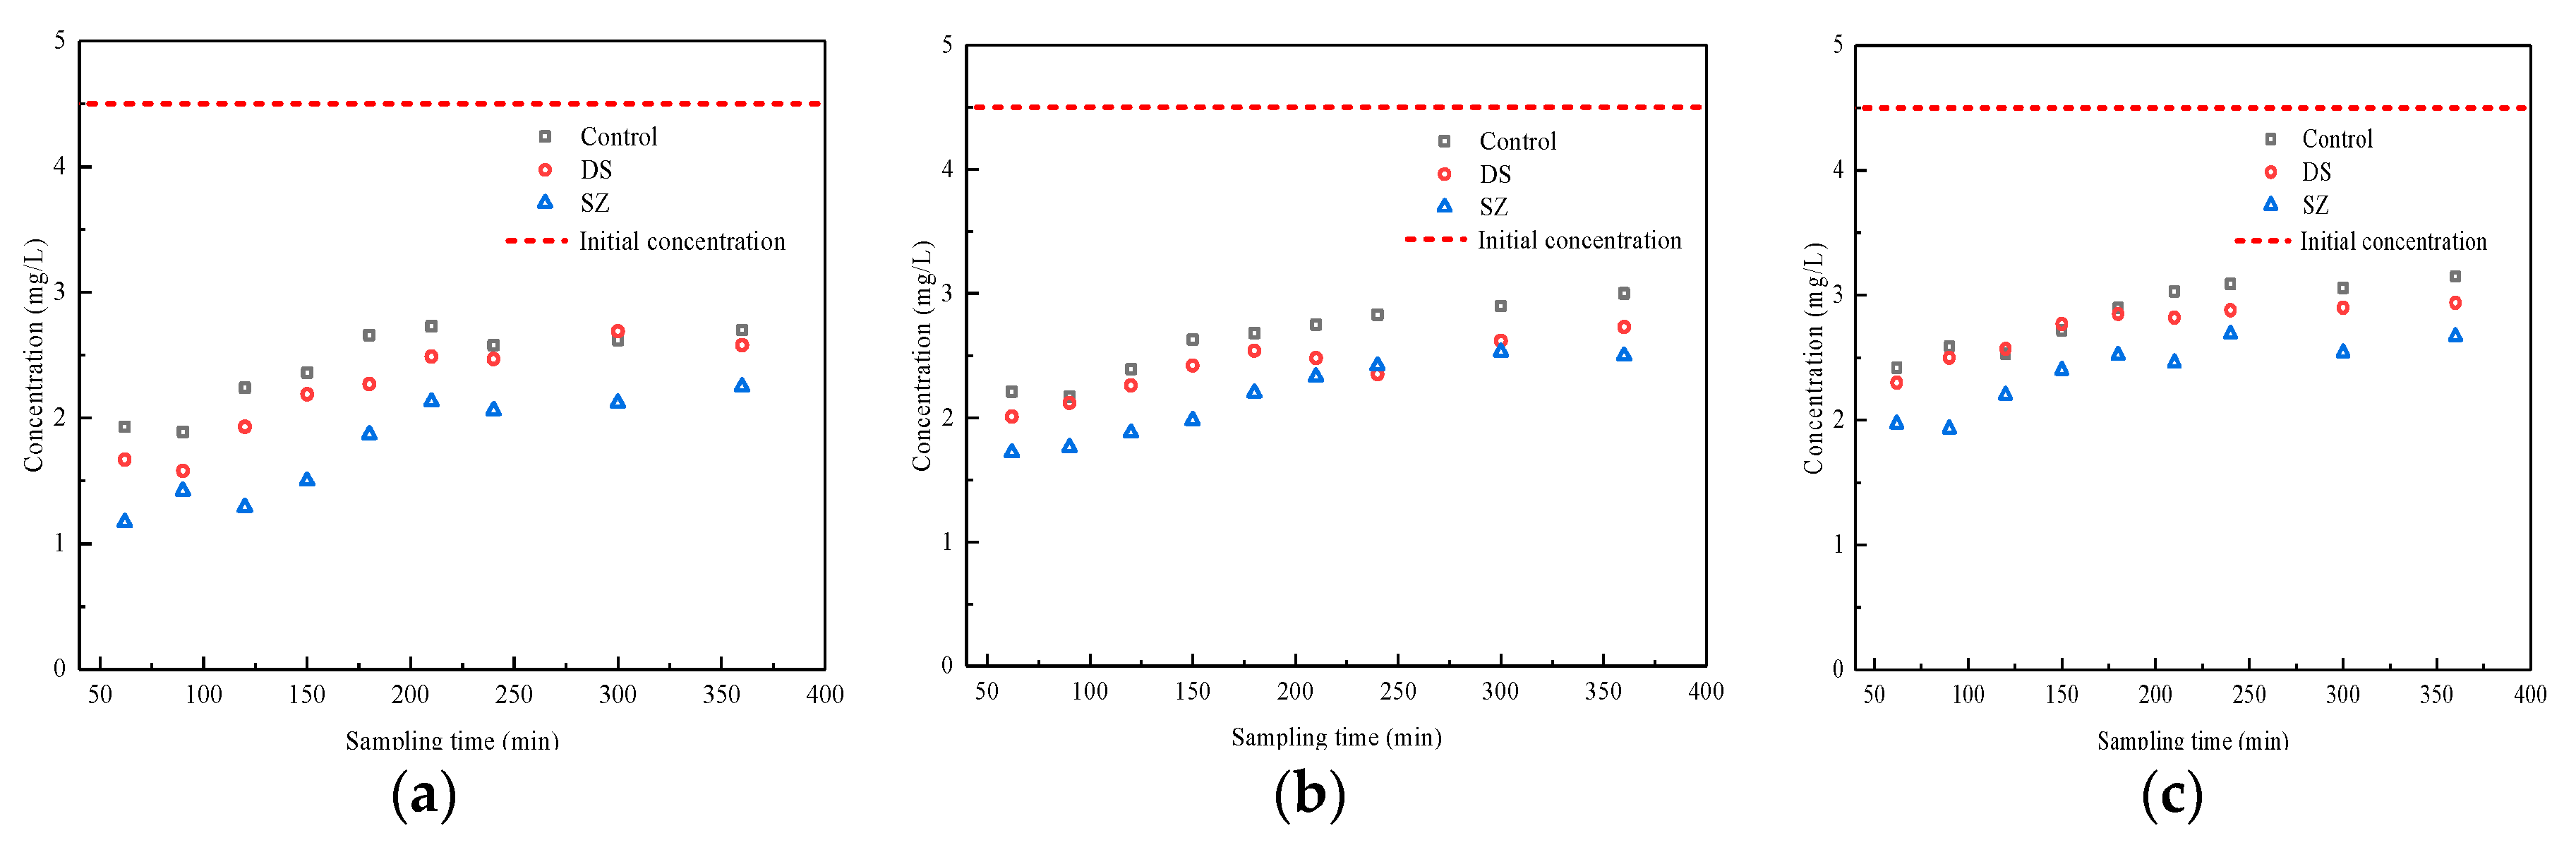
3.1. Effect of Rainfall Intensity on the Retention of Pollutants by Bioretention

All three groups with bioretention systems had high rates of removal of TP for the whole rainfall duration (Figure 3), indicating that the bioretention technology is able to effectively reduce the content of phosphorus in the rainfall-runoff. The conventional bioretention system (control group) had the lowest removal efficiency of TP, while the DS and SZ columns remained less than 0.4 mg/L of TP in the initial effluent and showed a higher purification effect. This could be attributed to the plant uptake, media adsorption, and chemical precipitation that occurred within the system [30]. With the increase in rainfall time, the concentration of phosphorus in the rainwater outflow increased gradually. One possible explanation is that the initial fast-reversible adsorption sites on the media surface were gradually occupied, and then the phosphate in the rainwater moved slowly towards the irreversible adsorption sites during infiltration [43]. At the same time, the released adsorption reversible sites could regain the adsorptive capacity of the media for the bioretention system before the beginning of the next rainfall.
The removal rate of TP decreased with increasing rainfall time. The removal rate of TP in the SZ column was still highest under these three different rainfall intensities. When the rainfall recurrence interval was 1a, the bioretention columns with aquifers (SZ) was able to achieve a removal rate of more than 92.4% in the initial effluent. However, with an increase in rainfall intensity, the removal rate of TP in the effluent had decreased gradually. The removal of TP was mainly due to the physical and chemical adsorption of the media. At the same time, higher rainfall intensity would have led to more considerable runoff and higher total pollution load. The hydraulic retention time of rainwater in the bioretention system was shortened, and the phosphorus adsorption by the fillers with limited adsorption capacity was easily saturated. The traditional bioretention system (no saturated area) was affected by the rainfall intensity. When the recurrence interval was increased to 10a, the removal rate of TP decreased to 72.6%. Therefore, even under extreme weather conditions, the bioretention system with a saturated zone proved to be more reliable and stable.
Under different rainfall intensities, the removal efficiency of NH4+-N was relatively different (Figure 4). With continued rainfall, the concentration of NH4+-N in the effluent had gradually increased, with the SZ column exhibiting the highest removal efficiency. When the rainfall recurrence interval was 1a, the removal rate of NH4+-N reached 90.1%, and NH4+-N concentration in the effluent was lower than 0.85 mg/L by the end of the rainfall. This is because higher rainfall intensities lead to greater runoffs and higher hydraulic loads. Rainwater runoff could quickly pass through the planting layer, which decreases the hydraulic retention time of rainwater runoff in the planting layer and reduces the fast adsorption and filtration of NH4+-N by the plant roots and soil layers [30,35]. At the same time, the reaction time between nitrifying bacteria and NH4+-N in the rainwater runoff is reduced, which subsequently diminishes the treatment efficiency of the bioretention system for the rainwater runoff.
Figure 5 shows the operational effect of the bioretention system on NO3-N under different rainfall intensities. The concentration of NO3-N in the outflow declined with increasing sampling time. The rate of removal of NO3-N increased from −19.3% to 18.9%, and the bioretention system (SZ) with a saturated zone showed a higher rate of removal of TN. This is because forming a submerged area at the bottom of the retention system would be difficult with small runoffs. There were many aerobic zones in the system. The nitrification process converts NH4+-N into NO3-N. However, the system cannot provide suitable anaerobic conditions, thereby limiting the process of denitrification [29,32]. As a result, the rate of removal of NO3-N was extremely low, and even the concentration of the effluent was higher than that of the influent. Therefore, further studies are required to improve the removal efficiency of NO3-N in the bioretention system.
Figure 6 shows TN removal in the different types of bioretention systems with the same rainfall duration. The effect of TN treatment was similar to that of NO3N, with the change in rainfall, showing a positive correlation trend with a 15% difference in the rate of removal. Regardless of the change in rainfall intensity, the SZ column with a saturation function had the highest rate of TN removal (more than 40%). When the rainfall recurrence interval was 10a, the TN removal reached 60%. This enhanced function may be attributed to the denitrification process in the aquifer under anaerobic conditions. NO3-N was denitrified into nitrogen in the deep anaerobic zone and removed by the bioretention system [24].

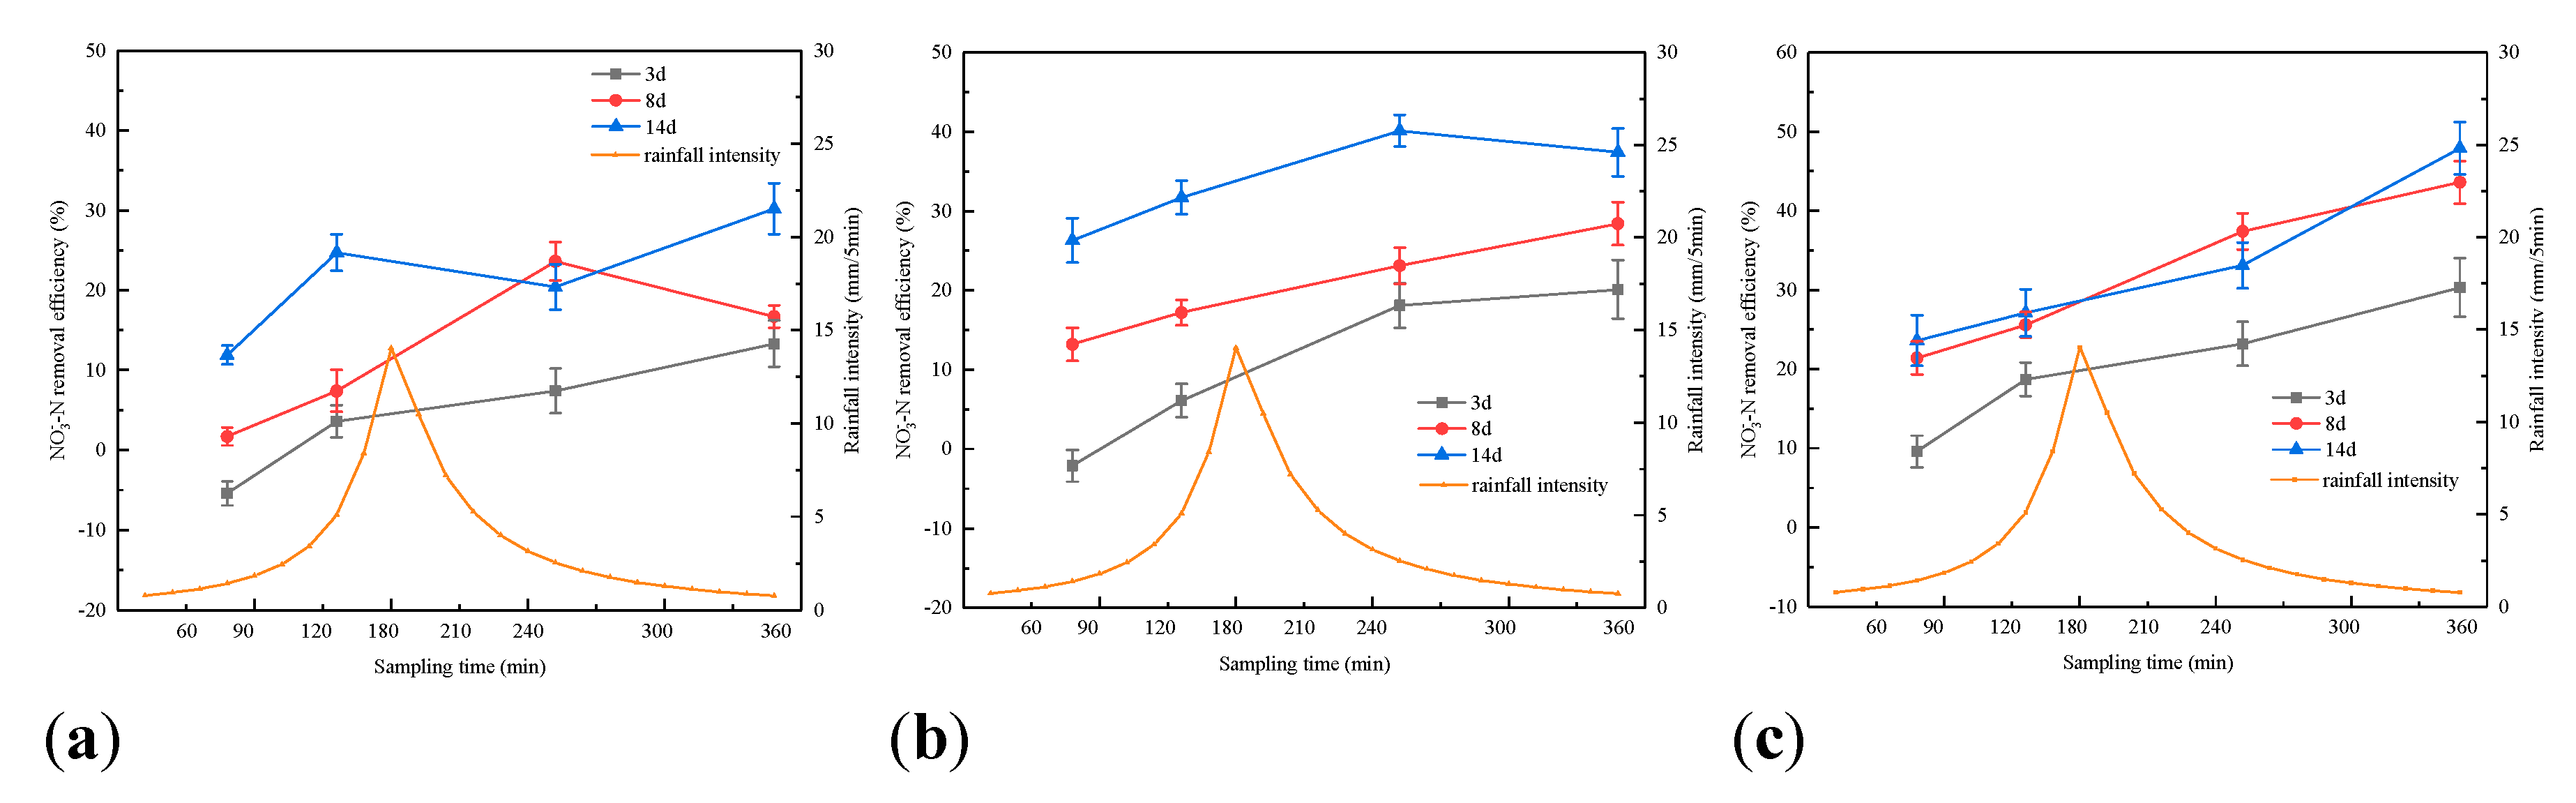
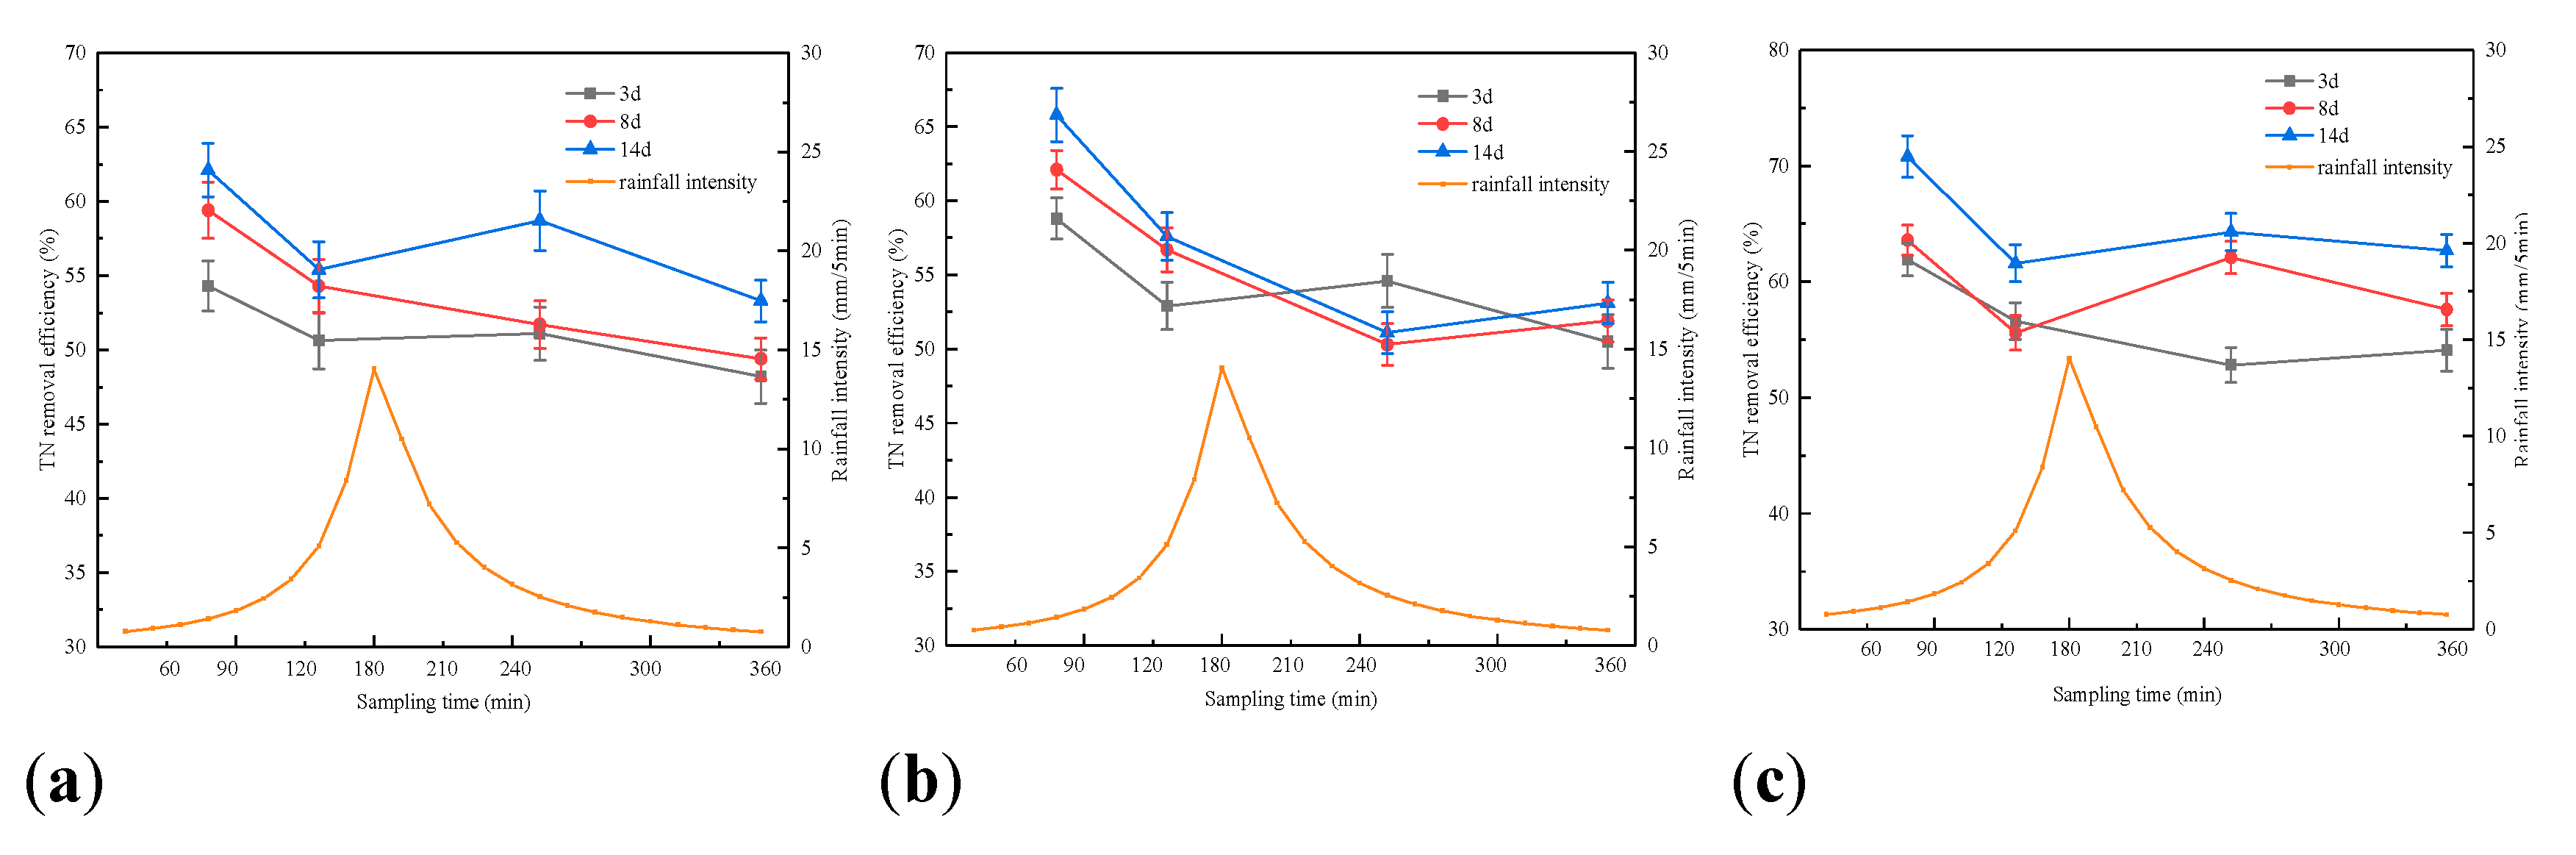
3.2. Effect of Antecedent Dry Periods on Pollutants Retention in Bioretention Systems

The results suggest that dry periods before rainfall have an important influence on the accumulation, migration, and transformation of nitrogen in the bioretention system. Overall, during the rainfall event, the effluent nitrogen concentration in the different bioretention systems showed a downward trend, followed by an upward drift. The difference in the effluent nitrogen concentrations of the different structures was found insignificant (Figure 7). The number of adsorption sites vacated by the media was not significantly different. The initial effluent concentration of NH4+-N in the SZ group was higher than that in the later stage. The main explanation is that the submerged layer is usually anoxic, which is unconducive to aerobic nitrification [24,29,32]. The effluent NH4+-N concentration in the bioretention system was lower than 0.2 mg/L in the experiment, which showed that the bioretention system had higher removal efficiency of NH4+-N in the rainwater runoff.
Figure 8 shows the effluent rule of NO3-N from different bioretention systems under different drought cycles. The removal efficiency of NO3-N in the saturated system was higher compared with the non-saturated system. This suggests that the aquifer could create an anoxic environment and promote the denitrification to remove NO3-N. With the outflow, the concentration of NO3-N increased and then gradually stabilized. Also, the concentration of NO3-N varied for the different drought cycles. Due to the role of the filter layer and submerged layer, the longer the antecedent dry period, the stronger the abiotic fixation and plant uptake of the upper soil. Additionally, the higher the denitrification of the lower layer, the greater the removal of NO3-N.
The effluent TN concentration also showed an upward trend. The difference in the effluent TN concentration in the different bioretention systems was not significant. The overall change in the trend was similar to that of the NO3-N. The removal capacity of NH4+-N by the filter layer in the different systems exhibited minor differences. The longer the antecedent dry period, the more NO3-N was removed by plants or by abiotic fixation. Given the combined effect of these two measures, the difference in TN removal by the different systems was found to be minimal. Although a longer dry period means that more denitrification could be carried out and would result in a lower NO3-N content, the results show that the difference in the amount of NO3-N between the different systems was not significant (Figure 9). This means that the comprehensive effect of the filter layer and the aquifer is able to reduce the difference in TN removal rates [30].
Figure 10 shows the relationship between the dry period duration and TP removal. The TP concentration increased with a longer dry period. When the dry period was three days, the TP removal efficiency rates of the three systems was between 84.7% to 91.4%, and the effluent TP concentration was lower than 0.2 mg/L. From the 8th to the 14th day, the removal efficiency of TP decreased from 86.2% to 71.7%. The main reason is that the media adsorption serves as the primary mode of phosphate removal. Since high phosphorus content is intercepted by the infiltration layer and the media layer, the phosphorus in the system is slowly released outward with a prolonged dry period. At the same time, the anoxic state in the submerged area steers the phosphorus-accumulating bacteria to again release the fixed phosphorus [27,30]. Thus, in the next rainfall, the water in the submerged area would flow out.

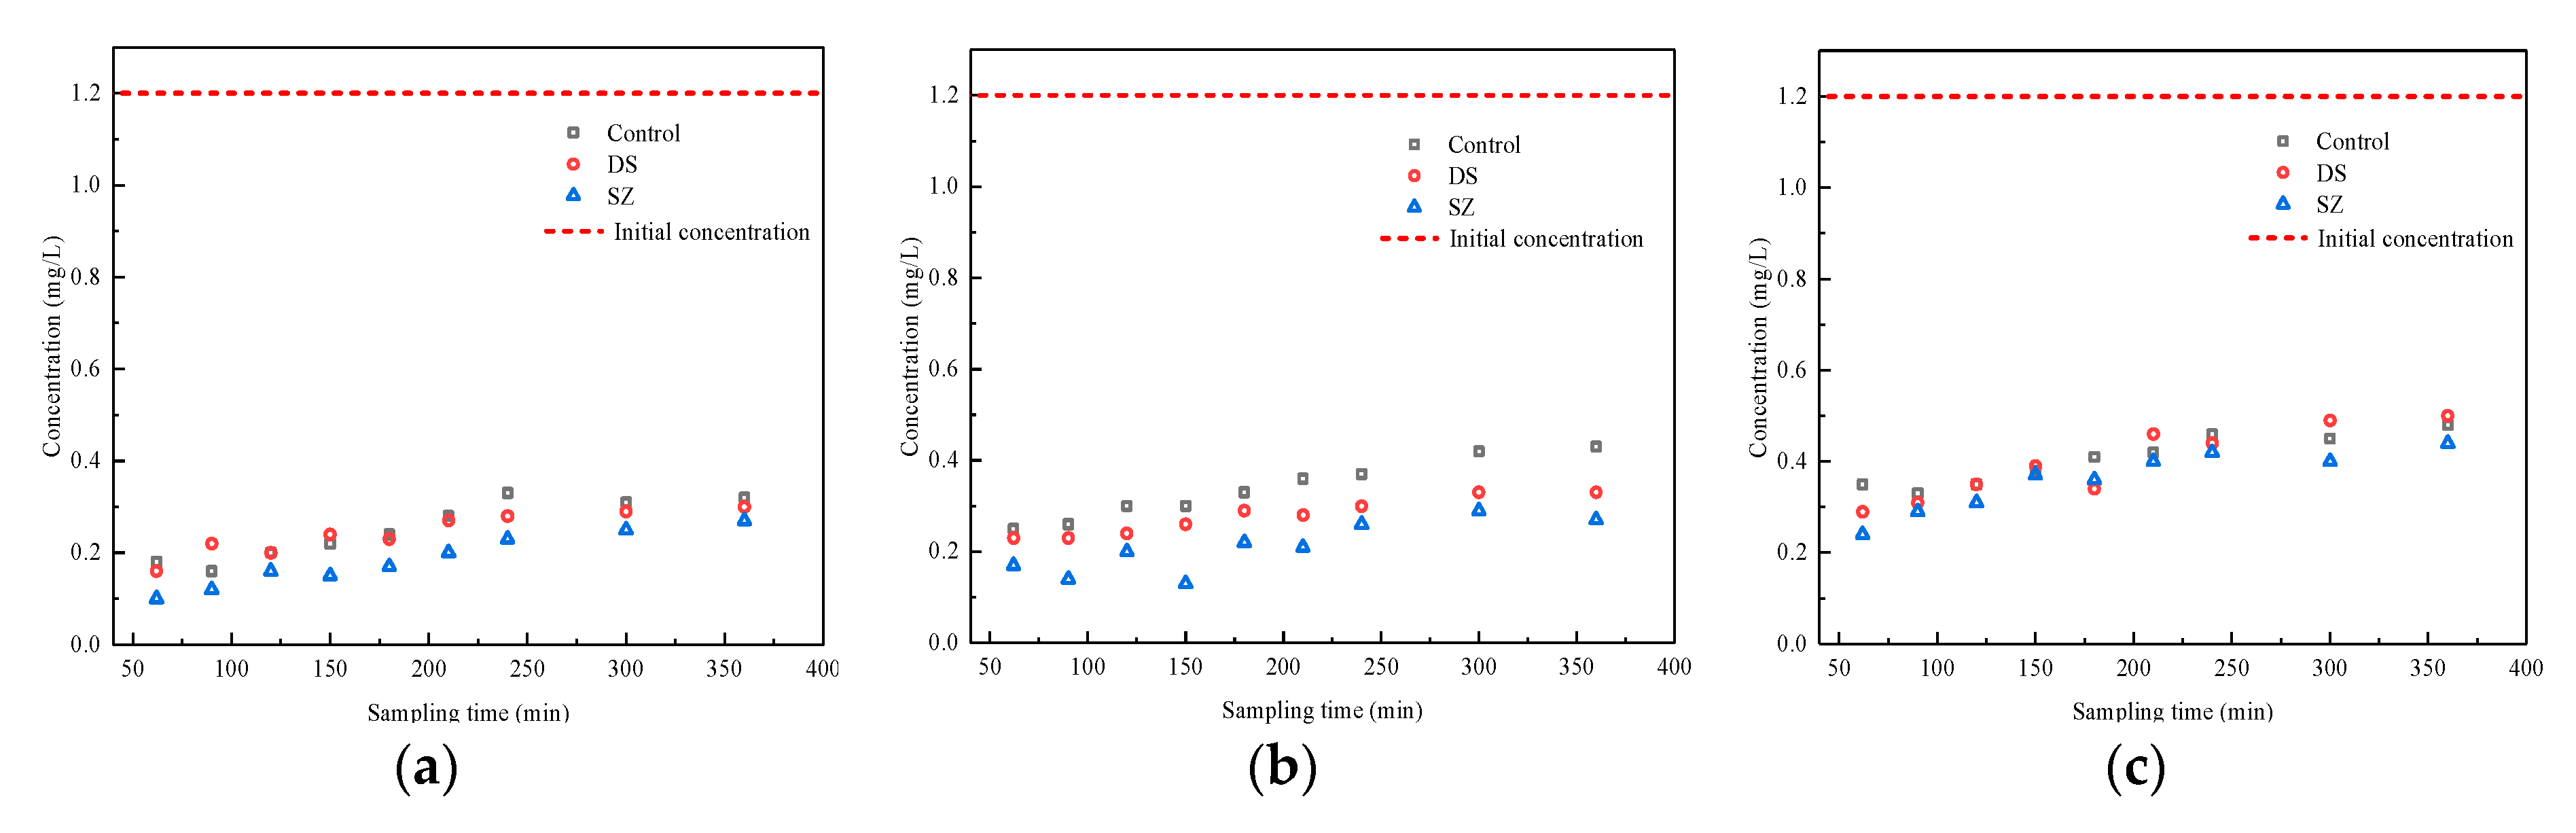
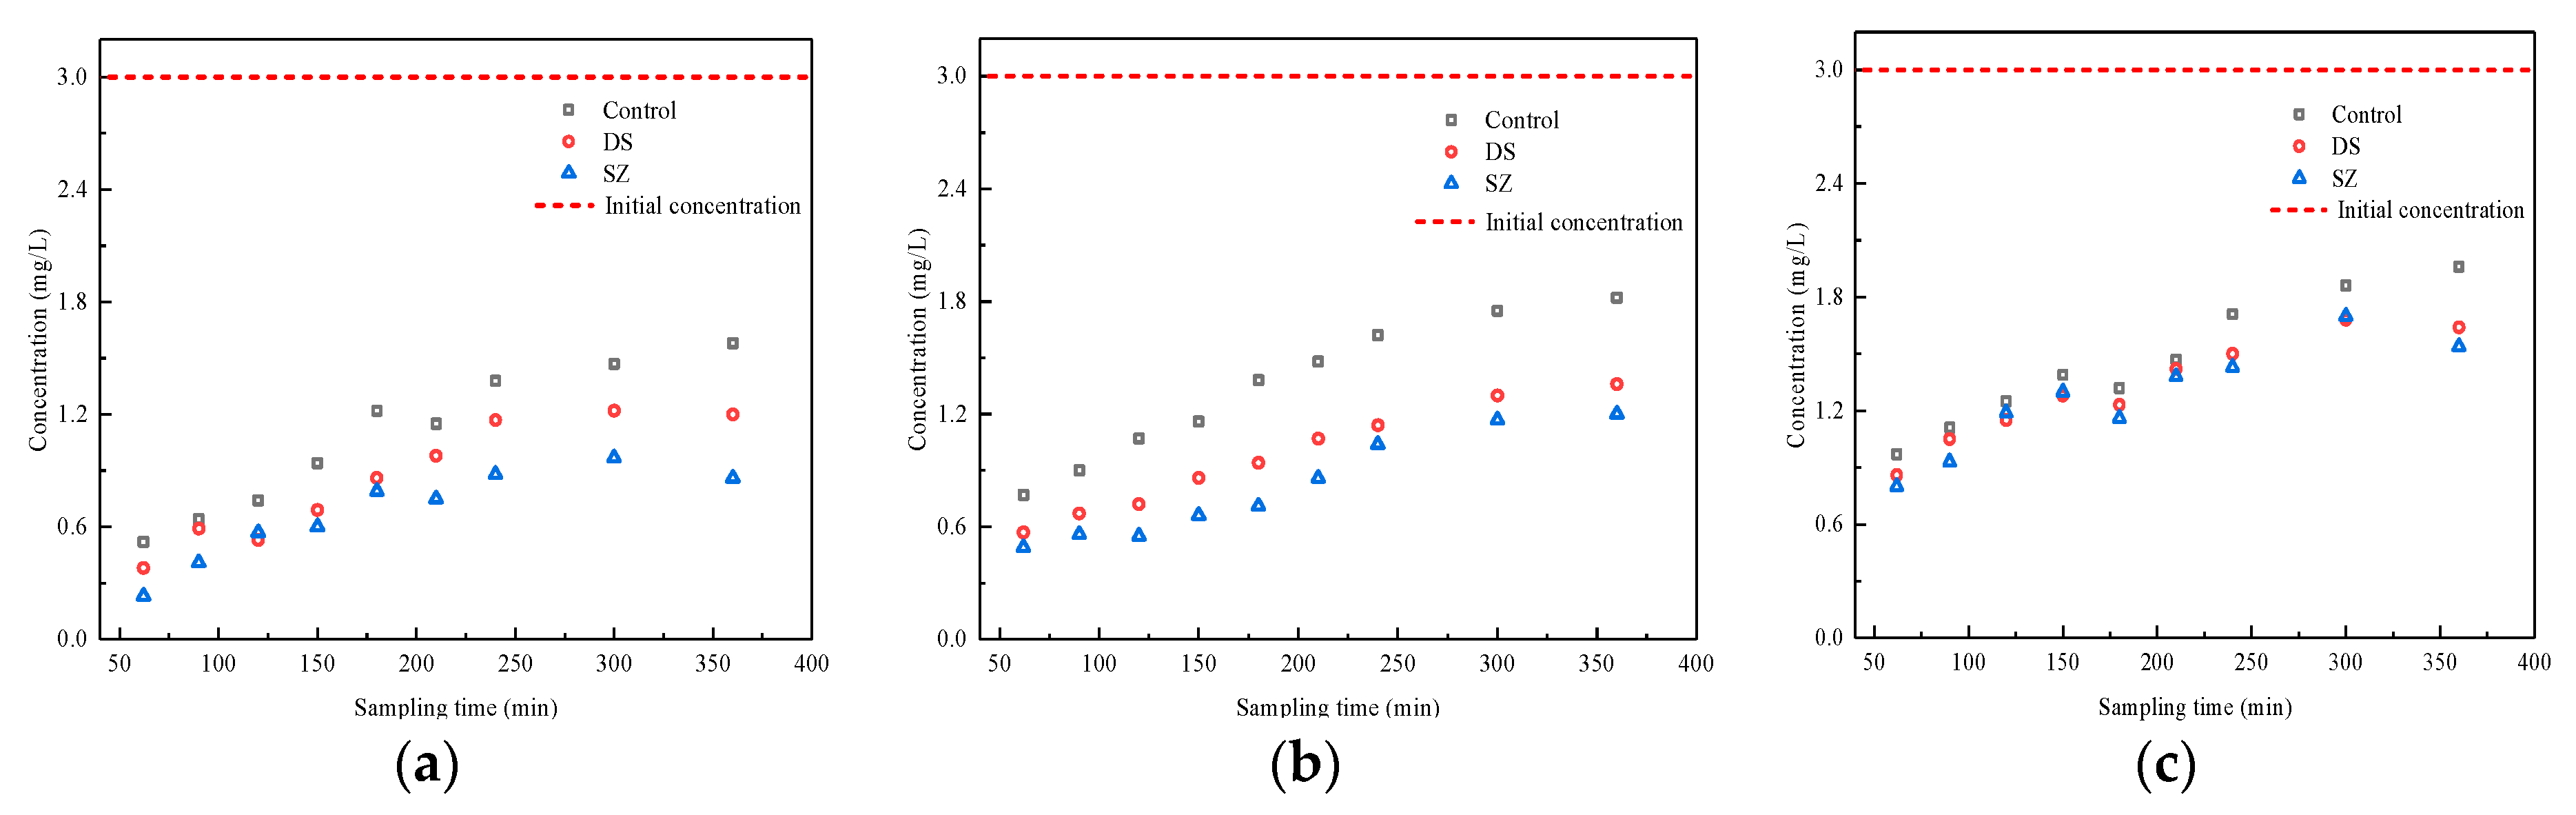
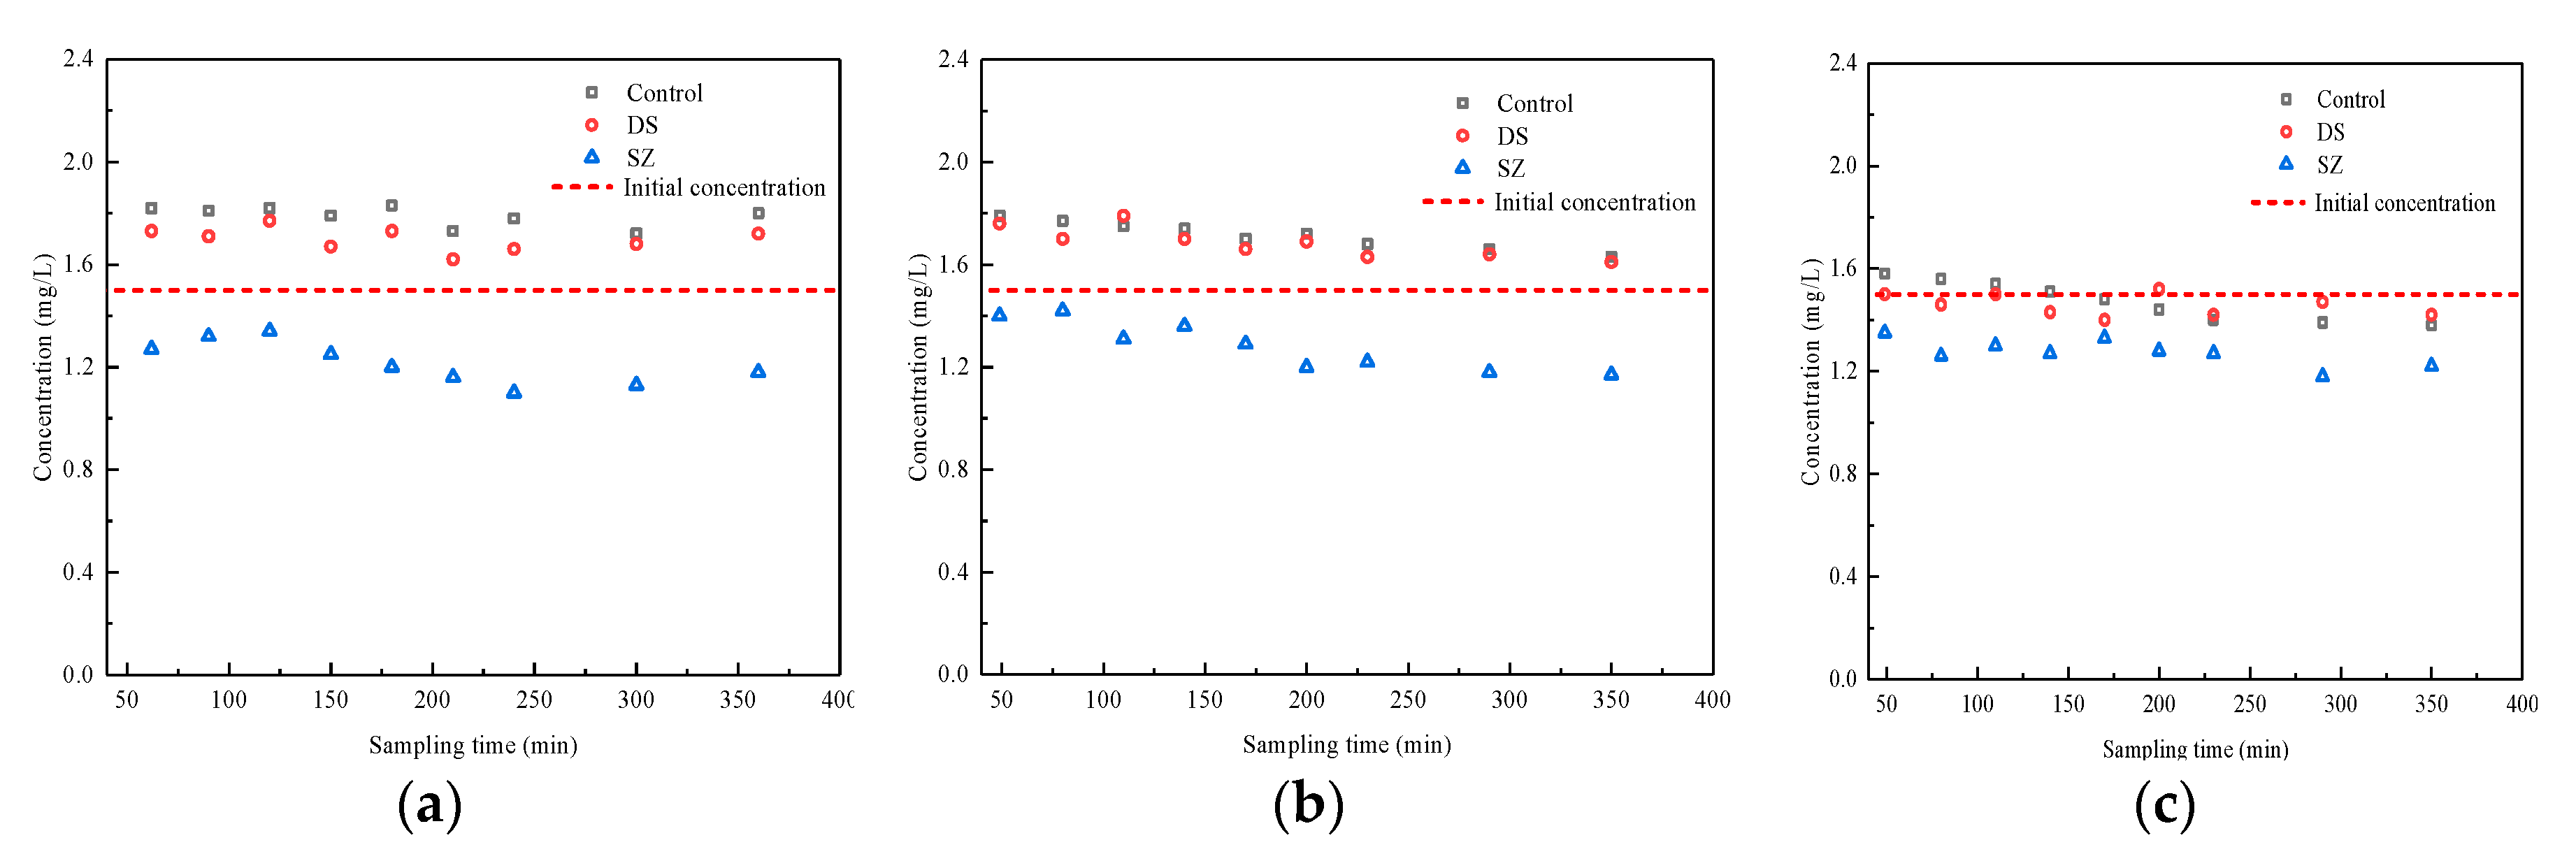
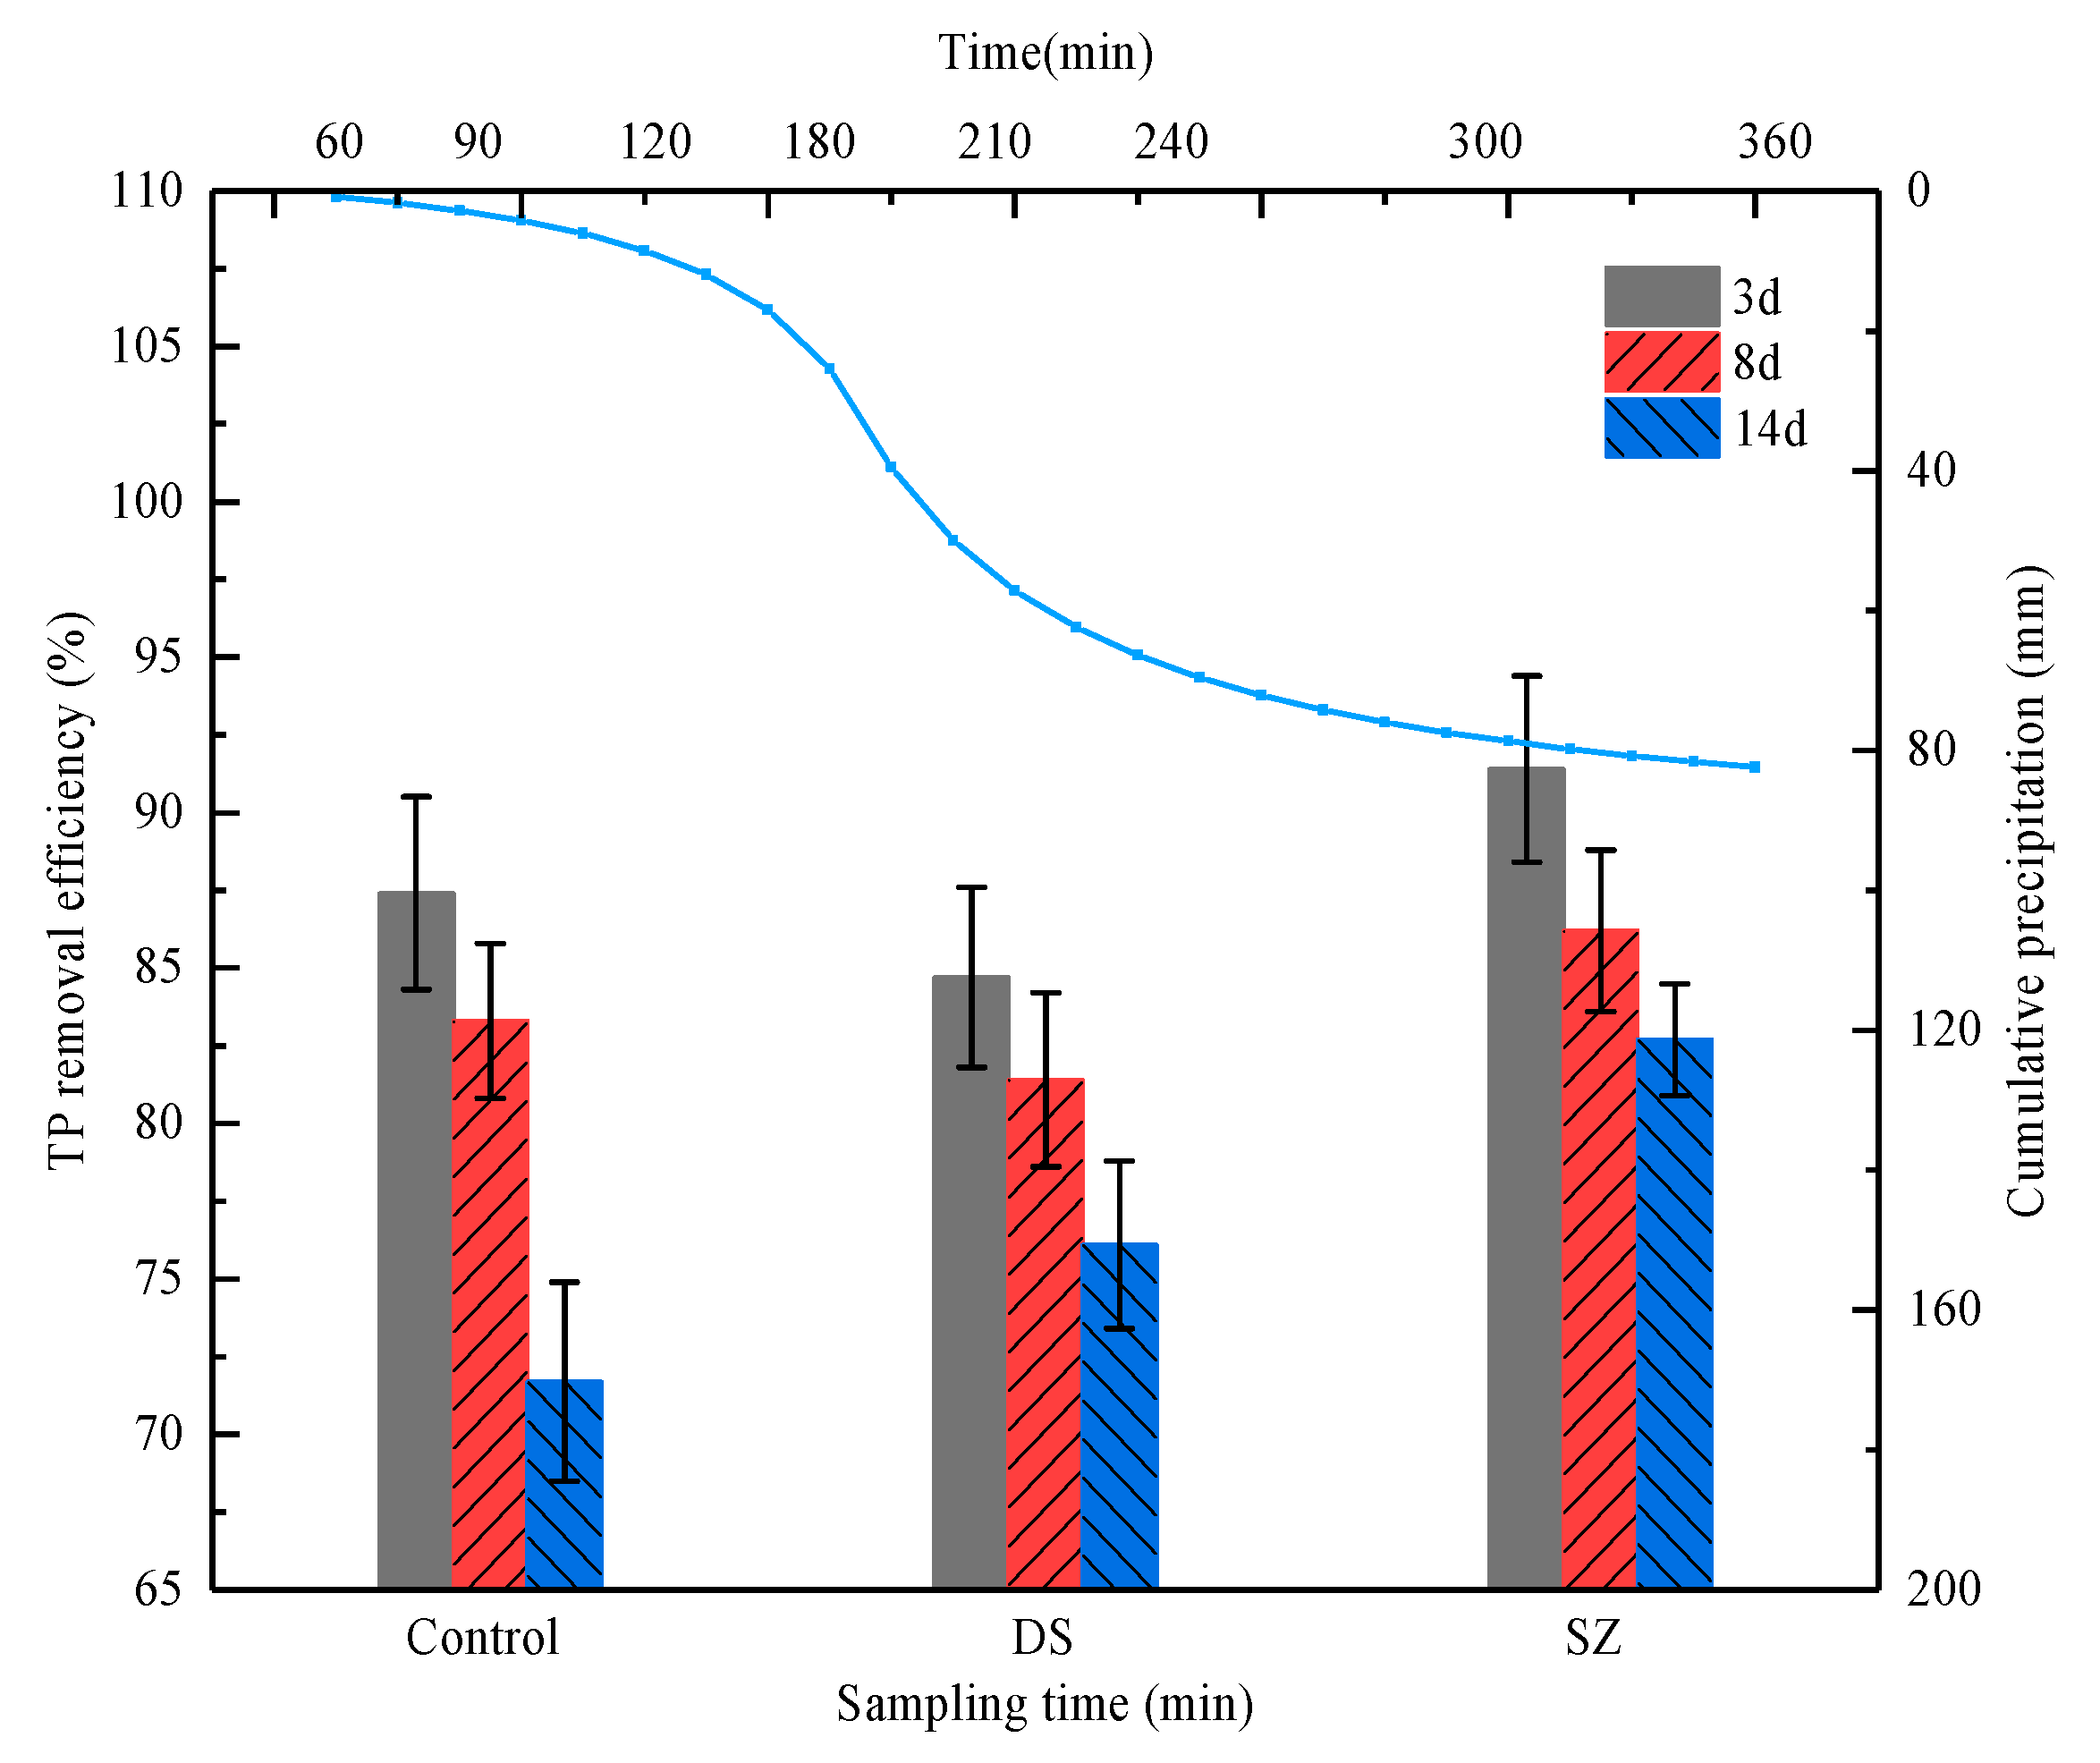
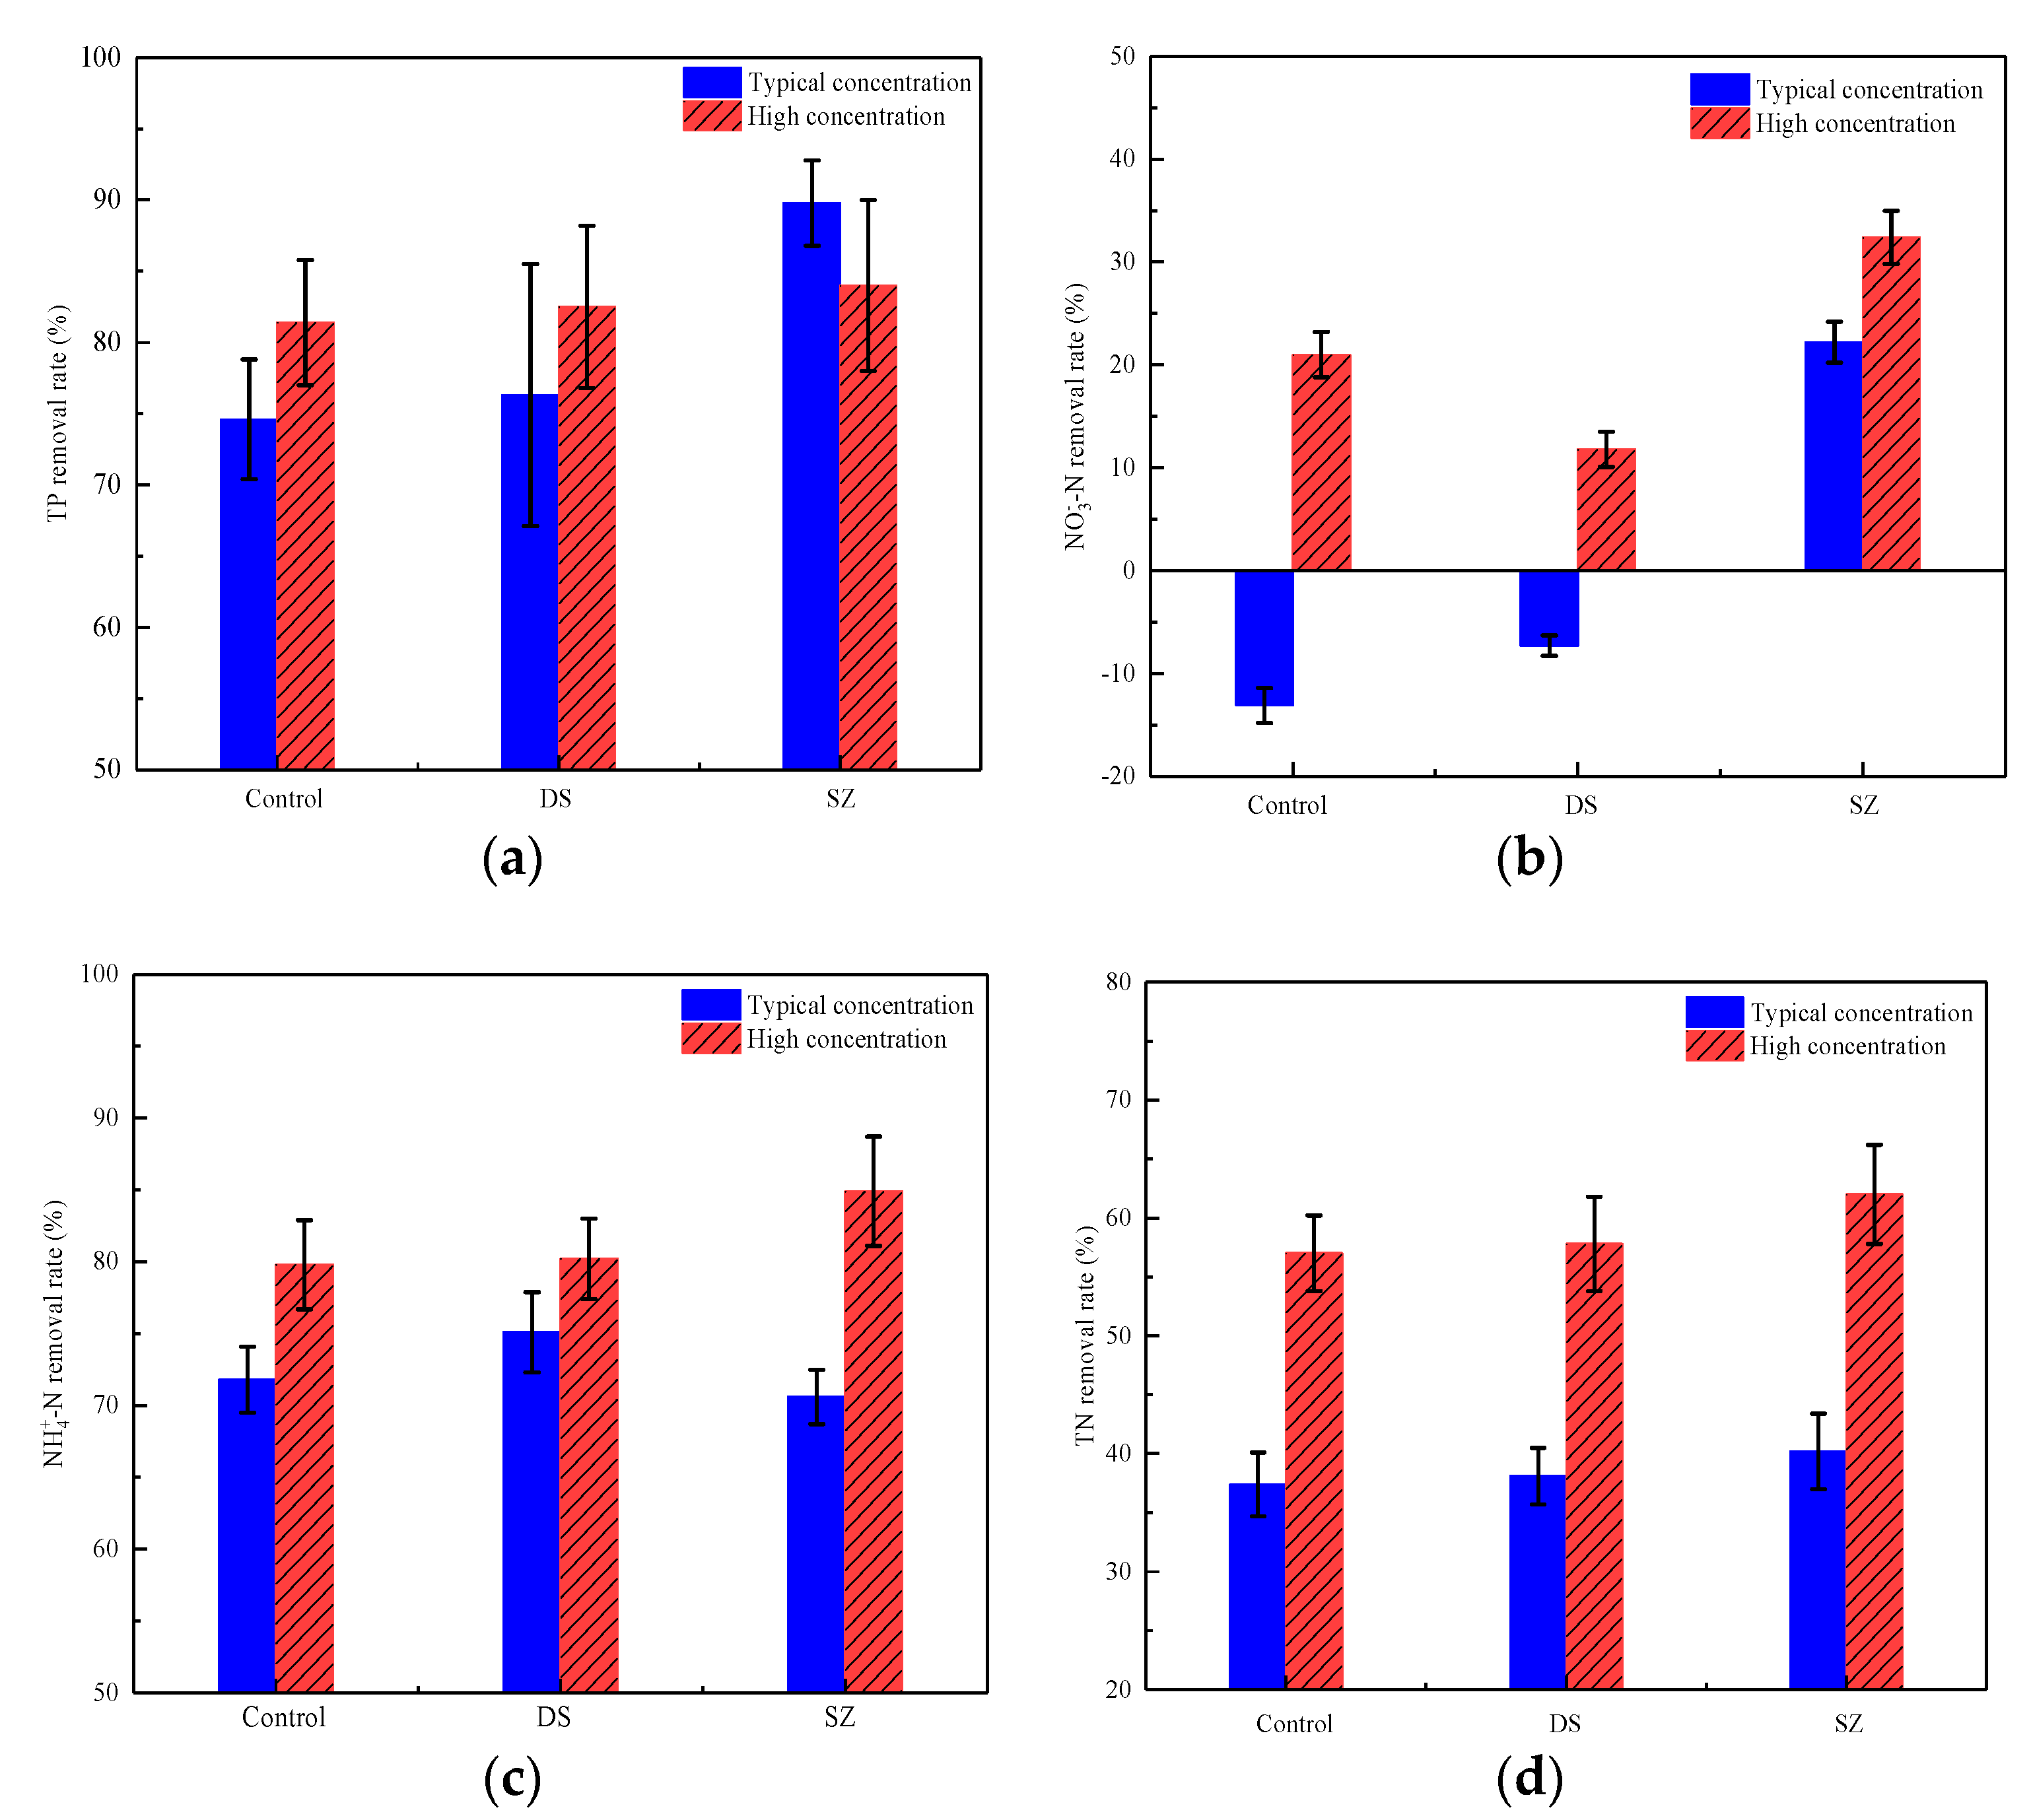
3.3. Effect of Nutrient Concentration on Pollutant Retention by Bioretention Systems

Figure 11a,b shows the TP and NH4+-N removal efficiency rates of bioretention systems for normal and extreme events with the recurrence interval of the rainfall being 1a. In general, influent stormwater with higher nutrient concentrations would consequently result in higher concentrations in the bioretention system’s effluent [44]. In this study, the TP removal efficiency was found to increase in higher concentrations (extreme event) for both the Control and SZ columns. A higher phosphorus load means a larger concentration gradient, which in turn can promote the adsorption process between pollutants and media in the solution given the greater availability of chelate sites on the media.
The extent of phosphorus removal is markedly influenced by the ratio of phosphorus in the solution (i.e., DP) and the adsorbed phosphorus [45]. Similarly, for the NO3-N removal, all columns exhibited better removal efficiency for high nutrient concentration compared with the normal concentration. This suggests that the bioretention system with a saturated area could still possess sufficient treatment capacity to handle the excessive concentration of nutrients, at least within a short period of time.
Figure 11c,d compares the NH4+-N and TN removal efficiency rates of different bioretention systems for standard and extreme concentrations. For NH4+-N, the removal efficiency in the high nutrient concentration (extreme event) was higher than that of a normal event, especially for the column with the saturated zone (>85%). Similar observations were found for the TN removal in extreme events, where the columns with the saturated zone exhibited a higher removal efficiency of over 55%. According to the study by Zhao et al. [46], the removal ratio of TN in inflows with high nutrient concentrations was about 40%, which was higher compared to low nutrient inflows. Note that the improved bioretention in the SZ column (combines the saturated zone) could enable the simultaneous removal of phosphorus and nitrogen from stormwater runoff.

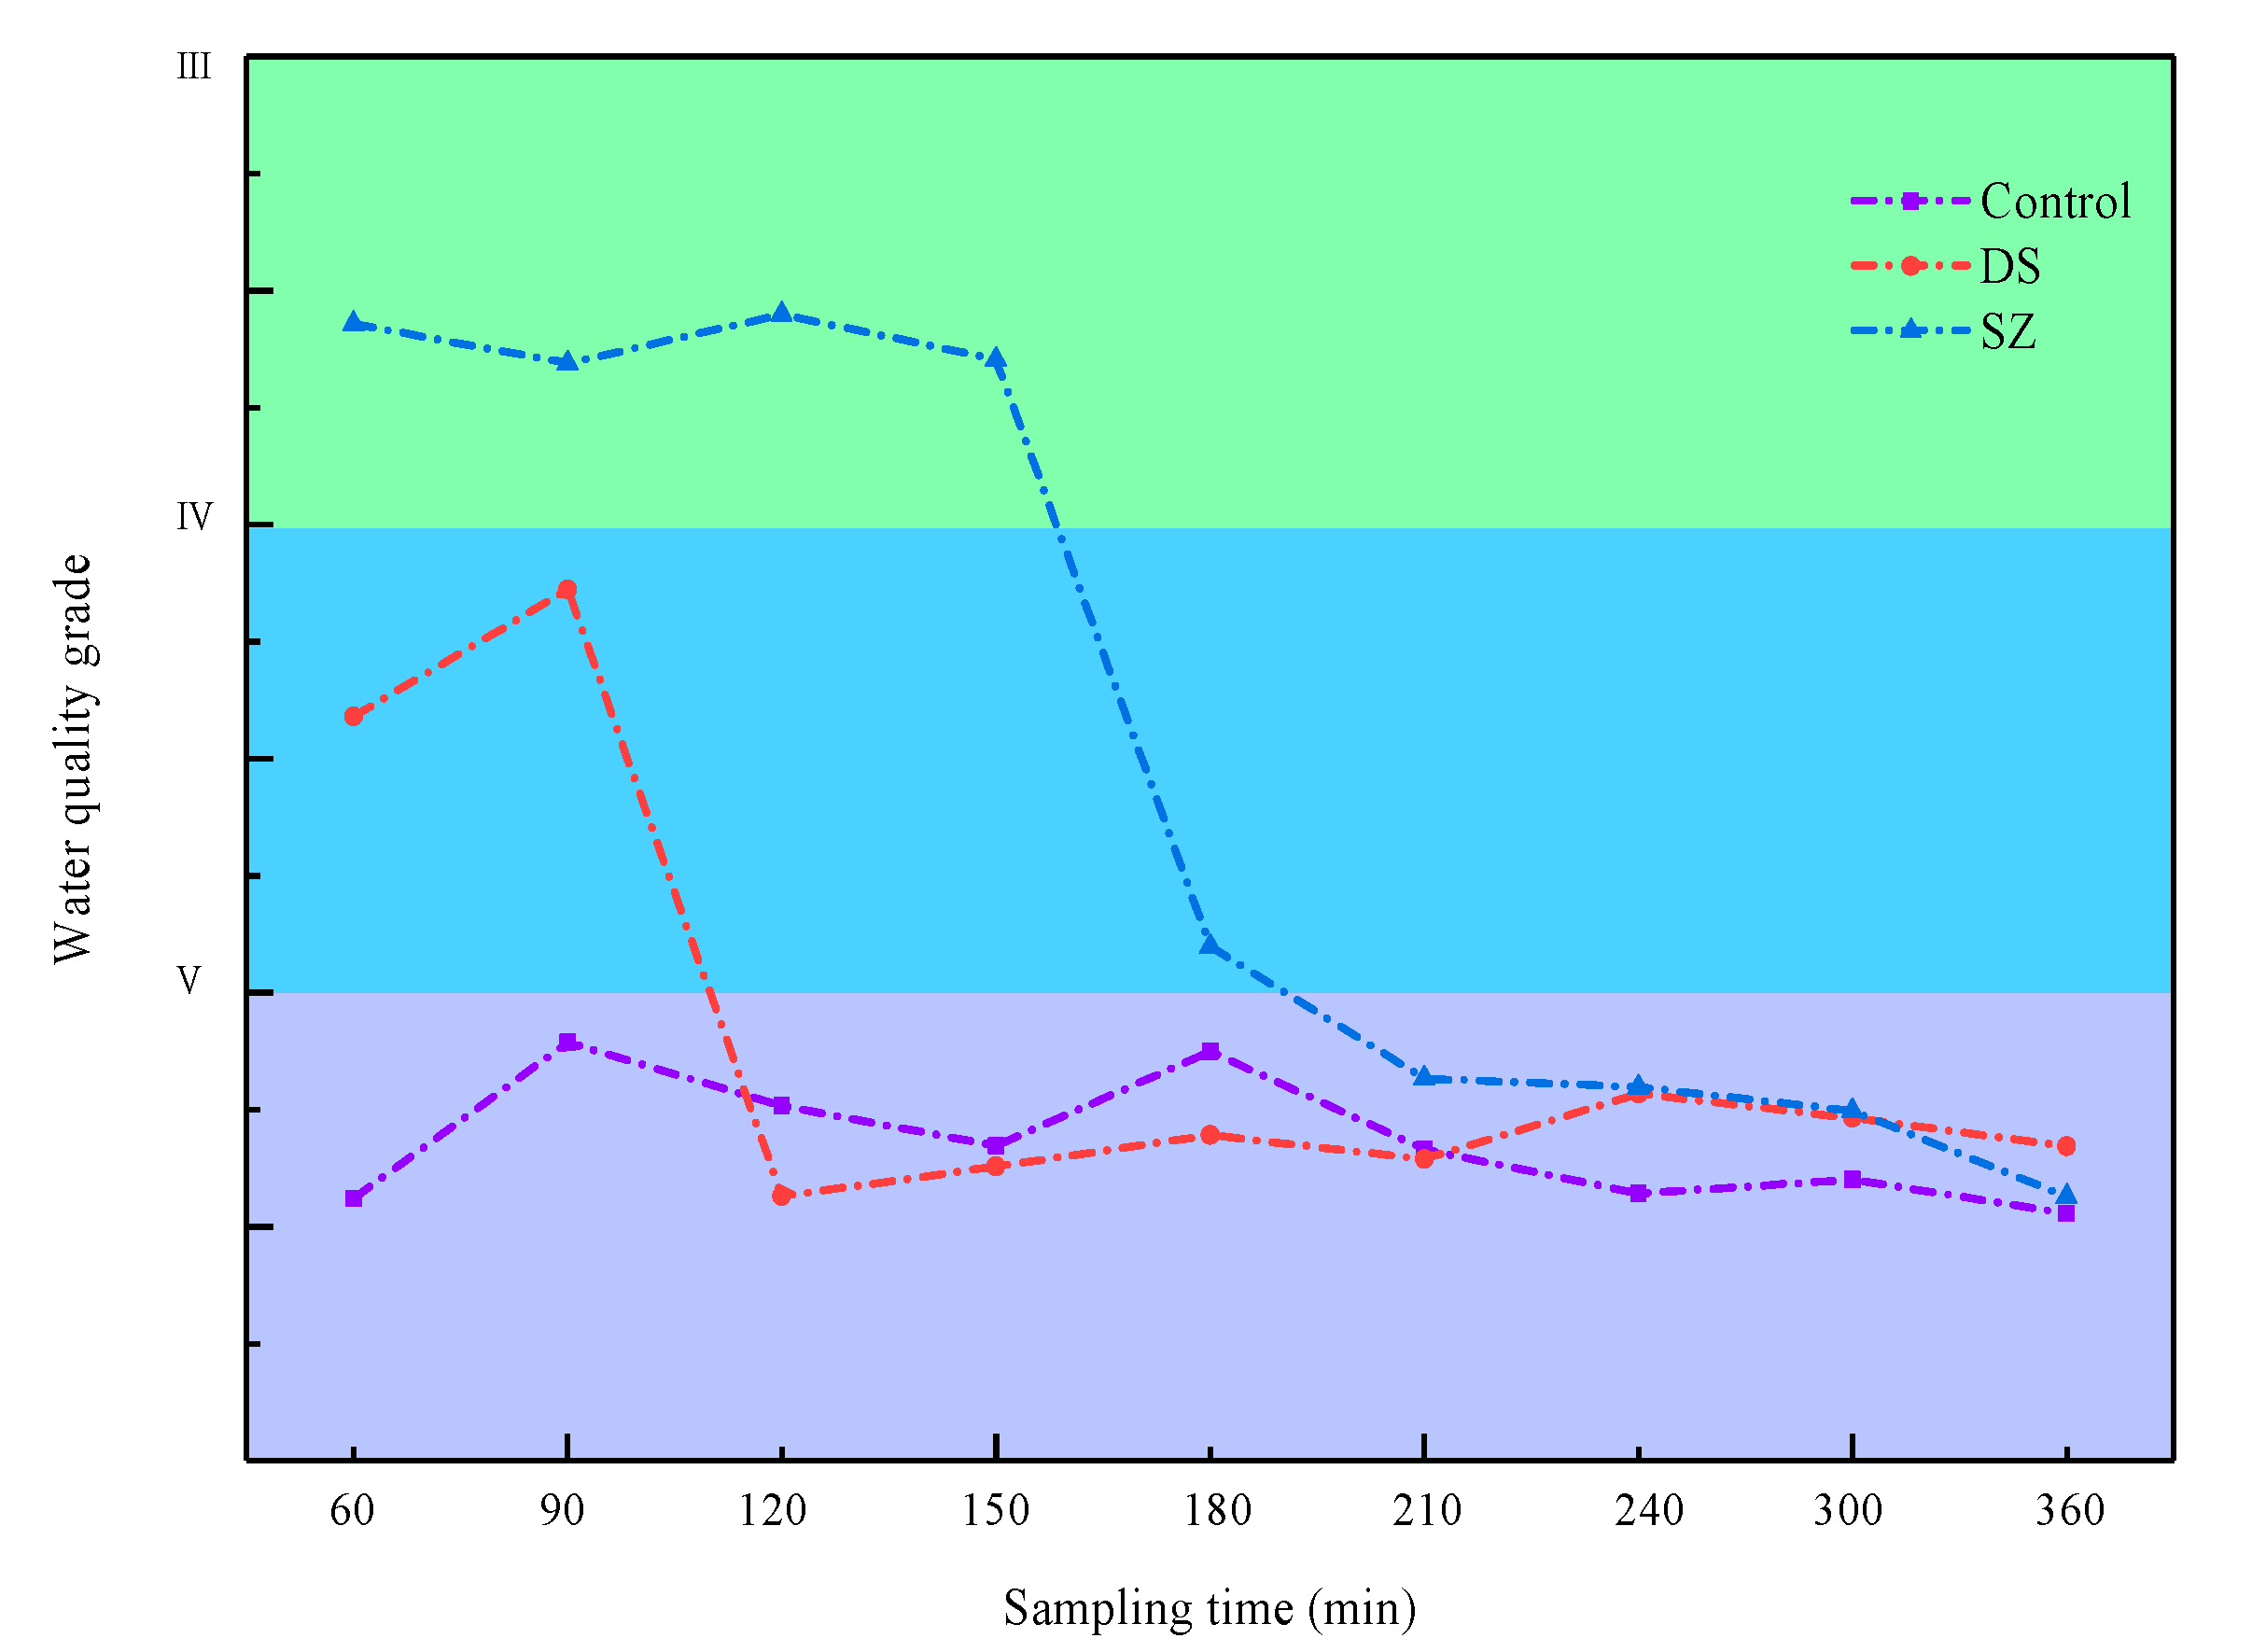
3.4. Evaluation of Water Quality in Bioretention Systems

The calculation results of membership and weight coefficient are shown in Table 4 and Table 5. In the three different bioretention systems, the TN had the highest weighted value in terms of the pollution factor. Focusing on the TN values, the weighted value of bioretention with the saturated zone was found to be higher than the other two, with the weight of the initial outflow above 0.6. This means that dealing with TN in bioretention systems is more complicated. As the rainfall extends, the weights of Ammonia and Nitrogen in the control and DS groups are increased, while the TN weight decreases. However, in the SZ group, the weights of Ammonia and Nitrogen are stable, which suggests that in the precipitation process, bioretention is relatively stable given the saturated zone’s ability to purify rainwater.
Figure 12 shows the effluent’s water quality evaluation grade in the different bioretention systems. With the increase in rainfall time, the bioretention systems’ effluent water quality was found to have a declining trend. The order of effluent water quality for the complete rainfall process is SZ > DS > Control. In the first three hours, the B* of SZ was 3.57, and the water quality reached the Grade IV standard for surface water, which is higher than the effluent water quality in the Control (below Grade V) and in the DS (Grade V). By the 4th hour of rainfall, the effluent water quality of all the three detention ponds was below Grade V. Although the water quality evaluation result of SZ was below the Grade V level, the FCI B* was measured at 5.401, which is close to the water quality standard of Grade V. This suggests that, in general, the SZ system can effectively control the amount of ammonia-nitrogen, TN, and TP in stormwater runoff. The application of the FCI method in evaluating water quality in bioretention systems is able to show the changes in effluent water quality during a rainfall event and determine the primary components of water pollution at specific time periods.

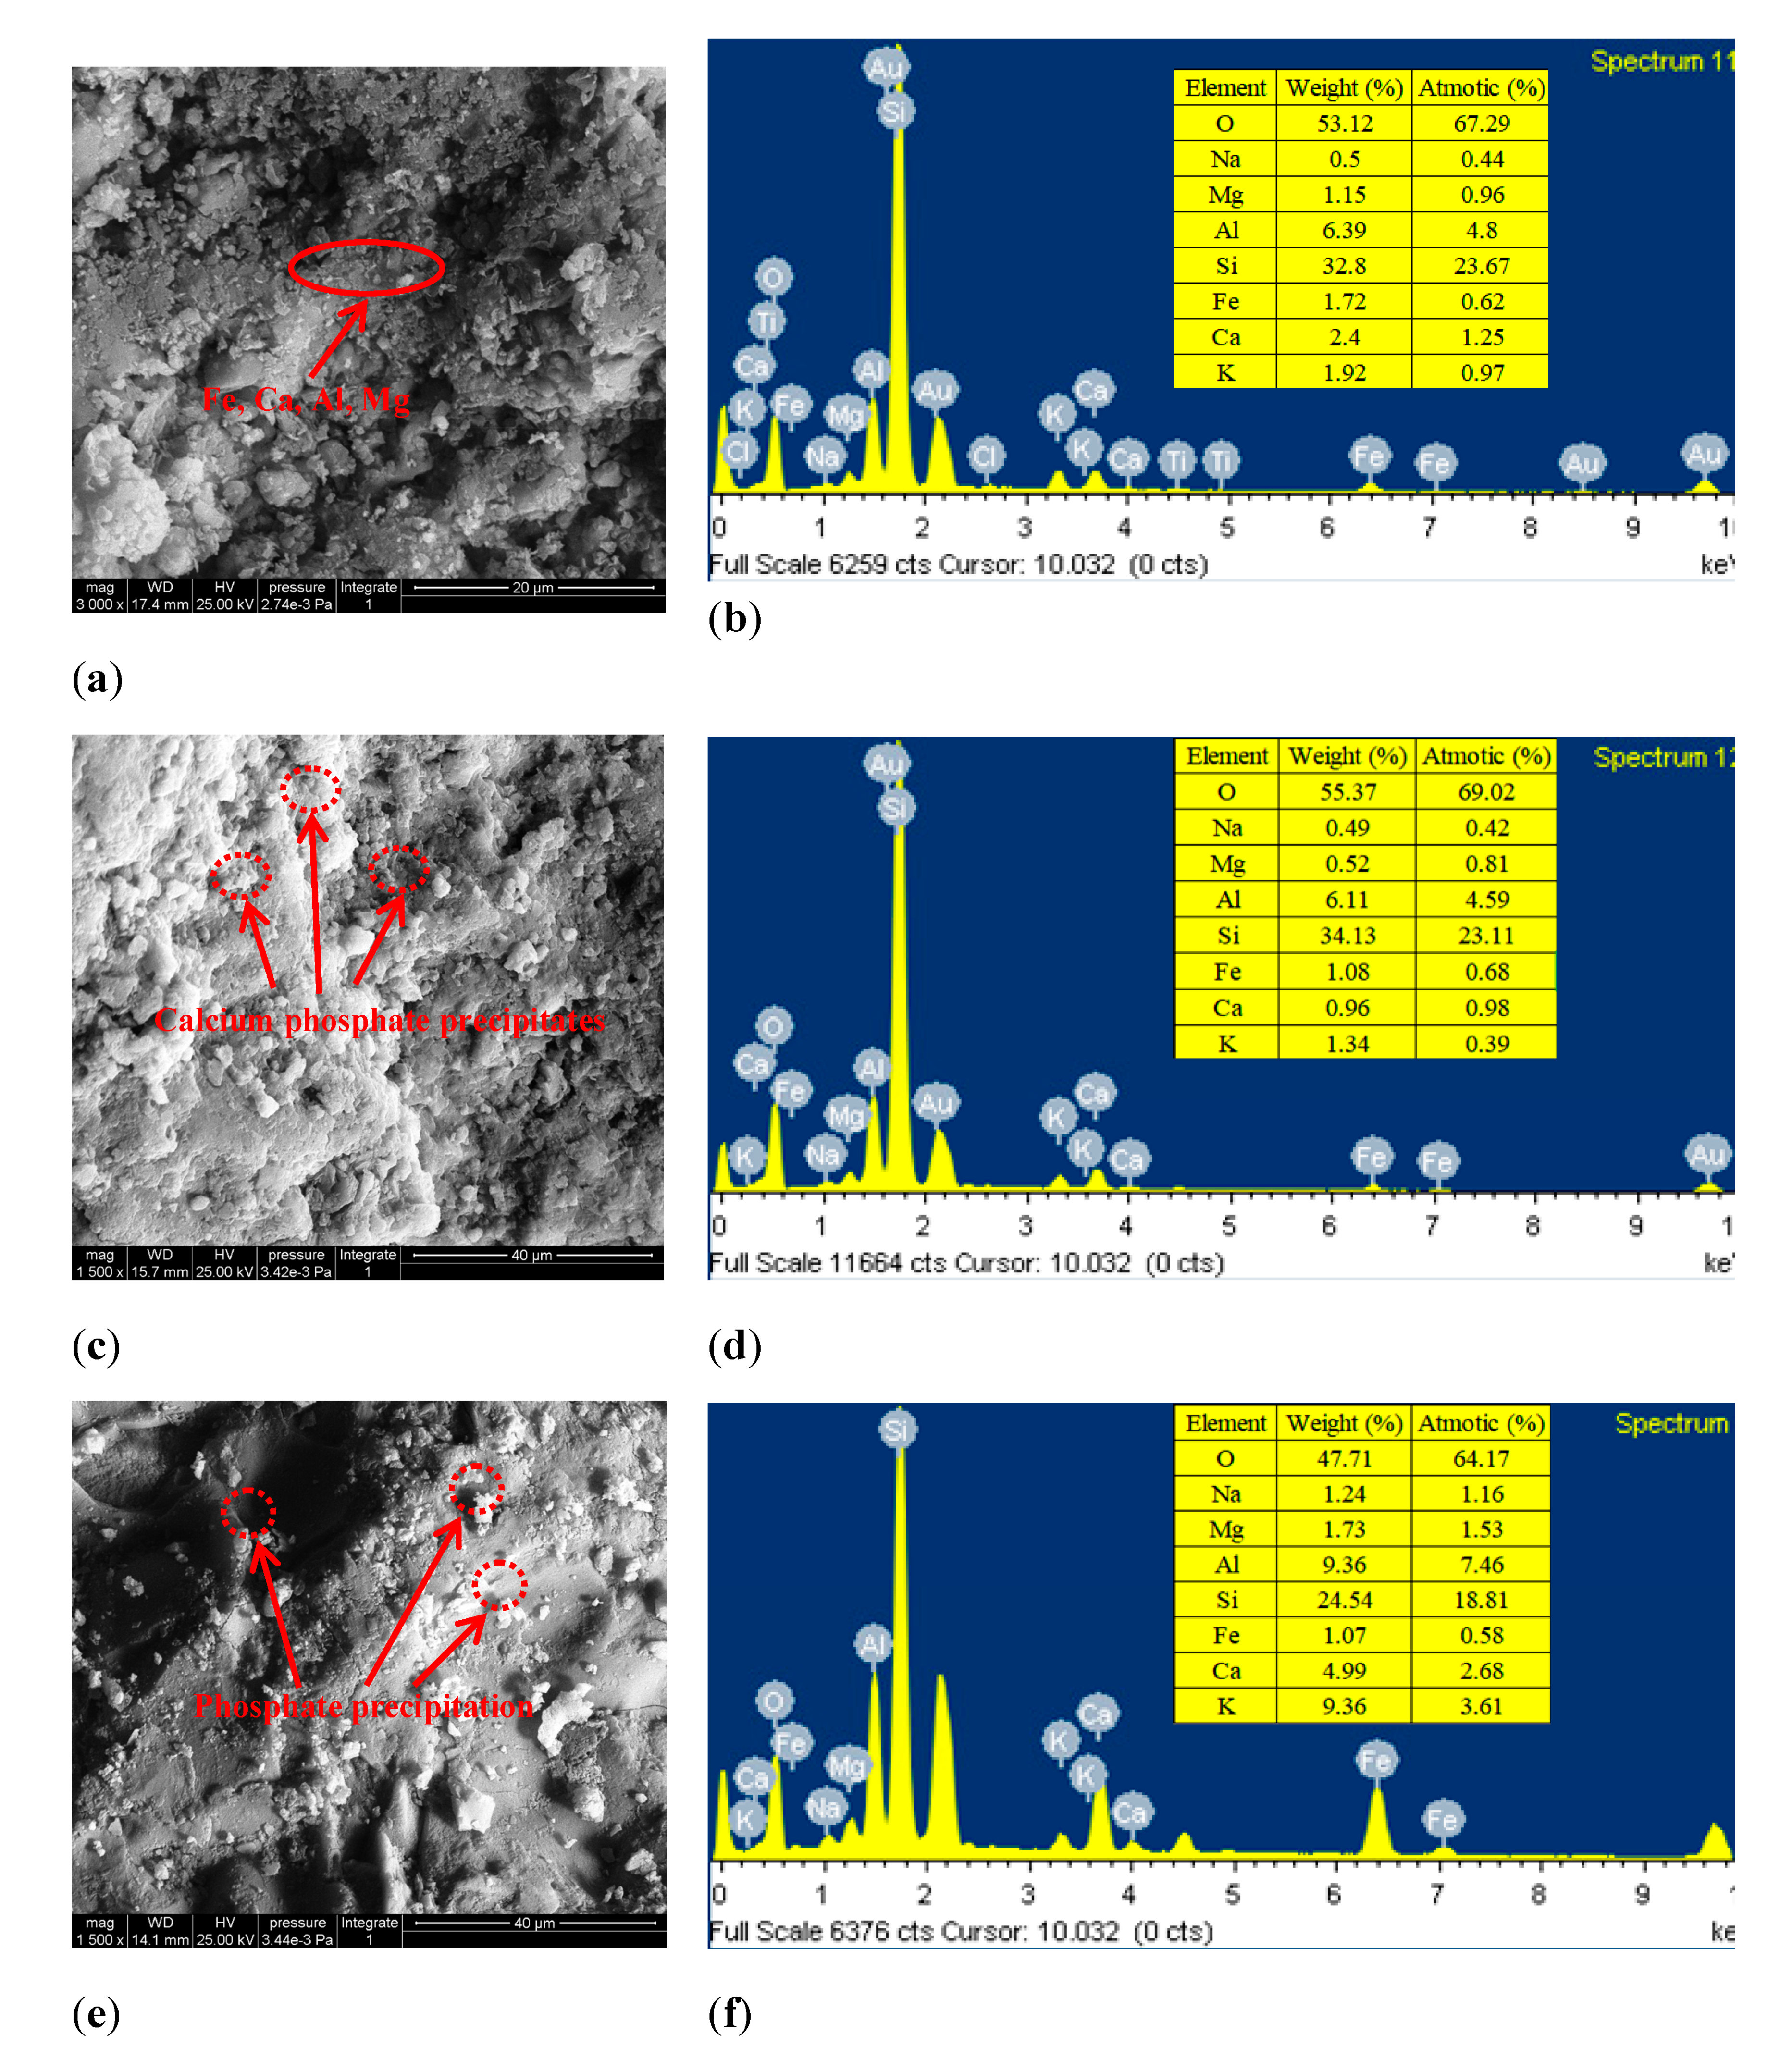
3.5. Study on the Adsorption Mechanism

SEM was performed to further explore the micro-morphology of the media and its changes in the operations of the bioretention systems (Figure 13a–d). Zeolite has a rough surface, folded, and a compact micropore structure. The micropore structure of 1–5 μm is distributed all over the media surface. It can provide an ideal environment for the growth of the biofilm and can improve the bio-load and ion exchange performance. Figure 12 are the surfaces of post-experiment zeolite, sponge iron, and limestone, respectively. Compared to the original zeolite (Figure 13a), the zeolite used after the experiment exhibited a rough surface and more crystals. Polyhedral crystal aggregates and phosphate precipitates were formed on the surface of the media due to the adsorption of phosphorus. Previous studies have also reported the formation of precipitates on the surface of similar materials [30,47]. EDS results showed that the main elements on the surface of limestone and sponge iron were calcium, iron, aluminum, and silicon (Figure 12). The EDS peak intensity of Ca, Al, and Fe in the media decreased after the rainfall test (Figure 12). Combined with the results of SEM, the formation of phosphorus peaks in the media after rainfall indicates that phosphate precipitation has occurred on the surface of the media, and the possible reactions are as follows in Equations (10)–(12):
2 C a O H + H 2 P O 4 ( C a ) 2 H P O 4 + H 2 O + O H
2 A l O H + H 2 P O 4 ( A l ) 2 H P O 4 + H 2 O + O H
2 F e O H + H 2 P O 4 ( F e ) 2 H P O 4 + H 2 O + O H
The XRD patterns, as shown in Figure 14, indicate that both zeolite and limestone have regular crystal structures, before and after the simulated rainfall. The characteristic diffraction peaks did not change significantly, which suggests that the crystal structure of the zeolite and the limestone did not transform during rainwater purification. Although the results of the SEM and EDS suggest that phosphate precipitates are present on the surface of zeolite and limestone, the characteristic peaks for phosphate were not found by XRD. This indicates that the chemical interaction between the cations and the zeolites may have occurred mainly on the surface of the media [12]. It is also possible that the characteristic diffraction peaks of phosphate coincide with those of zeolite and limestone [30,48].
The media in the bioretention system serves as the carrier of microorganism and facilitator for plant growth and is also where physical, chemical, and biological reactions take place. Plants absorb pollutants directly from the water, while the presence of microorganisms in the root zone is beneficial for plant growth, as illustrated in Figure 15. The removal of pollutants by the bioretention system uses the media as the attachment point and the reaction interface. Through the interaction of microorganisms and plants, the pollutants are removed through microbial decomposition and utilization, media adsorption and precipitation, and plant harvesting.
The removal efficiency of NH4+-N in the present study was studied by the single factor experiment method. Generally, there are multiple factors simultaneously influencing the removal performance of bioretention system with plants and saturated areas in practical conditions. For example, adsorption, nitrification, denitrification, and the removal efficiency are influenced by temperature, and the bioretention system can reach very low temperatures on cold winter days. Therefore, for practical considerations, further research focusing on the influence of local weather conditions, stormwater composition, and load levels, on the removal of nutrients and heavy metals from stormwater runoff are recommended.

4. Conclusions

Understanding the dynamics and effectivity of bioretention systems is an essential step in creating effective measures to control stormwater runoff pollution. In this study, saturated zone and plants were introduced into the conventional bioretention system to determine the influence of rainfall intensity, concentration, and antecedent dry periods on stormwater runoff treatment performance, in terms of effluent quality, adsorption, and complexation. The results show that nitrogen and phosphorus removal could significantly be improved by introducing saturated zones and plants for different rainfall intensities, concentrations, and wet-dry cycles. In the early stages of rainfall, the quality of effluent water from bioretention systems can reach water quality standards of Grade III and IV for surface water in China, but the effluent quality deteriorated over time. The results indicate that the combined use of saturated areas, media, plants, and microorganisms in the bioretention system is an effective measure for ecological purification. According to the SEM-EDS analysis, phosphate precipitates were found to have formed on the media surface after the adsorption. The XRD analysis shows that the original crystal structure of the media does not change during rainwater infiltration. Rainfall intensity can significantly influence the removal of pollutants in the bioretention systems. The results suggest longer rainfall recurrence intervals would result in reduced treatment capacity of bioretention systems in normal events. In terms of removal efficiency, the dry period was found to have a negative correlation for TP and a positive correlation for TN; however, it showed little effect on the removal efficiency for NH4+-N. Further research on road surface runoff management can focus on the microbial mechanisms towards long-term purification and the transformation mechanism of nitrogen.

Author Contributions

Conceptualization, H.L. and Z.J.; methodology, X.C.; software, B.H.; validation, M.T.; formal analysis, L.G.; investigation, Y.W.; resources, S.Z.; data curation, L.G., X.C. and Z.Z.; writing—original draft preparation, H.L.; writing—review and editing, Z.J.; visualization, B.H., Z.Z. and X.C.; supervision, Z.J.; project administration, Z.J.; funding acquisition, Z.J. All authors have read and agreed to the published version of the manuscript.

Funding

This research was funded by the National Science and Technology Support Program, grant number 2015BAL02B04, and the Technology Project of China Housing and Urban-Rural Development Ministry, grant number 2015-K7-012; a Project Funded by the National First-class Disciplines (PNFD), and a Project Funded by the Priority Academic Program Development of Jiangsu Higher Education Institutions (PAPD).

Acknowledgments

The authors would like the anonymous reviewers for their insightful suggestions. Thanks also to Chen Chen and Chonghao Wang for their help in the laboratory experiments.

Conflicts of Interest

The authors declare no conflict of interest. The funders had no role in the design of the study; in the collection, analyses, or interpretation of data; in the writing of the manuscript, or in the decision to publish the results.

References

  1. Liu, Y.; Engel, B.A.; Flanagan, D.C.; Gitau, M.W.; McMillan, S.K.; Chaubey, I. A review on effectiveness of best management practices in improving hydrology and water quality: Needs and opportunities. Sci. Total Environ. 2017, 601–602, 580–593. [Google Scholar] [CrossRef] [PubMed]
  2. Xu, X.; Xu, Z.; Chen, L.; Li, C. How Does Industrial Waste Gas Emission Affect Health Care Expenditure in Different Regions of China: An Application of Bayesian Quantile Regression. Int. J. Environ. Res. Public Health 2019, 16, 2748. [Google Scholar] [CrossRef] [PubMed] [Green Version]
  3. Xu, X.; Huang, X.; Huang, J.; Gao, X.; Chen, L. Spatial-Temporal Characteristics of Agriculture Green Total Factor Productivity in China, 1998–2016: Based on More Sophisticated Calculations of Carbon Emissions. Int. J. Environ. Res. Public Health 2019, 16, 3932. [Google Scholar] [CrossRef] [PubMed] [Green Version]
  4. Chen, L.; Long, C.; Wang, D.; Yang, J. Phytoremediation of cadmium (Cd) and uranium (U) contaminated soils by Brassica juncea L. enhanced with exogenous application of plant growth regulators. Chemosphere 2020, 242, 125112. [Google Scholar] [CrossRef] [PubMed]
  5. Cottrell, B.A.; Gonsior, M.; Isabelle, L.M.; Luo, W.; Perraud, V.; McIntire, T.M.; Pankow, J.F.; Schmitt-Kopplin, P.; Cooper, W.J.; Simpson, A.J. A regional study of the seasonal variation in the molecular composition of rainwater. Atmos. Environ. 2013, 77, 588–597. [Google Scholar] [CrossRef]
  6. Pumo, D.; Arnone, E.; Francipane, A.; Caracciolo, D.; Noto, L.V. Potential implications of climate change and urbanization on watershed hydrology. J. Hydrol. 2017, 554, 80–99. [Google Scholar] [CrossRef]
  7. Kang, A.H.; Mao, H.W.; Li, B.; Kou, C.J.; Xu, X.L.; Jahangiri, B. Investigation of selective filtration characteristics of filter media for pavement runoff treatment. J. Clean. Prod. 2019, 235, 590–602. [Google Scholar] [CrossRef]
  8. Straffelini, G.; Ciudin, R.; Ciotti, A.; Gialanella, S. Present knowledge and perspectives on the role of copper in brake materials and related environmental issues: A critical assessment. Environ. Pollut. 2015, 207, 211–219. [Google Scholar] [CrossRef]
  9. Lange, K.; Osterlund, H.; Viklander, M.; Blecken, G.T. Metal speciation in stormwater bioretention: Removal of particulate, colloidal and truly dissolved metals. Sci. Total Environ. 2020, 724, 138121. [Google Scholar] [CrossRef]
  10. Chen, L.; Wang, Z.; Jing, Z.; Cao, S.; Yu, T. Accumulation and risk of triclosan in surface sediments near the outfalls of municipal wastewater treatment plants. Bull. Environ. Contam. Toxicol. 2015, 95, 525–529. [Google Scholar] [CrossRef]
  11. Gao, Y.; Jia, Y.L.; Yu, G.R.; He, N.P.; Zhang, L.; Zhu, B.; Wang, Y.F. Anthropogenic reactive nitrogen deposition and associated nutrient limitation effect on gross primary productivity in inland water of China. J. Clean. Prod. 2019, 208, 530–540. [Google Scholar] [CrossRef]
  12. Kou, C.J.; Kang, A.H.; Xiao, P.; Mikhailenko, P.; Baaj, H.; Sun, L.; Wu, Z.G. A source pollution control measure based on spatial-temporal distribution characteristic of the runoff pollutants at urban pavement sites. Appl. Sci. 2018, 8, 1802. [Google Scholar] [CrossRef] [Green Version]
  13. Zhao, Y.; Zhou, S.Y.; Zhao, C.; Valeo, C. The influence of geotextile type and position in a porous asphalt pavement system on Pb (II) removal from stormwater. Water 2018, 10, 1205. [Google Scholar] [CrossRef] [Green Version]
  14. Beza, B.B.; Zeunert, J.; Hanson, F. The role of WSUD in contributing to sustainable urban settings. In Approaches to Water Sensitive Urban Design, Sharma, A.K., Gardner, T., Begbie, D., Eds.; Elsevier: Amsterdam, The Netherlands, 2019; pp. 367–380. [Google Scholar]
  15. Li, Q.; Wang, F.; Yu, Y.; Huang, Z.C.; Li, M.T.; Guan, Y.T. Comprehensive performance evaluation of LID practices for the sponge city construction: A case study in Guangxi, China. J. Environ. Manag. 2019, 231, 10–20. [Google Scholar] [CrossRef]
  16. He, B.J.; Zhu, J.; Zhao, D.X.; Gou, Z.H.; Qi, J.D.; Wang, J.S. Co-benefits approach: Opportunities for implementing sponge city and urban heat island mitigation. Land Use Policy 2019, 86, 147–157. [Google Scholar] [CrossRef]
  17. Wang, J.S.; Meng, Q.L.; Zhang, L.; Zhang, Y.; He, B.J.; Zheng, S.L.; Santamouris, M. Impacts of the water absorption capability on the evaporative cooling effect of pervious paving materials. Build. Environ. 2019, 151, 187–197. [Google Scholar] [CrossRef]
  18. Davis, A.P.; Stagge, J.H.; Jamil, E.; Kim, H. Hydraulic performance of grass swales for managing highway runoff. Water Res. 2012, 46, 6775–6786. [Google Scholar] [CrossRef]
  19. Jia, H.F.; Lu, Y.W.; Yu, S.L.; Chen, Y.R. Planning of LID-BMPs for urban runoff control: The case of Beijing Olympic Village. Sep. Purif. Technol. 2012, 84, 112–119. [Google Scholar] [CrossRef]
  20. Grebel, J.E.; Mohanty, S.K.; Torkelson, A.A.; Boehm, A.B.; Higgins, C.P.; Maxwell, R.M.; Nelson, K.L.; Sedlak, D.L. Engineered infiltration systems for urban stormwater reclamation. Environ. Eng. Sci. 2013, 30, 437–454. [Google Scholar] [CrossRef]
  21. Boelee, N.C.; Temmink, H.; Janssen, M.; Buisman, C.J.N.; Wijffels, R.H. Nitrogen and phosphorus removal from municipal wastewater effluent using microalgal biofilms. Water Res. 2011, 45, 5925–5933. [Google Scholar] [CrossRef]
  22. Bassin, J.P.; Pronk, M.; Kraan, R.; Kleerebezem, R.; van Loosdrecht, M.C.M. Ammonium adsorption in aerobic granular sludge, activated sludge and anammox granules. Water Res. 2011, 45, 5257–5265. [Google Scholar] [CrossRef] [PubMed]
  23. Norton, R.A.; Harrison, J.A.; Keller, C.K.; Moffett, K.B. Effects of storm size and frequency on nitrogen retention, denitrification, and N2O production in bioretention swale mesocosms. Biogeochemistry 2017, 134, 353–370. [Google Scholar] [CrossRef]
  24. Chen, X.L.; Peltier, E.; Sturm, B.S.M.; Young, C.B. Nitrogen removal and nitrifying and denitrifying bacteria quantification in a stormwater bioretention system. Water Res. 2013, 47, 1691–1700. [Google Scholar] [CrossRef] [PubMed]
  25. Jiang, C.B.; Li, J.K.; Li, H.E.; Li, Y.J. Remediation and accumulation characteristics of dissolved pollutants for stormwater in improved bioretention basins. Sci. Total Environ. 2019, 685, 763–771. [Google Scholar] [CrossRef]
  26. Fan, G.D.; Li, Z.S.; Wang, S.M.; Huang, K.S.; Luo, J. Migration and transformation of nitrogen in bioretention system during rainfall runoff. Chemosphere 2019, 232, 54–62. [Google Scholar] [CrossRef]
  27. Li, J.K.; Davis, A.P. A unified look at phosphorus treatment using bioretention. Water Res. 2016, 90, 141–155. [Google Scholar] [CrossRef]
  28. Wang, Z.; Zhong, M.G.; Chen, L. Coal-based granular activated carbon loaded with MnO2 as an efficient adsorbent for removing formaldehyde from aqueous solution. Desalin. Water Treat. 2016, 57, 13225–13235. [Google Scholar] [CrossRef]
  29. Wang, R.D.; Peng, Y.Z.; Cheng, Z.L.; Ren, N.Q. Understanding the role of extracellular polymeric substances in an enhanced biological phosphorus removal granular sludge system. Bioresour. Technol. 2014, 169, 307–312. [Google Scholar] [CrossRef]
  30. You, Z.Y.; Zhang, L.; Pan, S.Y.; Chiang, P.C.; Pei, S.L.; Zhang, S.J. Performance evaluation of modified bioretention systems with alkaline solid wastes for enhanced nutrient removal from stormwater runoff. Water Res. 2019, 161, 61–73. [Google Scholar] [CrossRef]
  31. Luo, Y.; Yue, X.; Duan, Y.; Zhou, A.; Gao, Y.; Zhang, X. A bilayer media bioretention system for enhanced nitrogen removal from road runoff. Sci. Total Environ. 2020, 705, 135893. [Google Scholar] [CrossRef]
  32. Mangum, K.R.; Yan, Q.; Ostrom, T.K.; Davis, A.P. Nutrient leaching from green waste compost addition to stormwater submerged gravel wetland mesocosms. J. Environ. Eng. 2020, 146, 04019128. [Google Scholar] [CrossRef]
  33. Skorobogatov, A.; He, J.; Chu, A.; Valeo, C.; Duin, B. The impact of media, plants and their interactions on bioretention performance: A review. Sci. Total Environ. 2020, 715, 136918. [Google Scholar] [CrossRef] [PubMed]
  34. Lin, L.F.; Li, T.; Li, H. Characteristics of surface runoff pollution of Shanghai urban area. Environ. Sci. 2007, 28, 1430–1434. [Google Scholar]
  35. Li, L.Q.; Yin, C.Q. Transport and sources of runoff pollution from urban area with combined sewer system. Environ. Sci. 2009, 30, 368–375. [Google Scholar]
  36. Li, L.Q.; Shan, B.Q.; Zhao, J.W.; Guo, S.G.; Gao, Y. Research on stormwater runoff quality of mountain city by source area monitoring. Environ. Sci. 2012, 33, 3397–3403. [Google Scholar]
  37. Tirpak, R.A.; Hathaway, J.M.; Franklin, J.A. Investigating the hydrologic and water quality performance of trees in bioretention mesocosms. J. Hydrol. 2019, 576, 65–71. [Google Scholar] [CrossRef]
  38. Guo, X.F.; Guo, Z.H.; Zhuang, Q. Environmental assessment and evolution analysis of water quality in the Xiamen West Sea based on fuzzy mathematics. Fresen. Environ. Bull. 2019, 28, 10052–10057. [Google Scholar]
  39. Xiao, Y.; Huang, S.L.; Zhou, J.G.; Kong, F.Q.; Liu, M.Z.; Li, Y. Risk assessment of upper-middle reaches of Luanhe River Basin in sudden water pollution incidents based on control units of water function areas. Water 2018, 10, 1268. [Google Scholar] [CrossRef] [Green Version]
  40. Li, F.; Qiu, Z.Z.; Zhang, J.D.; Liu, C.Y.; Cai, Y.; Xiao, M.S.; Zhu, L.Y. Temporal variation of major nutrients and probabilistic eutrophication evaluation based on stochastic-fuzzy method in Honghu Lake, Middle China. Sci. China Technol. Sci. 2019, 62, 417–426. [Google Scholar] [CrossRef]
  41. Liu, B.; Huang, J.J.; McBean, E.; Li, Y. Risk assessment of hybrid rain harvesting system and other small drinking water supply systems by game theory and fuzzy logic modeling. Sci. Total Environ. 2020, 708, 134436. [Google Scholar] [CrossRef]
  42. Singh, S.; Ghosh, N.C.; Gurjar, S.; Krishan, G.; Kumar, S.; Berwal, P. Index-based assessment of suitability of water quality for irrigation purpose under Indian conditions. Environ. Monit. Assess. 2018, 190, 29. [Google Scholar] [CrossRef] [PubMed]
  43. Lucas, W.C.; Greenway, M. Nutrient retention in vegetated and nonvegetated bioretention mesocosms. J. Irrig. Drain. Eng. 2008, 134, 613–623. [Google Scholar] [CrossRef]
  44. Davis, A.P.; Shokouhian, M.; Sharma, H.; Minami, C. Water quality improvement through bioretention media: Nitrogen and phosphorus removal. Water Environ. Res. 2006, 78, 284–293. [Google Scholar] [CrossRef]
  45. Rosenquist, S.E.; Hession, W.C.; Eick, M.J.; Vaughan, D.H. Variability in adsorptive phosphorus removal by structural stormwater best management practices. Ecol. Eng. 2010, 36, 664–671. [Google Scholar] [CrossRef] [Green Version]
  46. Zhao, Y.J.; Guo, G.Y.; Sun, S.Q.; Hu, C.W.; Liu, J. Co-pelletization of microalgae and fungi for efficient nutrient purification and biogas upgrading. Bioresour. Technol. 2019, 289, 121656. [Google Scholar] [CrossRef] [PubMed]
  47. Okochi, N.C. Phosphorus Removal from Stormwater Using Electric ARC Furnace Steel Slag. Ph.D. Thesis, University of Regina, Regina, SK, Canada, 2013. [Google Scholar]
  48. Huang, H.M.; Xiao, D.; Pang, R.; Han, C.C.; Ding, L. Simultaneous removal of nutrients from simulated swine wastewater by adsorption of modified zeolite combined with struvite crystallization. Chem. Eng. J. 2014, 256, 431–438. [Google Scholar] [CrossRef]
Figure 1. Schematic diagram of the bioretention columns (Control: conventional bioretention with soil, sand, and gravel; DS: column without saturation area; SZ: column with a 400 mm high-saturated zone at the bottom). Hpz: ponding zone depth, Hwr: water-retaining layer depth, Hus: unsaturated zone deepth, Hsz: submerged zone, H: depth of media layer, Hcl: catchment layer (H = Hwr + Hus + Hsz).
Applsci 10 03148 g001
Figure 2. Artificial rainfall event design.
Applsci 10 03148 g002
Figure 3. Concentration of total phosphorous (TP) using bioretention systems with the Control column, DS column, and SZ column under 1a (a), 5a (b), and 10a (c) rainfall intensities.
Applsci 10 03148 g003
Figure 4. Concentration of NH4+-N using bioretention systems with the Control column, DS column, and SZ column under 1a (a), 5a (b), and 10a (c) rainfall intensities.
Applsci 10 03148 g004
Figure 5. Concentration of NO3-N using bioretention systems with the Control column, DS column, and SZ column under 1a (a), 5a (b), and 10a (c) rainfall intensities.
Applsci 10 03148 g005
Figure 6. Concentration of TN using bioretention systems with the Control column, DS column, and SZ column under 1a (a), 5a (b), and 10a (c) rainfall intensities.
Applsci 10 03148 g006
Figure 7. Efficiency of NH4+-N removal using bioretention systems with the (a) Control column, (b) DS column, and (c) SZ column during different antecedent dry periods.
Applsci 10 03148 g007
Figure 8. The efficiency of NO3--N removal using bioretention systems with the (a) Control column, (b) DS column, and (c) SZ column during different antecedent dry periods.
Applsci 10 03148 g008
Figure 9. The efficiency of TN removal using bioretention systems with the (a) Control column, (b) DS column, and (c) SZ column during different antecedent dry periods.
Applsci 10 03148 g009
Figure 10. The efficiency of TP removal using bioretention systems with the Control column, DS column, and SZ column during different antecedent dry periods.
Applsci 10 03148 g010
Figure 11. Removal efficiency of (a) TP, (b) NO3-N, (c) NH4+-N, and (d) TN (total nitrogen) with different concentration in bioretention systems.
Applsci 10 03148 g011
Figure 12. The assessment results of filtered runoff water quality in different bioretention systems.
Applsci 10 03148 g012
Figure 13. The figure shows the SEM images for (a) the zeolite before tests; (b) the zeolite after tests; (c) the post-experiment sponge iron; and, (d) the post-experiment limestone. The EDS spectrum is also illustrated for the following samples: (e) pre-experiment zeolite; (f) post-experiment zeolite; (g) post-experiment sponge iron; and, (h) post-experiment limestone.
Applsci 10 03148 g013
Figure 14. The XRD pattern of zeolite and basalt aggregates, Limestone after adsorption of the test (Limestone-N-P) and Zeolite after simultaneous adsorption of ammonium and phosphate (Zeolite-N-P)
Applsci 10 03148 g014
Figure 15. Mechanism of pollutant removal combined flora-microbe-media in bioretention.
Applsci 10 03148 g015
Table 1. Filling method for media layer in the infiltration column.
Media LayerFilling FormatHeight
ControlDSSZ
Water-retention layerLocal soil (20%) mixed with sand (80%)10 cm
Adsorption layerZeolite: Volcanic rock: Sponge iron = 1:1:1 (volume ratio), layered filling, grain size of 1–2 mmZeolite: Volcanic rock: Sponge iron = 1:1:1 (volume ratio), mixed filling, grain size of 1–2 mm60 cm
Filter layerA non-woven permeable geotextile membrane/
Catchment layerCrushed limestone gravel (grain size of 5–10 mm, void space of 34%)5 cm
Table 2. Two types of concentrations for synthetic runoff used in this study.
ProjectComponents
TP (mg/L)NH4+-N (mg/L)NO3-N (mg/L)COD (mg/L)pHTemp (°C)
Typical concentration (normal event)1.2 ± 0.13.0 ± 0.31.5 ± 0.1100.0 ± 3.07.0 ± 0.322.0 ± 2.0
High concentration (extreme event)2.4 ± 0.16.0 ± 0.33.0 ± 0.4200.0 ± 6.07.0 ± 0.322.0 ± 2.0
SourceKH2PO4NH4ClKNO3NaNO2NaOH/HCl/
Table 3. Six-hour rainfall in different return periods.
Recurrence Interval (Year)Percent Chance of Occurrence in Any YearMean Rainfall Intensity (mm/min)Rain Intensity of Six Hours (L/s·ha)Rainfall in Six Hours (mm)
1a1000.153225.543655.1689
5a200.242940.486587.4333
10a100.281546.9206101.3289
Table 4. The memberships of the pollution factors in water samples on the quality standards.
Sampling Time (min)GradeControlDSSZ
NH4+-NTNTPNH4+-NTNTPNH4+-NTNTP
60I0000000.394800
II0.6195000.8675000.605200.6027
III0.380500.68560.132500.912400.1690.3973
IV000.314400.1520.087600.8310
V00000.8480000
Worse V010000000
90I000000000
II0.2621000.3861000.801900.2807
III0.737900.89980.613900.32020.198100.7193
IV000.100200.3410.679800.6560
V00000.659000.3440
Worse V010000000
120I000000000
II0.0287000.5174000.422600
III0.971300.52180.482600.52180.577400.9124
IV000.4782000.478200.9170.0876
V00000000.0830
Worse V010010000
150I000000000
II0000.1308000.342400.0007
III0.627600.26980.869200.05560.657600.9993
IV0.372400.7302000.944400.5030
V00000000.4970
Worse V010010000
180I000000000
II000000000
III0.057200.05560.782600.15640.925200.7612
IV0.942800.94440.217400.84360.074800.2388
V000000000
Worse V010010010
210I000000000
II000000000
III0.1936000.5408000.999600.4588
IV0.806400.65240.459200.80360.000400.5412
V000.3476000.1964000
Worse V010010010
240I000000000
II000000000
III0000.1502000.745400.2446
IV0.74100.1610.849800.65240.254600.7554
V0.25900.839000.3476000
Worse V010010010
300I000000000
II000000000
III0000.051000.565600
IV0.567400.42560.94900.56420.434400.9548
V0.432600.5744000.4358000.0452
Worse V010010010
360I000000000
II000000000
III0000000.770200
IV0.331800.29960.666600.51380.229800.7532
V0.668200.70040.333400.4862000.2468
Worse V010010010
Table 5. The weights of the pollution factors in water samples.
Sampling Time (min)ControlDSSZ
NH4+-NTNTPNH4+-NTNTPNH4+-NTNTP
600.14680.57680.27640.13420.58360.28220.12140.61920.2594
900.19270.56350.24380.18020.48120.33860.16720.57550.2573
1200.18670.56050.25280.15430.55510.29070.21520.48250.3024
1500.21290.53110.25610.16940.52950.30110.21240.52150.2660
1800.23980.51790.24230.20000.52430.27570.22370.52680.2495
2100.21790.51040.27170.20380.51290.28330.19290.54210.2650
2400.24530.45490.29980.23240.48310.28440.21620.50310.2807
3000.26110.46260.27640.22810.49570.27620.21080.50910.2801
3600.26990.45480.27530.25840.46660.27500.18440.51980.2957

