Article

Numerical Simulations of Novel Conning Designs for Future Super-Large Wind Turbines

1
School of Electrical, Energy and Power Engineering, Yangzhou University, Yangzhou 225127, China
2
Department of Wind Energy, Technical University of Denmark, 2800 Lyngby, Denmark
*
Author to whom correspondence should be addressed.
Appl. Sci. 2021, 11(1), 147; https://doi.org/10.3390/app11010147
Submission received: 3 December 2020 / Revised: 21 December 2020 / Accepted: 22 December 2020 / Published: 25 December 2020
(This article belongs to the Special Issue Wind Turbine Aerodynamics II)

Abstract

:
In order to develop super-large wind turbines, new concepts, such as downwind load-alignment, are required. Additionally, segmented blade concepts are under investigation. As a simple example, the coned rotor needs be investigated. In this paper, different conning configurations, including special cones with three segments, are simulated and analyzed based on the DTU-10 MW reference rotor. It was found that the different force distributions of upwind and downwind coned configurations agreed well with the distributions of angle of attack, which were affected by the blade tip position and the cone angle. With the upstream coning of the blade tip, the blade sections suffered from stronger axial induction and a lower angle of attack. The downstream coning of the blade tip led to reverse variations. The cone angle determined the velocity and force projecting process from the axial to the normal direction, which also influenced the angle of attack and force, provided that correct inflow velocity decomposition occurred.

1. Introduction

Wind turbines are increasing in size and rated power in order to meet the requirement of wind energy development and further reduce the cost of energy (COE). Commercially available wind turbines are reaching 15 MW and are expected to achieve a power levels of 20 MW with even larger rotor diameters. As the blade mass increases subcubically with the blade length [1], the mass per blade would surpass 75,000 kg for a 20 MW wind turbine [2], which will give rise to difficulties in the design and construction of such systems. Adopting carbon fiber laminates in the major load-carrying region, such as the cap, can reduce the blade mass. Smart blades with advanced control strategies, together with add-ons, such as moving trailing edge flaps, can reduce the load and cost [3]. However, the utilization of advanced materials and the smart control techniques is constrained by cost [2]. Blade structure optimization [4,5,6] can also reduce blade mass. An optimization study on a 5 MW wind turbine rotor [6] found that the blade-tower clearance impedes the further reduction of blade mass, which implies the importance of coned, tilted, and prebending rotors. These ideas are not new, and have already been commercially applied. The coned rotor can reduce the static and dynamic loads [7], which will greatly reduce the blade weight and cost. Prebending blades are manufactured with their stacking lines flexed toward the wind. Compared with coned and tilted rotors, prebending blades can be mounted on the nacelle without the need to modify the design of the latter.
Based on the ultralight, load-aligned rotor concept, a downwind design by Loth et al. [2,8] was proposed to orient the resultant force of blades along the span-wise direction. Their blades are mostly under a tensional force and suffer fewer bending moments than traditional blades. Additionally, downwind rotors have a larger tower clearance. Therefore, this load-aligned downwind design will get rid of the rotor-tower clearance constraint and make the full use of the material strength, which allows more flexible and lighter blades to be manufactured. It was found that a two-bladed rotor following this concept leads to a mass saving around 27%, based on a 13.2 MW reference rotor [9,10]. Qin et al. [11] upscaled the load-aligned design from 13.2 MW to 25 MW. Additionally, segmented blades and outboard pitching ideas were discussed as a means of overcoming the increased edgewise loads of load-alignment. Wanke et al. [12] compared a 2.1 MW three-bladed upwind turbine with the downwind counterparts. It was concluded that downwind configurations have no clear advantage over the original upwind design. This conclusion was made on the condition that downwind rotors are not specially redesigned for downwind conditions; redesigns may yield different results. Bortolotti et al. [13] compared 10 MW upwind and downwind three-bladed rotors, with and without active cone control. They found that downwind designs, despite having reduced cantilever loadings, did not show obvious advantages over upwind designs. Ning and Petch [14] published an integrated design of 5–7 MW downwind turbines and compared it with its upwind counterparts. It was found that 25–30% of the rotor mass could be reduced at Class III wind sites. The overall cost of energy was reduced by only 1–2%, because the benefits of a reduced rotor mass are offset by a larger tower mass, required to maintain the overhang of the mass center in downwind configurations. They noted the potential to reduce the cost of energy by using downwind rotors, but also acknowledged that more studies are needed. In short, discussions on the downwind and load-alignment concepts are ongoing, and the shift to downwind designs will require more studies.
Inspired by the above studies on load-aligned or downwind concepts, the present paper puts forward a conceptual design, as shown in Figure 1. This concept actively cones the blade tip rather than the whole blade. When wind velocity increases from cut-in speed to rated speed, the blade tip cones further downwind to make the outer part of blade actively load-aligned. However, the inner part of blade is prebended to a fixed load-aligned shape and is fixed to the hub. The maximum thrust of the rotor normally appears near the rated power condition. This new concept can reduce the blade root flapwise bending moments with the alliance of a fixed load-aligned part and an actively load-aligned part. When the wind speed approaches the cut-off speed, the thrust force gradually decreases. Meanwhile, the rotor has a constant rotational speed and a constant centrifugal force, so that the blade tip can cone upwind slightly to meet the new load-aligned condition. Under extreme wind conditions such as typhoons, the blade tip will fold and pitch to a feathered state. This active tip-conning process consumes less energy than the original load-aligned concept [9,10] which cones the whole blade, and may consume a non-negligible amount of power [13]. Additionally, the new concept has a mass center closer to the tower which introduces smaller tower base moments than the original load-aligned concept; this is especially beneficial under very strong winds. Last but not least, the downwind concepts can extend the cut-off wind speed to a larger value (for example 30 m/s), as they have a larger tower-blade clearance compared to the upwind configuration.
The present paper mainly focuses on the aerodynamic aspects related to these designs. In [9,10,11,12,13,14], although different simulation tools were utilized, the aerodynamic computations were all based on Blade Element Momentum (BEM) theory. However, classical BEM theory is not suitable for coned rotors, especially with a large cone angle. Mikkelsen et al. [15] applied the traditional BEM method to a coned rotor. It was found that obvious errors appeared, even if a proper decomposition of the inflow velocity on coned blades was made. The inapplicability of the classical BEM method was also noted by Madsen et al. [16] and Crawford et al. [7,17]. Crawford corrected the BEM method by applying a vortex method as well as the proper decomposition of the inflow velocity in the rotor plan [17]. The conclusions in the above studies [9,10,11,12,13,14] contain strong uncertainties due to the application of classical BEM to coned rotors. So, it is of vital importance to accurately compare the aerodynamic characteristics of these designs, which is the foundation of all of these concepts. Nevertheless, aerodynamic research on coned, tilted and prebended rotors is very limited. Notably, computational fluid dynamics (CFD) methods with three dimensional (3D) body-fitted meshes are scarce. Actuator disc (AD) CFD methods are one of the commonly used numerical methodologies. Madsen and Rasmussen [18] compared four downwind rotors utilizing the AD CFD method, and found that the span-wise axial induction distributions and power coefficient were obviously influenced by the out of plane bending. With the help AD CFD, Mikkelsen et al. [15] also found a similar influence of coning on inducted velocities. It was also found that the upwind conning had a 2–3% higher power coefficient than the downwind configuration. However, AD-based methods are inherently coupled with BEM, which has some limitations. Winglets can be seen as partially coned blades. Farhan et al. [19] utilized a 3D CFD method to analyze the effect of winglets, observing that their influence extended to 30% of the radial sections. The phenomenon whereby the uncurved part of the blade was influenced by the deformed part was also observed in the study [18]. The Vortex Method (VM) can also be adopted to analyze such rotors. Chattot [20] utilized the VM method to investigate the influence of different blade tip configurations such as sweep, bending and winglets, and found that the whole blade was influenced by the curved part. Additionally, it was found that upwind prebending yielded increased power compared to the downwind configuration, which agreed with research presented in [15,18,19]. Further study is needed to understand the nonlinear behavior related to blade bending, as noted by Chattot [20]. Shen et al. [21] utilized the VM method to optimize rotor blades and found that the bended blade tip had an aerodynamic influence on the whole blade, and that this could not be accounted for using the traditional BEM method. Lastly, wind tunnel experiments could be conducted to explore these rotor concepts [22,23,24]. Due to their complexity, experiments to date have only investigated overall performance, such as thrust and torque, rather than span-wise force distribution. Therefore, dedicated CFD simulations are indispensable, especially on full-scale wind turbine rotors with 3D body-fitted meshes. Prebending has a continuously changing slope or cone angle, so it is hard to quantify its effects. Conning is the basis of prebending, and conning designs are suitable for parametric studies. In a previously published paper [25], the authors simulated different up/downwind conning and presented a preliminary aerodynamic analysis. The present paper will analyze the aerodynamic performance of different conning effects, such as inflow velocity decomposition and angle of attack analysis. Additionally, this paper will cover novel cones with three segments, which is a simplification and standardization of the new concepts shown in Figure 1.
The paper is organized as follows. In Section 2, the configurations of the cones and the employed numerical methods are presented. Results and discussions are given in Section 3. Finally, conclusions are drawn in Section 4.

2. Modeling and Methods

2.1. Modelling of Different Cone Configurations

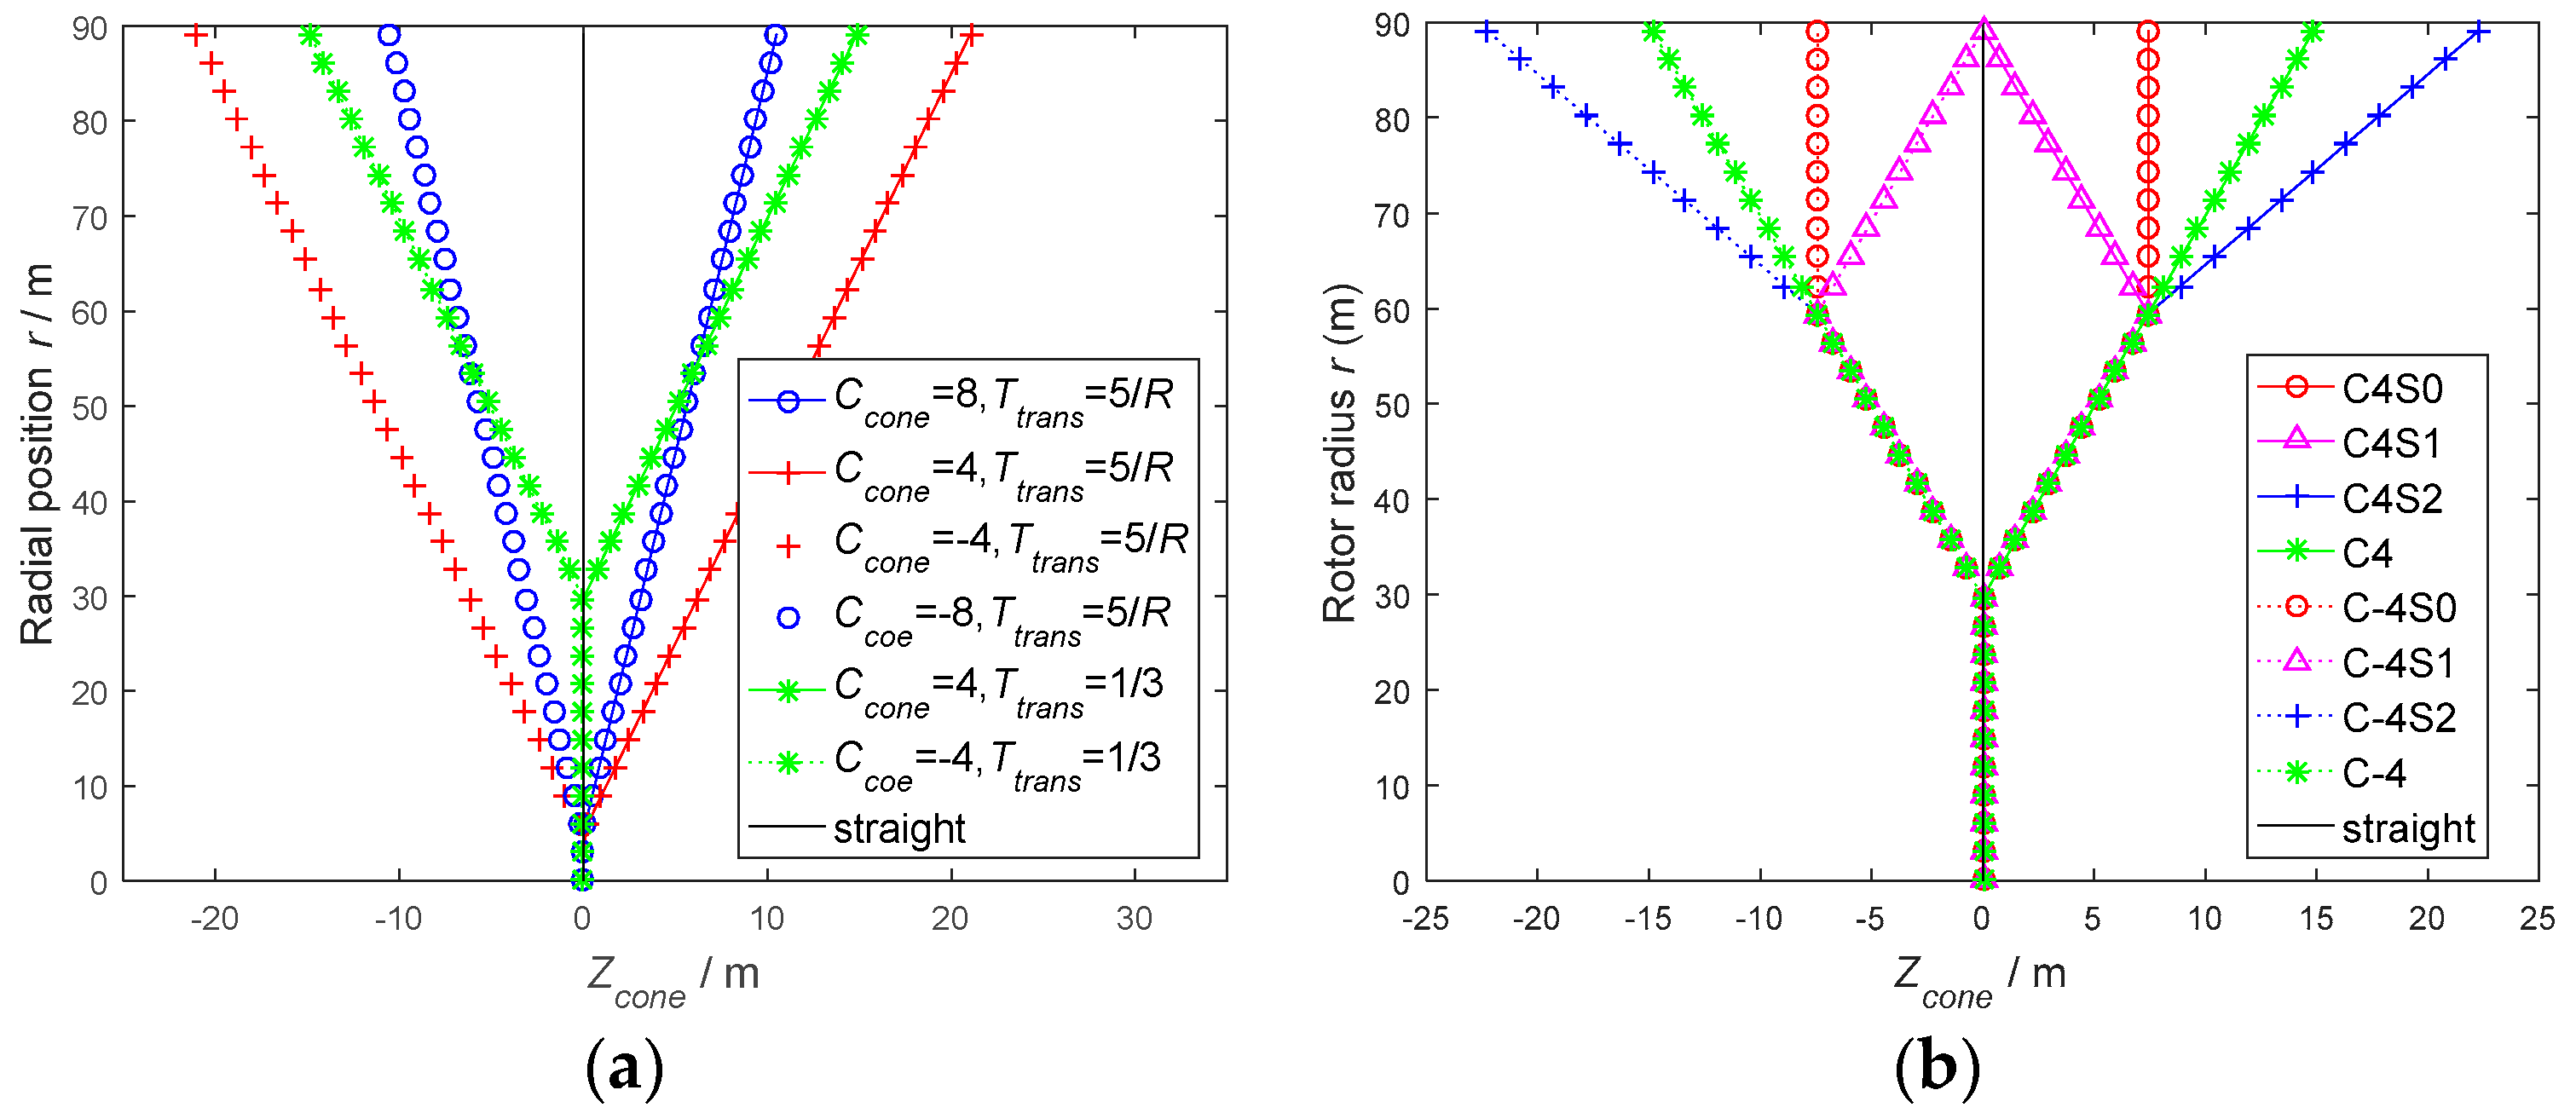
In order to analyze the aerodynamic performance of the load-aligned concepts, different conning configurations were designed, as shown in Figure 2 and Figure 3. These configurations are transformed from the DTU-10-MW Reference Wind Turbine (RWT) [26,27] rotor, which is referred to as the baseline rotor, according to Equations (1) and (2). To focus on the effects of coning, a DTU-10-MW RWT without cone, tilt, prebend, nacelle or hub was used. At radial position r, coned configurations had their blade stacking lines translated out of the rotor plane with a displacement of Zcone.
Z c o n e = { 0 , r T t r a n s R ( r / R T t r a n s ) R / C c o n e , r > T t r a n s R
where R is the rotor radius, Ttrans is the relative radial position where cone starts, and Ccone controls the slope of the stacking line. As shown in Figure 2a, Ttrans = 5/R means cone starting at 5 m, and Ttrans = 1/3 means cone starting at R/3. The cone angles are controlled by Ccone. When Ccone = ±4, ±8, the rotors have cone angles of ±14.0362°, ±7.1250°, respectively. A larger |Ccone| produces a smaller cone angle, and a positive Zcone makes a downwind cone. As shown in Figure 2b, several special coning configurations are shown, which are further coned at 2R/3. These special cone designs have an out of plane displacement of Zcone, as defined by Equation (2).
Z c o n e = { 0 , r T t r a n s R ( r / R T t r a n s ) R / C c o n e , T t r a n s R < r < 2 R / 3 ( 2 / 3 T t r a n s ) R / C c o n e , r 2 R / 3 ,   for   S 0 ( 4 / 3 T t r a n s r / R ) R / C c o n e , r 2 R / 3 ,   for   S 1 ( 2 r / R T t r a n s 2 / 3 ) R / C c o n e , r 2 R / 3 ,   for   S 2
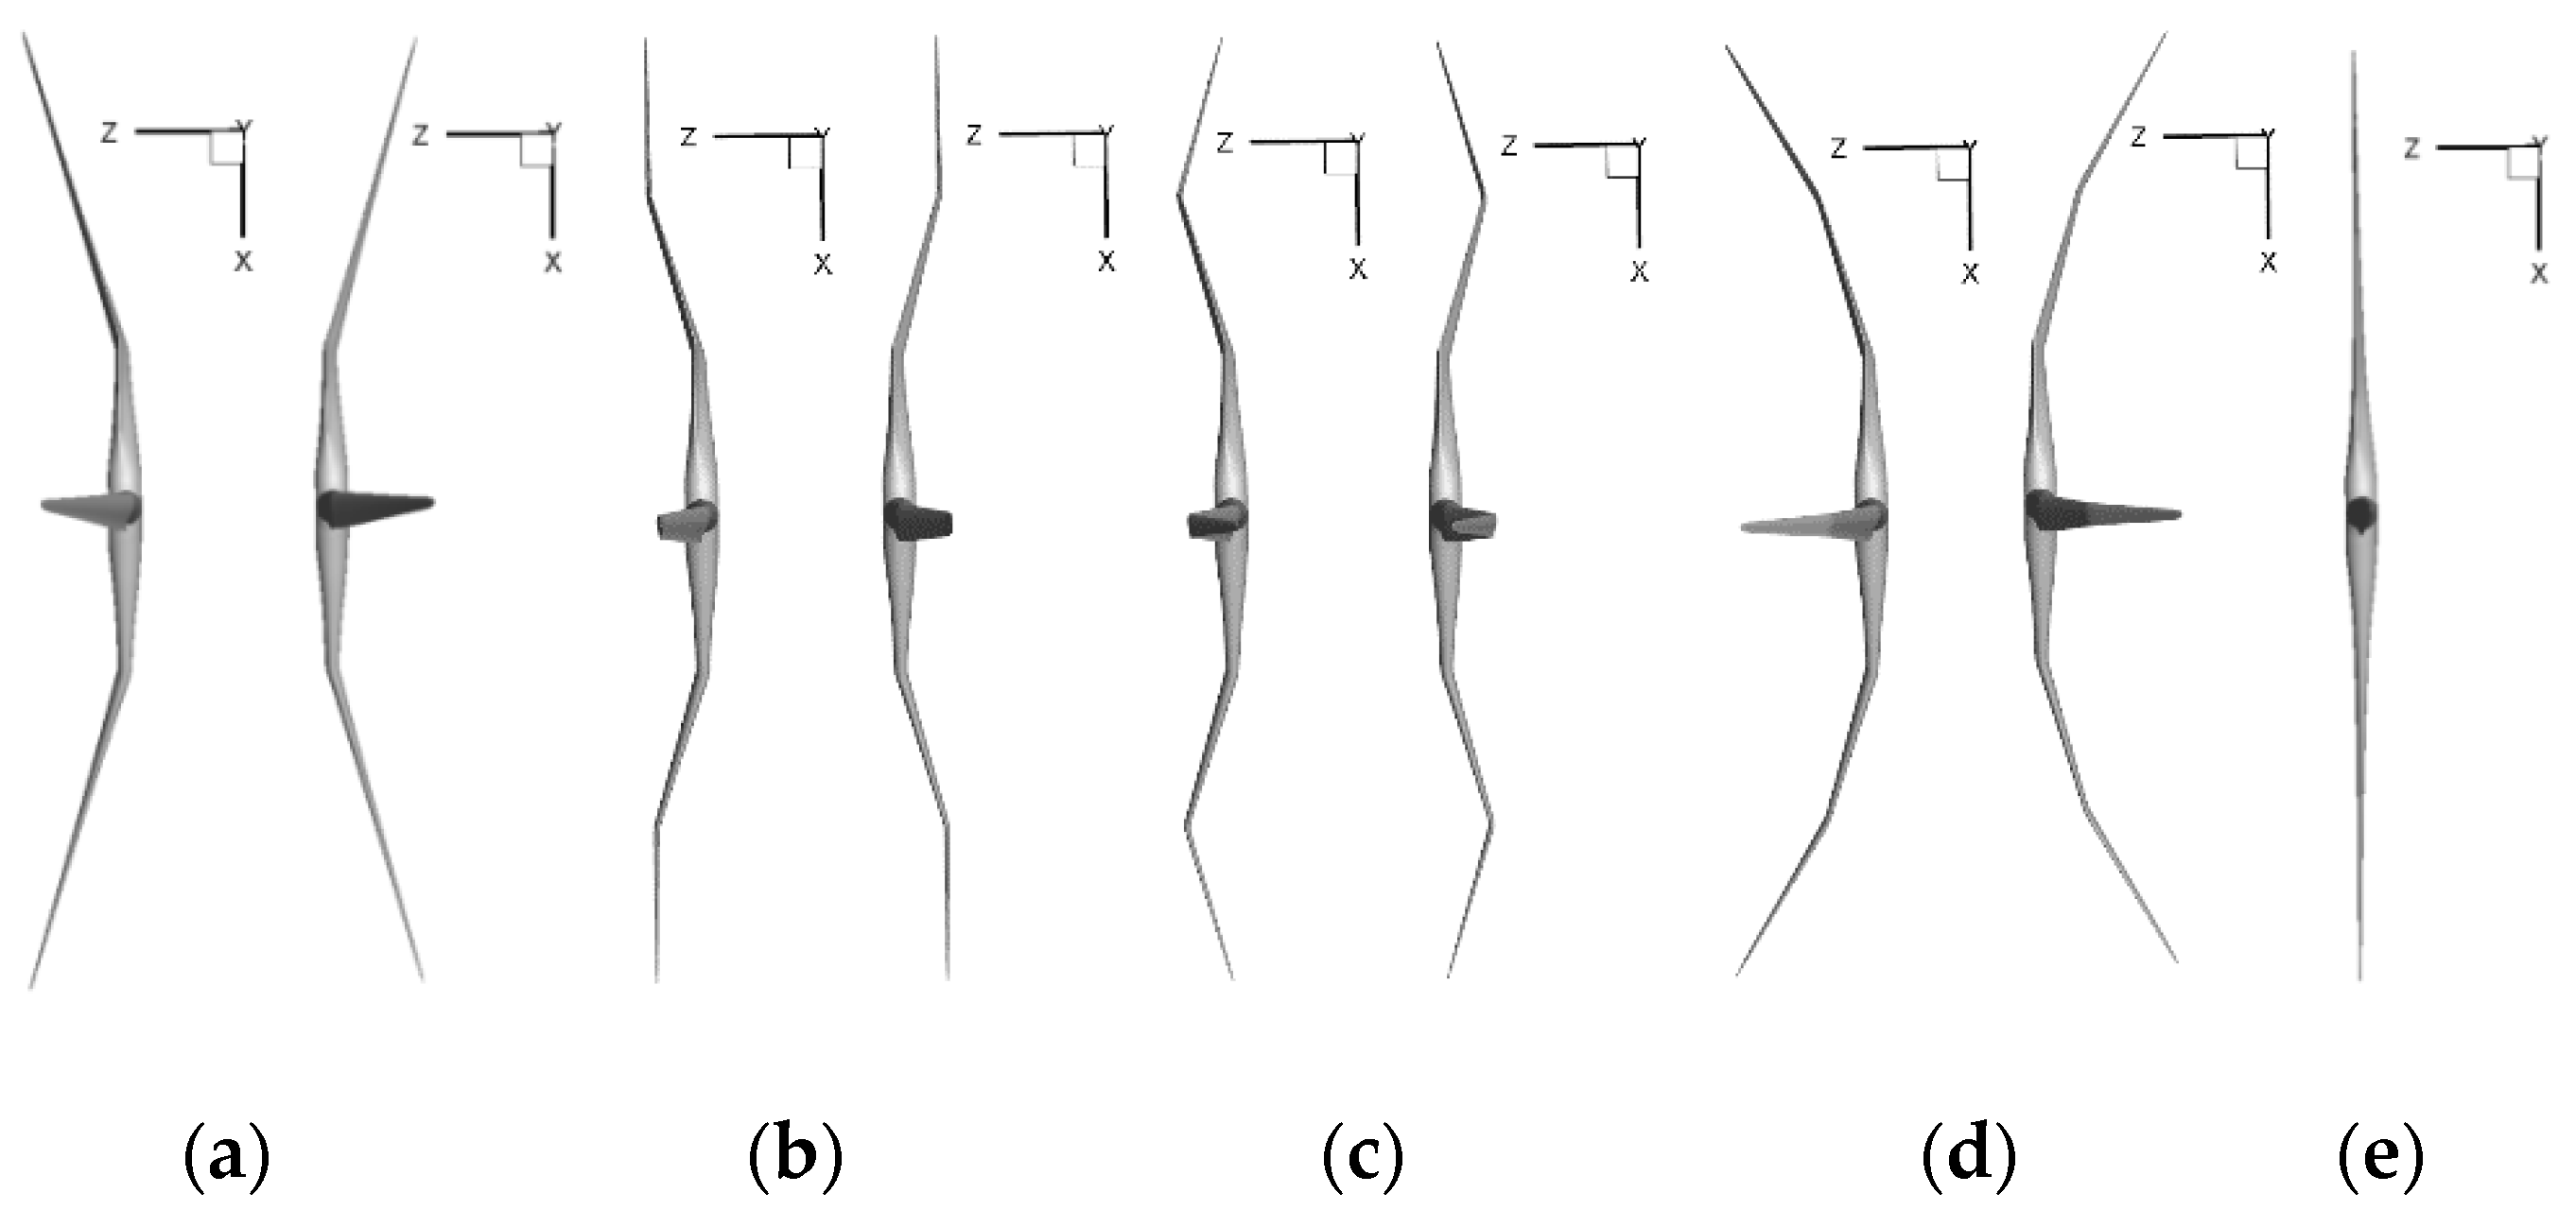
In the rest part of the paper, a name abbreviation rule is applied for Ttrans = 1/3 configurations. Ccone = ±4 and Ttrans = 1/3 are named as C4 and C-4, respectively. Symbols S0, S1 and S2 are used to discriminate among the configurations at r > 2R/3. For example, the case of Ccone = ±4 and Ttrans = 1/3 followed by S2 is abbreviated as C4S2 and C-4S2, which have their blade tips farthest from the rotor plane. The symbol of S1 represents a reverse blade tip cone, such that C4S1 has its blade tip pointing to the upwind direction of a downwind cone at r < 2R/3. Lastly, the symbol S0 represents a zero cone angle at r > 2R/3. In short, C4 stands for downwind and C-4 for upwind, and S0, S1 and S2 represent blade tip configurations. For the sake of aerodynamic comparisons, all the configurations have the same projected areas and the same distribution of airfoil thickness, chord and twist. The shapes of different configurations are depicted in Figure 3, with the wind flow from the negative Z to the positive Z.

2.2. Mesh Structure and CFD Method

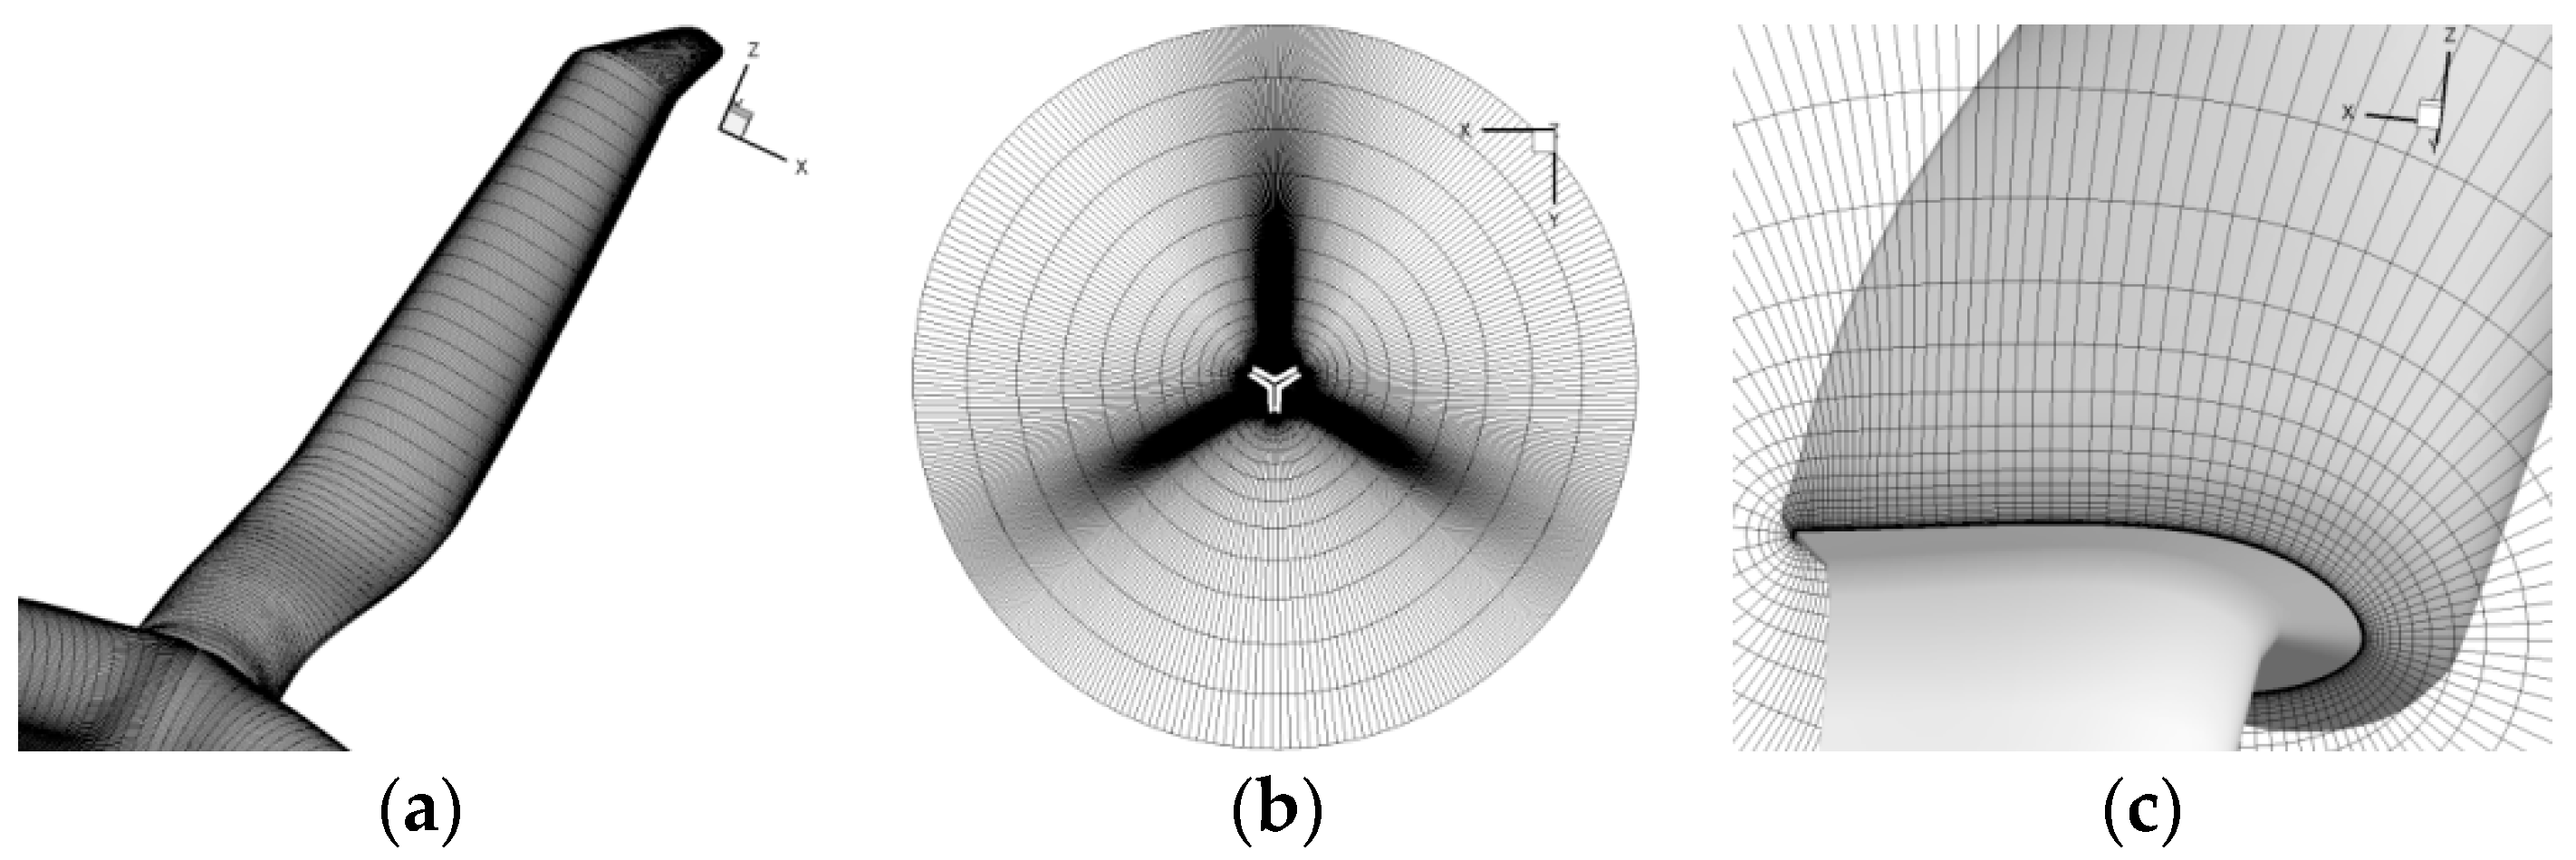
The baseline rotor has been studied elsewhere [26,27,28]; past studies provided references for the mesh configuration applied here. The mesh employed a commonly used O-O configuration with the surface mesh on one blade containing 256 points in the airfoil circumferential direction and 128 points in the span-wise direction. The volume mesh was expanded from the surface mesh to the far-field boundary (approximately 17R away) with 128 cells along the normal direction. To meet the computational requirement of Y + <2, the first cell height was 2 × 10 6 m. Finally, the grid was constructed with 432 blocks which contained 14.16 million structural cells in total. A similar mesh configuration is accurate enough to simulate the aerodynamic performance of the DTU 10 MW RWT rotor [26,28] which can be found on the DTU 10 MW RWT project website [27]. Such mesh settings were used for all the coned configurations in the present paper. The blade surface mesh of C4S1 is shown in Figure 4a, and the mesh distributions on two cross-sections are illustrated in Figure 4b,c.
The flow state is treated as incompressible, and the turbulence flow is fully developed. The flow-field was solved by the Reynolds-Averaged Navier-Stokes (RANS) equations with the k ω   SST turbulence model [29]. The SIMPLE algorithm was utilized to couple the pressure and velocity equations. EllipSys3D, developed by the Technical University of Denmark and widely validated over the past 20 years, was used as the CFD solver. Detailed descriptions of the solver can be found in [26,30]. Additionally, detailed boundary condition descriptions and baseline rotor validation can be found in a previous publication [25], where the same numerical methods were adopted. At a wind speed of 12 m/s, few force differences appeared between steady and unsteady simulations in the root region (r < R/3) where flow separations and 3D rotational augmentations were expected [28]. The forces along the outer part of blade remained identical. In this paper, steady CFD simulations were performed to investigate the influence of coning at a wind speed of 9 m/s, i.e., at which the unsteady effects were negligible. The operational parameters of the baseline rotor, listed in Table 1, were applied for all the coned configurations.

3. Results and Discussions

In this section, the aerodynamic performance of the coned DTU 10 MW rotor, coning at a blade position near the root (Ttrans = 5/R), is presented. In order to explain the physics behind the coned rotor, the concept of angle of attack (AOA) on the rotor blade sections was extended to include coned rotors. The results are discussed through the concept of angle of attack.

3.1. Four Configurations of Coning Near the Root: Ttrans = 5/R and Ccone = ±4, ±8

3.1.1. Force Performances

Firstly, the overall aerodynamic performance of the configurations presented in Figure 2a are compared. The two configurations of Ccone = ± 4 and Ttrans = 1/3 also appear in Figure 2b, where they are abbreviated as C4S2 and C-4S2. These configurations are not discussed here, and will be explored in Section 3.2. In Table 2, the thrust T and torque Q of the other four configurations in Figure 2a are listed. As high torque and low thrust are beneficial, the torque-to-thrust ratio (QT) was used to compare different conning configurations. The relative variations of these parameters are denoted as δT, δQ and δQT; for example, δT means
δ   =   |   T   | c o n e     |   T   | s t r a i g h t |    T    | s t r a i g h t × 100 %
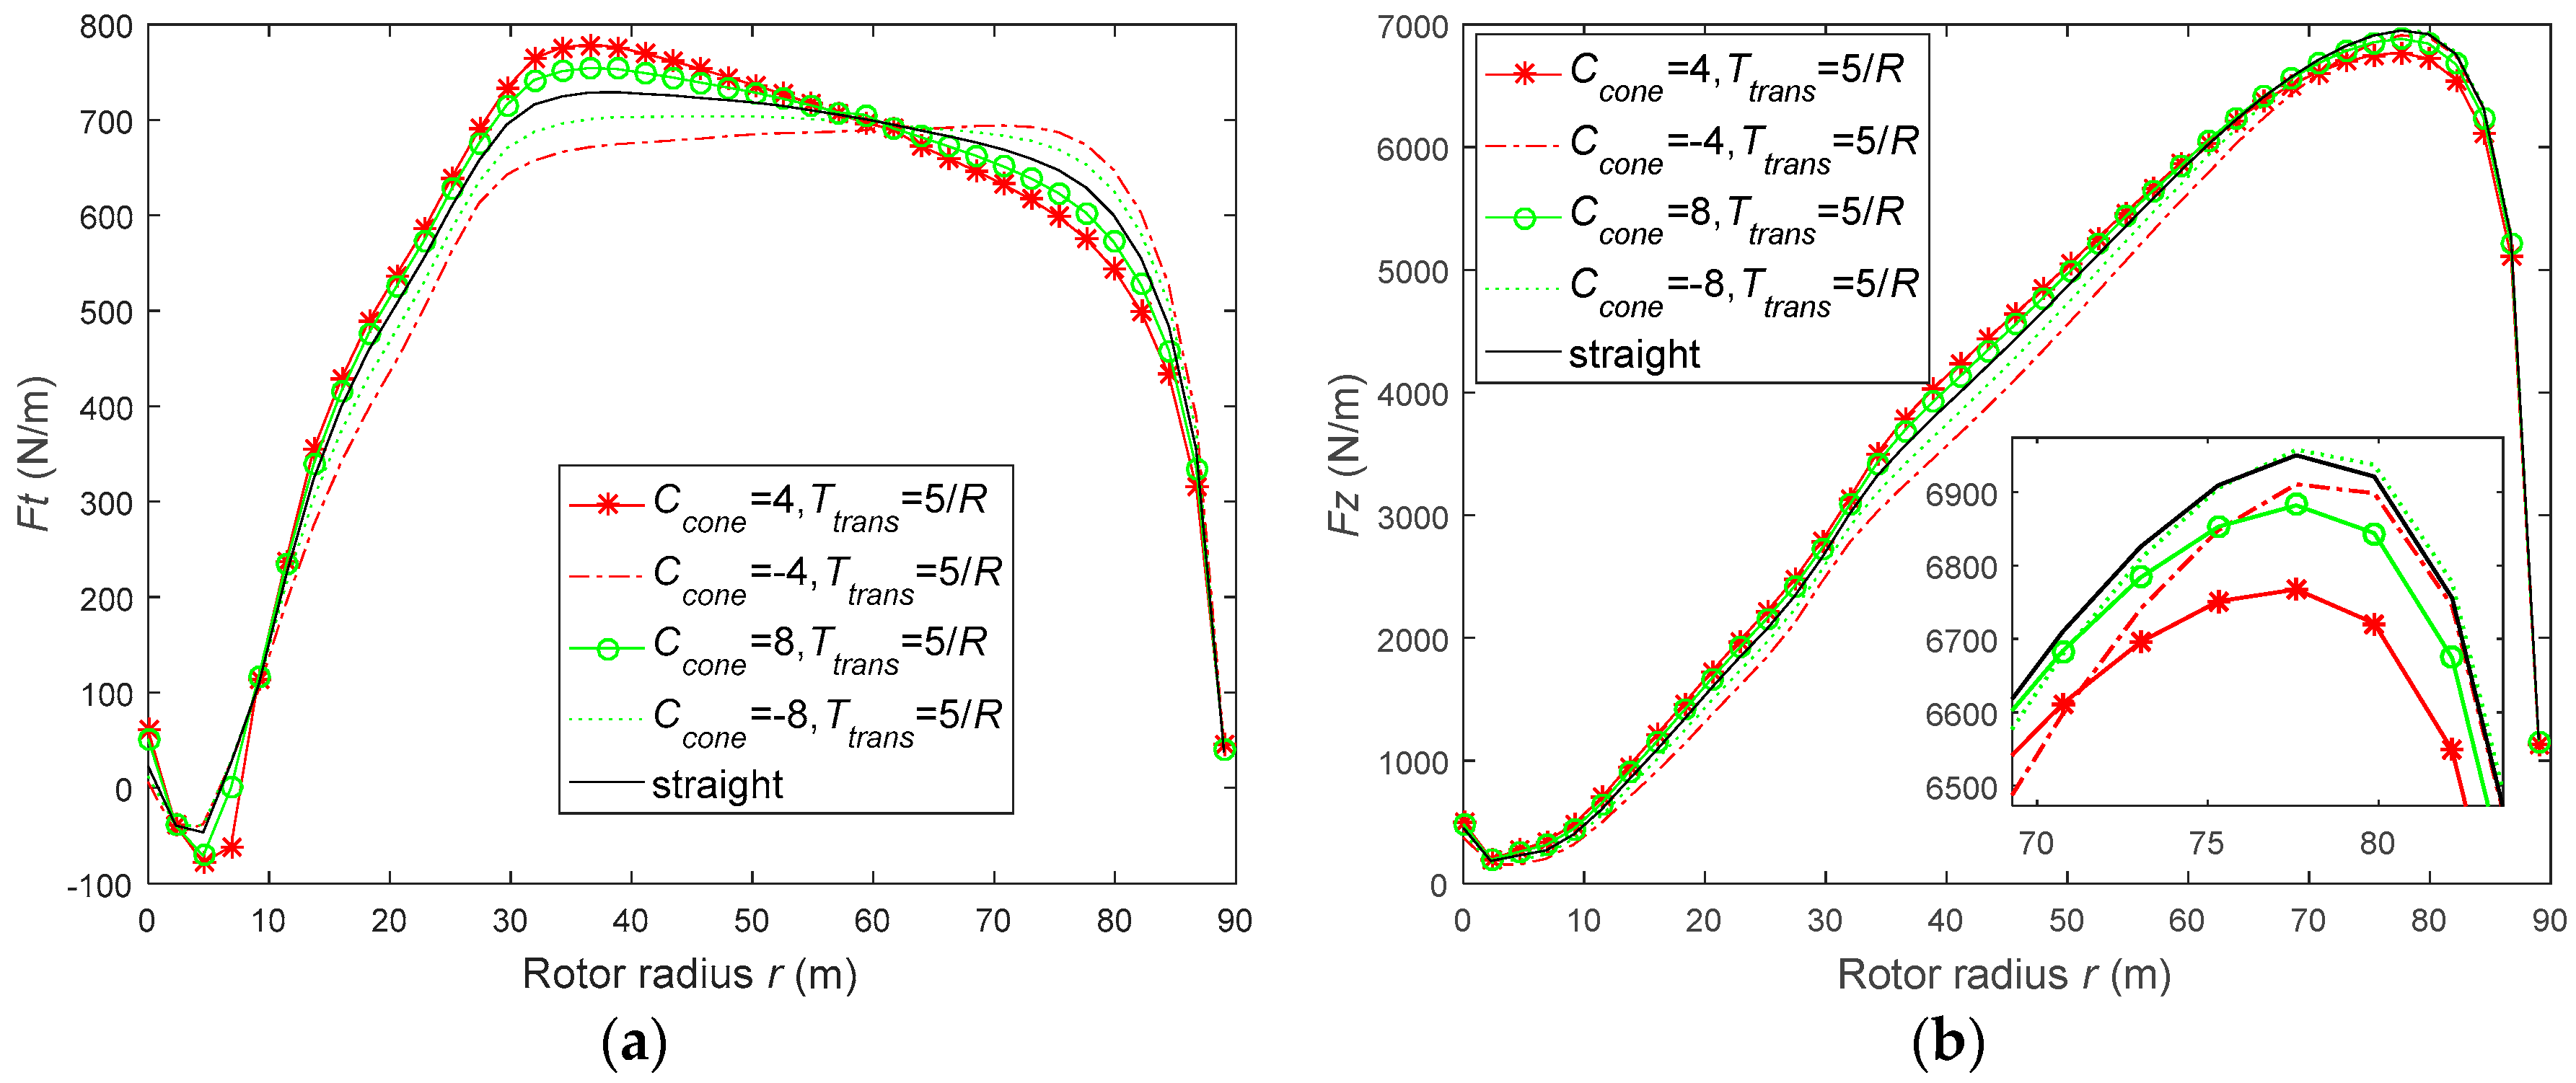
The most upwind-coned configuration Ccone = −4 gives the lowest thrust, i.e., 4.53% lower than that of the baseline without coning. Although Ccone = −4 reduces the torque by 1.07% compared with the baseline, it has the highest QT due to the obvious decline of thrust. The downwind counterpart Ccone = 4 produces the highest T, lowest Q, and lowest QT, which is unfavorable. Among the pair of Ccone = ±8, the upwind configuration also has a smaller T, a higher Q and a higher QT than the downwind counterpart.
To understand the overall performance differences shown in Table 2, the tangential and axial force per unit span length is shown in Figure 5. The axial force Fz is parallel to the rotor axis, and the tangential force Ft is perpendicular to Fz. The aforementioned forces are the summation of all the three blades. Near the blade tip, the upwind configurations had a larger Ft and Fz than the downwind counterparts. For example, the Ft and Fz curves of Ccone = −4 were higher than those of Ccone = 4. Towards the blade root, the situation reversed, i.e., the upwind configurations had a lower Ft and Fz. For the distribution of Ft, the upwind and downwind counterparts had an almost reversed Ft distribution of the baseline rotor with straight blades. The upwind configurations had a higher Ft near the blade tip, which is more beneficial to an increase of torque. As a result, the torque of Ccone = −4 and −8 was slightly higher than Ccone = 4 and 8, as listed in Table 2. However, all four coned configurations had a smaller torque than the baseline. For the distribution of Fz, the baseline did not lie in the middle of an up/downwind pair, especially toward the blade tip. Although upwind lines gradually surpassed their downwind counterparts and approached the baseline near the blade tip, they barely went above the baseline. The largest upwind cone Ccone = −4 showed the overall lowest Fz, which was consistent with the results shown in Table 2. It is difficult to understand why the force distribution behaved like this, so more analyses are needed.

3.1.2. Flow Field Analysis

Analyzing the flow field around a wind turbine, such as inflow velocity and angle of attack (AOA), may help to understand the force distributions mentioned above. The inflow velocity decomposition for the upwind and downwind coned rotors is illustrated in Figure 6. This decomposition was made in the YZ plane, which contained the rotor axis and the pitch axis of a blade. The unit vectors z, r, s and n were along the axial, radial, span-wise and normal directions, respectively. At a far upstream position, the axial velocity was V0, the normal velocity component was V0cosβ, and the radial velocity was zero. Towards the rotor, the axial and normal velocity decreased and the radial velocity increased. Arriving at the rotor, the axial and normal velocity was reduced to V0-Wz, V0cosβ-Wn, and the radial velocity increased to Vr. Here, Wz is the axial induction velocity at the aerodynamic center (AC) and Wn is the normal induction velocity at AC.
Due to the presence of Vr, the resultant velocity Vinflow in the YZ plane was not horizontal and did not equal to V0-Wz, as shown in Figure 6. The velocity decomposition was different for the upwind and downwind coned configurations. For an upwind cone configuration, projecting the resultant velocity Vinflow to the normal component was different to that on a downwind counterpart, as the projection angle γ was different. However, the radial velocity component is omitted in the traditional BEM method because there is no equation to describe the radial flow. Then, it was assumed that the inflow velocity Vinflow would be along the axial direction and would be equal to V0-Wz. When projecting the inflow velocity Vinflow to the normal component, the projection angle γ equaled the cone angle β. Thus, the upwind and downwind pair had the same value of cosβ, Fn and Fz. In short, the traditional BEM methods cannot distinguish the upwind and downwind coning, which is clearly in contrast with reality.
Another way to analyze the flow is to use the concept of angle of attack, which is conducted on the planes perpendicular to the blade spanwise direction. At present, difficulties or uncertainties remain in the extraction of AOA from 3D CFD simulations or experiments, which is different from that in the 2D situations. There are different kinds of methods to extract AOA from CFD data, which are thoroughly discussed and compared in [31,32]. Most methods predicted similar AOA at midspan, but it should be kept in mind that the results near the blade root and tip varied from one method to another. The Average Azimuthal Technique (AAT) [31,32,33], proposed by Hansen et al. [33], was used in the present paper. At a given rotor radius, AAT extracts the inflow velocity on two circles which are just upstream and downstream of the rotor, as shown in Figure 7a. The number of points on a circle is 72 in the present study. AAT estimates the velocity at AC by averaging the up- and down- stream data, and then calculates AOA using Equation (4). However, Equation (4) is only applicable for straight blades without cones. A general form of AOA, which is suitable for coned rotor analyses, is Equation (5).
α z = tan 1 ( V z V t ) θ   =   tan 1 ( V 0 W z V t ) θ
α n = tan 1 ( V n V t ) θ   =   tan 1 ( V 0 cos β W n V t ) θ
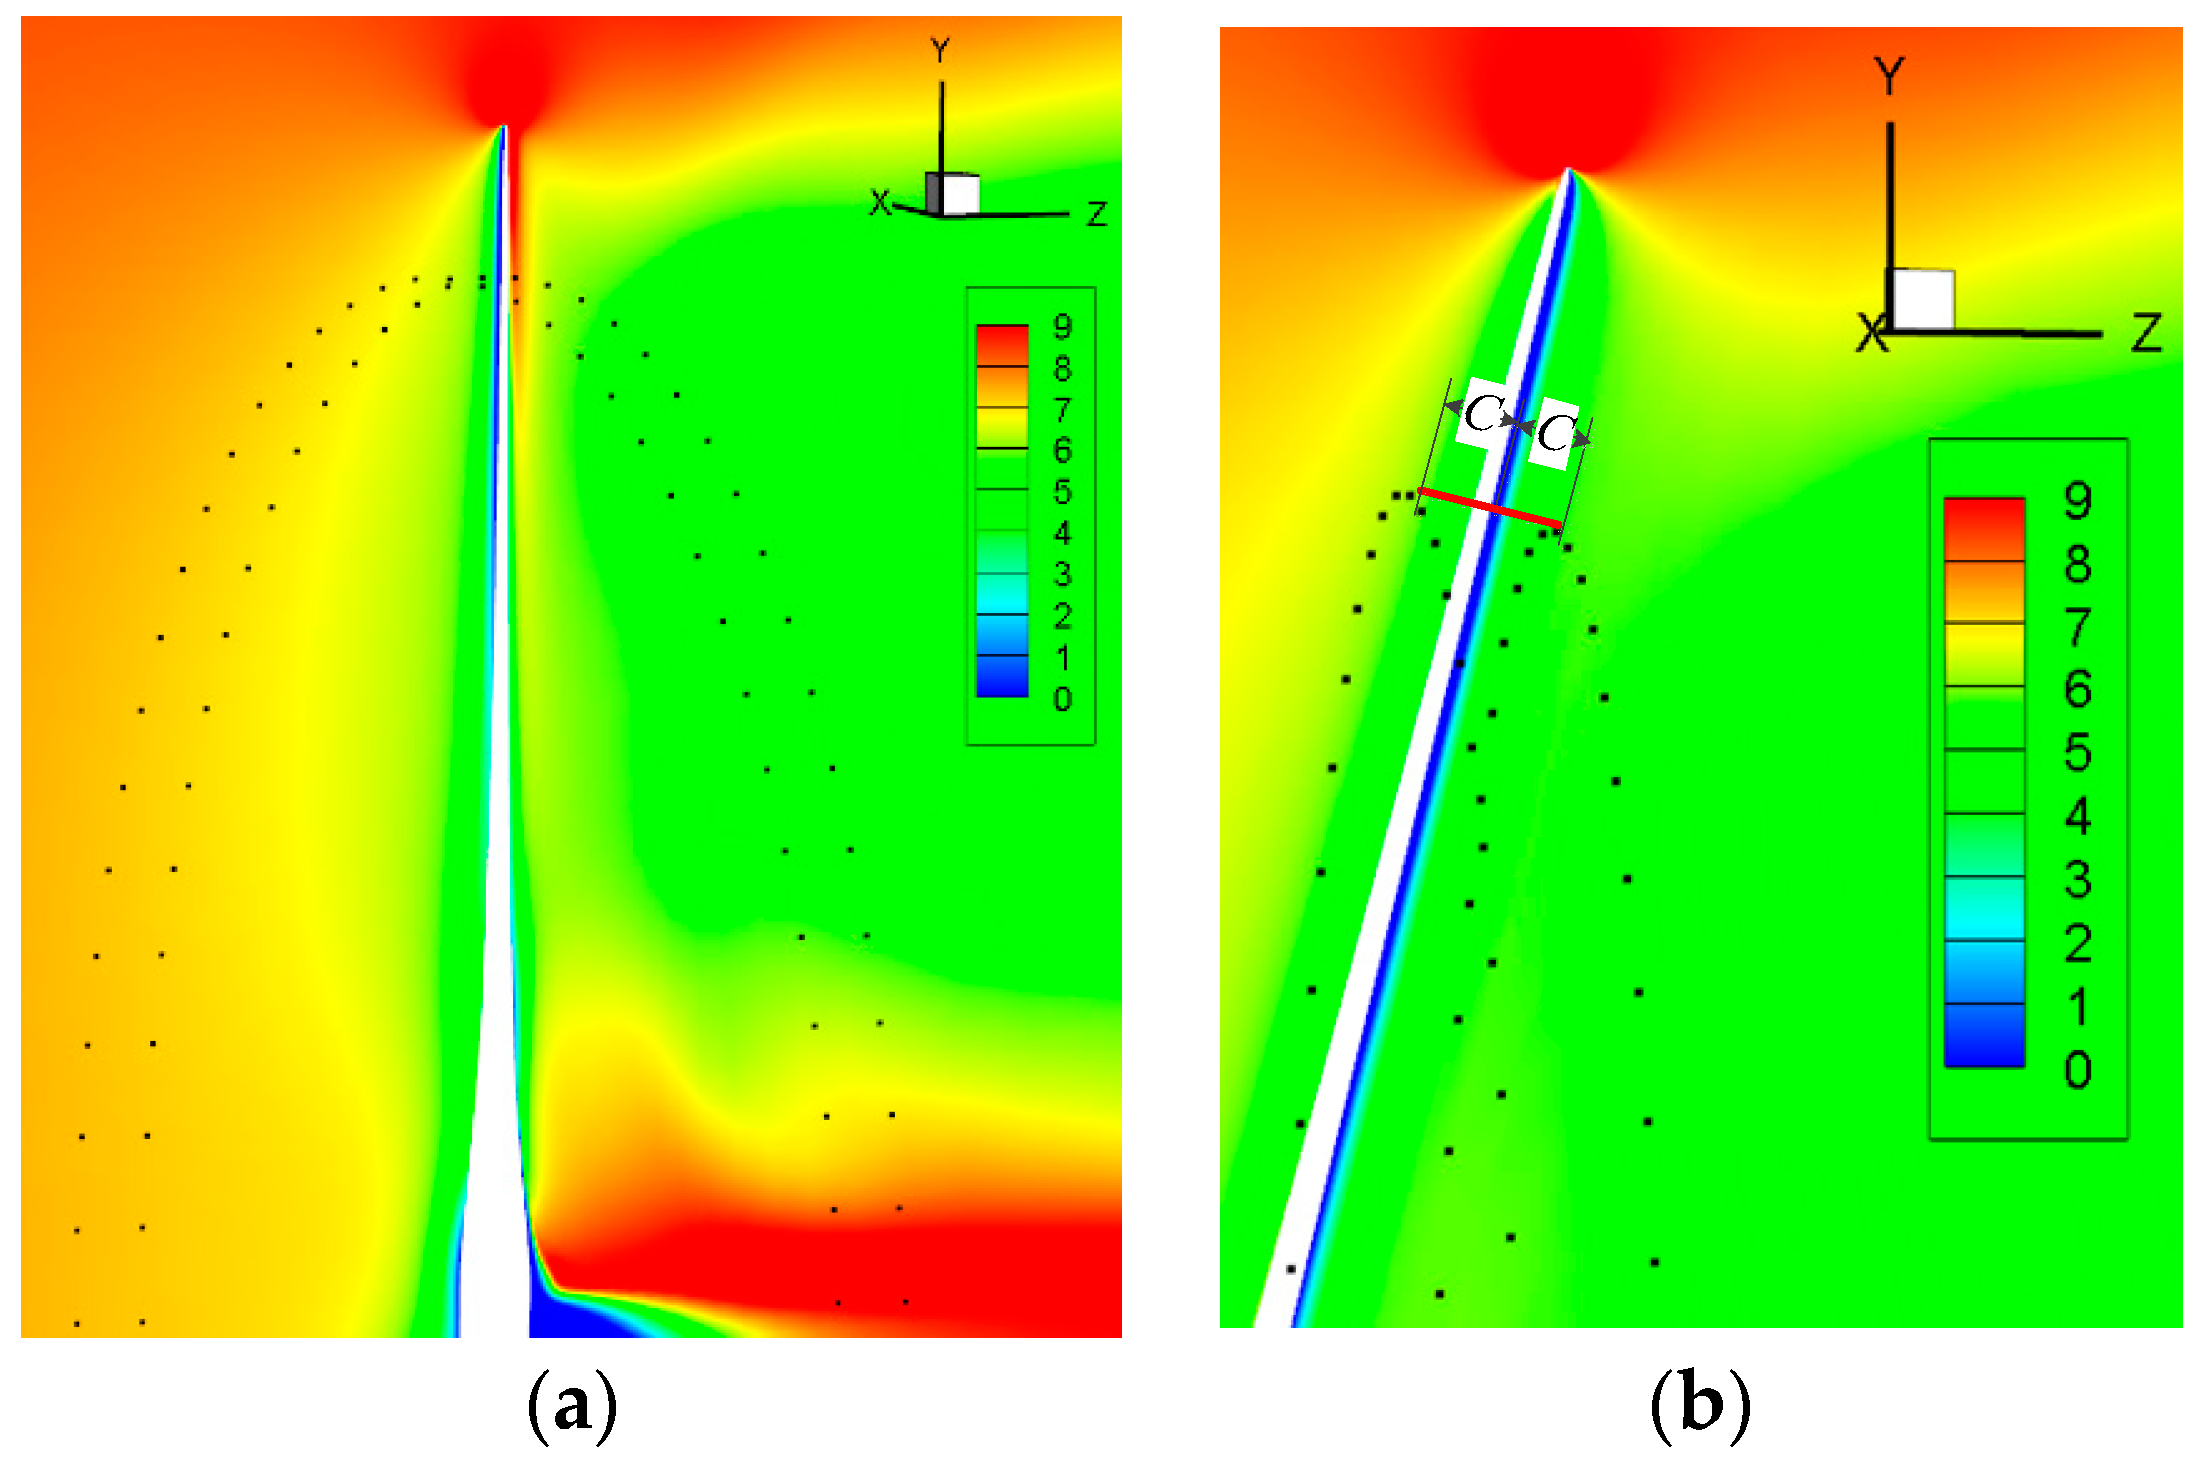
where Vz is the estimated axial velocity at AC, Vn is the estimated normal-wise velocity at AC, Vt is the estimated tangential velocity at AC, and θ is the local pitch angle. When applied to straight blades without a cone, Equation (5) is reduced to Equation (4), because Vn becomes Vz. As most studies available on AOA extraction are for straight blades without coning, Equation (4) is commonly used. To extract AOA, the distance from AC to the up-/down- stream annulus was set to one local chord length C, as shown in Figure 7b, where the axial velocity in the YZ plane is also illustrated.
The streamlines in the YZ plane of the two coned configurations are drawn in Figure 8, where the axial velocity contour is also shown. The streamlines of the downwind coned case in Figure 8b were more up-pointing than those of the upwind coned case in Figure 8a. Especially near the blade tip, the upwind cone had a smaller projection angle γ and had streamlines which were more perpendicular to the blade. When projecting the real inflow velocity Vinflow in direction n, the upwind coned rotor had a smaller Vn value, even if with the same Vinflow value. Therefore, it is more straight forward to analyze αn, which reveals the inflow condition in the normal-wise Xn plane.
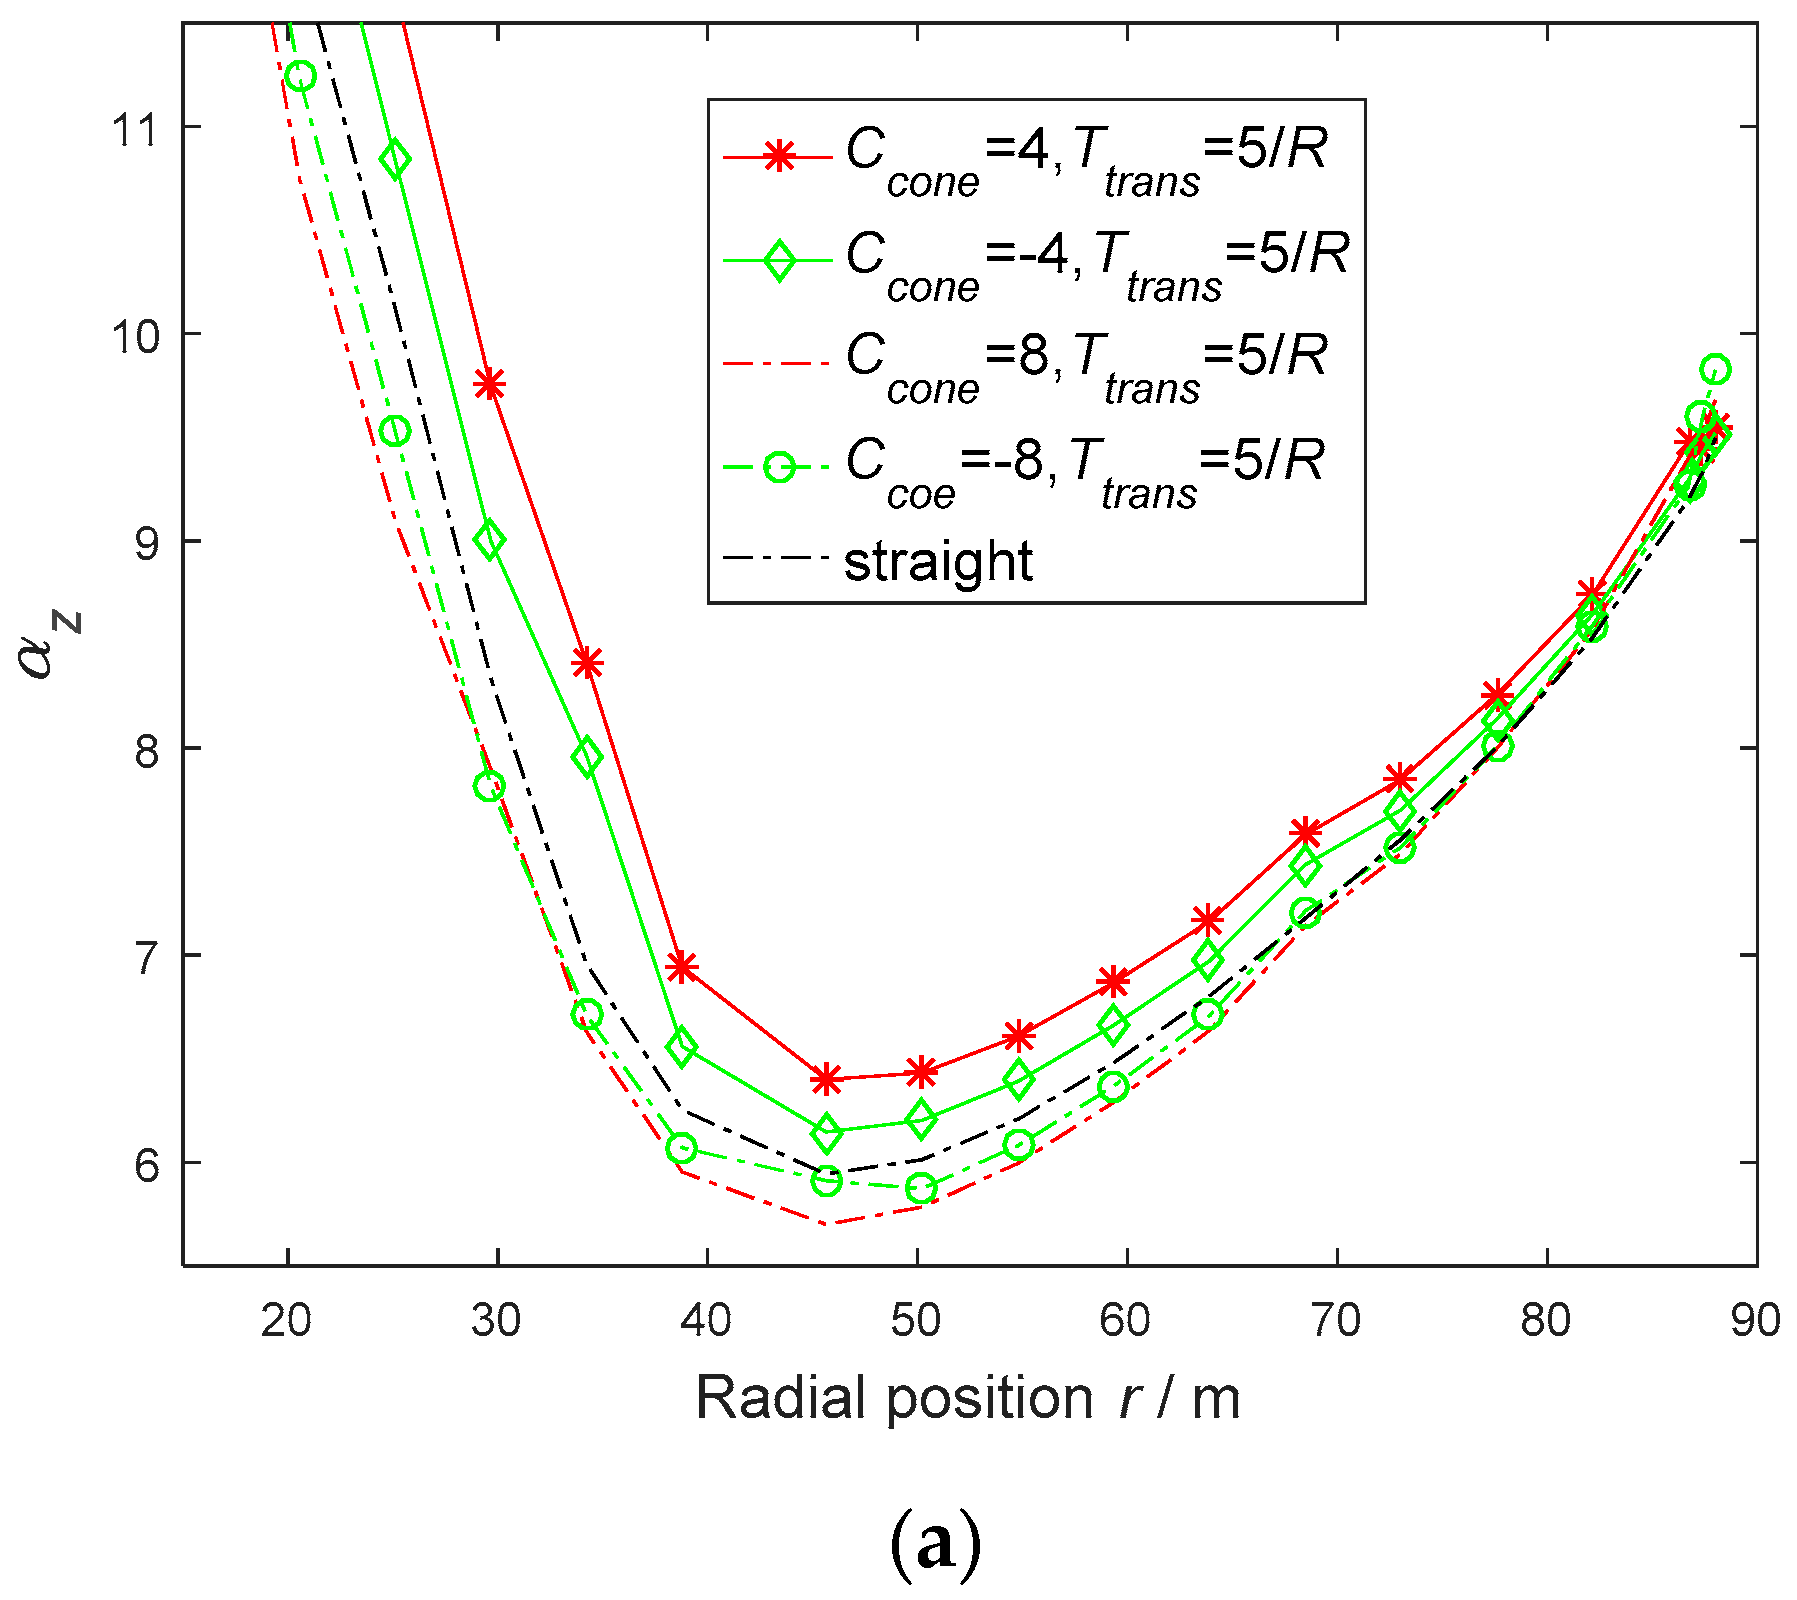
To explore the mechanism behind the interesting force distributions shown in Figure 5, the distribution of αz and αn are compared in Figure 9. It was found that the αz of an upwind cone is always smaller than its downwind counterpart, which is not consistent with the force distributions. Interestingly, the αn curve of the upwind cone intersected with its downwind counterpart. Near the blade root, downwind configurations had a larger αn than their upwind counterparts, which indicated larger thrust and tangential force. Towards the blade tip, the downwind coning made the αn gradually decrease below that of upwind cone, which was consistent with the force distribution. Additionally, as shown in Figure 5, there was a phenomenon whereby an up/downwind pair had an almost reversed Ft distribution relative to the baseline, but had a less symmetric distribution of Fz curves, especially towards the tip. A reasonable explanation is given below. The upwind cone had a slightly larger αn than the straight baseline toward the blade tip, and therefore, also had a larger Fn, which is the normal force parallel to n, as shown in Figure 6. But the force Fz in Figure 5b was along the axial direction, which has a relationship with Fn as follows:
F z d r = F n cos β d r
where the force along the span-wise direction is usually small and thus neglected. Although Fn of the upwind coning was slightly larger than the baseline near the tip, after projecting Fn to Fz, the Fz may have been smaller than the baseline, as shown in Figure 5. It is known that a cone angle always leads to a cosβ which is smaller than one; however, there is no projection process for the tangential force Ft. Therefore, the Ft curves of the upwind cone shown in Figure 5 could be higher than the baseline curves, which follow the αn curves more closely. Lastly, uncertainties still lie in the extraction of AOA, especially near the blade tip [31,32], but it is clear that this provides a view to explain the force distribution shown in Figure 5.
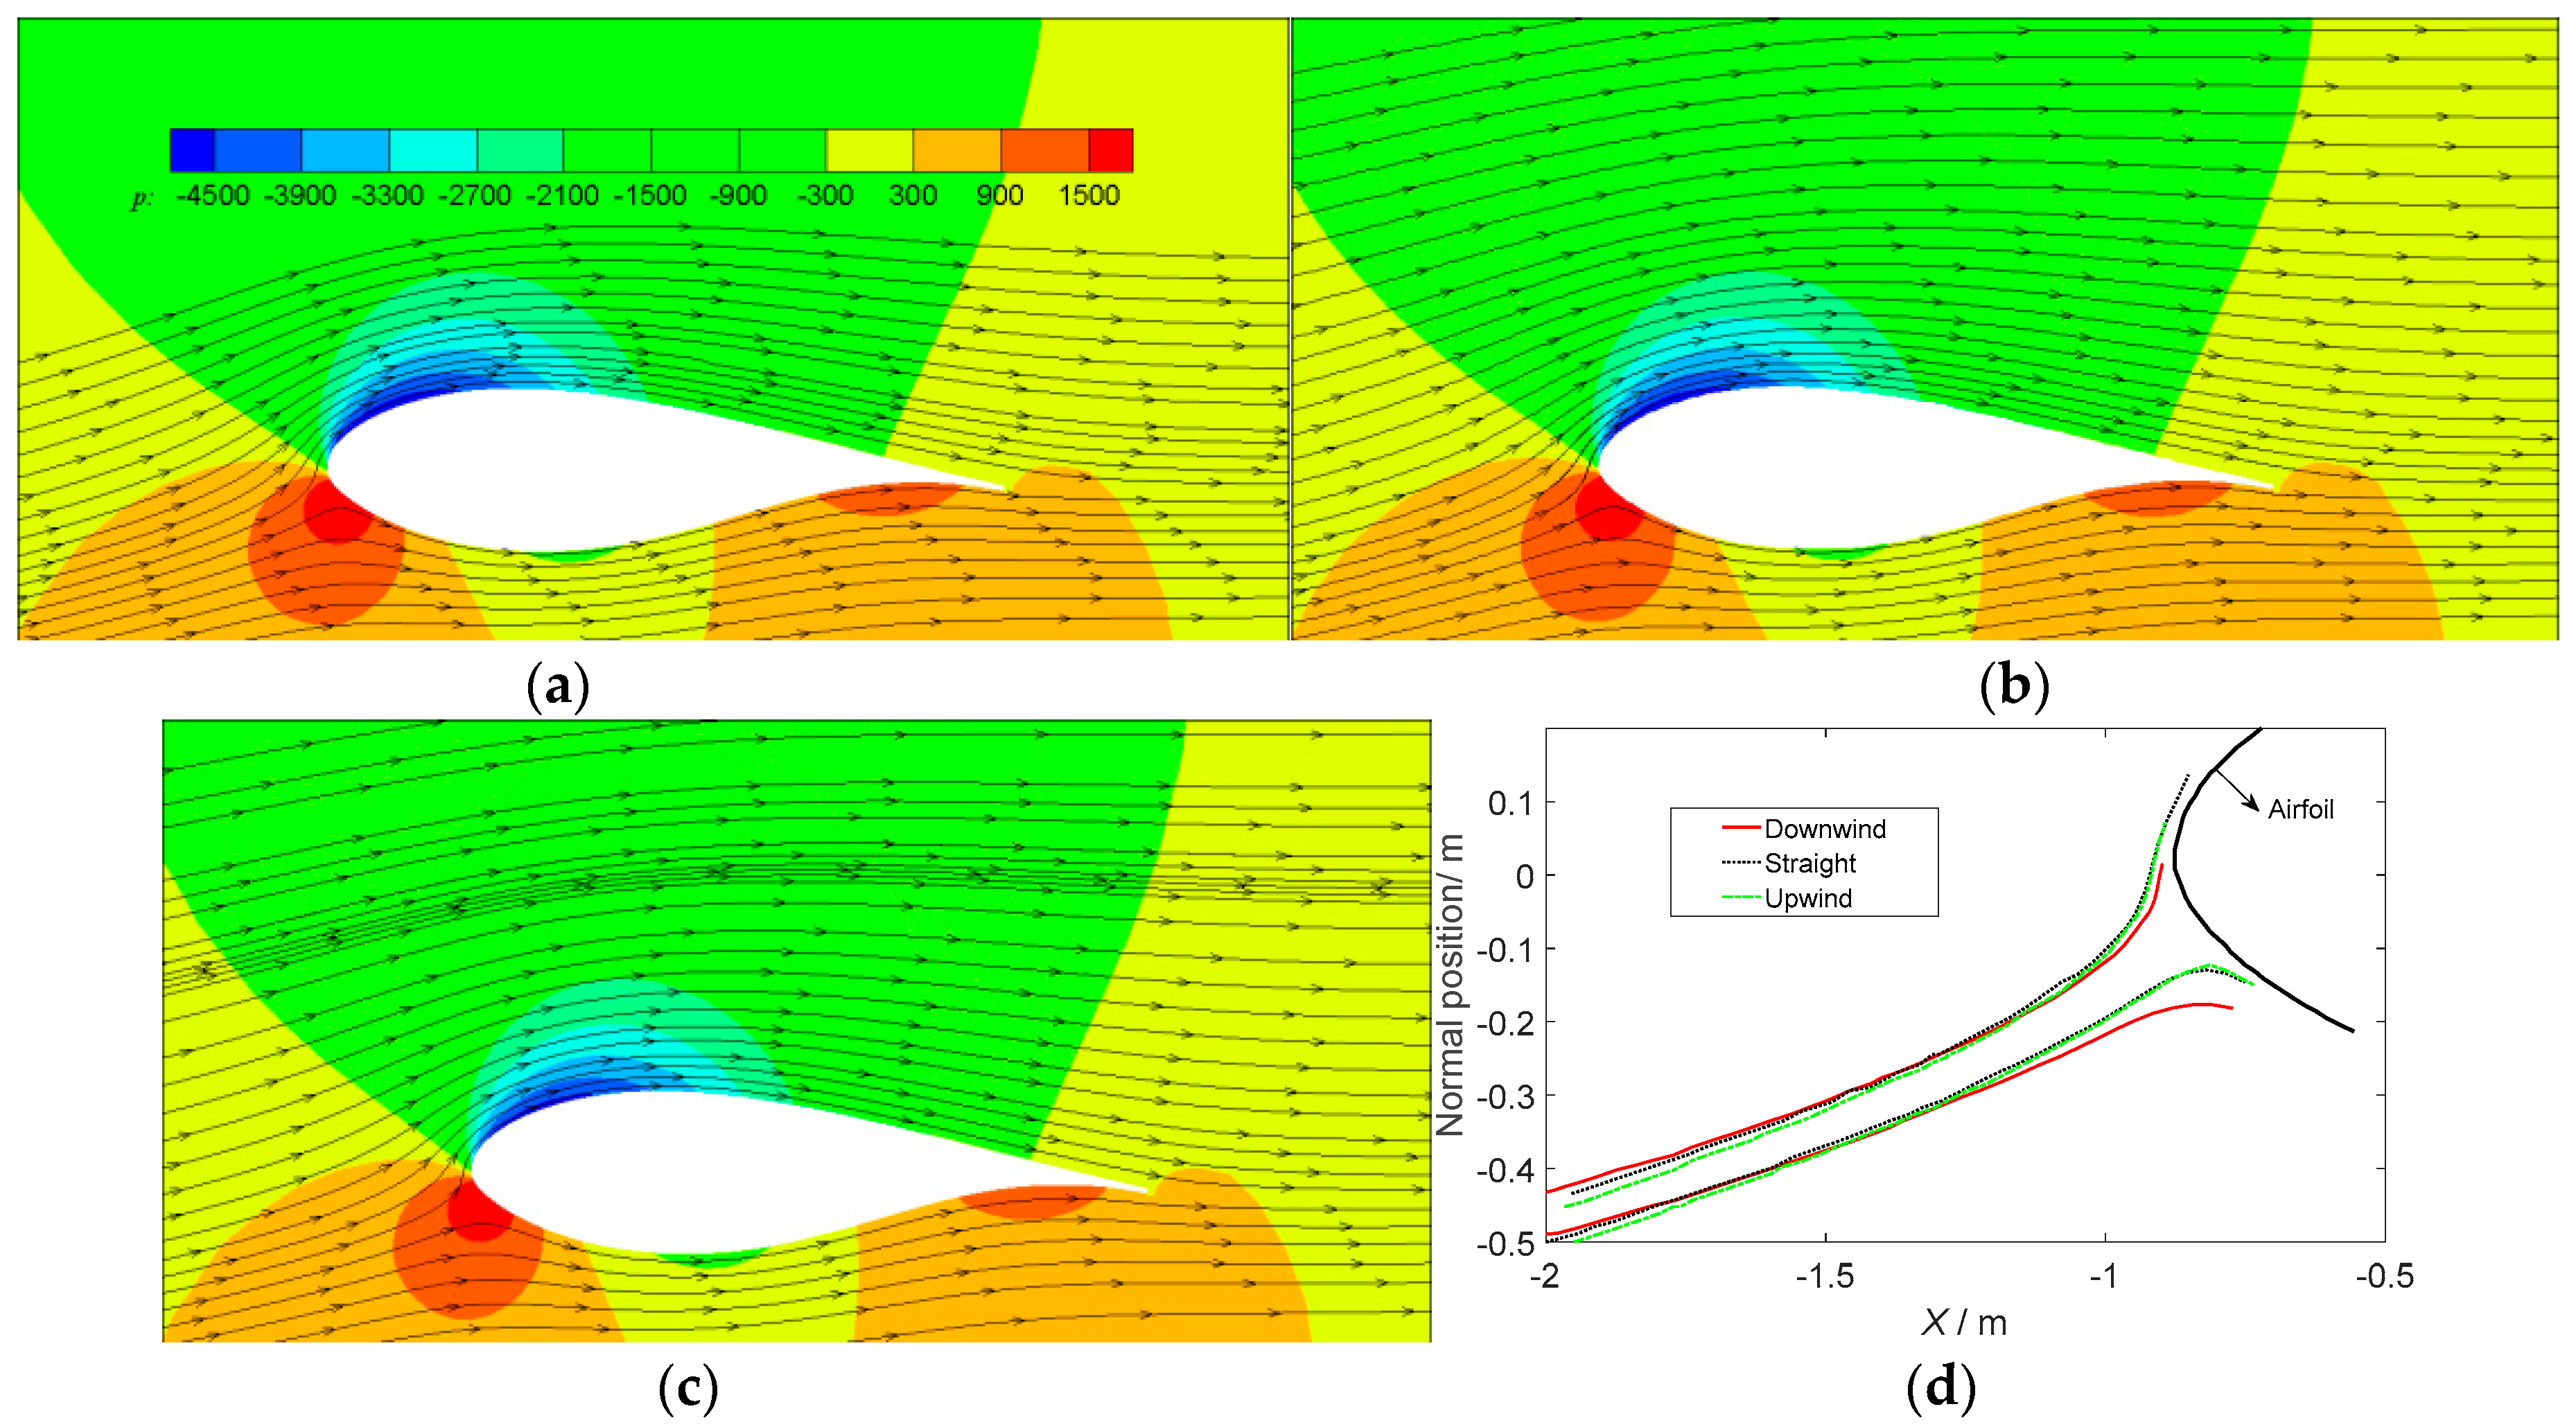
To validate the extracted αn in Figure 9, streamlines and pressure plots around the normal blade section at r = 77.59 m are shown in Figure 10. This slice was normal-cutting, which was parallel to the normal-wise Xn plane. It was found that the three airfoil sections were all in an attached flow condition. The αn of these three configurations could be approximately compared by analyzing the slopes of the streamlines ahead of the leading edge. As the slopes of the streamlines in Figure 10a–c only had minor differences, representative streamlines near the stagnation point were extracted from Figure 10a–c and compared in Figure 10d. It is shown that the upwind coning had a slightly larger αn than the downwind counterpart, which was consistent with the findings shown Figure 9b; meanwhile, the straight baseline lies in the middle. Additionally, it was clear that the upwind configuration had a lower pressure on the suction-side leading edge than its downwind counterpart, which was in agreement with the larger force of the upwind coning described in Figure 5.

3.2. Special Coned Configurations: C4S0, C4S1, C4S2, C4, C-4S0, C-4S1, C-4 S2 and C-4

3.2.1. Overall Force Performance

Configuration C-4S2 gives the lowest thrust among the cases listed in Table 3, i.e., 7.30% lower than the baseline rotor. C-4S2 had the largest blade tip offset among the upwind configurations. Although C-4S2 reduced the torque by 1.96%, it still had the largest torque-to-thrust ratio QT due to the large reduction of thrust. The downwind counterpart C4S2 produced the lowest Q and the lowest QT, which was unfavorable. The upwind configuration surpassed its downwind counterpart, as also revealed in the pairs of C4 and C-4, C4S0 and C-4S0. For these pairs, the upwind coned rotors had a smaller T, a larger Q and a higher QT than their downwind coned counterparts. However, for the pairs C4S1 and C-4S1, the downwind configuration C4S1 had a higher QT. Interestingly, the blade tip of the downwind configuration C4S1 was pointing upwind, which may be the reason why C4S1 had a higher QT. Lastly, it should also be noted that the radial velocity component is omitted in the traditional BEM method. Therefore, the same results will be obtained for an upwind configuration and its downwind counterpart, such as C4S2 and C-4S2, which is clearly in contrast with reality. In Table 3, it may be seen that the thrust discrepancy between C4S2 and C-4S2 reached nearly 8%. The torque discrepancy was approximately 5%. These results reveal that the inaccuracies of traditional BEM methods are not negligible, making the conclusions from [9,10,11,12,13,14] in Section 1 disputable.

3.2.2. Distributed Force Performances

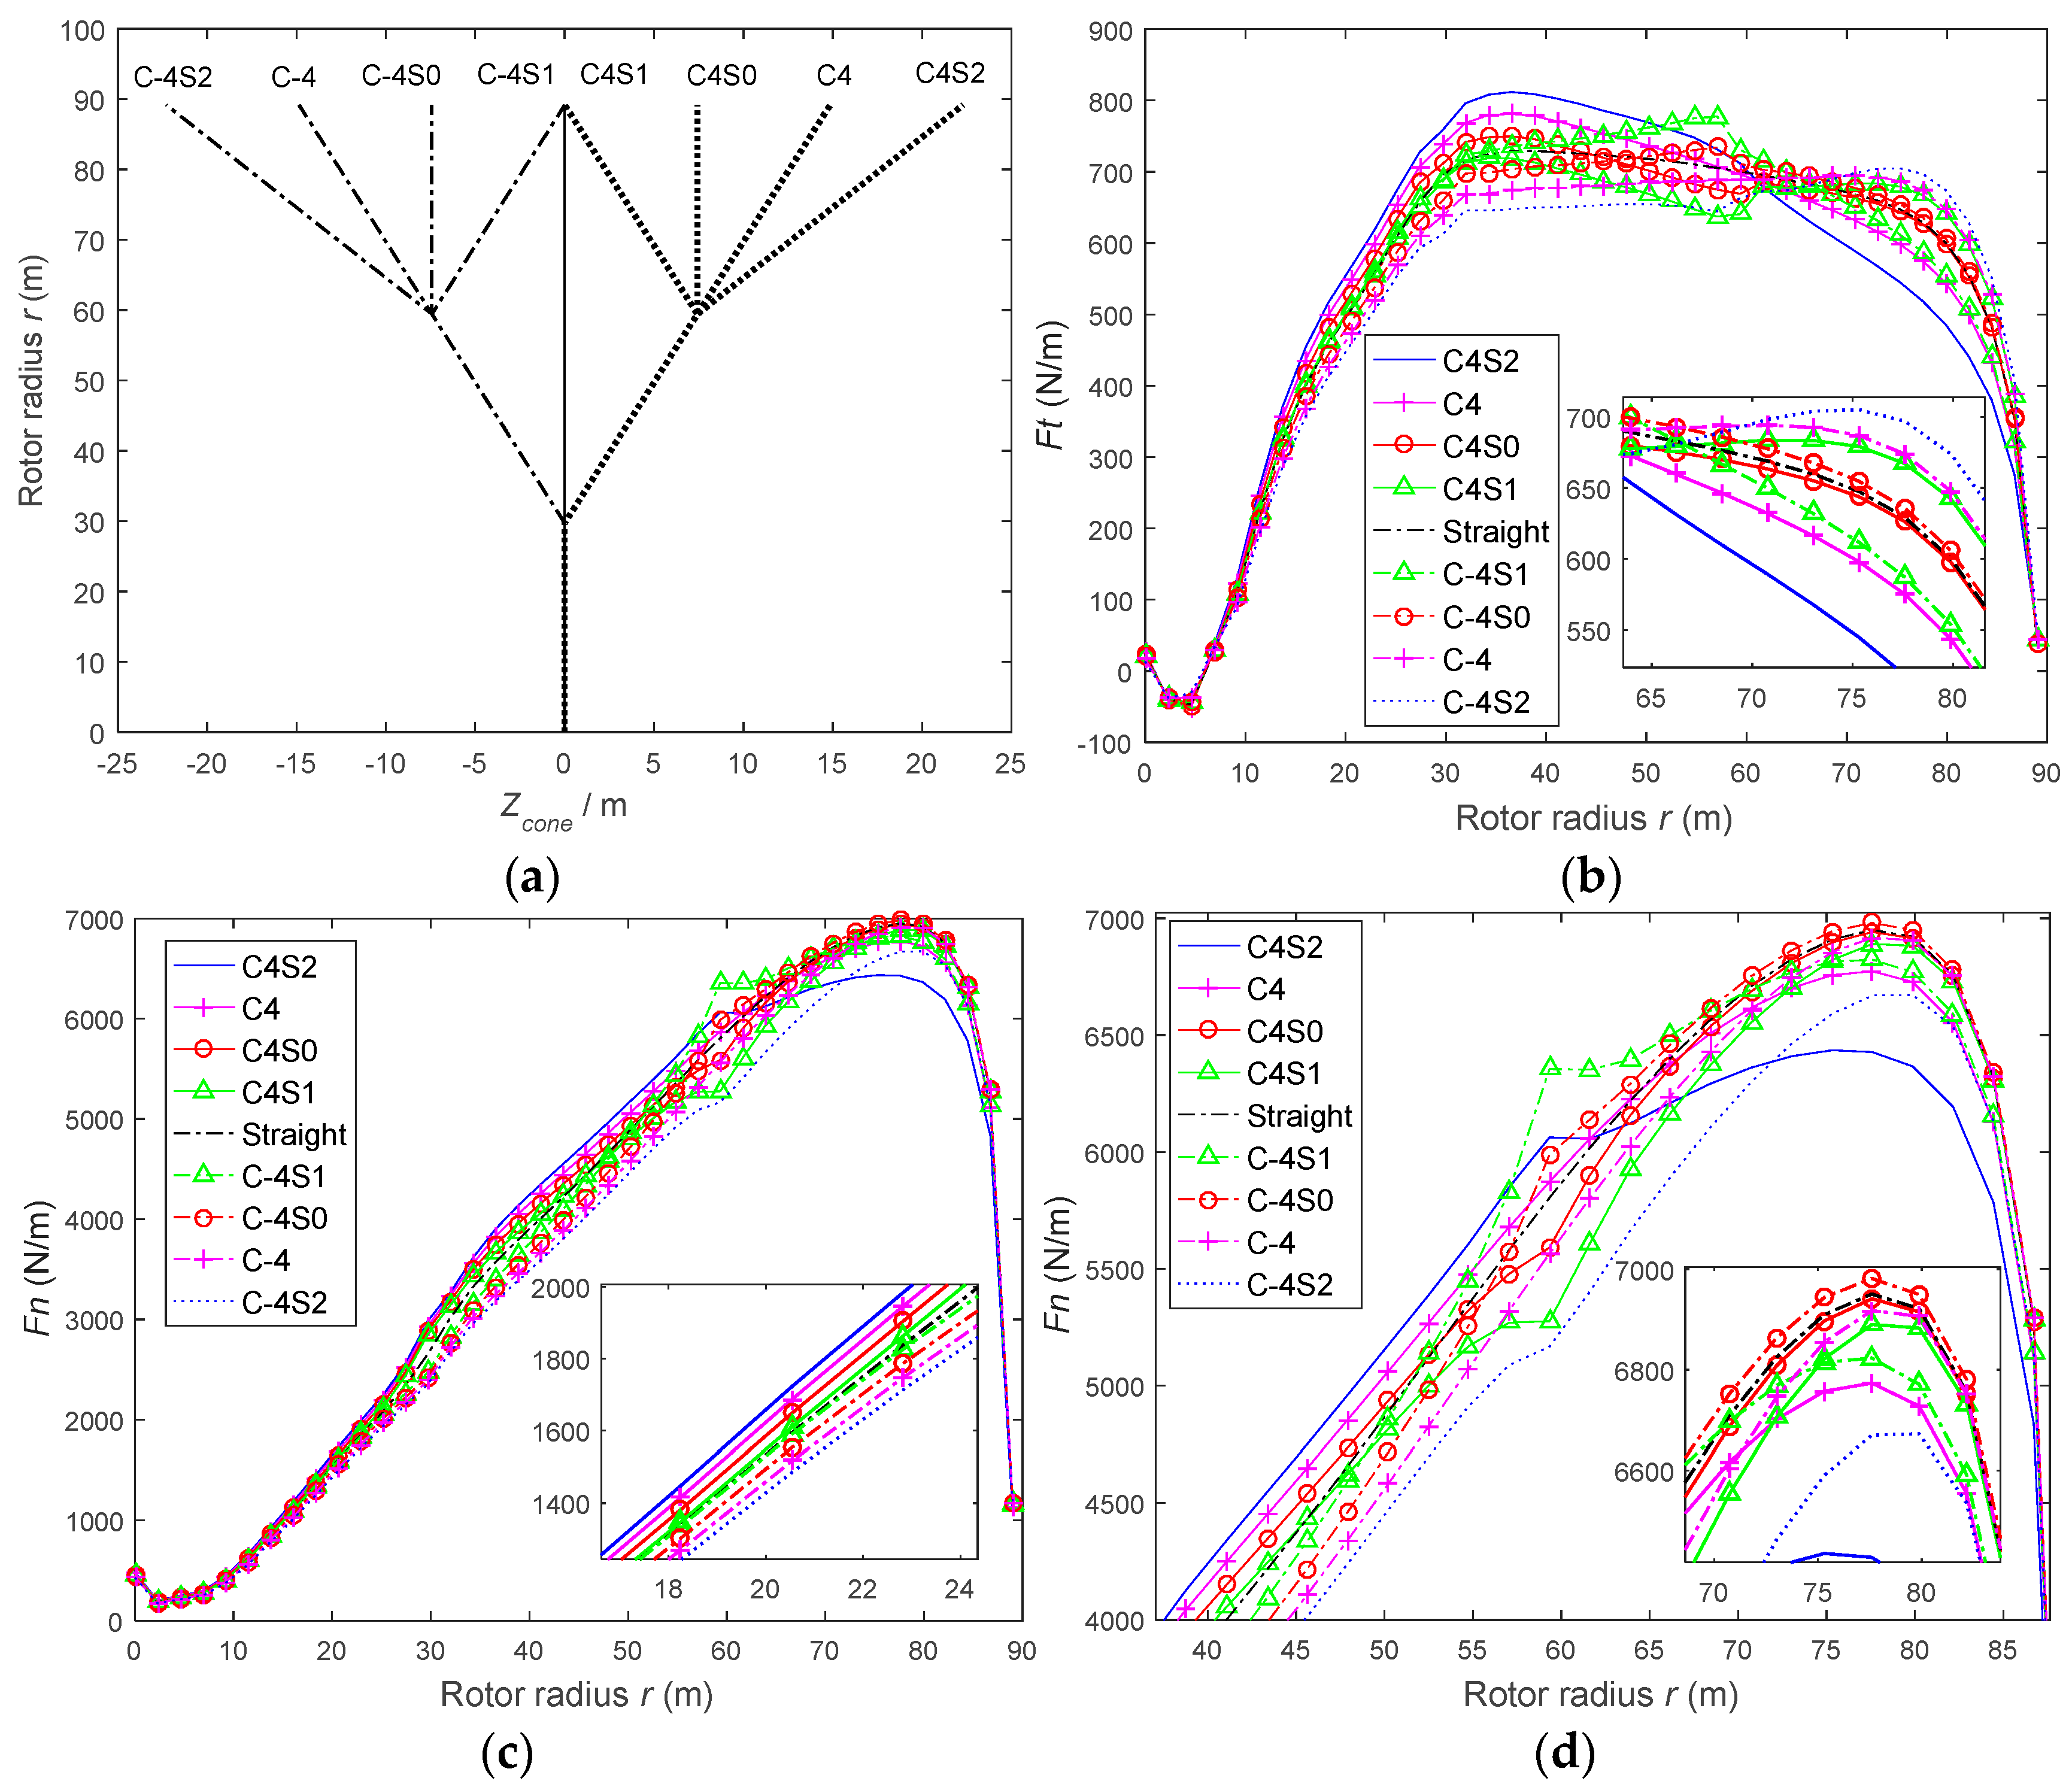
The axial force Fz and tangential force Ft per unit length are compared in Figure 11. Figure 2b is redrawn in Figure 11a, where the upwind configurations are denoted by the dashed lines and downwind by the dotted lines. Clearly, C4S0 and C-4S0 had the same configuration as the straight baseline when r > 2R/3, or in other words, without coning. As a result, the Ft and Fz curves of C4S0, C-4S0 and the straight baseline were very close. In the same spanwise range, C4 and C-4S1 had the same cone angle, as did C-4 and C4S1. Correspondingly, the same cone angle led to close Ft and Fz curves. The discrepancy between the close curves increased towards r = 2R/3, because the coning point at r = 2R/3 distorted the nearby flow. In short, the same cone angle near the tip will lead to close force distribution.
When R/3 < r < 2R/3, the four configurations C4S2, C4, C4S0, C4S1 had the same cone angle as shown in Figure 11a. Additionally, their counterparts C-4S2, C-4, C-4S0, C-4S1 had the same cone angle as well. However, none of the Ft and Fz curves coincided, even if the same cone angles existed, as shown in Figure 11b,c, which indicated that the cone effect in this range was not solely controlled by the cone angle itself. Additionally, traditional BEM methods will predict the same force distribution under the same cone angle, which implies that such an approach is not applicable here. When r < R/3, all the cone configurations coincided with the straight baseline. However, only C4S1 and C-4S1 had close force distributions comparable to the straight baseline. The force distribution of C ± 4S2, C ± 4 and C4 ± S0 varied from configuration to configuration. It was found that C4S1 and C-4S1 were totally different cone configurations at r > R/3, but that they had the same blade tip position as the straight baseline. This implies that the influence of the coned part on the straight part is mostly determined by the blade tip position. Traditional BEM will predict the same force distribution again, or fail at r < R/3, even if all the configurations have a zero cone angle.
There are many interesting phenomena between the curves in Figure 11. Looking closely at group C4S2, C4, C4S0, and C4S1, the Ft and Fz curves (especially Ft lines) are nearly parallel with each other in the range of R/3 < r< 2R/3. The case C4S2 had the highest force curves, and C4, C4S0, and C4S1 had successively lower forces. Coincidently, this was consistent with the successively upstream-moving of the tip positions from Z = 3Ztip to 2Ztip, Ztip and 0 m (Ztip = 7.4292 m). If the blade tip is located at a more upstream position, it will cause the blade sections to be further immersed in the wake, which will lead to a stronger axial induction velocity Wz, a smaller axial inflow velocity, and a lower αz and αn. The variation of αz and αn will be validated later in Section 3.2.3. In short, the upwind transformation of the blade tip is consistent with the successive reduction of the Fz and Ft curves. Focusing on the four counterparts, C-4S2, C-4, C-4S0, and C-4S1, the curves were nearly parallel and successively ascending with the downstream-moving of the blade tips. Transforming the blade tip into a further downstream position, the blade sections immerse less heavily into the tip vortex trace, leading to a smaller Wz and a higher αn. Additionally, the nearly parallel curves of C4S2, C4, C4S0, and C4S1 had different slopes compared with those of C-4S2, C-4, C-4S0, and C-4S1, and apparently different slopes compared with the baseline rotor.

3.2.3. Flow Field Analysis

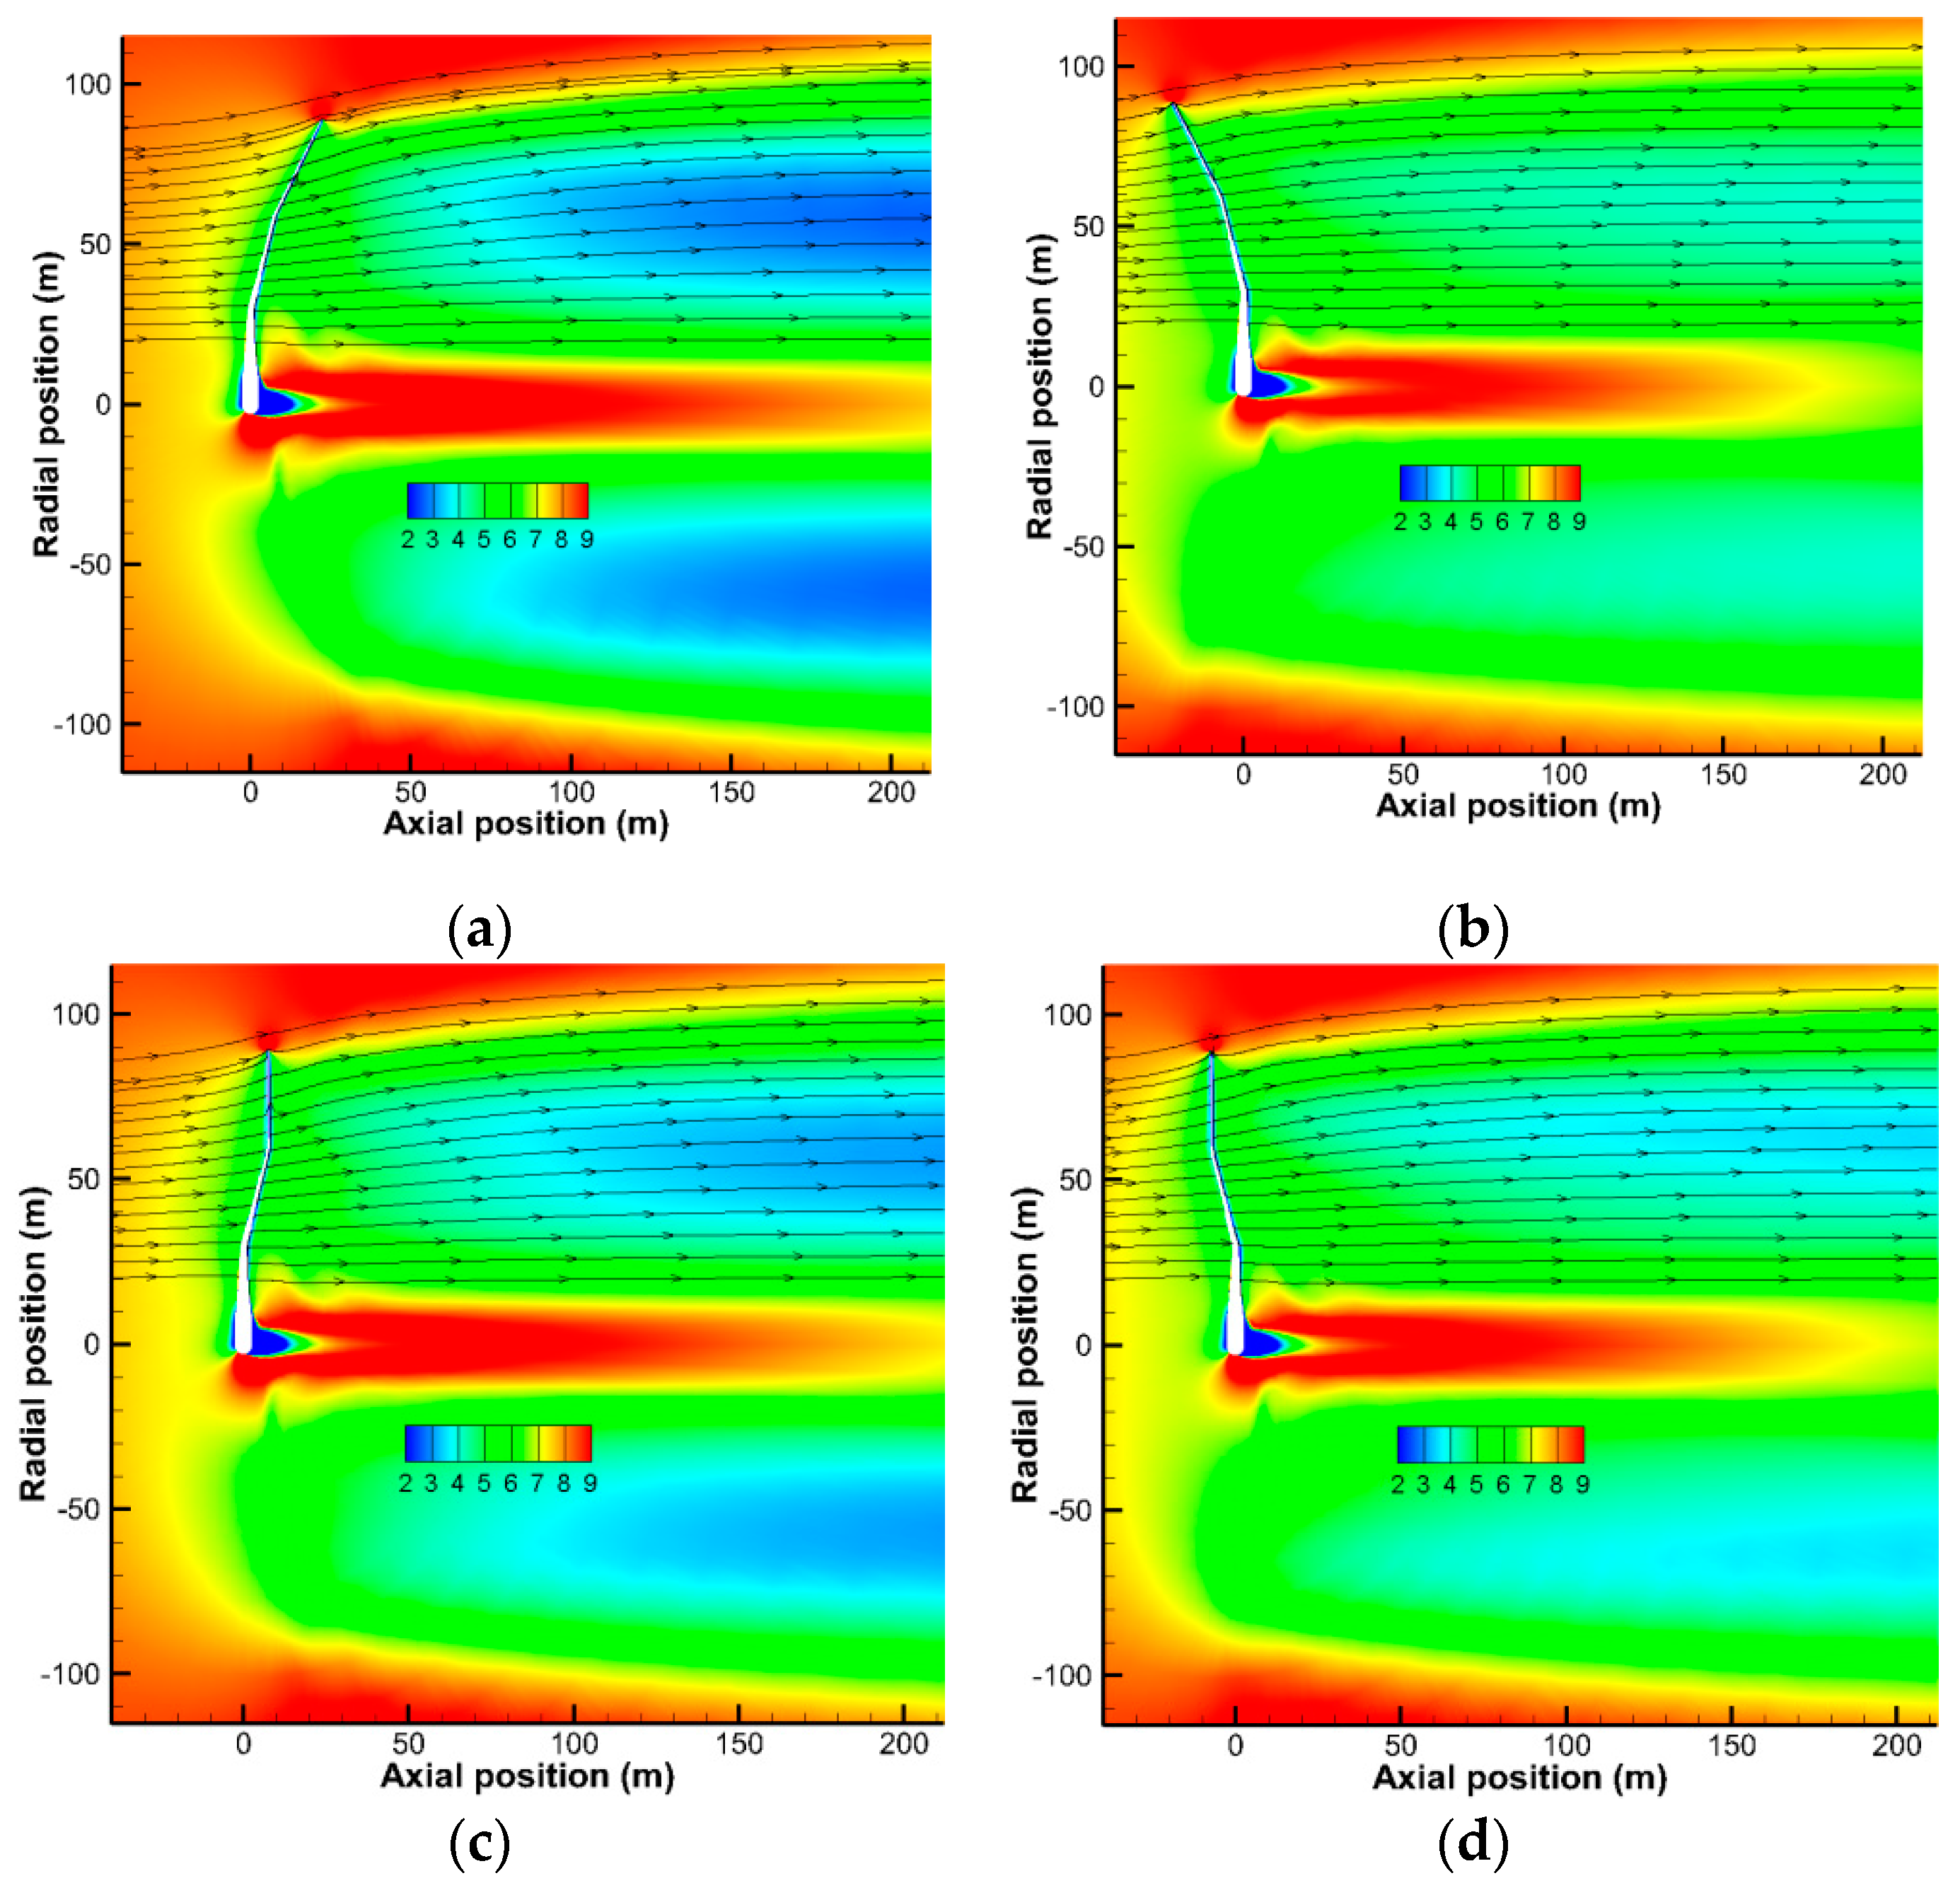
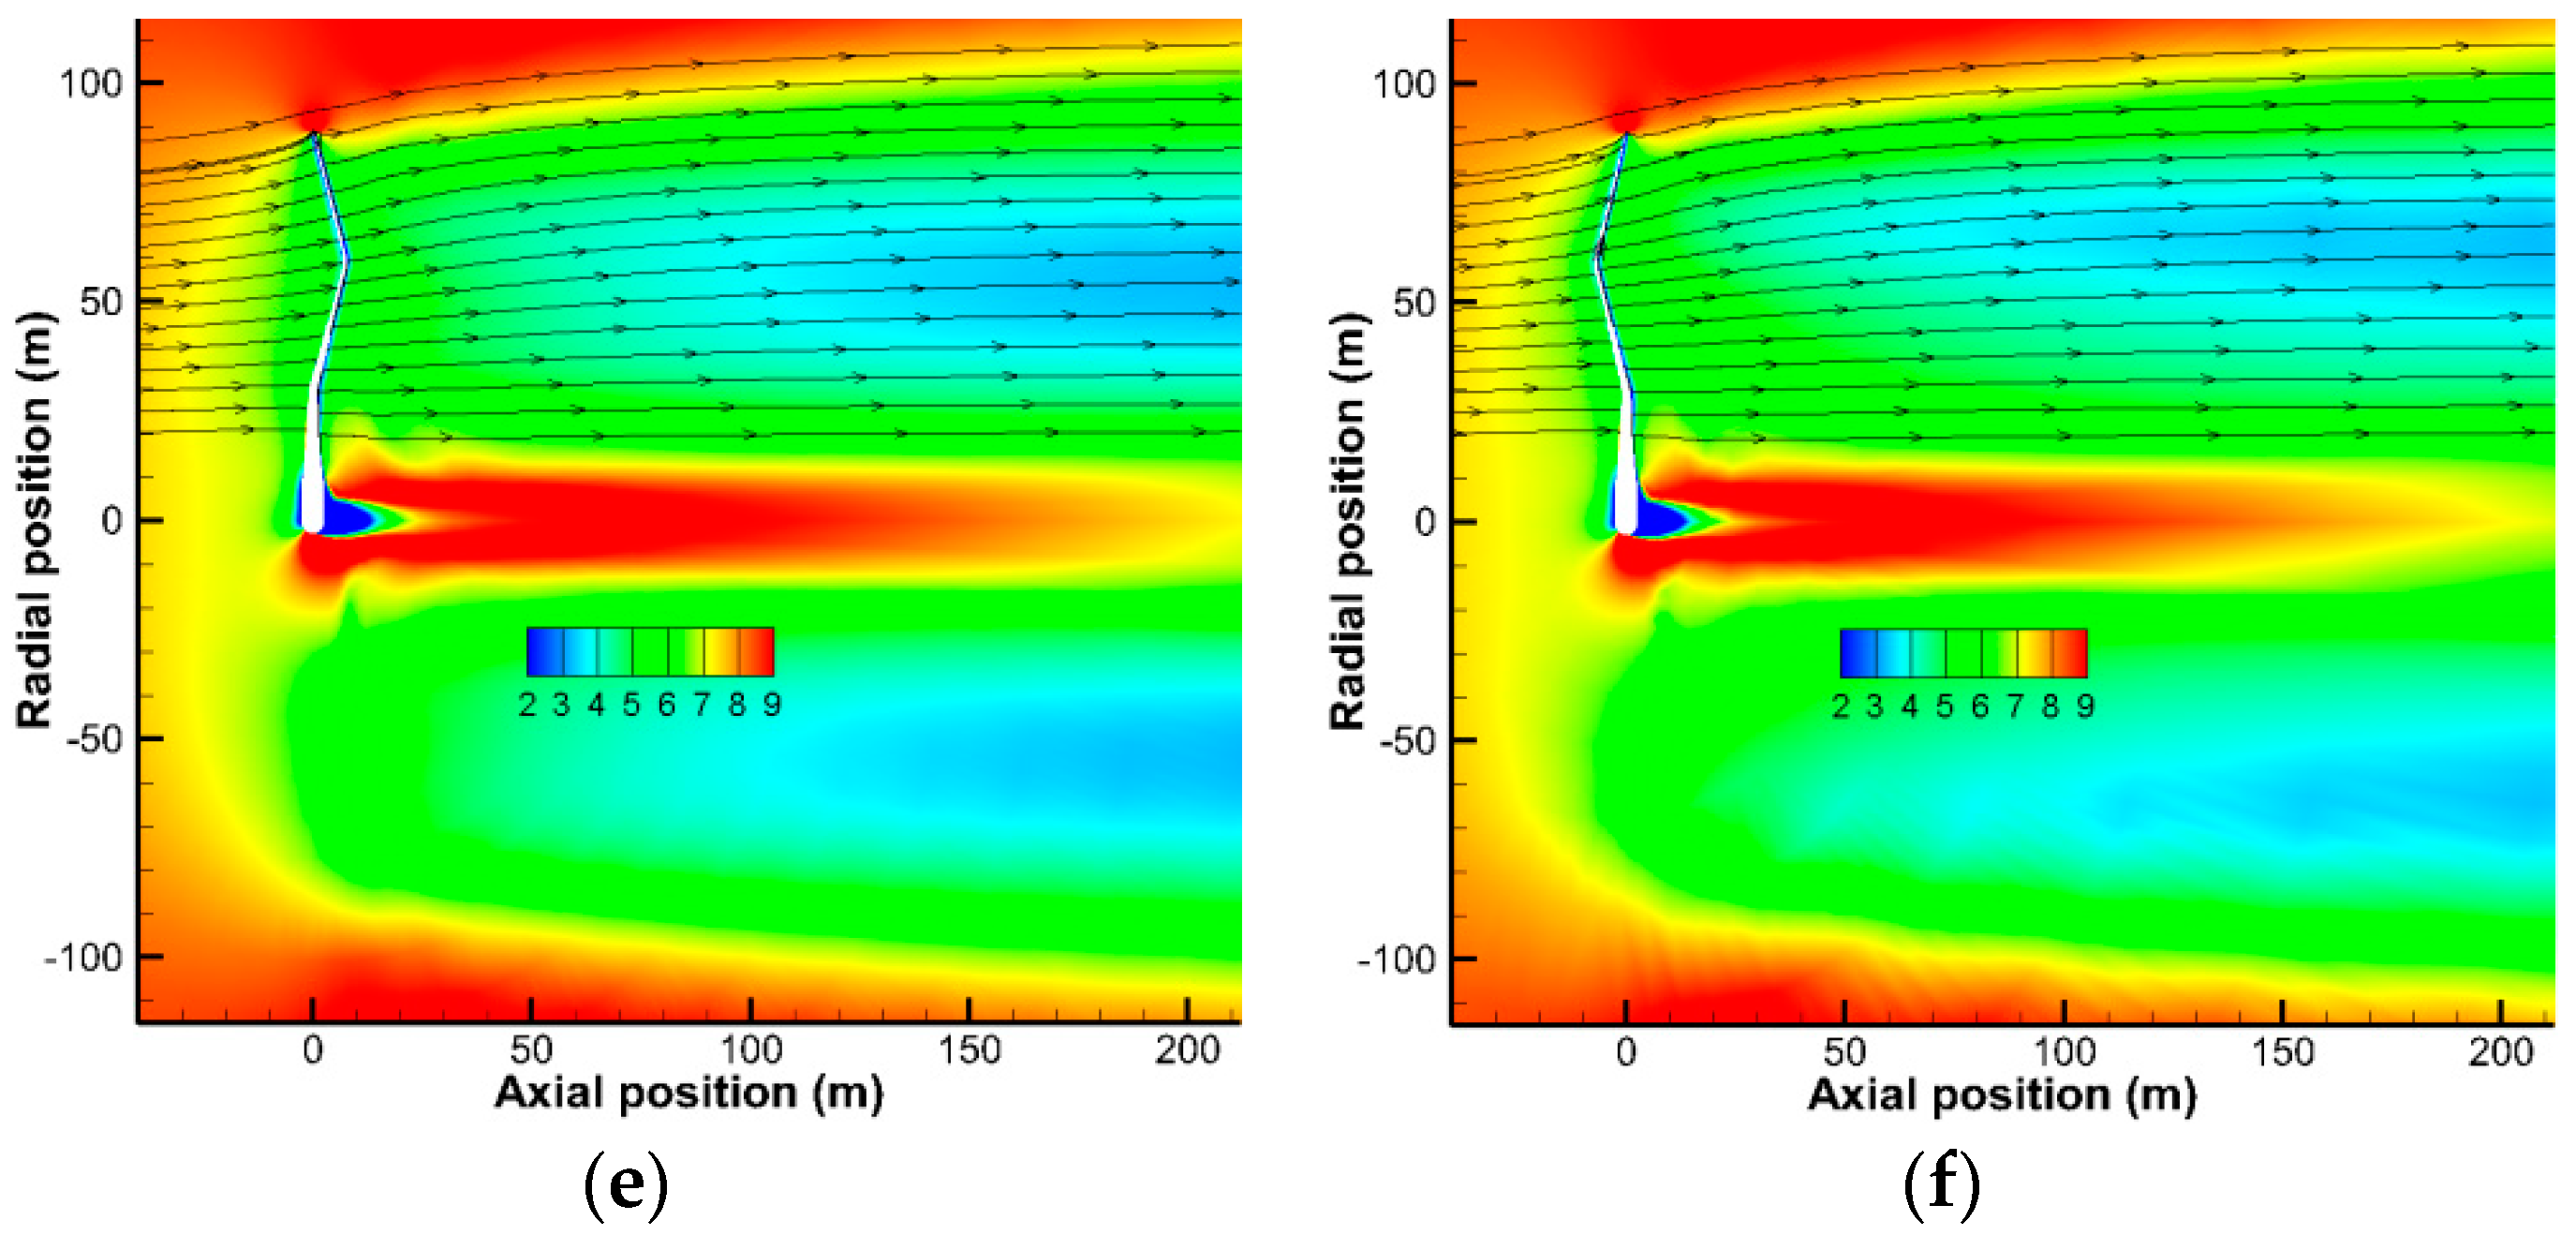
To understand the force characteristics presented in Section 3.2.2, further flow field analyses were carried out. Firstly, the streamline and the axial velocity contour in the YZ plane of C ± 4S2, C ± 4S0, and C ± 4S1 are shown in Figure 12. In the range of R/3 < r < 2R/3, the downwind cone C4S2 shown in Figure 12a had obviously lower velocity in the near wake region than that of C-4S2 shown in Figure 12b. This revealed that more energy was extracted by C4S2, which is consistent with the higher thrust force in Figure 11. Additionally, the downwind C4S2 had slightly larger wake expansion, which means a larger radial velocity. If the three figures on the left hand side are compared, the wake deficit is weaker and weaker when the blade tip is successively moving upstream from Figure 12a to Figure 12c,e. This means that the energy extracted by the rotor was progressively smaller, which is in agreement with the successive decline in the Ft and Fz curves in the range R/3 < r < 2R/3 in Figure 11. If the right hand side figures are compared, the wake deficit becomes stronger when the blade tip transforms downstream. This also confirms the successive increases in the Ft and Fz curves from C-4S2 to C-4S0 and then C-4S1. In the range r > 2R/3, the streamlines of C4S1 and C4S2 were the most and the least perpendicular streamlines w.r.t. to the blade, respectively, which led to the largest and smallest Fn. But, as shown in Equation (6), the large cone angle β reduces the value of Fz, which causes the Fz of C4S1 to barely surpass the baseline.
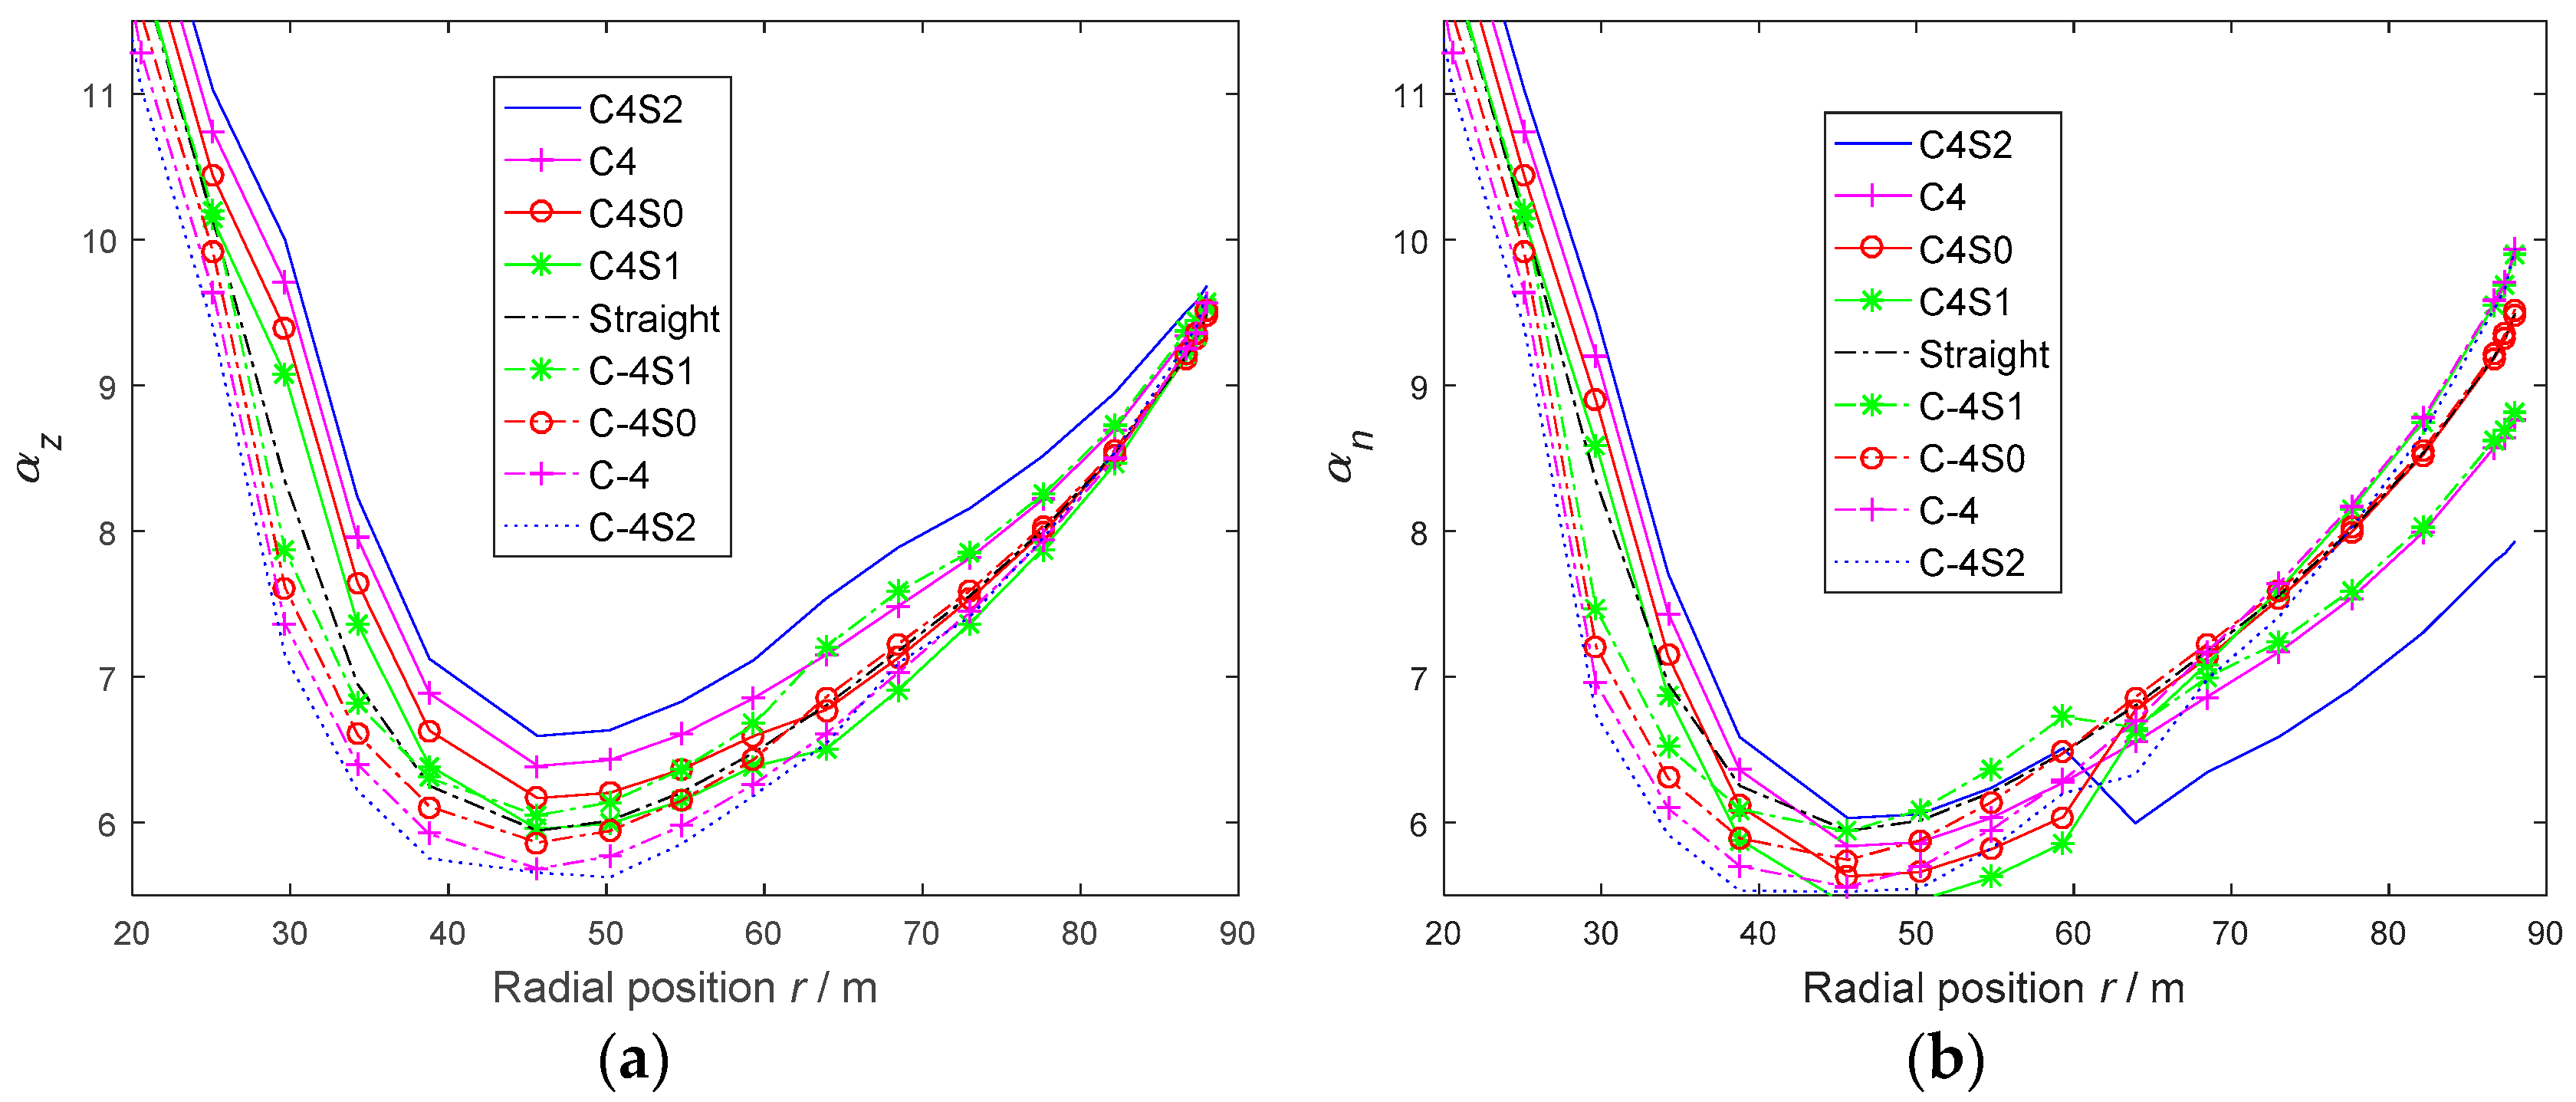
Utilizing the AAT AOA-extraction method introduced in Section 3.1.2, the αz and αn at different radial positions are compared in Figure 13. In the range of r > 2R/3, the αz and αn of C4S0 and C-4S0 nearly coincided with the straight baseline, which was consistent with the close Ft and Fz curves, as shown in Figure 11. This was because the three configurations were all without coning. What is more, C4 and C-4S1 had the same cone angle, which led to close αn distributions. Similarly, C-4 and C4S1 also had close αn distributions. In the range of R/3 < r < 2R/3, the four configurations, C4S2, C4, C4S0 and C4S1, had nearly parallel αn curves. The αn line of C4S2 was the highest, and C4, C4S0 and C4S1 had successively lower curves, which matched the successive decreases of the Ft and Fz curves in Figure 11. As discussed in Section 3.2.2, this was caused by the upstream movement of the tip positions, which made caused the blade sections to be further immersed into the wake, leading to decreases in αz and αn. In contrast, focusing on the group C-4S2, C-4, C-4S0, and C-4S1, the αn curves successively ascended with the downstream movement of the blade tips. In the range of r < R/3, C4S1 and C-4S1 had similar αz and αn distributions to the straight baseline. This was because the three configurations had the same blade tip position, although distinctly different cones appeared at r > R/3. Generally speaking, the αn distributions matched the force distributions in Figure 11. It is clear that the αn distributions can reveal the mechanism of force distributions on coned sections, even if the blades are coned into three parts. Additionally, correctly commutating αn is of vital importance for improving the traditional BEM method, although further discussion of this is beyond the scope of this paper.

4. Conclusions

In future designs of super-large wind turbines, the question of being upwind or downwind will be an important one for the wind energy industry. The present paper put forward a conceptual design consisting of an actively load-aligned blade tip and a fixed load-aligned blade root. In order to evaluate the advantages and disadvantages of these concepts, it is of vital importance to carefully select appropriate tools. Different conning configurations, including special cones with three segments, were simulated and analyzed based on a 10 MW reference rotor. The results provide knowledge regarding the complex force distributions of these configurations, and could serve to improve the traditional BEM on traditionally or specially coned rotors.
Up- and down- wind coning approaches yield different aerodynamic performance, e.g., in their total integrated loading, distributed force, and flow fields. The force distributions and their differences may be explained by the concept of the angle of attack. It was found that parameters which have the greatest influence on the angle of attack are the position of blade tip and the cone angle. The blade tip position determines the induction velocity contour, and subsequently, the inflow velocity at the blade sections. With the upstream movement of the blade tip, blade sections away from the tip will be immersed more heavily in the tip vortex trace. Then, the blade sections will suffer from stronger axial induction, smaller axial inflow velocity, a lower angle of attack, and consequently, a lower force distribution. The downstream movement of the blade tip has the opposite effect. The cone angle determines the velocity and force projecting process from the axial to the normal direction, which influences the thrust and tangential forces in the normal and axial directions. The correct inflow velocity decomposition, which connects the axial and normal directions, is indispensable. The same relative blade tip position and cone angle will result in the same force; however, applying the same tip position or cone configuration alone does not guarantee the same aerodynamic performance.
The aerodynamic performance discrepancy between an upwind cone and its downwind counterpart is significant. In the present study, the most upwind and downwind cones had a thrust difference up to 8% and a torque difference of up to 5%. Nevertheless, the traditional BEM method could not differentiate an upwind cone from its downwind counterpart under the same chord, twist and airfoil distributions. Many studies on load-aligned concepts or comparing upwind/downwind designs have utilized tools based on traditional BEM, which arguably makes their conclusions disputable. A correction to the traditional BEM method must be made before it can be used to assess new cone concepts. Such an improved BEM should consider the influence of blade tip position and cone angle, and adopt the corrected inflow velocity decomposition. To date, debate over up- or down-wind coning is ongoing. The design and optimization of super-large coned rotors still has a long way to go.

Author Contributions

Conceptualization, Z.S. and W.Z.; methodology, Z.S. and W.Z.; software, W.S. and W.Z.; validation, Z.S., W.Z. and W.S.; formal analysis, Z.S., W.Z., W.S. and Q.T.; investigation, Z.S.; resources, W.Z. and W.S.; data curation, Z.S., Q.T., J.C., X.L. and W.S.; writing—original draft preparation, Z.S., W.Z. and W.S.; writing—review and editing, Z.S., W.Z. and W.S.; visualization, Z.S.; supervision, W.Z. and W.S.; project administration, W.Z.; funding acquisition, Z.S. and W.Z. All authors have read and agreed to the published version of the manuscript.

Funding

This research was funded by the National Nature Science Foundation of China under grant number 51905469 and 11672261; the National key research and development program of China under grant number 2019YFE0192600; the Nature Science Foundation of Yangzhou under grant number YZ2019074; an open funding from Shanxi Key Laboratory of Industrial Automation under grant number SLGPT2019KF01-13.

Institutional Review Board Statement

Not applicable.

Informed Consent Statement

Not applicable.

Data Availability Statement

Data available on request due to restrictions eg privacy or ethical. The data presented in this study are available on request from the corresponding author. The data are not publicly available due to the large volume of CFD data.

Conflicts of Interest

The authors declare no conflict of interest.

References

  1. Fingersh, L.; Hand, M.; Laxson, A. Wind Turbine Design Cost and Scaling Model; Office of Scientific and Technical Information (OSTI): Oak Ridge, TN, USA, 2006.
  2. Loth, E.; Steele, A.; Ichter, B.; Selig, M.; Moriarty, P.J. Segmented Ultralight Pre-Aligned Rotor for Extreme-Scale Wind Turbines. In Proceedings of the 50th AIAA Aerospace Sciences Meeting including the New Horizons Forum and Aerospace Exposition, Nashville, TN, USA, 9–12 January 2012. [Google Scholar] [CrossRef] [Green Version]
  3. Barlas, T.K.; Van Kuik, G.A.M. Review of state of the art in smart rotor control research for wind turbines. Prog. Aerosp. Sci. 2010, 46, 1–27. [Google Scholar] [CrossRef]
  4. Barnes, R.; Morozov, E. Structural optimisation of composite wind turbine blade structures with variations of internal geometry configuration. Compos. Struct. 2016, 152, 158–167. [Google Scholar] [CrossRef]
  5. Chen, J.; Wang, Q.; Shen, W.; Pang, X.; Li, S.; Guo, X. Structural optimization study of composite wind turbine blade. Mater. Des. 2013, 46, 247–255. [Google Scholar] [CrossRef]
  6. Sun, Z.; Sessarego, M.; Chen, J.; Shen, W. Design of the OffWindChina 5 MW Wind Turbine Rotor. Energies 2017, 10, 777. [Google Scholar] [CrossRef] [Green Version]
  7. Crawford, C.; Platts, J. Updating and Optimization of a Coning Rotor Concept. In Proceedings of the 44th AIAA Aerospace Sciences Meeting and Exhibit, Reno, Nevada, 9–12 January 2006; pp. 9–12. [Google Scholar] [CrossRef]
  8. Steele, A.; Ichter, B.; Qin, C.; Loth, E.; Selig, M.; Moriarty, P. Aerodynamics of an Ultra light Load-Aligned Rotor for Extreme-Scale Wind Turbines. In Proceedings of the 51st AIAA Aerospace Sciences Meeting Including the New Horizons Forum and Aerospace Exposition, Grapevine, TX, USA, 7–10 January 2013. [Google Scholar]
  9. Noyes, C.; Qin, C.; Loth, E. Pre-aligned downwind rotor for a 13.2 MW wind turbine. Renew. Energy 2018, 116, 749–754. [Google Scholar] [CrossRef]
  10. Noyes, C.; Qin, C.; Loth, E. Analytic analysis of load alignment for coning extreme-scale rotors. Wind. Energy 2020, 23, 357–369. [Google Scholar] [CrossRef]
  11. Qin, C.; Loth, E.; Zalkind, D.S.; Pao, L.Y.; Yao, S.; Griffith, D.T.; Selig, M.S.; Damiani, R. Downwind coning concept rotor for a 25 MW offshore wind turbine. Renew. Energy 2020, 156, 314–327. [Google Scholar] [CrossRef]
  12. Wanke, G.; Bergami, L.; Larsen, T.J.; Hansen, M.H. Changes in design driving load cases: Operating an upwind turbine with a downwind rotor configuration. Wind. Energy 2019, 22, 1500–1511. [Google Scholar] [CrossRef]
  13. Bortolotti, P.; Kapila, A.; Bottasso, C.L. Comparison between upwind and downwind designs of a 10 MW wind turbine rotor. Wind. Energy Sci. 2019, 4, 115–125. [Google Scholar] [CrossRef] [Green Version]
  14. Ning, A.; Petch, D. Integrated design of downwind land-based wind turbines using analytic gradients. Wind. Energy 2016, 19, 2137–2152. [Google Scholar] [CrossRef] [Green Version]
  15. Mikkelsen, R.; Sørensen, J.N.; Shen, W.Z. Modelling and analysis of the flow field around a coned rotor. Wind. Energy 2001, 4, 121–135. [Google Scholar] [CrossRef]
  16. Madsen, H.A.; Bak, C.; Døssing, M.; Mikkelsen, R.F.; Øye, S. Validation and modification of the Blade Element Momentum theory based on comparisons with actuator disc simulations. Wind. Energy 2010, 13, 373–389. [Google Scholar] [CrossRef]
  17. Crawford, C. Re-examining the precepts of the blade element momentum theory for coning rotors. Wind. Energy 2006, 9, 457–478. [Google Scholar] [CrossRef]
  18. Madsen, H.A.; Rasmussen, F. The influence on energy conversion and induction from large blade deflections. In Proceedings of the 1999 European Wind Energy Conference and Exhibition, Nice, France, 1–5 March 1999. [Google Scholar]
  19. Farhan, A.; Hassanpour, A.; Burns, A.; Motlagh, Y.G. Numerical study of effect of winglet planform and airfoil on a horizontal axis wind turbine performance. Renew. Energy 2019, 131, 1255–1273. [Google Scholar] [CrossRef]
  20. Chattot, J.-J. Effects of blade tip modifications on wind turbine performance using vortex model. Comput. Fluids 2009, 38, 1405–1410. [Google Scholar] [CrossRef]
  21. Shen, X.; Chen, J.-G.; Zhu, X.-C.; Liu, P.-Y.; Du, Z.-H. Multi-objective optimization of wind turbine blades using lifting surface method. Energy 2015, 90, 1111–1121. [Google Scholar] [CrossRef] [Green Version]
  22. Xie, W.; Zeng, P.; Lei, L. A novel folding blade of wind turbine rotor for effective power control. Energy Convers. Manag. 2015, 101, 52–65. [Google Scholar] [CrossRef]
  23. Kress, C.; Chokani, N.; Abhari, R. Downwind wind turbine yaw stability and performance. Renew. Energy 2015, 83, 1157–1165. [Google Scholar] [CrossRef]
  24. Kress, C.; Chokani, N.; Abhari, R.S. Design Considerations of rotor cone angle for downwind wind turbines. In Proceedings of the ASME Turbo Expo 2015: Turbine Technical Conference and Exposition, Montreal, QC, Canada, 15–19 June 2015. [Google Scholar] [CrossRef]
  25. Sun, Z.; Zhu, W.; Shen, W.; Zhong, W.; Cao, J.; Tao, Q. Aerodynamic Analysis of Coning Effects on the DTU 10 MW Wind Turbine Rotor. Energies 2020, 13, 5753. [Google Scholar] [CrossRef]
  26. Zahle, F.; Bak, C.; Sørensen, N.N.; Guntur, S.; Troldborg, N. Comprehensive Aerodynamic Analysis of a 10 MW Wind Turbine Rotor Using 3D CFD. In Proceedings of the 32nd ASME Wind Energy Symposium, National Harbor, MD, USA, 13–17 January 2014. [Google Scholar] [CrossRef]
  27. The DTU 10MW Reference Wind Turbine Project Site. Available online: https://rwt.windenergy.dtu.dk/dtu10mw/dtu-10mw-rwt (accessed on 6 November 2018).
  28. Jost, E.; Lutz, T.; Krämer, E. Steady and Unsteady CFD Power Curve Simulations of Generic 10 MW Turbines. In Proceedings of the 11th EAWE PhD Seminar on Wind Energy in Europe, Stuttgart, Germany, 23–25 September 2015. [Google Scholar]
  29. Menter, F.R. Two-equation eddy-viscosity turbulence models for engineering applications. AIAA J. 1994, 32, 1598–1605. [Google Scholar] [CrossRef] [Green Version]
  30. Sørensen, N.N. General Purpose Flow Solver Applied to Flow over Hills. Ph.D. Thesis, Technical University of Denmark, Lyngby, Denmark, September 1995. [Google Scholar]
  31. Jost, E.; Klein, L.; Leipprand, H.; Lutz, T.; Krämer, E. Extracting the angle of attack on rotor blades from CFD simulations. Wind. Energy 2018, 21, 807–822. [Google Scholar] [CrossRef]
  32. Rahimi, H.; Schepers, J.; Shen, W.; García, N.R.; Schneider, M.; Micallef, D.; Ferreira, C.S.; Jost, E.; Klein, L.; Herráez, I. Evaluation of different methods for determining the angle of attack on wind turbine blades with CFD results under axial inflow conditions. Renew. Energy 2018, 125, 866–876. [Google Scholar] [CrossRef] [Green Version]
  33. Hansen, M.O.; Sørensen, N.N.; Michelsen, J. Extraction of lift, drag and angle of attack from computed 3-D viscous flow around a rotating blade. In Proceedings of the 1997 European Wind Energy Conference, Dublin, Ireland, 6–9 October 1997. [Google Scholar]
Figure 1. New concept of a combination of a fixed and an active load-alignment: (a) blade shape under different wind conditions; (b) sketch of load-alignment.
Applsci 11 00147 g001
Figure 2. Conning configurations: (a) Ttrans = 5/R with Ccone = ±4, ±8 and Ttrans = 1/3 with Ccone = ±4; (b) special configurations abbreviated as C4S0, C4S1, C4S2, C4, C-4S0, C-4S1, C-4 S2 and C-4.
Applsci 11 00147 g002
Figure 3. Down/upwind coned configurations with Ccone = ±4 and Ttrans = 1/3: (a) C4 and C-4; (b) C4S0 and C-4S0; (c) C4S1 and C-4S1; (d) C4S2 and C-4S2; (e) straight baseline.
Applsci 11 00147 g003
Figure 4. Mesh around the blades: (a) blade surface mesh; (b) mesh on a section away from the near-blade blocks; (c) mesh on an airfoil cross-section in the near-blade region.
Applsci 11 00147 g004
Figure 5. Force distributions along radial direction: (a) tangential force; (b) axial force.
Applsci 11 00147 g005
Figure 6. Inflow velocity decomposition for an upwind and a downwind coned rotor.
Applsci 11 00147 g006
Figure 7. Sketch of points used by AAT to extract AOA: (a) straight baseline; (b) coned rotor.
Applsci 11 00147 g007
Figure 8. Streamlines in the YZ plane with axial velocity contours for the two coned configurations: (a) upwind coned rotor of Ttrans = 5/R, Ccone = −4; (b) downwind coned rotor of Ttrans = 5/R, Ccone = 4.
Applsci 11 00147 g008
Figure 9. Distributions of angle of attack: (a) αz; (b) αn.
Applsci 11 00147 g009aApplsci 11 00147 g009b
Figure 10. Streamlines and pressure on r = 77.59 m normal-cut plane: (a) upwind coning of Ttrans = 5/R, Ccone = −4; (b) straight baseline; (c) downwind coning of Ttrans = 5/R, Ccone = 4; (d) comparisons of streamlines near stagnation points.
Applsci 11 00147 g010
Figure 11. Comparison of special coning: (a) redrawn of special cone configurations; (b) tangential force; (c) axial force; (d) zoomed view of axial force.
Applsci 11 00147 g011
Figure 12. Streamline in the YZ plane with axial velocity contours: (a) C4S2; (b) C-4S2; (c) C4S0; (d) C-4S0; (e) C4S1; (f) C-4S1.
Applsci 11 00147 g012aApplsci 11 00147 g012b
Figure 13. Distributions of angle of attack: (a) αz; (b) αn.
Applsci 11 00147 g013
Table 1. The operational parameters.
Wind Speed (m/s)Pitch (Degree)Rotational Speed (RPM)
9.0000.0007.229
Table 2. Thrust and torque of different configurations (Ttrans = 5/R).
StraightCcone = 8Ccone = −8Ccone = 4Ccone = −4
T(KN)
δT
1046.061057.241025.851060.77998.63
0.00%1.07%−1.93%1.41%−4.53%
Q(KNm)
δQ
7283.117254.967268.087195.157205.48
0.00%−0.39%−0.21%−1.21%−1.07%
QT(m)
δQT
6.966.867.086.787.22
0.00%−1.44%1.76%−2.58%3.63%
Table 3. Thrust and torque of different configurations.
StraightC4S2C4C4S0C4S1C-4S1C-4S0C-4C-4S2
T(KN)
δT
1046.061051.371061.101054.991032.591040.551031.221005.89969.73
0%0.51%1.44%0.85%−1.29%−0.53%−1.42%−3.84%−7.30%
Q(KNm)
δQ
7283.117055.267197.347261.647254.337250.167280.187242.097140.14
0%−3.13%−1.18%−0.29%−0.40%−0.45%−0.04%−0.56%−1.96%
QT(m)
δQT
6.966.716.786.887.036.977.067.207.36
0%−3.62%−2.58%−1.14%0.90%0.07%1.40%3.41%5.75%
Publisher’s Note: MDPI stays neutral with regard to jurisdictional claims in published maps and institutional affiliations.