Article

Dynamic Pad Surface Metrology Monitoring by Swing-Arm Chromatic Confocal System

Department of Mechanical Engineering, National Taiwan University of Science and Technology, Taipei 106, Taiwan
*
Author to whom correspondence should be addressed.
Appl. Sci. 2021, 11(1), 179; https://doi.org/10.3390/app11010179
Submission received: 31 October 2020 / Revised: 16 December 2020 / Accepted: 23 December 2020 / Published: 27 December 2020
(This article belongs to the Special Issue Manufacturing Metrology)

Abstract

:
This study aims to develop a dynamic pad monitoring system (DPMS) for measuring the surface topography of polishing pad. Chemical mechanical planarization/polishing (CMP) is a vital process in semiconductor manufacturing. The process is applied to assure the substrate wafer or thin film on wafer that has reached the required planarization after deposition for lithographic processing of the desired structures of devices. Surface properties of polishing pad have a huge influence on the material removal rate (MRR) and quality of wafer surface by CMP process. A DPMS has been developed to analyze the performance level of polishing pad for CMP. A chromatic confocal sensor is attached on a designed fixture arm to acquire pad topography data. By swing-arm motion with continuous data acquisition, the surface topography information of pad can be gathered dynamically. Measuring data are analyzed with a designed FFT filter to remove mechanical vibration and disturbance. Then the pad surface profile and groove depth can be calculated, which the pad’s index PU (pad uniformity) and PELI (pad effective lifetime index) are developed to evaluate the pad’s performance level. Finally, 50 rounds of CMP experiments have been executed to investigate the correlations of MRR and surface roughness of as-CMP wafer with pad performance. Results of this study can be used to monitor the pad dressing process and CMP parameter evaluation for production of IC devices.

1. Introduction

Chemical-mechanical planarization/polishing (CMP) has been known as a key process for global and local planarization in IC fabrication. Because of the urgent demands for conducting linewidth of IC device downsizing to nanometers, the stability and availability of CMP process have become critically significant [1,2] for high volume production. The polishing pad used in CMP process is one of the most important consumables for affecting CMP process output [3]. The material removal rate (MRR) and planarization ability of the process are determined by the structure and material properties of polishing pads [4]. The slurry contains abrasive particles on the wafer surface for removal of the passivated layer after chemical activation. Currently, a CMP tool is not capable of fully monitoring the polishing pad on-line. Usually it only measures the groove depth and pad thickness or by empirical analysis [5,6,7]. Some efficiency indicators of pad performance can be established with measuring the surface topography, such as roughness and bearing area ratio so that the polishing pad could be efficiently utilized [8,9,10]. The asperities and profile of pad are associated with MRR and final quality of as-CMP wafer. The asperities and groove depth of pad are gradually worn with CMP processes. The pad conditioning or dressing process is necessary to restore the pad surface, but the profile and groove depth are changed with the numbers of conditioning. As the pad topography will effectively influence the MRR and polishing results, different kinds of measuring methods are developed to monitor the change of the pad surface [11,12,13]. Nowadays, the methods of analysis of pad topography are mostly for static and partial area [5]. Additionally, judging the efficiency of polishing pad and lifetime are based on groove depth and thickness. Better methods are those that establish a system which can achieve bigger area scanning and extract pad surface topography easily and faster. Accurate results can be obtained using optical microscope, but the polishing pad needs to be cut and comprehensive measurement cannot be achieved. The pad profiler can achieve a scan of a full pad, but still requires a high measurement time and the mechanical parts are easily affected by environmental pollution. Thus, there is not yet available for dynamic measurement of pad topography before and after CMP or pad conditioning processes.
This study aims to develop a dynamic pad monitoring system (DPMS) for measuring the surface topography of polishing pad. A swing-arm type conditioner is widely used in modern polishing machines. In this study, a chromatic confocal sensor is attached on a designed fixture arm to acquire data from pad topography. Topography of total working area of the polishing pad is detected by rotation of polishing pad and arm motion. Because the mechanism is fixed on the swing arm, the entire area of polishing pad can be scanned and it can effectively reduce the measuring time. The DPMS then can provide a performance index of polishing pad to maximize the utilization of the polishing pad in a relatively shorter time.

2. Design and Configuration of DPMS

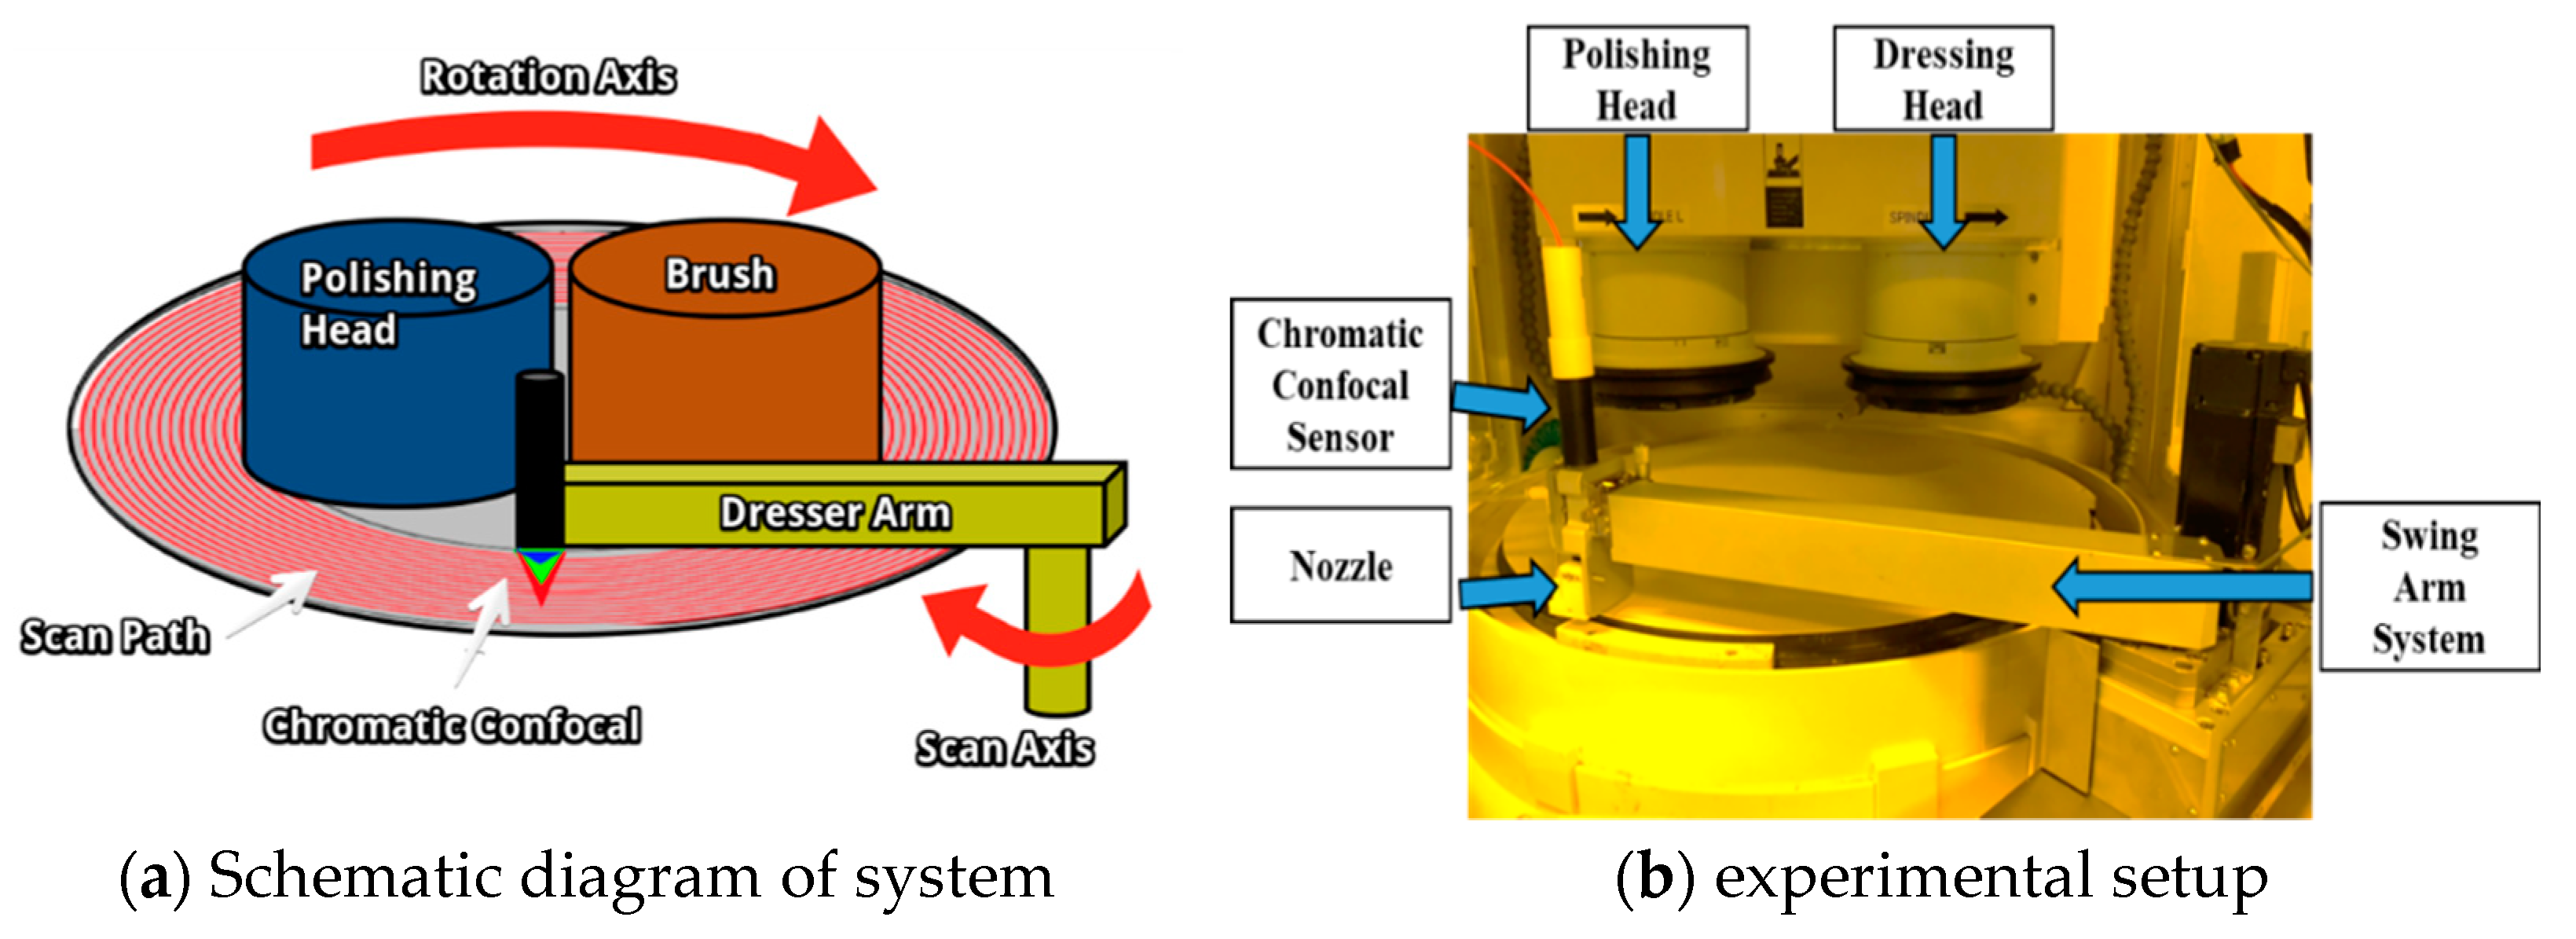
2.1. System Description

The DPMS is shown in Figure 1 with rotating the platen and the swing-arm motion on a CMP tool. The monitoring mechanism is based on a concentric circle as shown in Figure 1a. The surface topography is built by height information from a chromatic confocal sensor. This developed DPMS is divided into motion module and measuring module. The system is designed to ensure the movement does not have any interference with the space constraints of the polishing tool. Experimental set-up is shown in Figure 1b. A chromatic confocal measurement sensor with STIL MG140/CL3 sensor is used in the measuring module. The chromatic confocal measurement is mainly done through the multi-wavelength white dispersion lens and spectrometer design. Different wavelengths of light are focused to different height positions, and through the pinhole design, unfocused wavelengths are blocked out, by avoiding entering inside the spectrometer, while controlling the hole size to control the measurement accuracy.
With dynamic measurement by the swing-arm confocal system, the raw data contains surface non-uniformity, groove depth, surface height change or roughness [13]. The system disturbance from motor vibration or electrical noise needs to be considered for pre-processing of analysis. A filter based on FFT method is used and the filtered signals from specific frequencies are identified before the experiments [14,15,16]. Then, metrology data can be obtained from the signal measured from the system by reducing the disturbance of external environment.

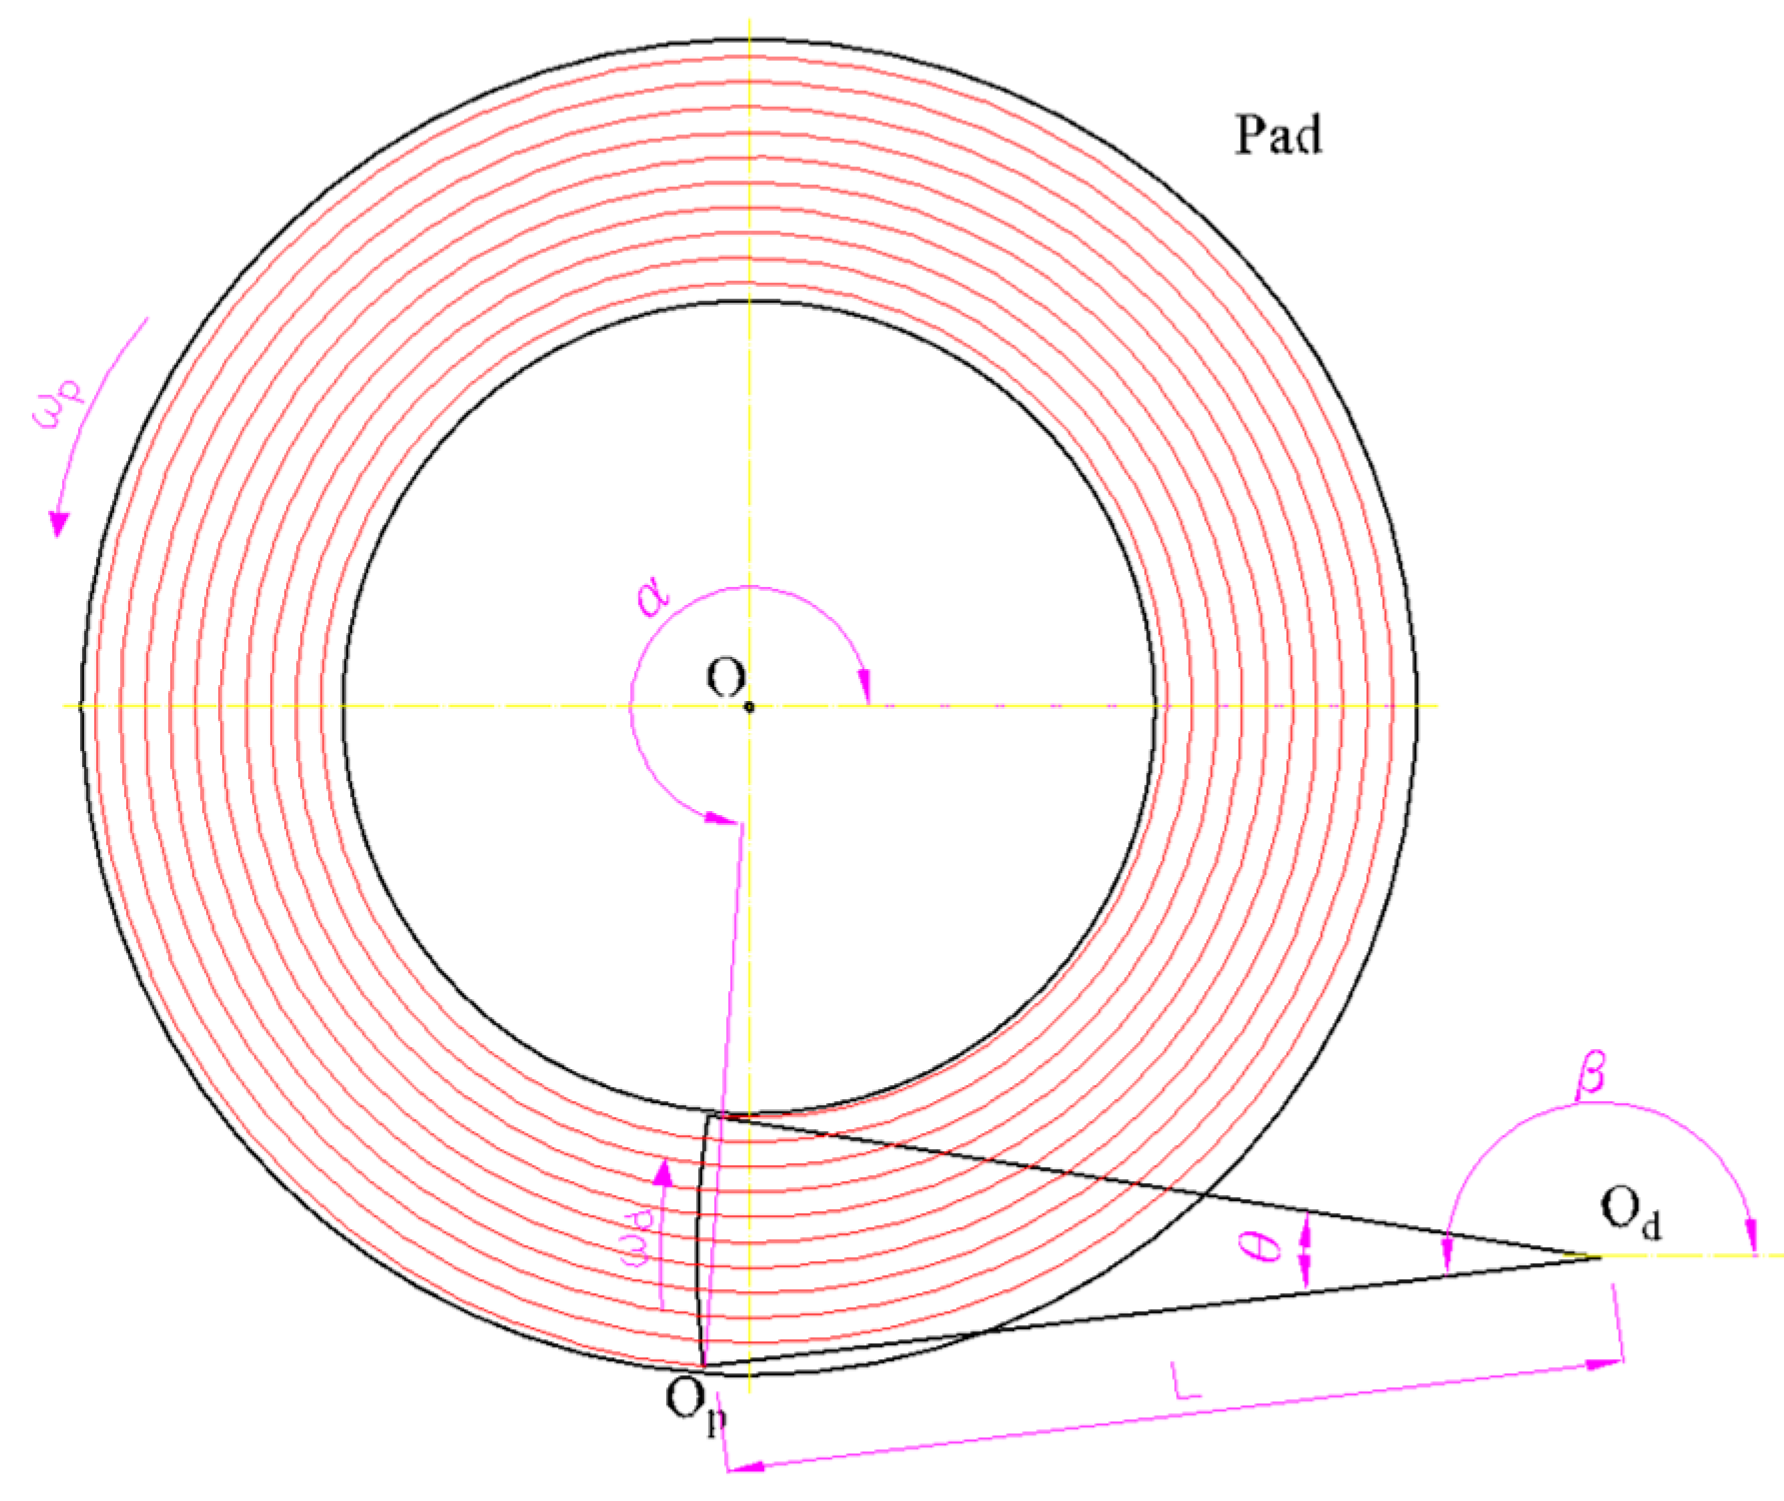
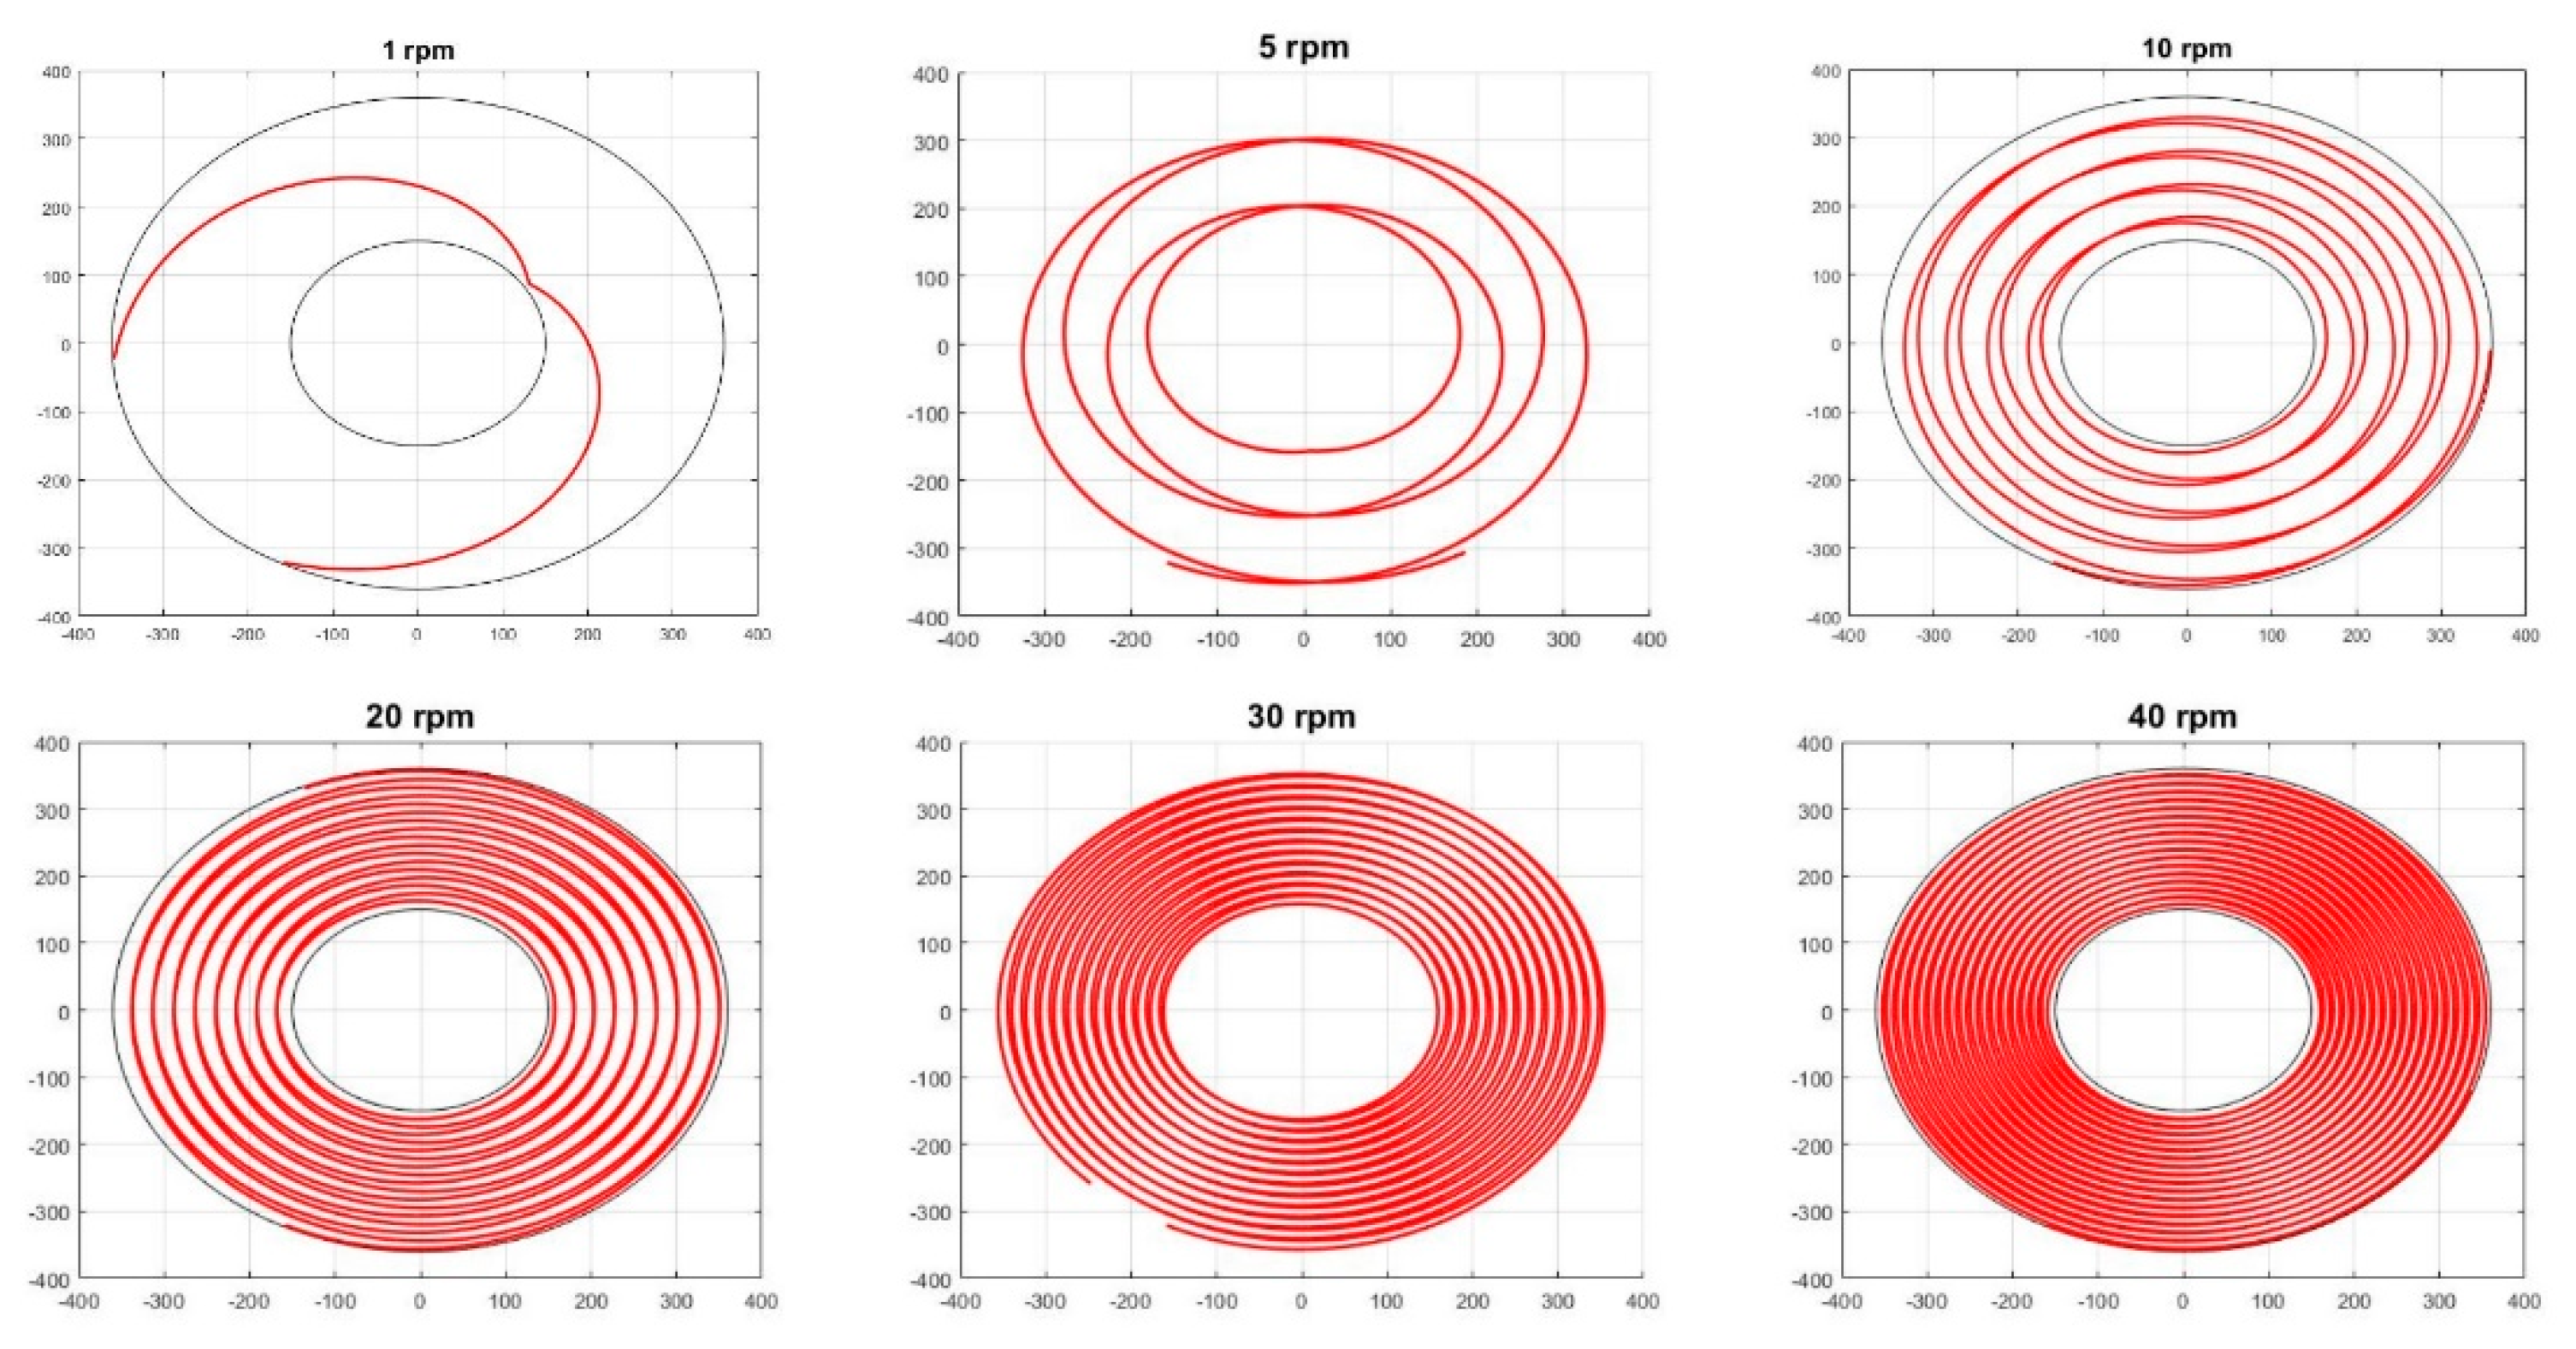
2.2. Mathematical Model of Scanning Locus

The main purpose of the system is to obtain the total surface information of polishing pads. Because the system is set up on the polishing machine with a rotating platen, the sensor’s scanning locus is combined with platen rotating and swing motion of the dressing arm [17]. The scanning locus of height sensor needs to be calculated with the actual position of the sensor, as the thickness of the pad changes with the radius during the CMP process. After combining the sensor’s location and measurement data, the distribution of height and groove depth of pad are shown in the results. The motion locus is expressed as a spiral line; the diagram is shown in Figure 2.
The equation of locus can be expressed as:
    [ X ( t ) Y ( t ) ] = D [ c o s c o s   ( α ω × t )   s i n s i n   ( α ω × t )   ]
D = ( d x + L ( β ω d × t ) )   2 + ( d y + L ( β ω d × t ) )   2
where D means the distance between pad center and sensor location, d x   a n d   d y are the distance between pad center and arm’s rotating center, L is the length of swing arm, α   a n d   β mean the initial angle of pad and swing arm, ω a n d   ω d mean the rotating speed of pad and swing arm.

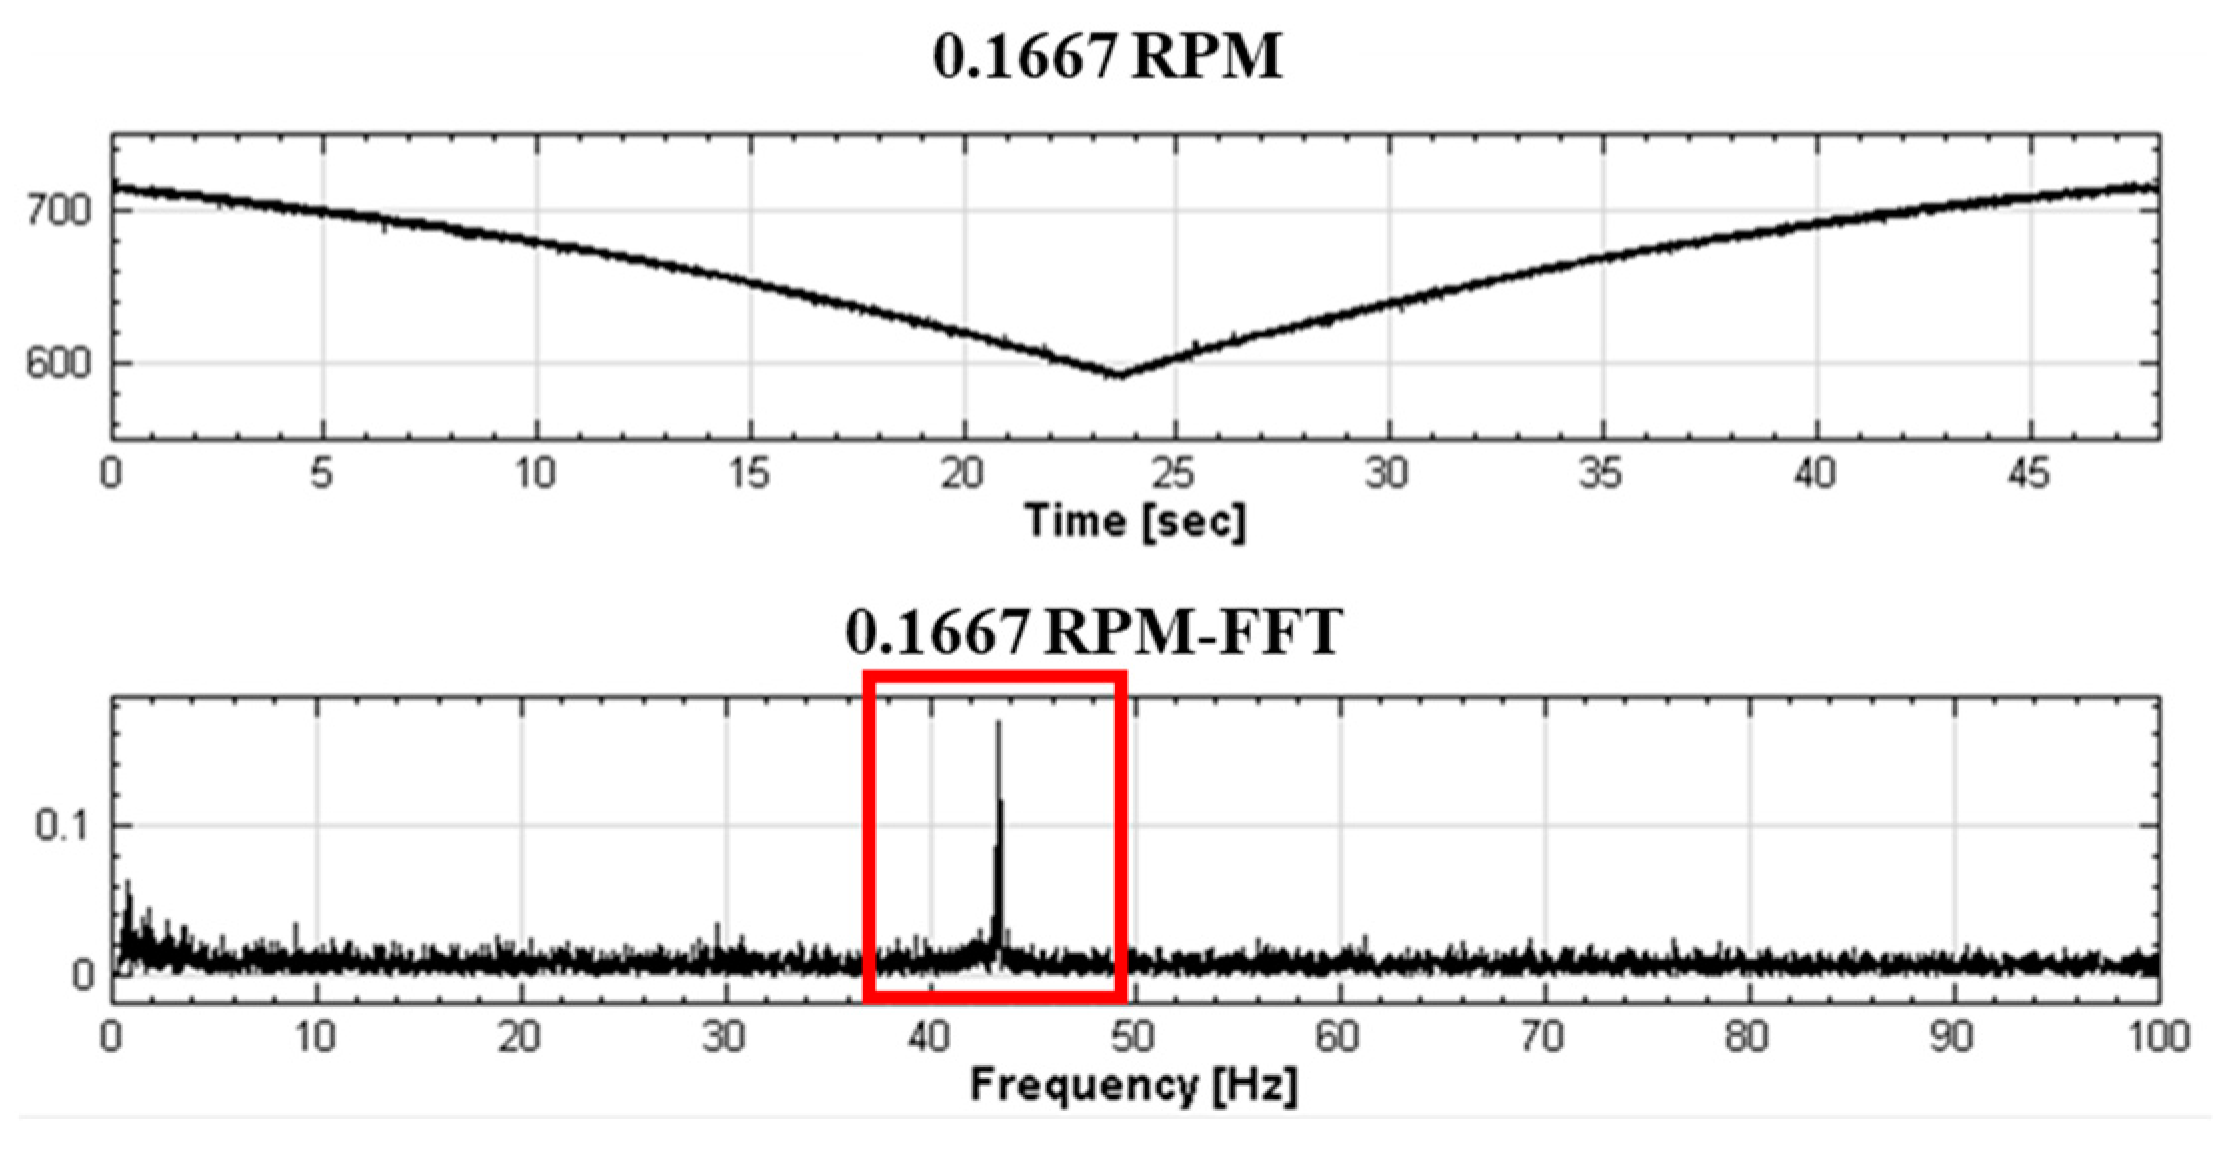
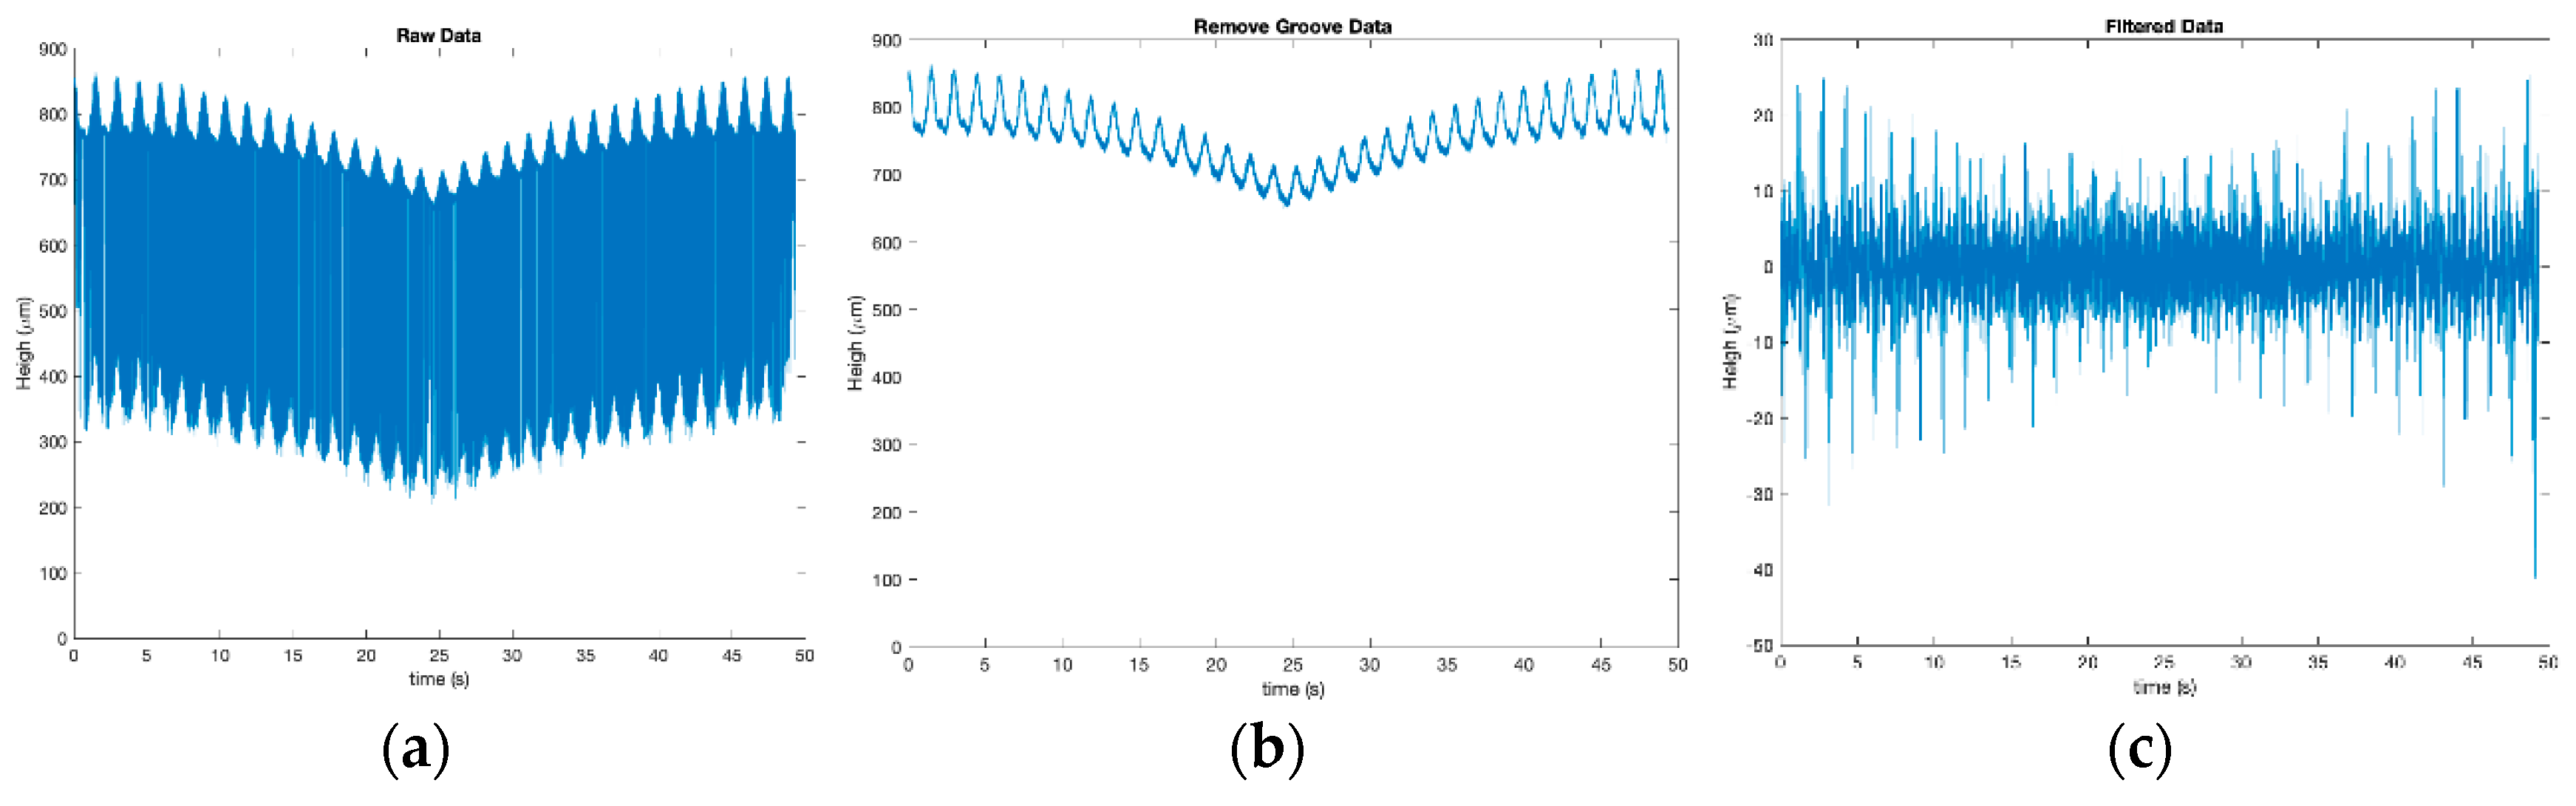
2.3. Signal Processing and Filter Design

The measured data from the confocal sensor can be analyzed in three parts including vibration signal, rotation signal, and height data. Since the disturbance signal will couple with the real surface height data, the real surface features are separated by the signal processing. The rotation signal and system vibration can be separated by FFT method in this system. The rotating speed is defined in the beginning of the experiments. The vibration from the structure can be filtered by determining the mechanical frequency of the swing arm. The working frequency can be analyzed by rotating the arm independently on a ceramic platen. The frequency data are shown in Figure 3. The IIR filter is used to eliminate the influences of vibration and disturbances. Then the measured signal is analyzed and presented as Figure 4a. The comparison of processed and original signals is shown in Figure 4b,c. The original height data are combined with arm tilting, pad waviness, and pad. As the signal is analyzed by the designed algorithm, the measurement signal can be extracted and calculated.

3. Experimental Method and Parameters

In CMP experiments, a HAMAI HS-720C polishing machine is attached with the confocal system to achieve in situ monitoring. An IC1000 polyurethane pad with x-y type groove is implemented in the experiments and its characteristics are shown in Table 1. A Kinik 3EA-3 diamond dresser is adopted in this experiments as shown in Figure 5, which has grit size around 100 ± 15   μ m and 40–60   μ m   height .   Related experimental parameters of pad conditioning and CMP are listed in Table 2, Table 3 and Table 4. Some 3 ×   40 mm 2   Cu   blanket substrates are used in the CMP experiments with 50 rounds. The pad surface is measured between each polishing process. The MRR and roughness of Cu substrates are measured to compare with the change of the pad performance index. With the swing-arm monitoring system, the measurement of pad surface has been accomplished without taking pad off-line or pausing the CMP process. Each measurement data has been completed within 50 s during the conditioning process for arm swinging from outer edge to inner position with sampling rate as 1 kHz. Changes of pad thickness and groove depth can be measured before and after each round of CMP process. Then the correlations of wafer quality and pad performance index can be analyzed and discussed.

4. Results and Discussion

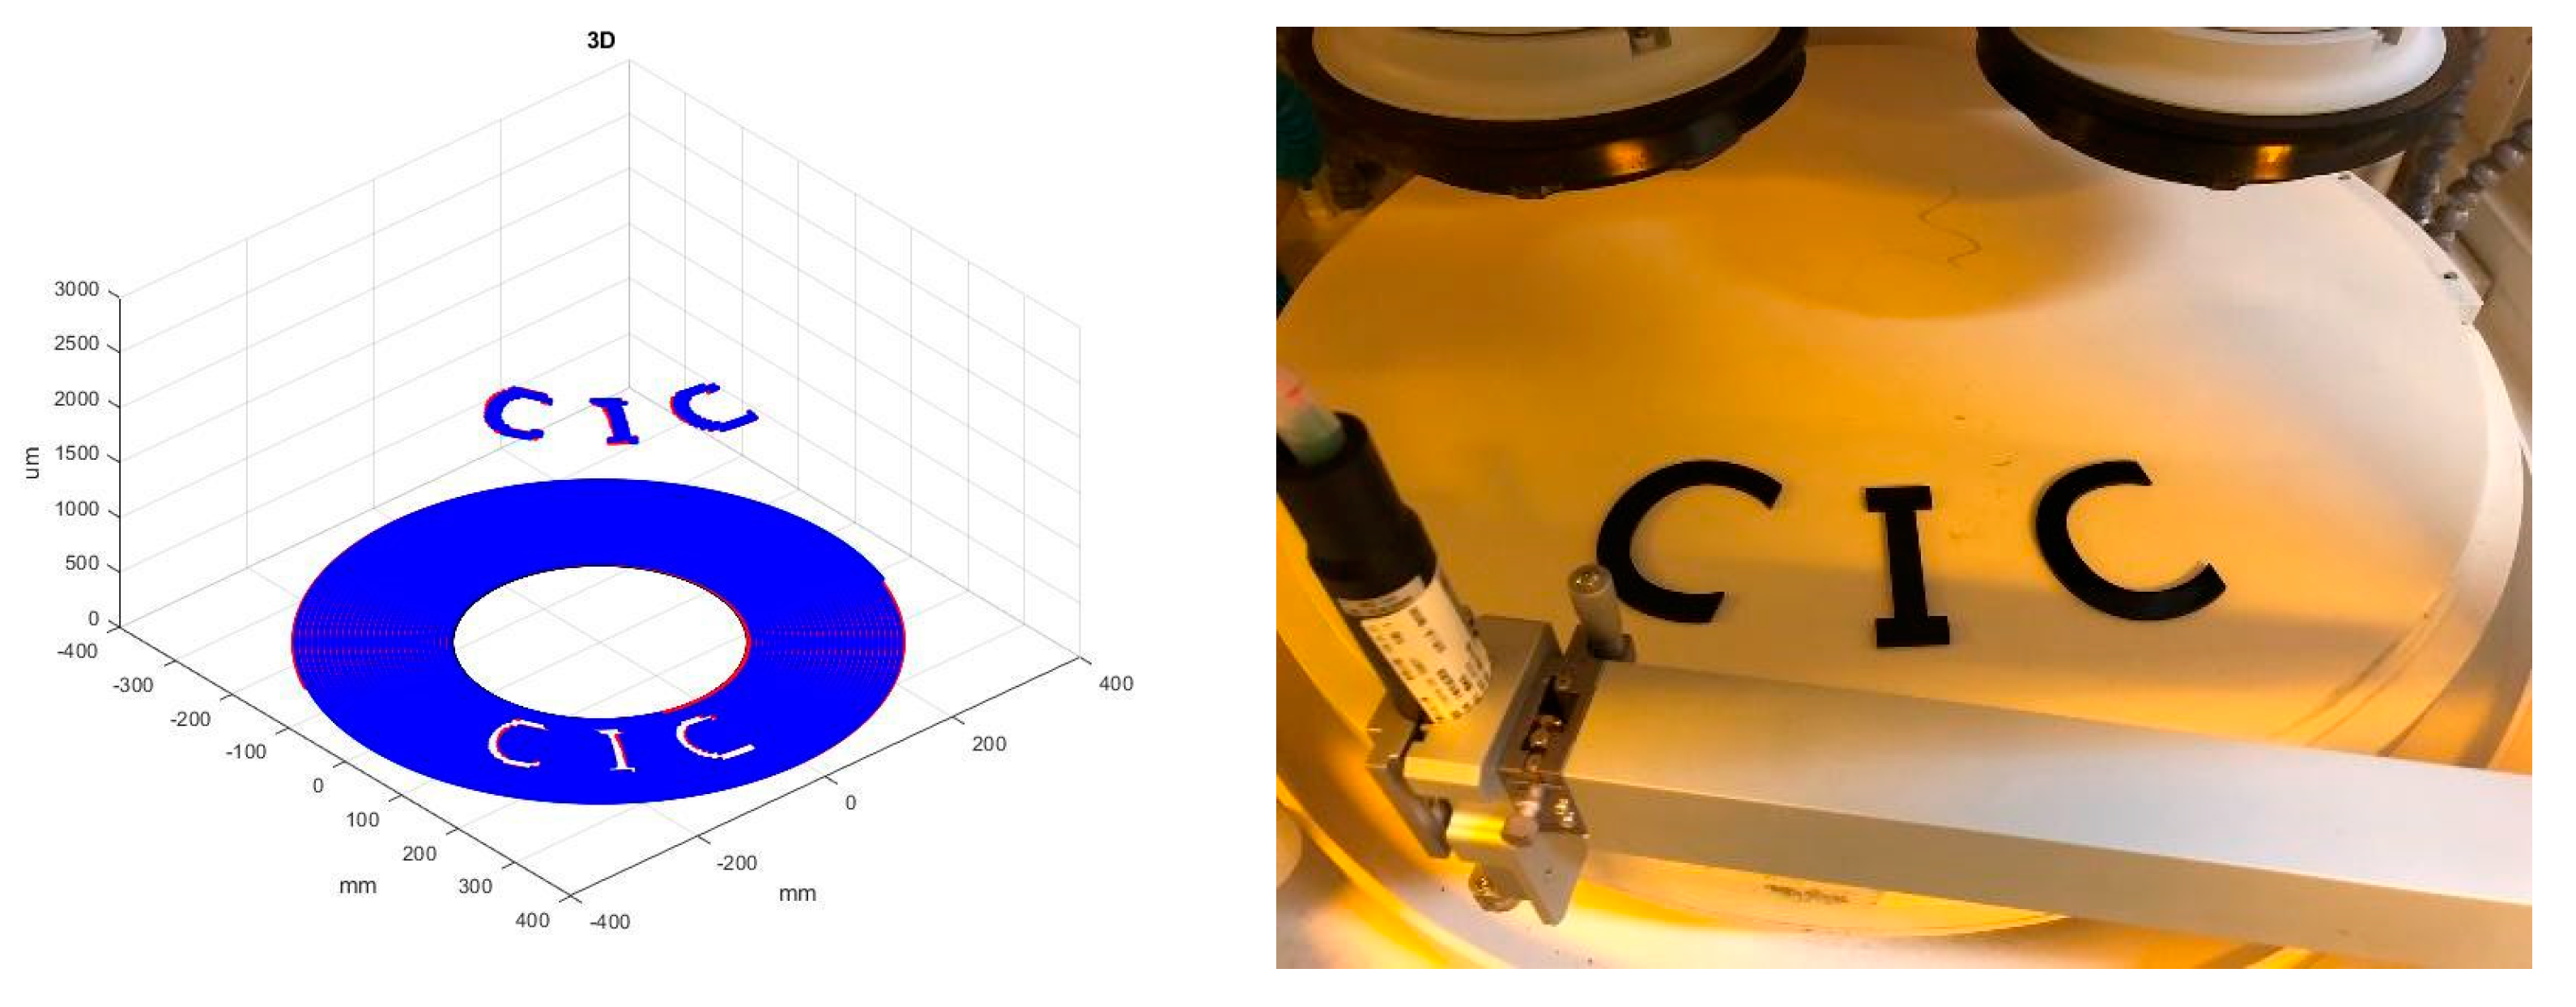
4.1. Measuring Points Allocating and Processing

Figure 6 shows the spiral locus obtained by a confocal sensor in different rotating speeds of pad platen. Figure 7 shows the results to allocate the height data to pad surface by placing target symbols on the ceramic platen of polishing machine. By calibrating the location of measuring data with angle feedback signals from motor driver, the outlook shape of the target symbols can be displayed clearly. With the calibration data, the surface profile can be mapped into the corresponding location.

4.2. Metrological Parameters

Two major indexes are investigated in this study, which are PU (pad non-uniformity) and PELI (pad effective life time index). PU shows the pad profile and the wear condition during the conditioning process. PELI shows the remaining lifetime of pad by evaluating the change of groove depth. The definition of PU is as Equation (3), where T m a x   a n d   T m i n mean the maximum and minimum value of measuring height data. T p a d means the original pad thickness without conditioning. The PU represents the difference of pad profile, whose value varies with the initial setup or within the dressing process. The PELI defines the available lifetime of pad by the remaining pad groove depth. The definition of PELI shows as Equation (4) and H g and H g *   mean the groove depth before and after conditioning process.
                P U = T m a x T m i n 2 × T p a d × 100 %
P E L I = H g * H g × 100 %
To examine the system metrological parameters, 50 measurements were tested for specific rotation speeds. The detailed experimental parameters are listed as Table 5. The results are shown in Figure 8. For the total swing time for each measurement is 50 s, so the length of scanning locus on pad will increase with the faster rotation speed. The result of PU is larger than others when rotation speed is 1 rpm. Lower rotation speed will reduce the scanning area, so the PU value will become unstable. The PELI value is stable because the groove depth is more evenly distributed on the pad surface. The standard deviation of PU in each rotation speed except 1 rpm is less than 1.2%. the overall SD of experiments is 0.48%. SD of groove depth in each rotation speed is under 3 μ m , and the overall SD of rotation speed from 1 rpm to 100 rpm is 5.58 μ m .

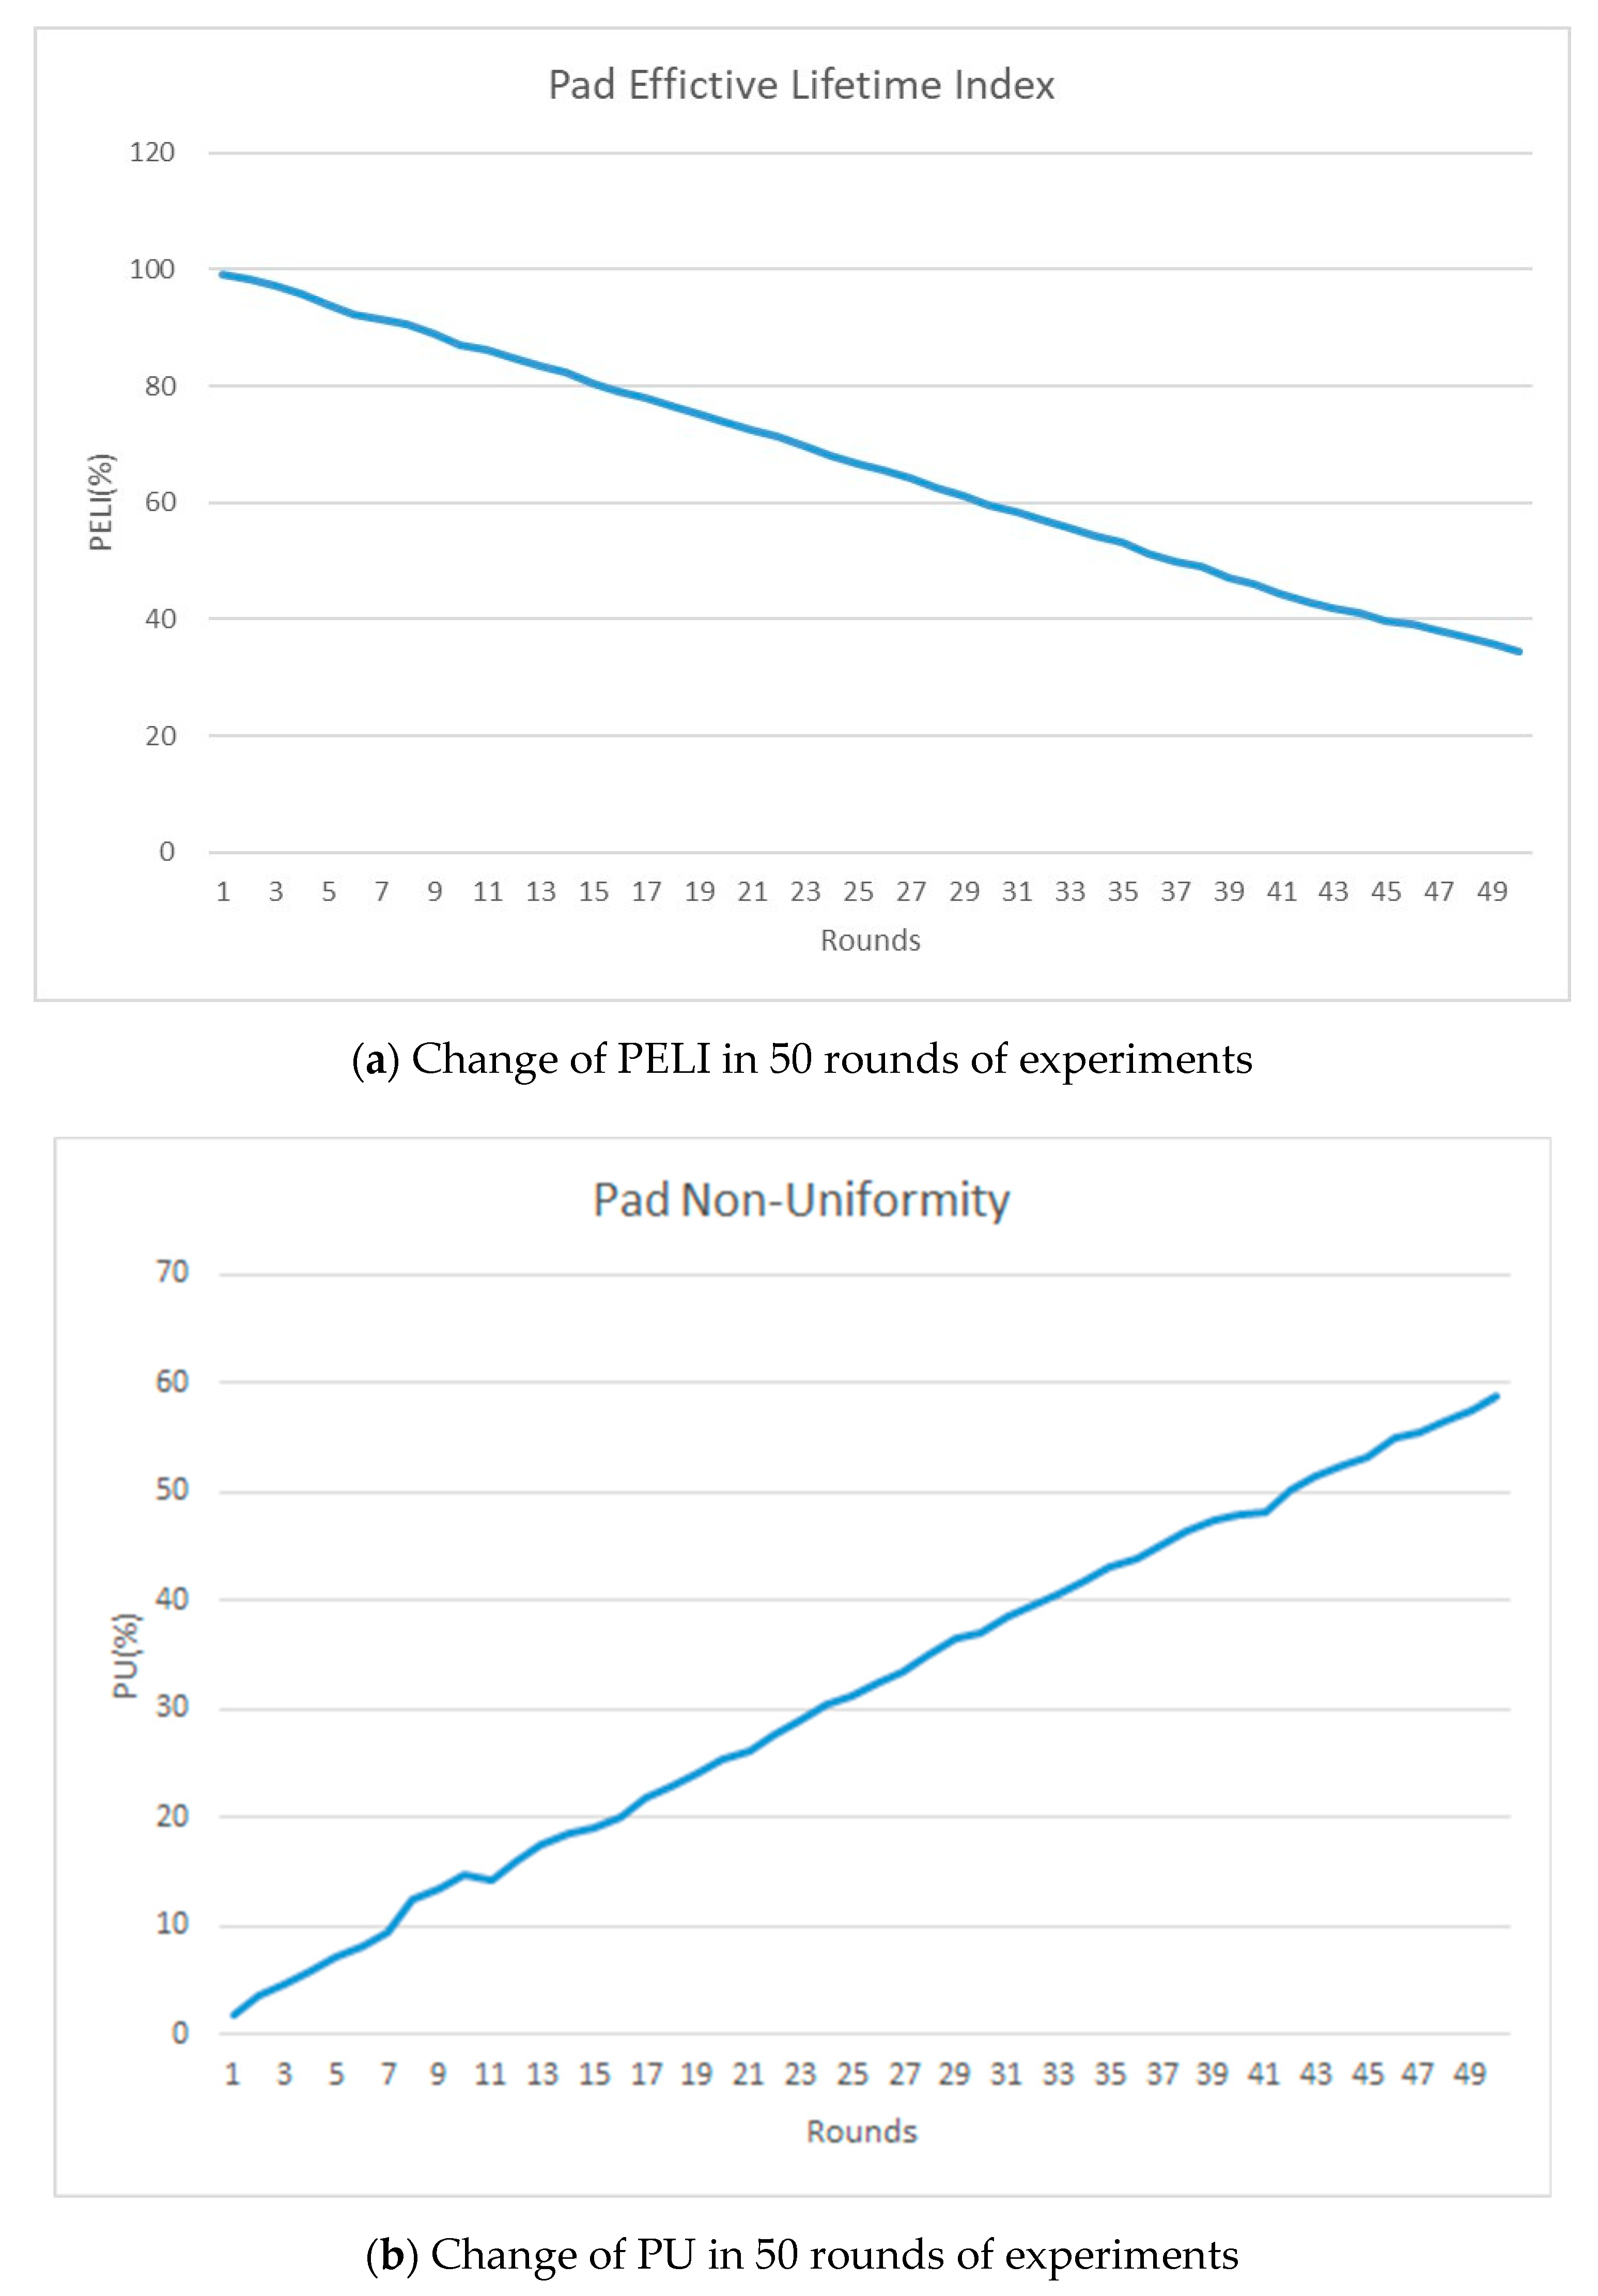
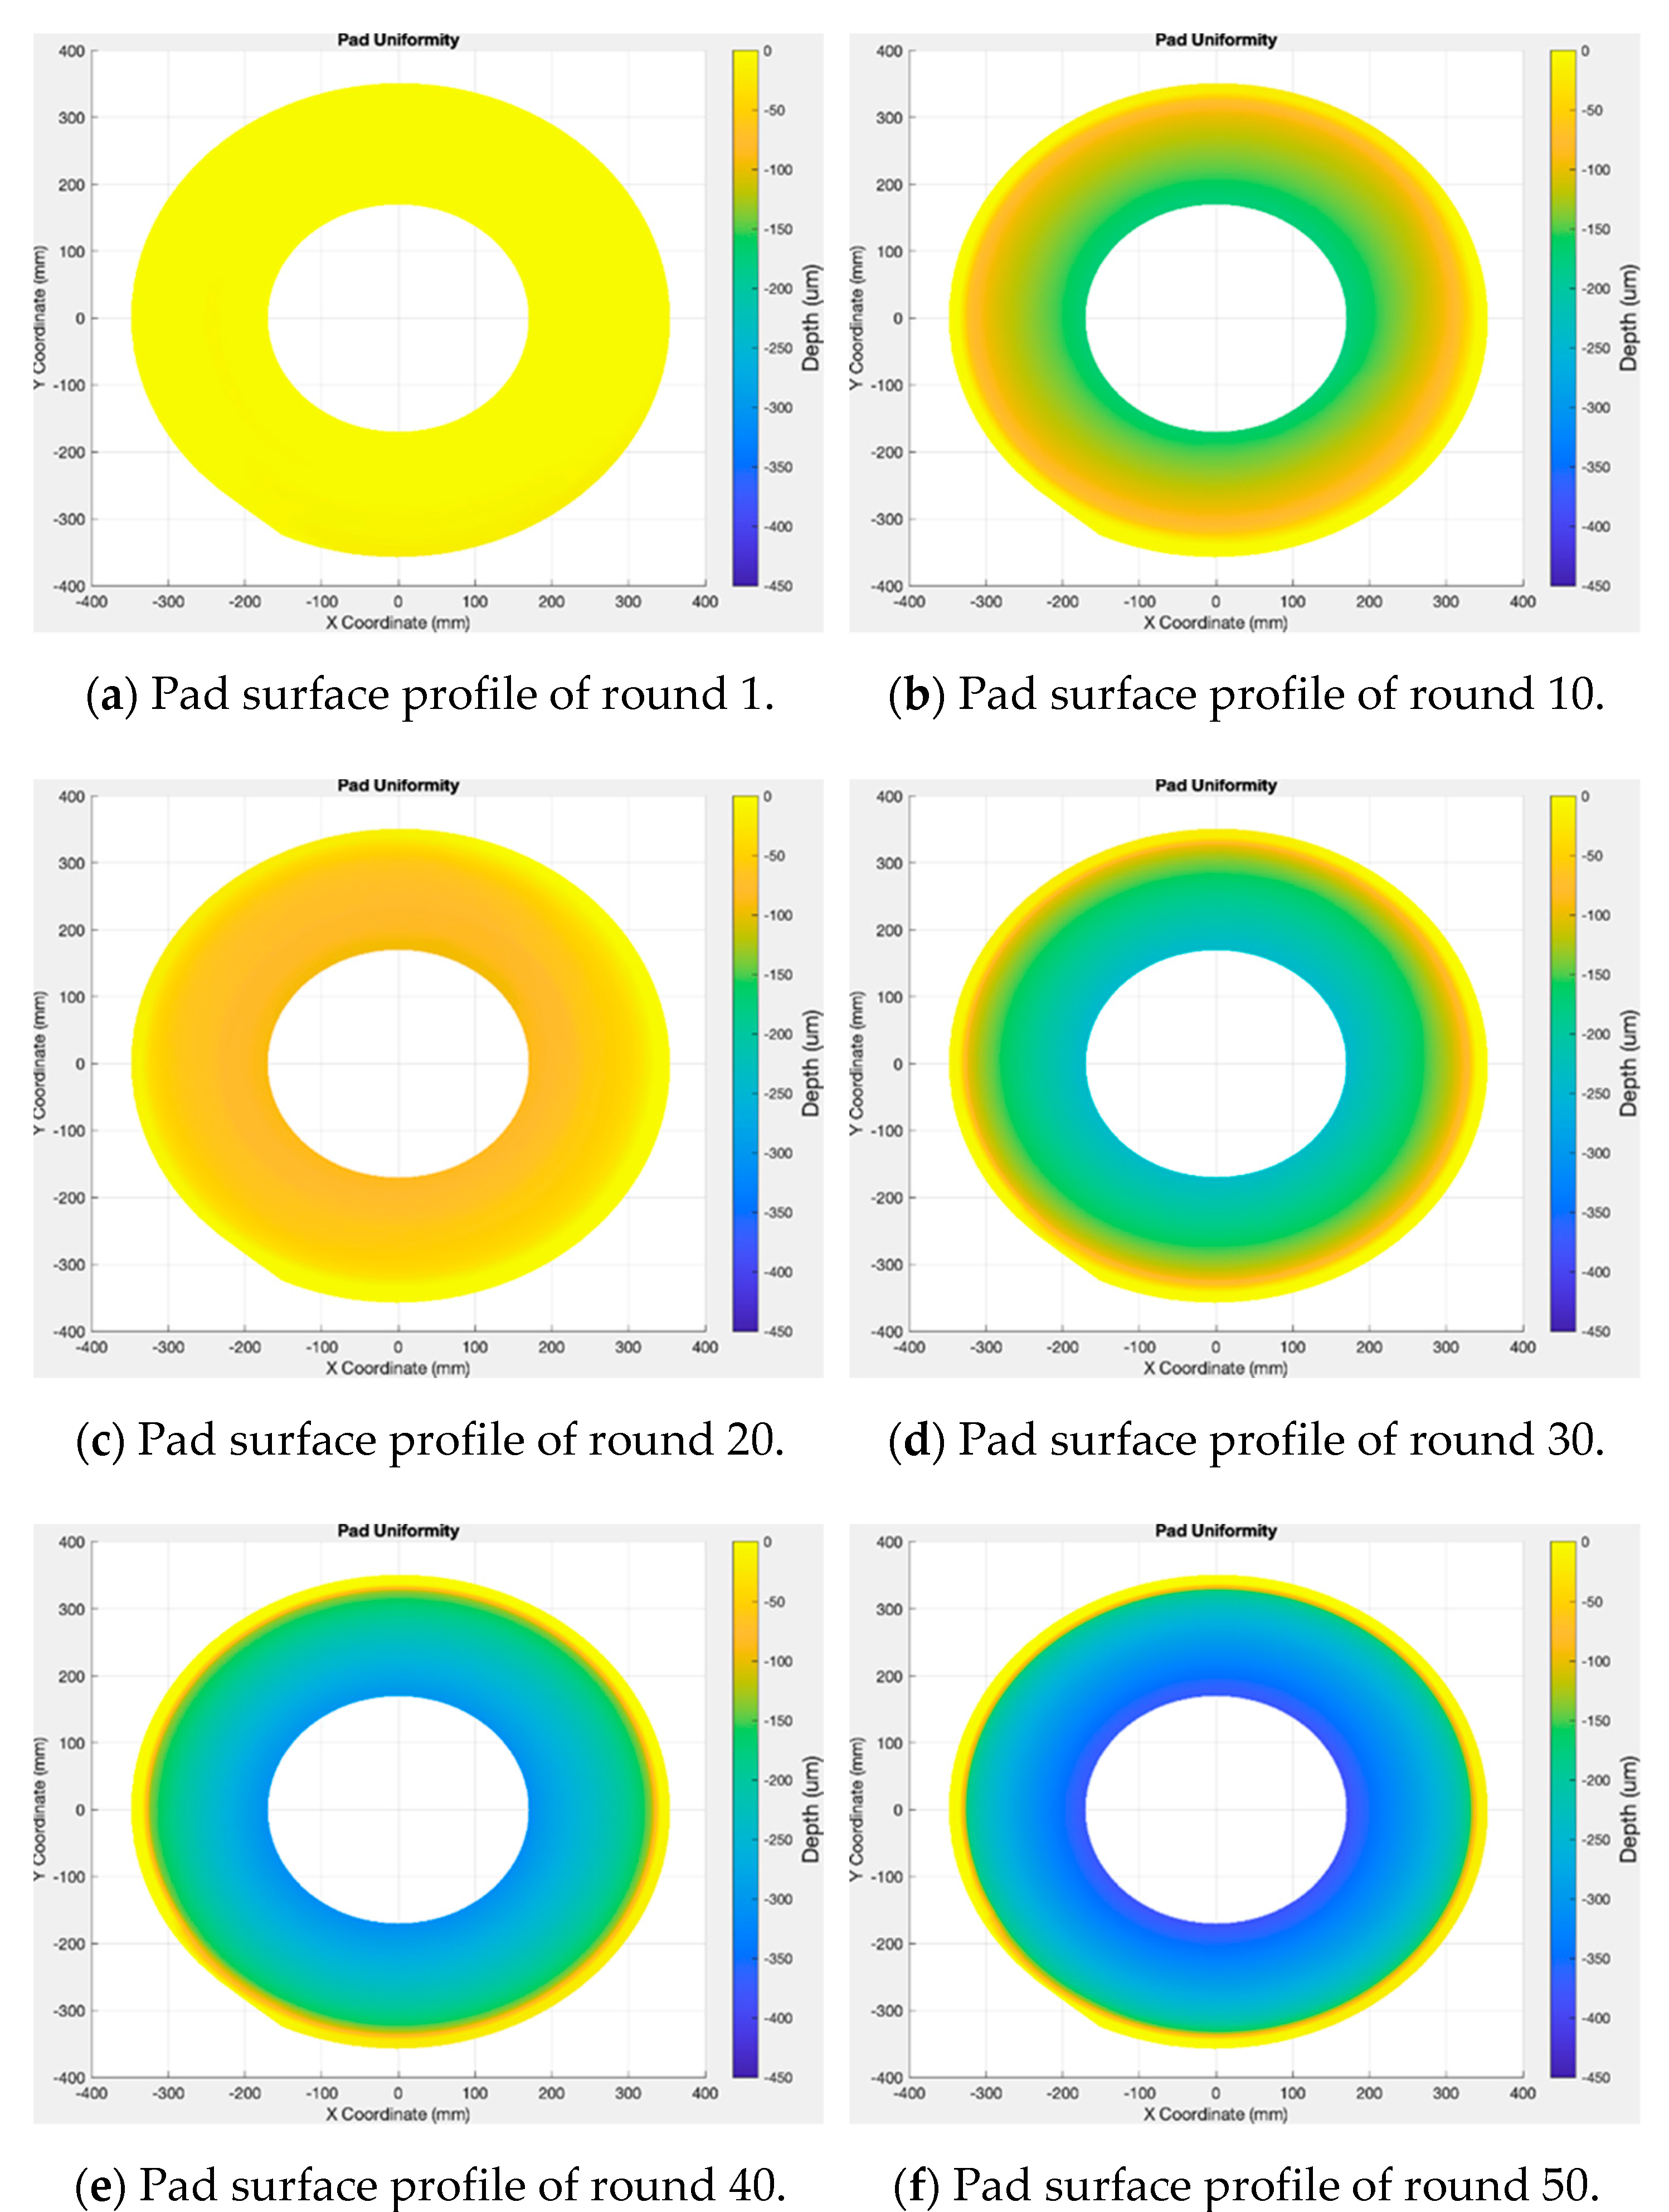
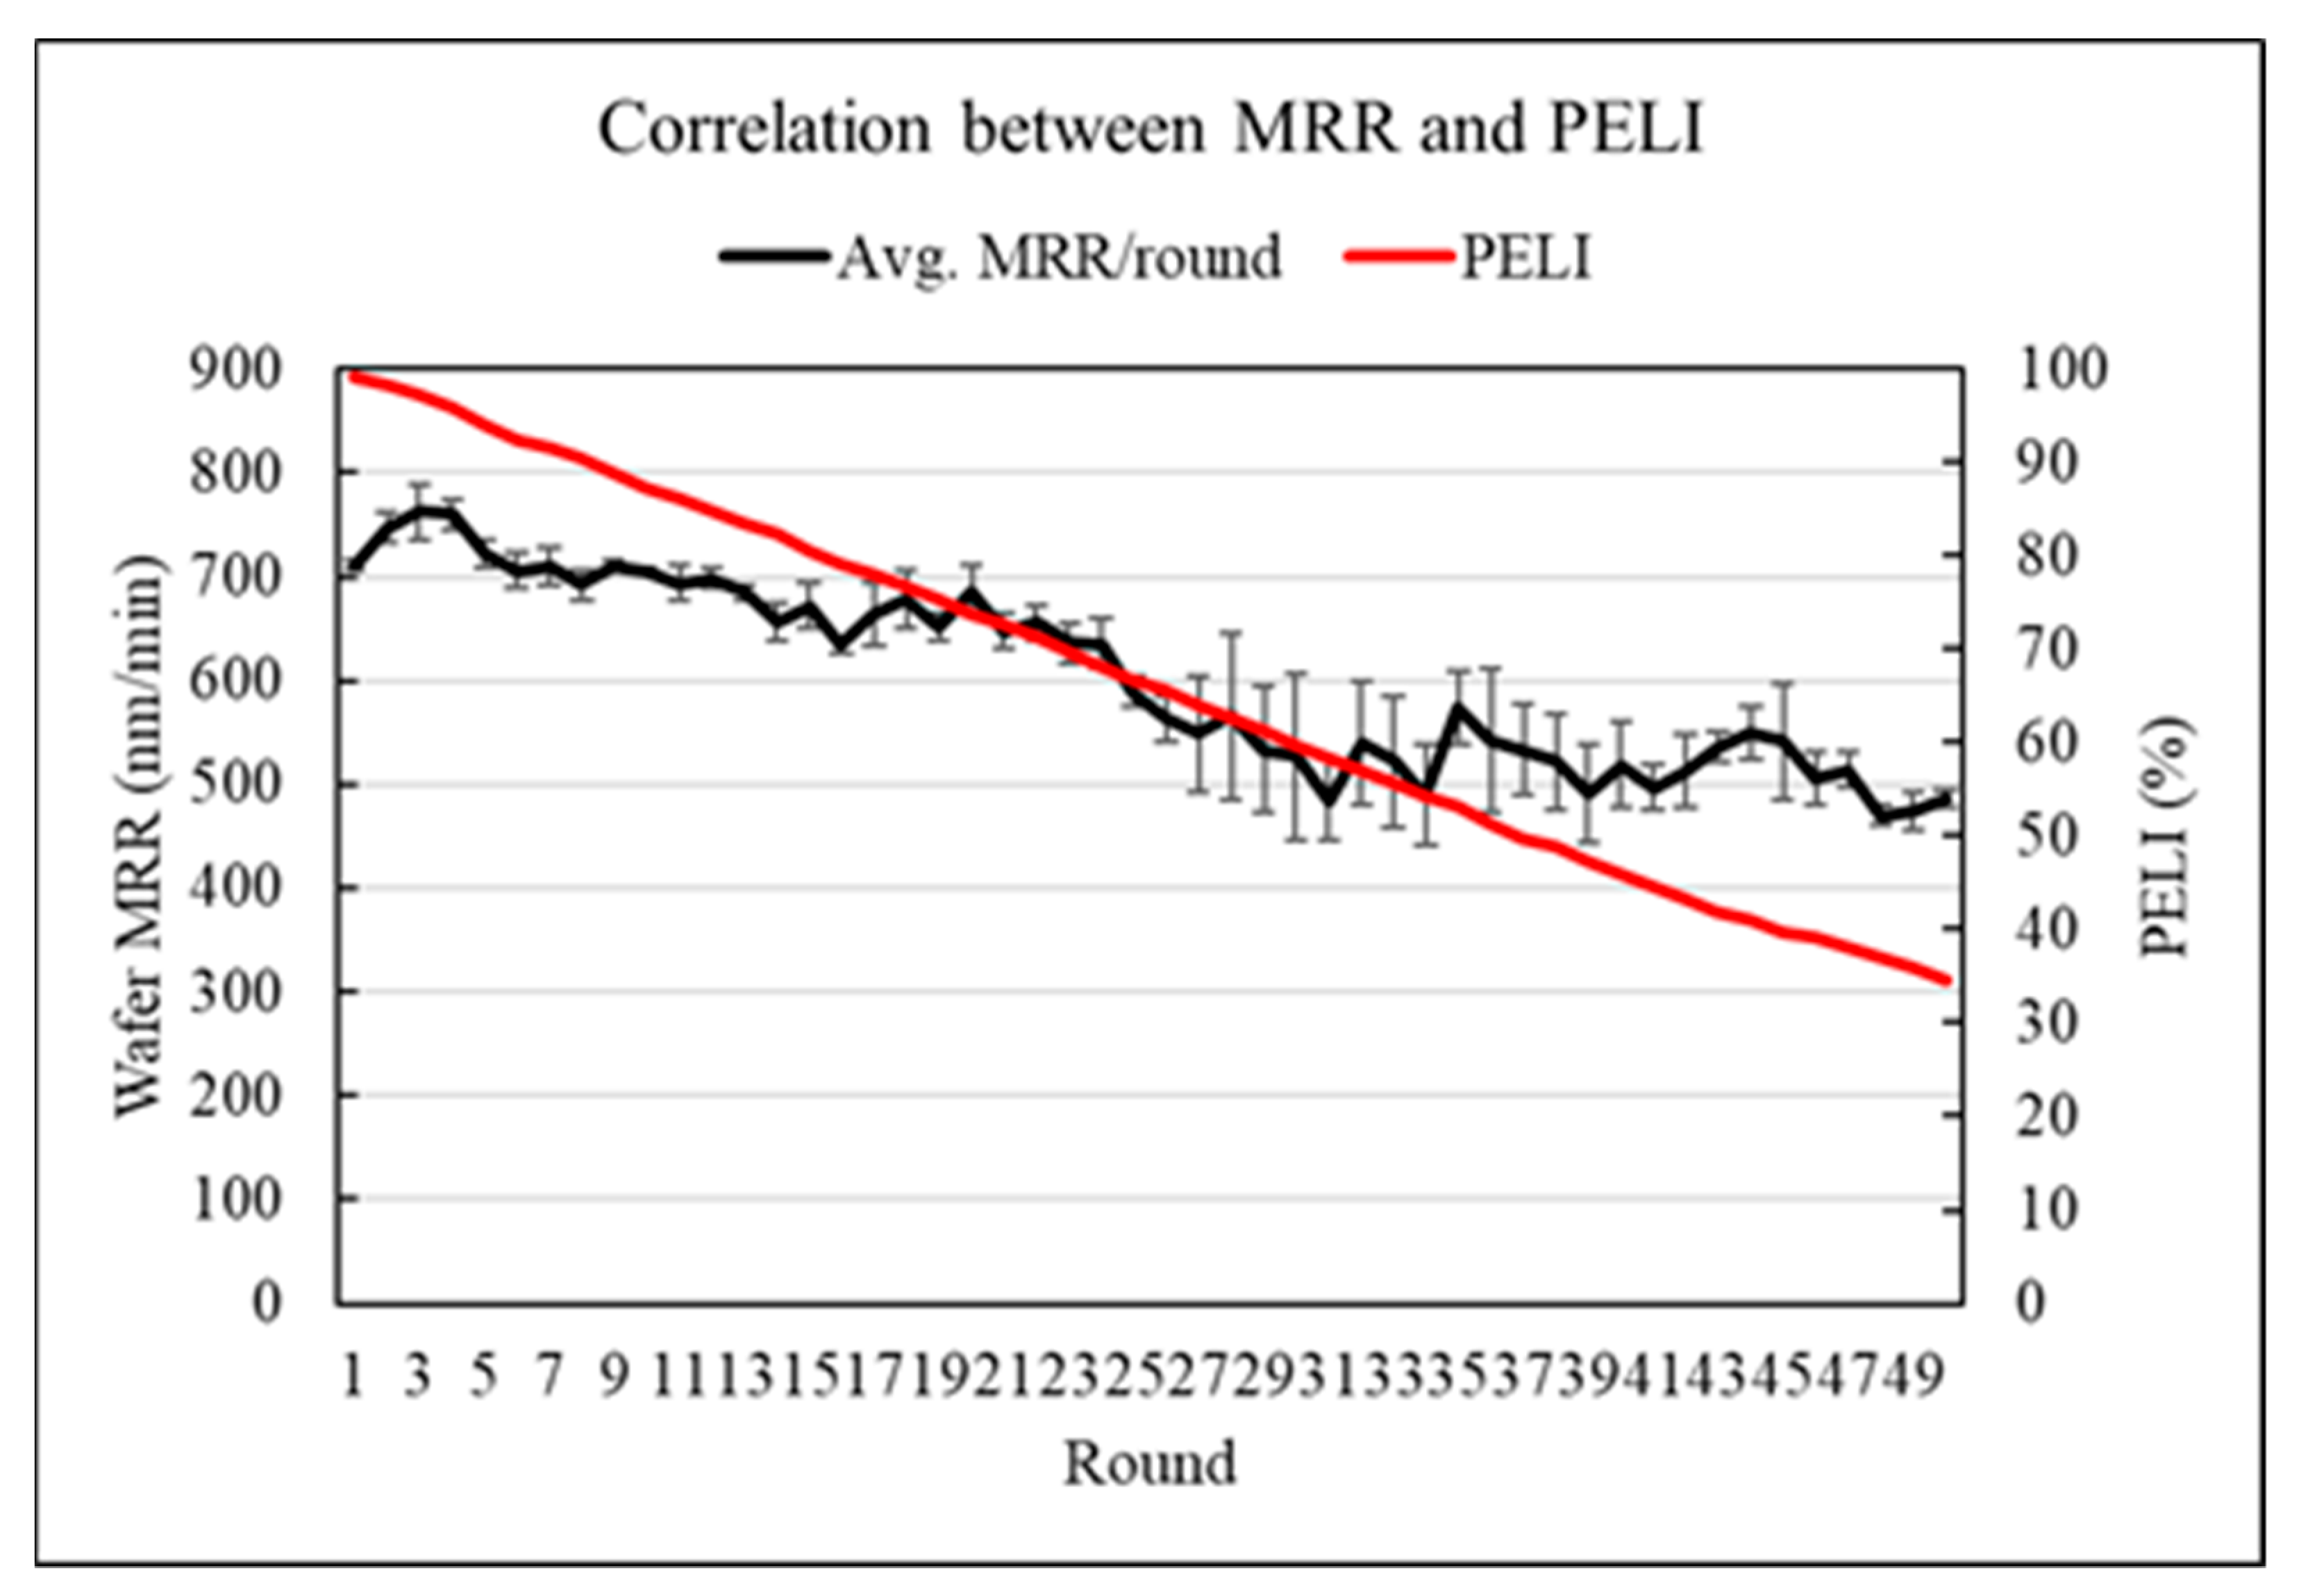
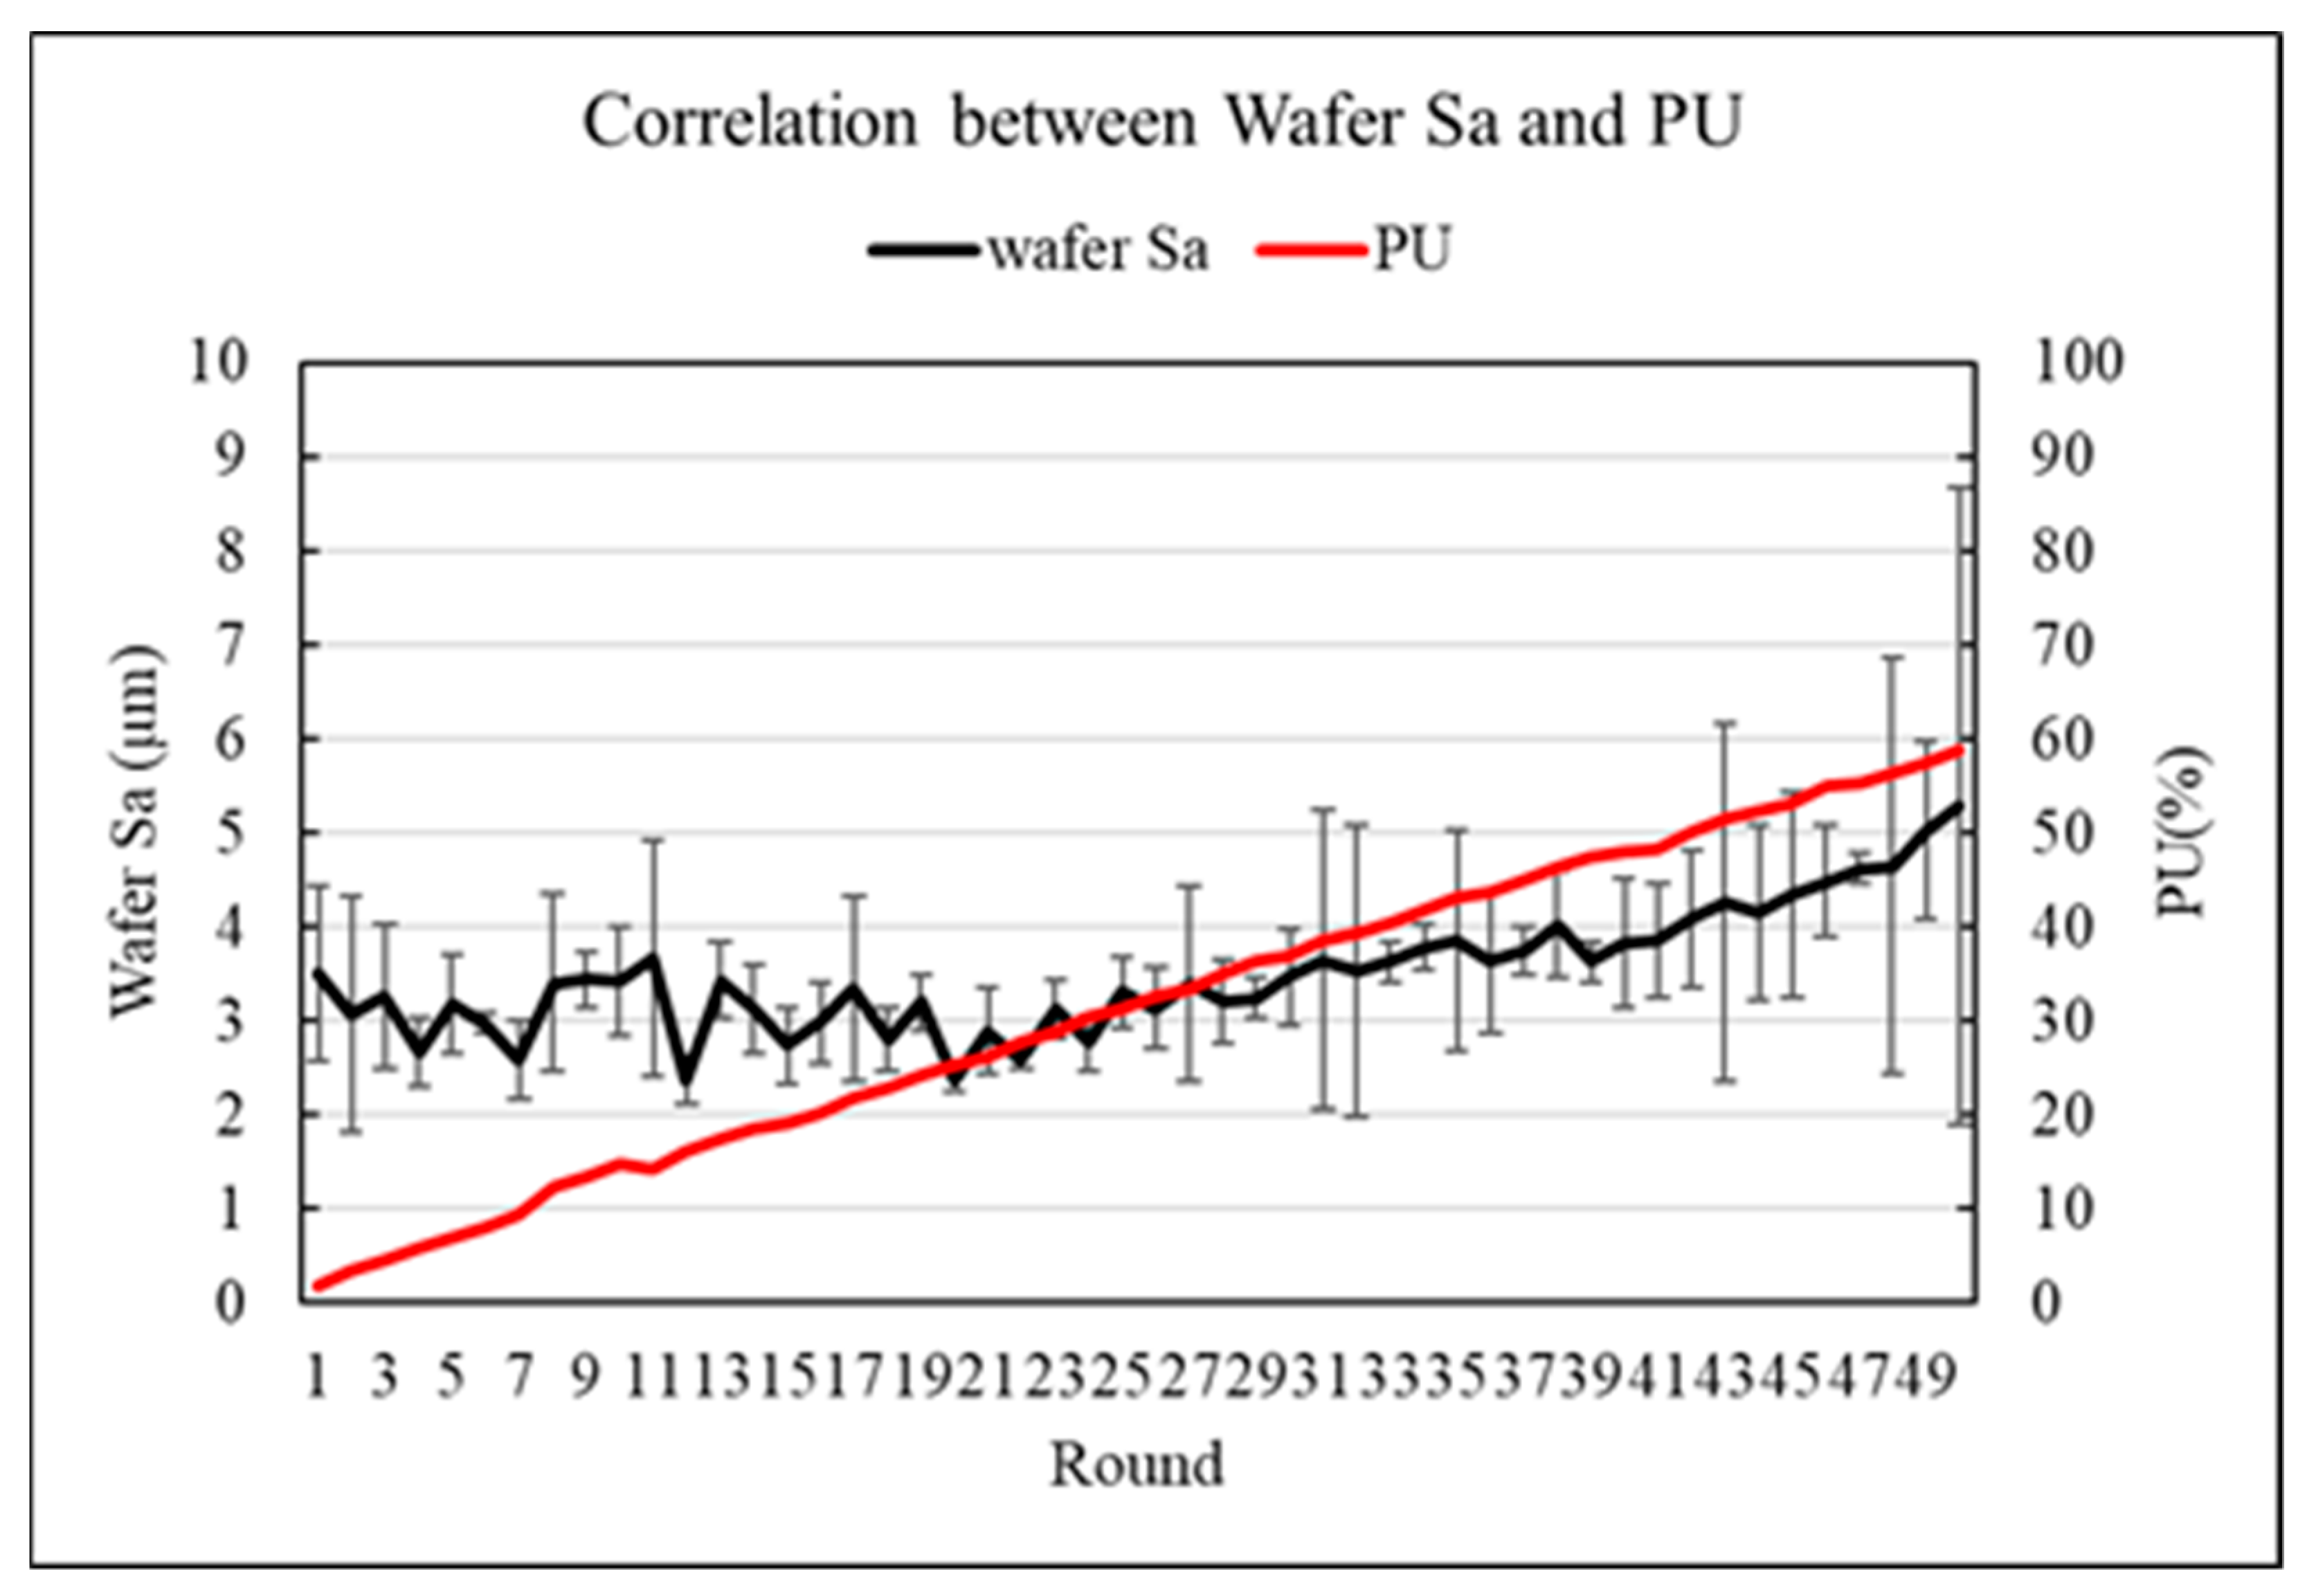
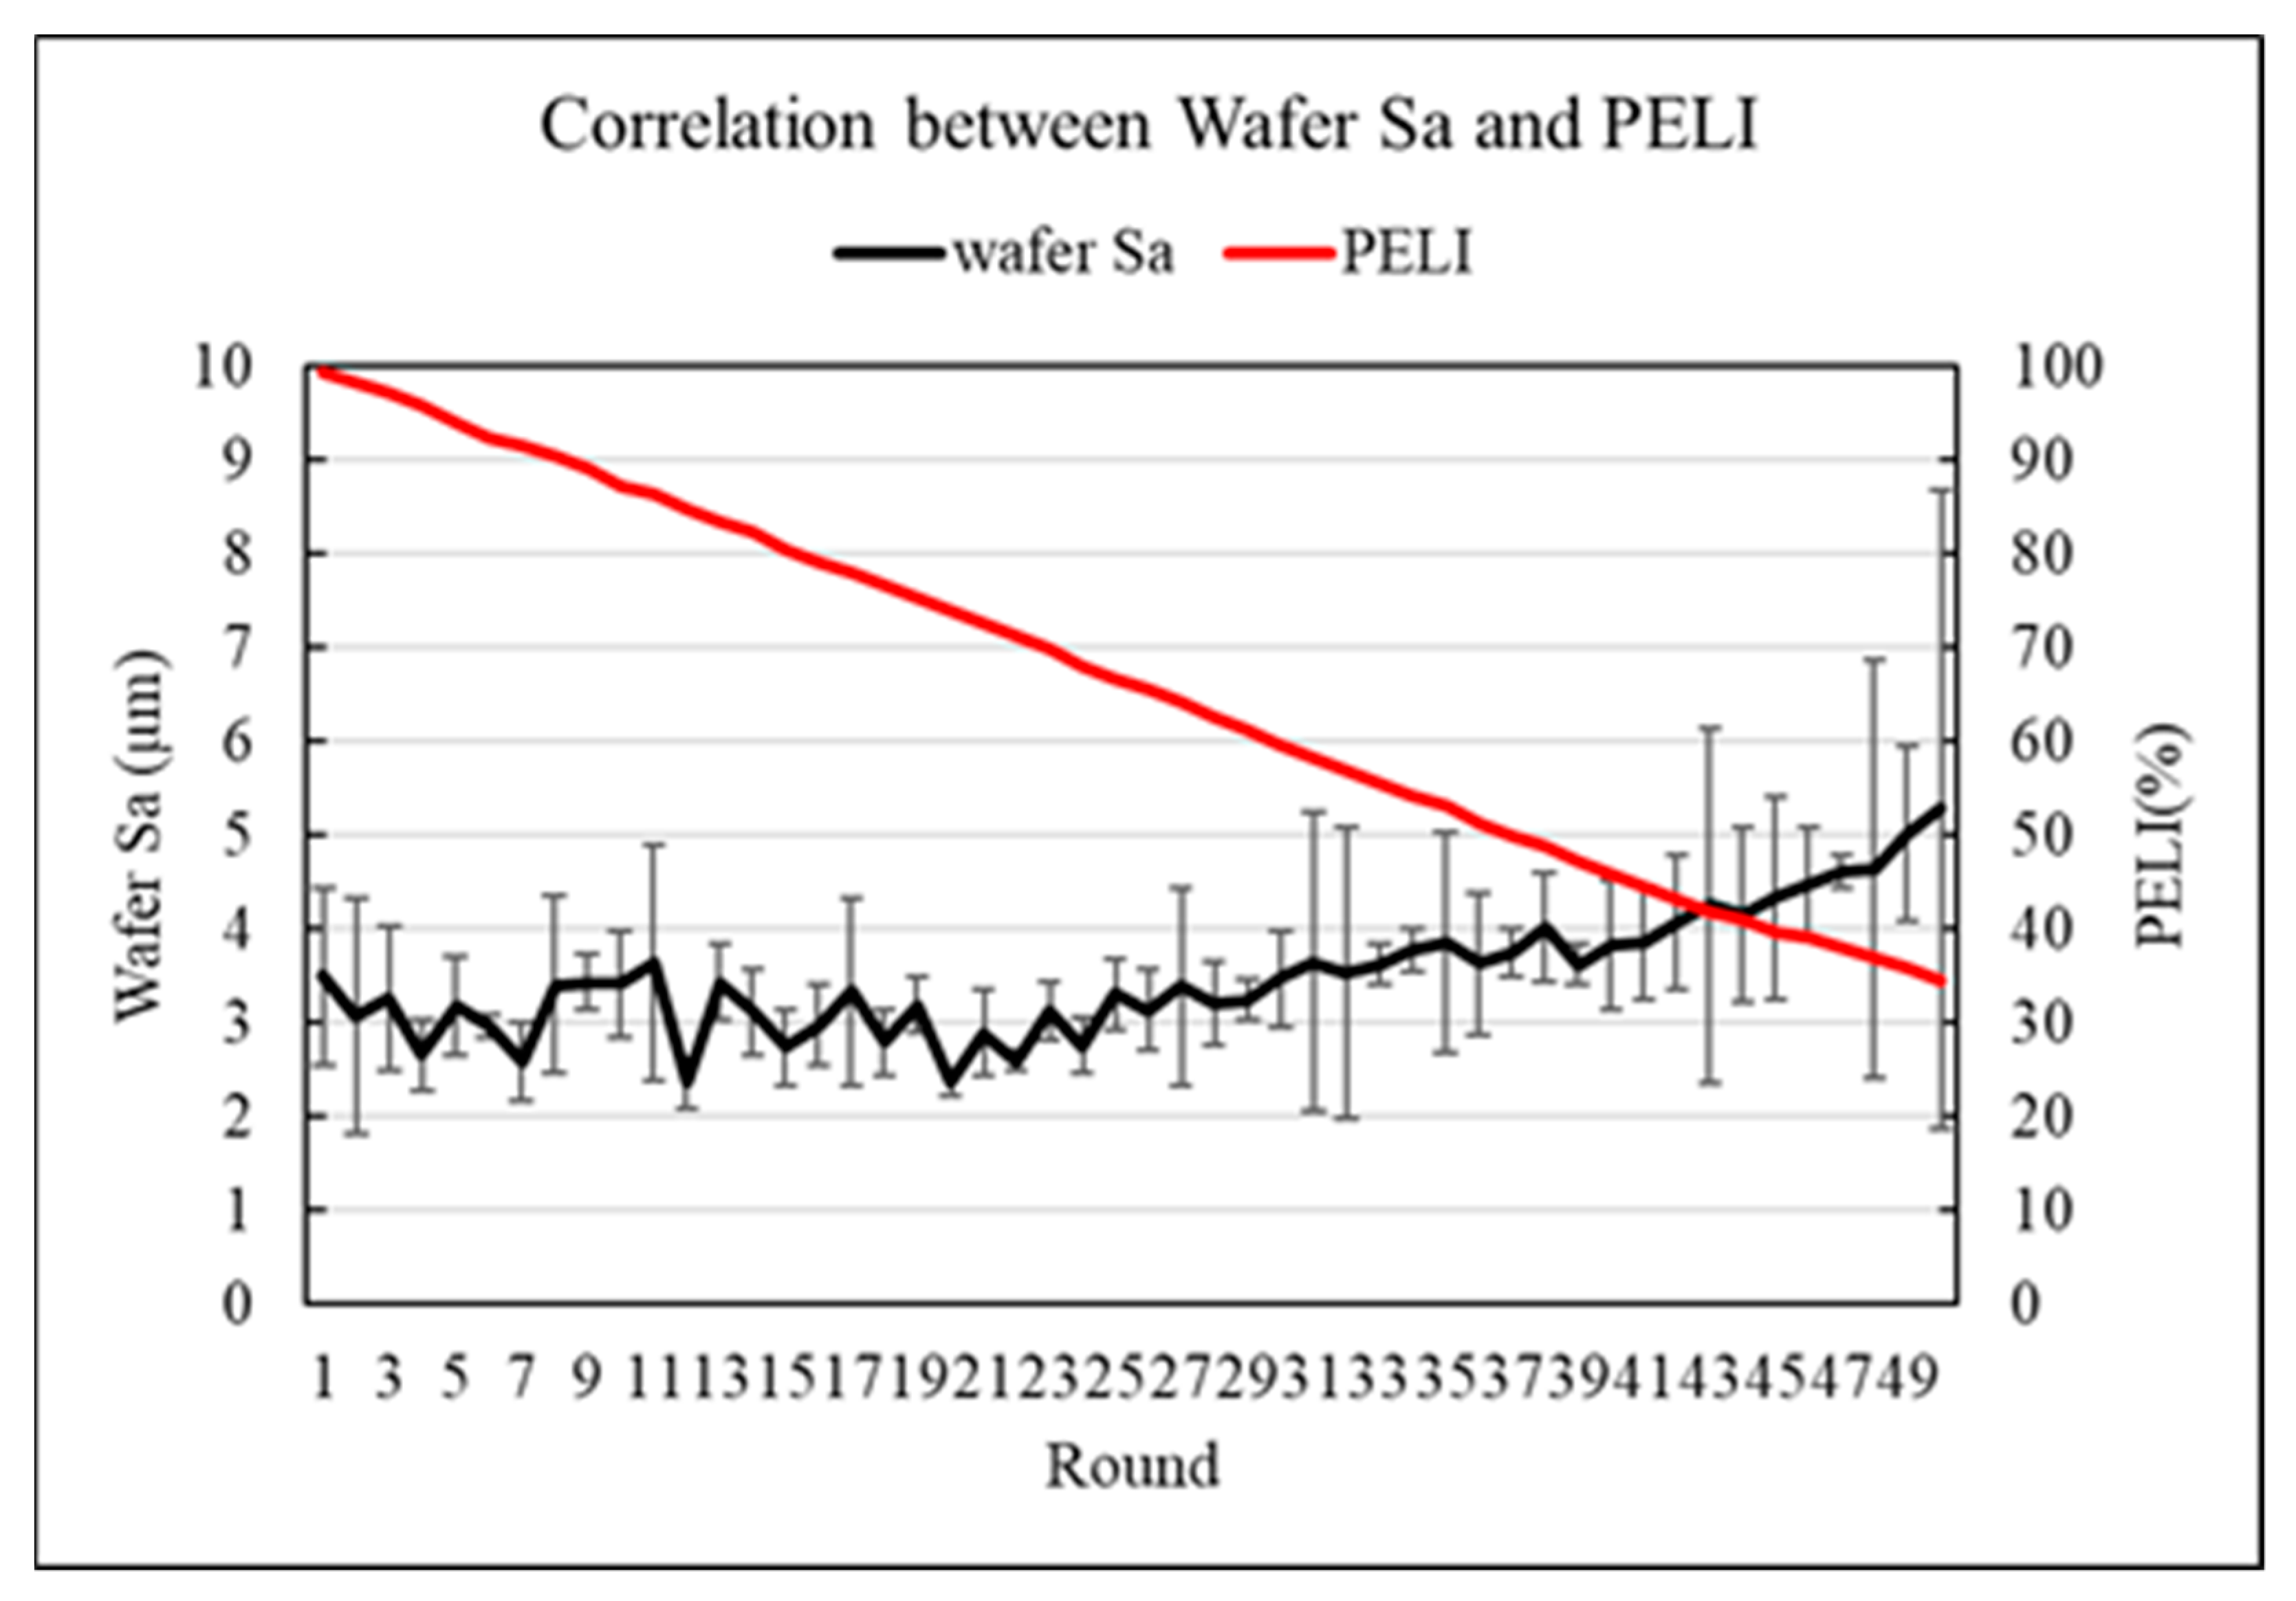
4.3. PU and PELI in CMP Experiments

Figure 9 shows the change of PELI (pad effective lifetime index) and PU (pad non-uniformity) value in CMP experiments. The PELI decreases to 30.5% after 50 rounds of CMP experiments and PU increases to 61.9% in the same time. Figure 10 shows the re-mapped pad surface profile from the measuring data. After 50 rounds of CMP process with conditioning between each polishing, a dish-type pf pad profile is measured. The dish-type shape is formed because of the difference of relative speed with pad radius. The pad cutting rate (PCR) is higher at inner area due to the higher relative speed. The scanning electron microscope(SEM) photos of cross-section of pad after 50 rounds of tests are shown as Figure 11 to verify the change of the groove depth during CMP process. Figure 11a shows the locations to take the SEM pictures. The pad’s area is separated into 6 ring sections from outer ring to inner ring. Figure 11b is the cross-section on groove of new IC1000 pad. Figure 11c–h shows the wear of pad’s groove from outer area to pad center.

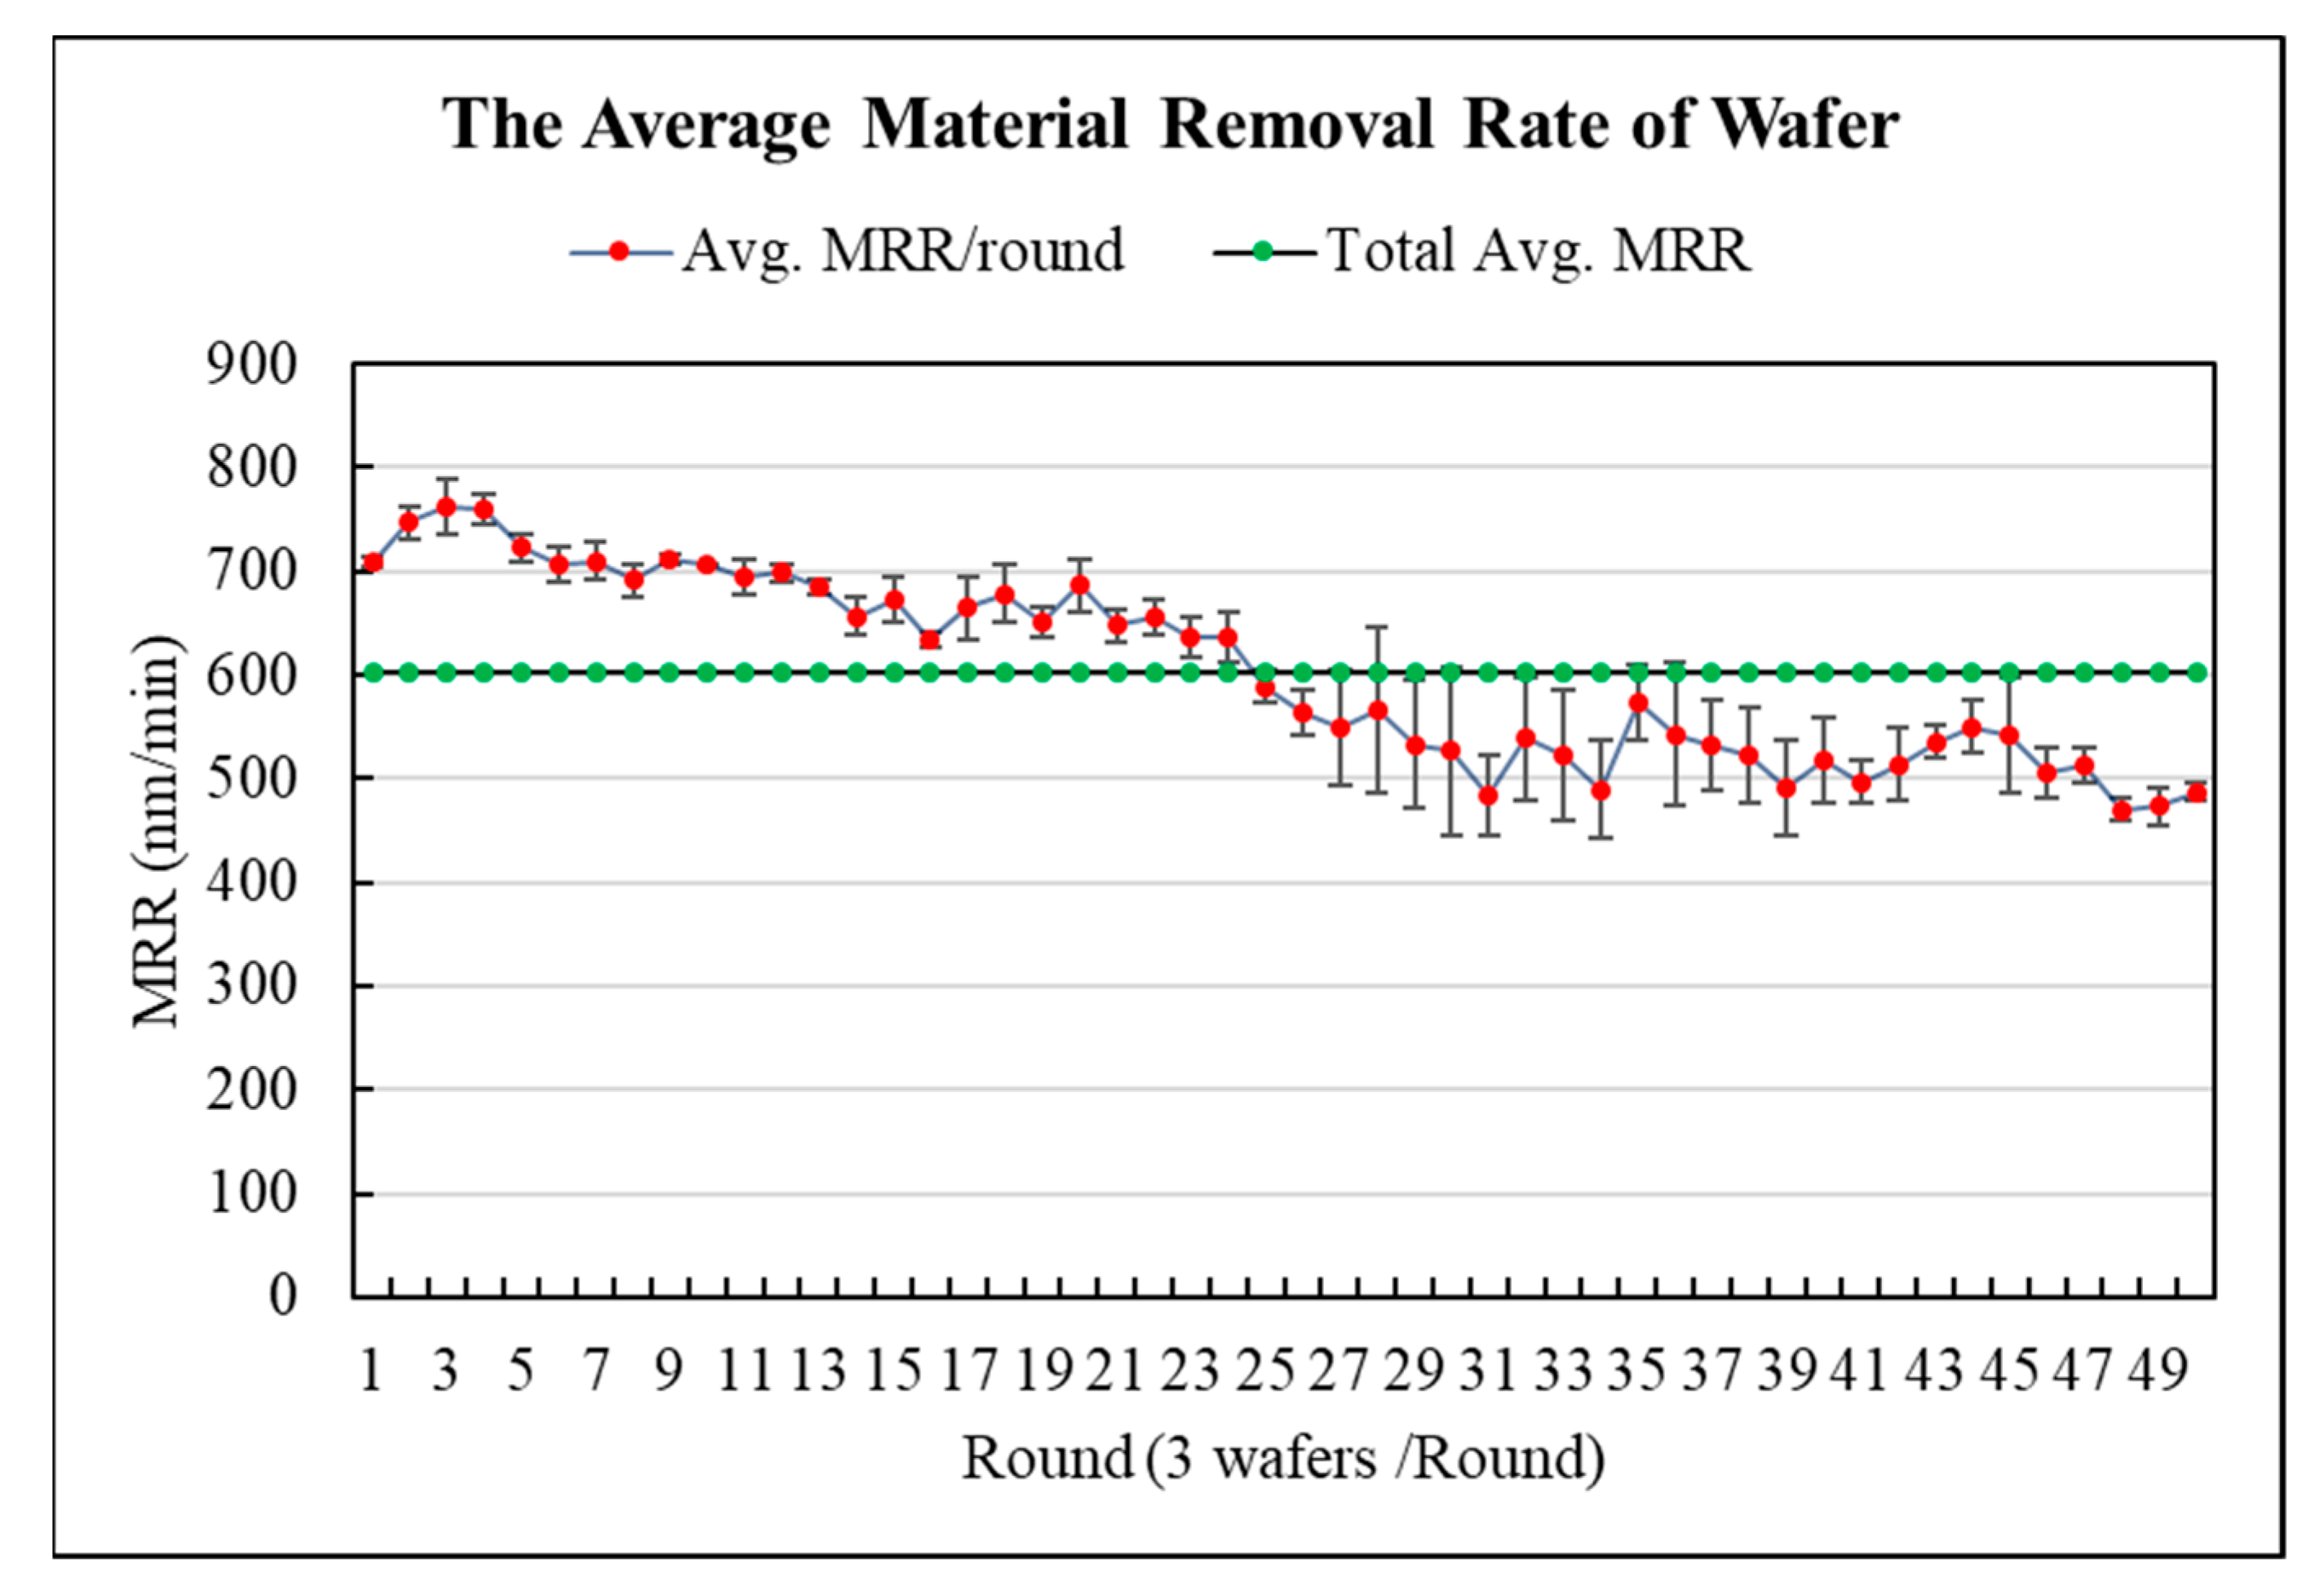
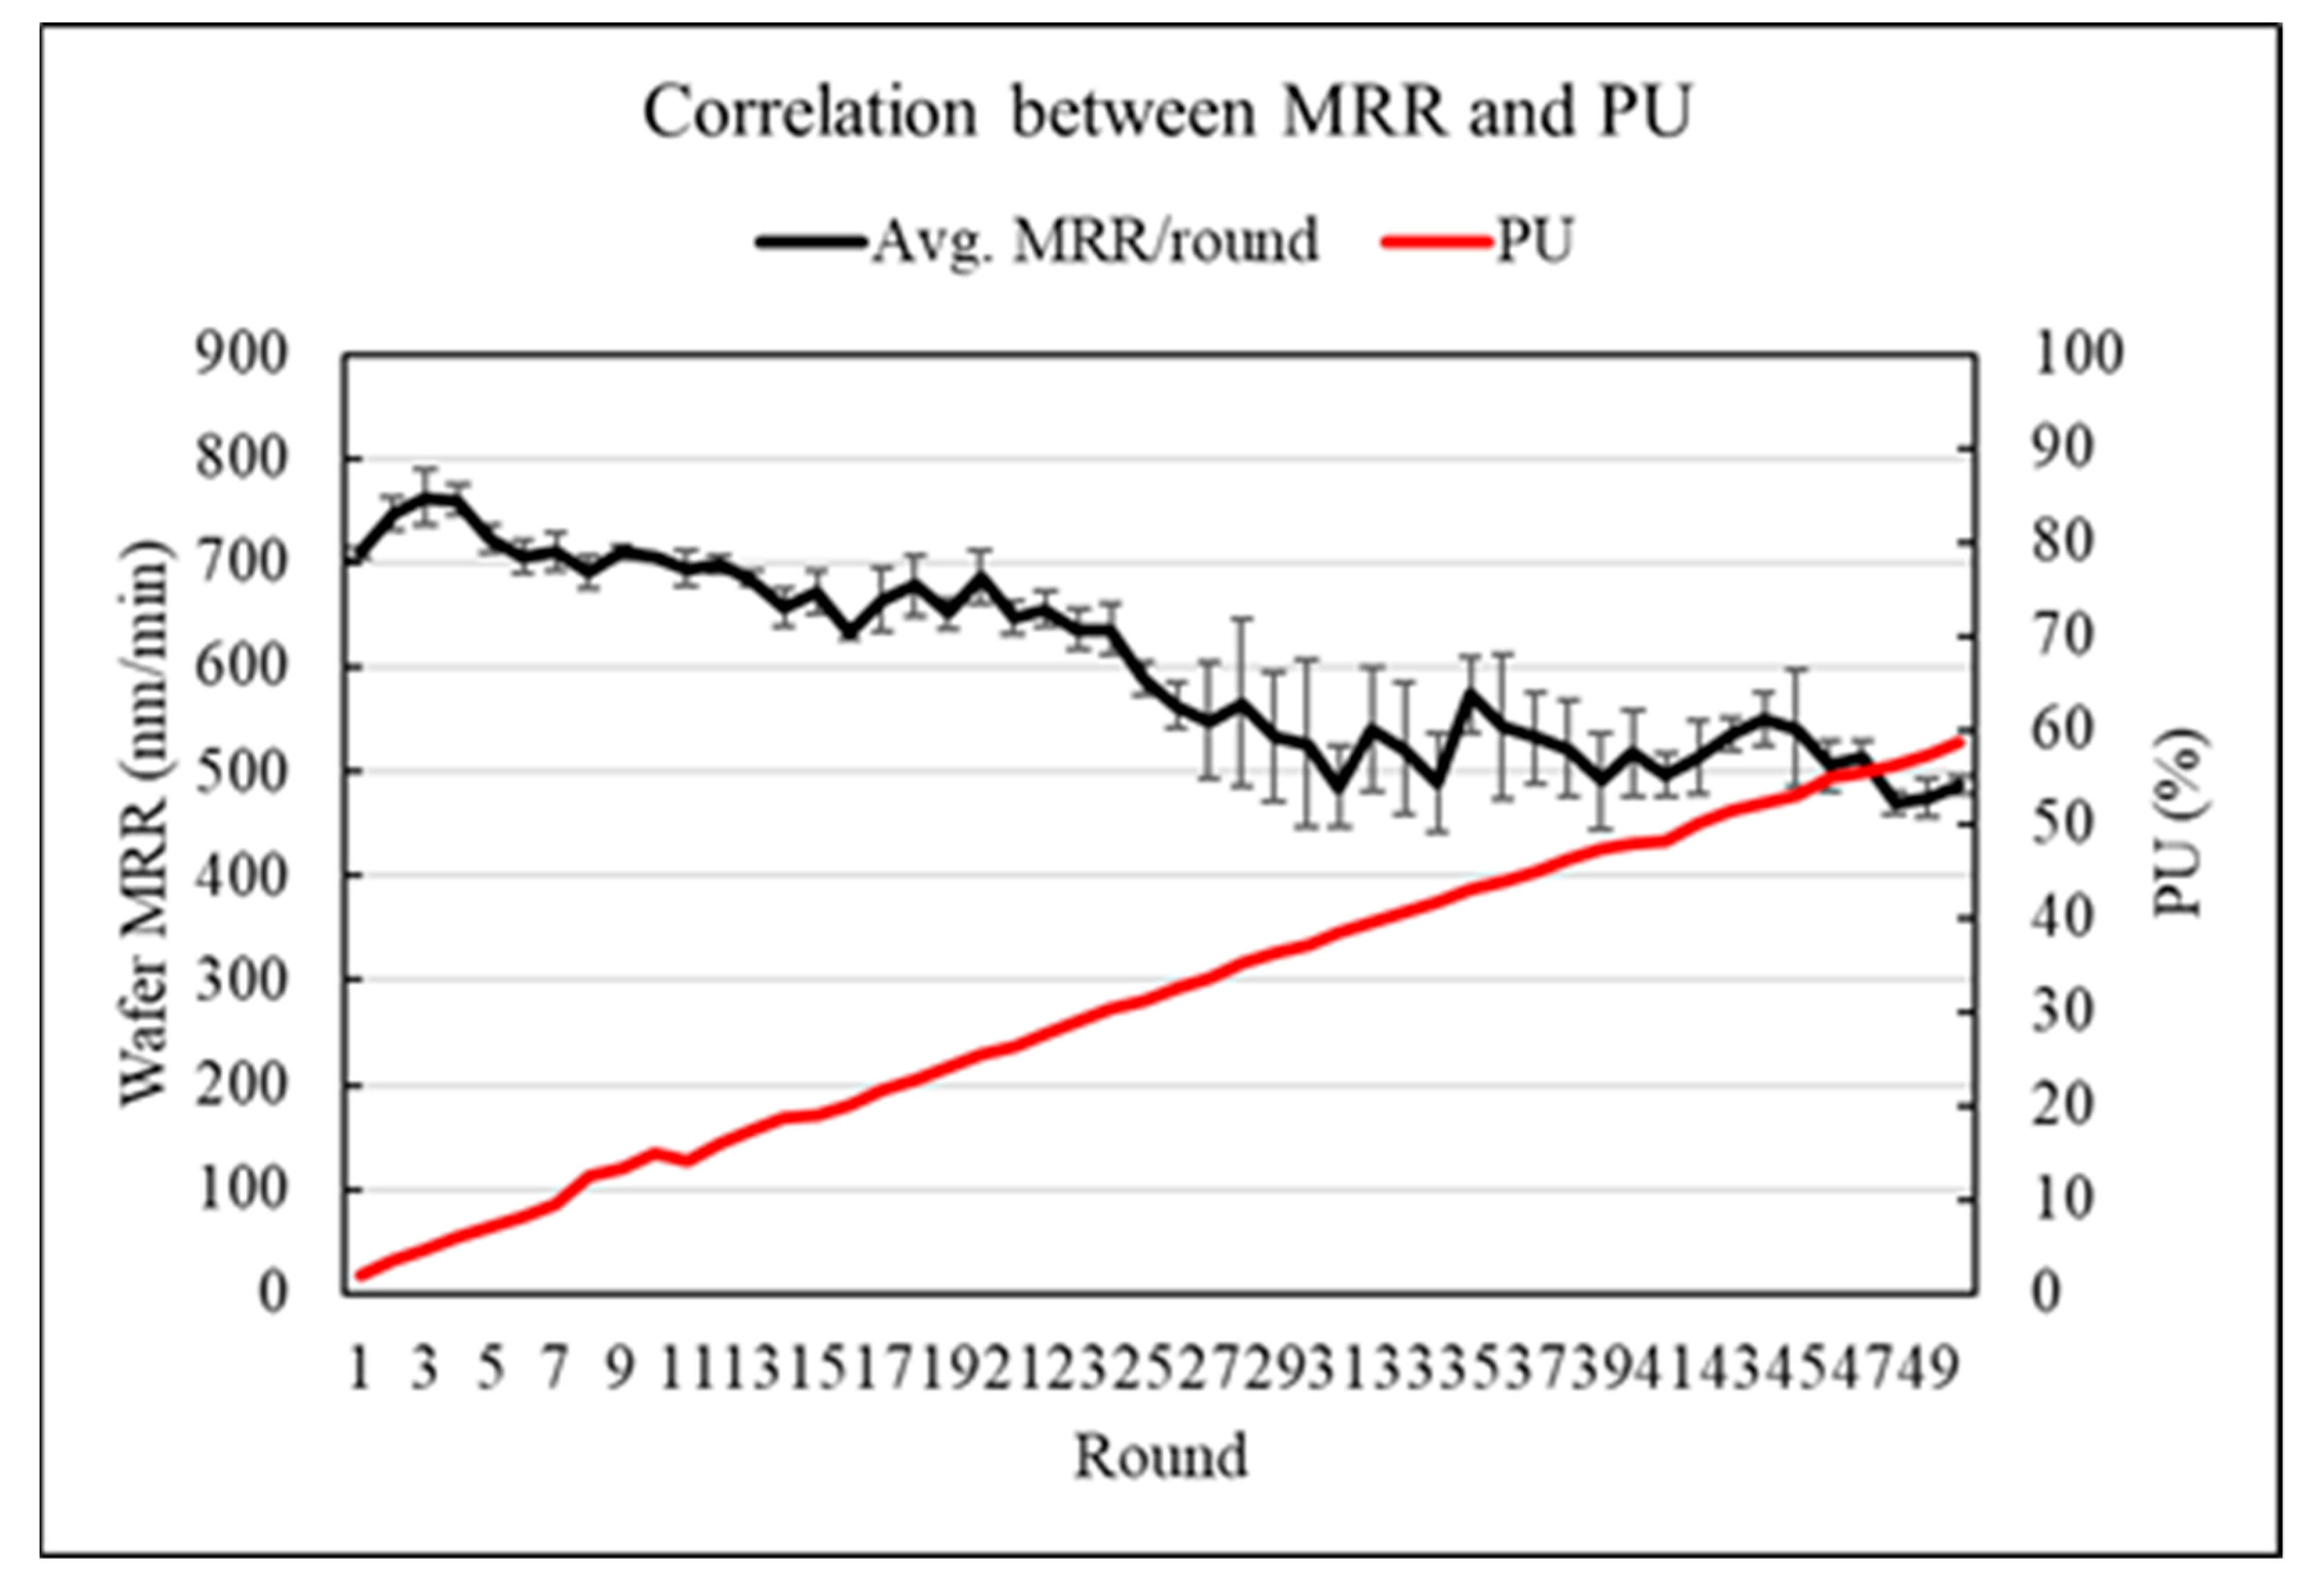
4.4. Correlations of CMP Results with Pad Performance Index

After 50 rounds of CMP tests with totally 150 CuB substrates, the MRR of CMP and surface roughness Sa are presented in Figure 12 and Figure 13. The average MRR is 602.97 nm/min and the average Sa is 3.496 nm. The MRR is 710 nm/min and reaches a maximum 762.5 nm/min in the third round of CMP experiment. From experimental results, the PELI and PU remain the same during the first three rounds of tests. The MRR decreases under average value after 25 rounds of tests and Sa of wafer increases over the average line after 31 rounds of test, but Sa value has a trend to increase around 25 rounds of test.
The PELI refers to the remaining groove depth of pad, which represents the ability to store and transfer slurry during CMP process. The effective groove depth can be used to refresh and spread the slurry into the surface between pad asperities and CMP area of Cu film. With the wearing of pad thickness or reducing pad groove depth, the MRR of CMP keeps decreasing. When PELI is smaller than 65%, i.e., the groove depth is less than 280 μm, the MRR of CMP becomes unstable. The MRR is 525 nm/min as PELI is between 35~50%. The MRR of CMP decreases 35% as the PELI of pad is over 70%.
Figure 14 and Figure 15 show the correlations between MRR of CMP with PELI and PU of polishing pad. The MRR of CMP has a high correlation as 0.94 with PELI and −0.94 with PU. The high correlation factor shows the MRR of CMP is highly influenced by the PELI of pad.
Consequently, Figure 16 and Figure 17 show the correlations between wafer Sa with PU and PELI. The correlations are obtained as 0.74 and −0.74. The wafer Sa keeps in the same level in the first 25 rounds of the test, and then raises with continuous tests. The correlations are obtained 0.93 and −0.91 by calculating only the last 25 rounds of the CMP tests, where the PELI is below 66.8%. The wafer Sa is significantly affected when pad is conditioned after rounds of processes. The correlations of each performance index and wafer quality are shown in Table 6.

5. Conclusions

This study has developed and completed a dynamic pad measurement system (DPMS) of surface topography for chemical mechanical polishing/planarization (CMP) process of IC fabrication. The integration of a chromatic confocal measurement probe into a dressing arm in CMP tool can be used for in-process acquiring pad topography for accessing the pad performance index. The measuring time can be minimized with the motion of the pad conditioning arm and not affecting the CMP throughput. Two major indexes of PU and PELI are presented to identify the status and performance level of the pad during the CMP process. Relationship of wafer quality and pad performance index are discussed by 50 rounds of CMP experiments. The change of PELI and PU are obvious, the wear of pad can be observed by the SEM cross-section photos. The PELI starts from 99.2% and ends with 34.61%, in which the groove is almost gone in the inner part of pad. The PU is 1.9% to 58.7% from start to end. The PU and PELI have high correlations, −0.94 and 0.94, with wafer MRR. Considering wafer Sa remains in the early stage of the experiments, the PU and PELI also highly correlated with wafer Sa for calculating the late stage of the experiments of 0.93 and −0.91. The MRR is changing with the wear of pad during CMP experiments, and the wafer Sa is affected by pad profile when the pad cutting rate (PCR) increases to a certain level. In this study, the Sa value will be highly correlated when PELI is below 66.8%. The MRR drops by 64% and wafer Sa raises 35% with the PELI decreasing by 64.6% and PU increasing by 56.8%.
Results of the study show that the developed DPMS can monitor the change of pad surface profile, which are significantly correlated with wafer quality by CMP. Experimental results can be used positively to predict pad life time for in-process process control of the CMP process.

Author Contributions

Conceptualization, C.-C.A.C. and J.-C.L.; Methodology, J.-C.L.; Software, J.-C.L., W.-C.L.,Y.-J.C. and C.-C.C.; Validation, J.-C.L., W.-C.L. and Y.-J.C.; Formal Analysis, C.-C.C.; Investigation, J.-C.L. and C.C; Data Curation, J.-C.L.; Writing—Original Draft Preparation, J.-C.L.; Writing—Review & Editing, J.-C.L.; Project Administration, C.-C.A.C.; Funding Acquisition, C.-C.A.C. All authors have read and agreed to the published version of the manuscript.

Funding

Authors appreciate for the financial funding of the research project collaborated with Ta Liang Technology Co., Ltd. supported by the Industrial Value Creation Program (grant number: 108-EC-17-A-05-S3-054) from the Academia by the Ministry of Economic Affairs (MEA), Taiwan.

Institutional Review Board Statement

Not applicable.

Informed Consent Statement

Not applicable.

Data Availability Statement

Data sharing not applicable.

Conflicts of Interest

The authors declare no conflict of interest.

References

  1. McGrath, J.; Davis, C. Polishing pad surface characterisation in chemical mechanical planarisation. J. Mater. Process. Technol. 2004, 154, 666–673. [Google Scholar] [CrossRef]
  2. Lee, E.-S.; Cha, J.-W.; Kim, S.-H. Evaluation of the wafer polishing pad capacity and lifetime in the machining of reliable elevations. Int. J. Mach. Tools Manuf. 2013, 66, 82–94. [Google Scholar] [CrossRef]
  3. Hooper, B.; Byrne, G.; Galligan, S. Pad conditioning in chemical mechanical polishing. J. Mater. Process. Technol. 2002, 123, 107–113. [Google Scholar] [CrossRef]
  4. Park, B.; Lee, H.; Park, K.; Kim, H.; Jeong, H. Pad roughness variation and its effect on material removal profile in ceria-based CMP slurry. J. Mater. Process. Technol. 2008, 203, 287–292. [Google Scholar] [CrossRef]
  5. Choi, W.J.; Jung, S.P.; Shin, J.G.; Yang, D.; Lee, B.-H. Characterization of wet pad surface in chemical mechanical polishing (CMP) process with full-field optical coherence tomography (FF-OCT). Opt. Express 2011, 19, 13343–13350. [Google Scholar] [CrossRef] [PubMed]
  6. Del Monaco, S.; Calderone, F.; Fritah, M.; Le Tiec, T.; Laurent, A. Chemical Mechanical Planarization (CMP) In-Situ pad groove monitor through Fault Detection and Classification (FDC) system. In Proceedings of the ICPT 2012-International Conference on Planarization/CMP Technology, Grenoble, France, 15–17 October 2012. [Google Scholar]
  7. Elledge, J.B. In-Situ Chemical-Mechanical Planarization Pad Metrology Using Ultrasonic Imaging. U.S. Patent 7,306,506, 11 December 2007. [Google Scholar]
  8. Chen, C.-C.A.; Wang, P.-K. Study on Bearing Area Ratio Analysis of CMP Pad Topography Measured by Confocal Laser Scanning System. In Proceedings of the International Conference on Planarization/CMP Technology, Hsinchu, Taiwan, 29 October 2013; pp. 114–117. [Google Scholar]
  9. Lee, H.; Zhuang, Y.; Sugiyama, M.; Seike, Y.; Takaoka, M.; Miyachi, K.; Nishiguchi, T.; Kojima, H.; Philipossian, A. Pad flattening ratio, coefficient of friction and removal rate analysis during silicon dioxide chemical mechanical planarization. Thin Solid Films 2010, 518, 1994–2000. [Google Scholar] [CrossRef]
  10. Matsumura, Y.; Hirao, T.; Kinoshita, M. Analysis of Pad Surface Roughness on Copper Chemical Mechanical Planarization. Jpn. J. Appl. Phys. 2008, 47, 2083–2086. [Google Scholar] [CrossRef]
  11. Khanna, A.J.; Jawali, P.; Redfield, D.; Kakireddy, R.; Chockalingam, A.; Benvegnu, D.; Yang, M.; Rozo, S.; Fung, J.; Cornejo, M.; et al. Methodology for pad conditioning sweep optimization for advanced nodes. Microelectron. Eng. 2019, 216, 111101. [Google Scholar] [CrossRef]
  12. Lee, H.; Lee, S. Investigation of pad wear in CMP with swing-arm conditioning and uniformity of material removal. Precis. Eng. 2017, 49, 85–91. [Google Scholar] [CrossRef]
  13. Lee, S.; Kim, H.; Dornfeld, D. Development of a CMP pad with controlled micro features for improved performance. In Proceedings of the ISSM 2005, IEEE International Symposium on Semiconductor Manufacturing, San Jose, CA, USA, 13–15 September 2005; pp. 173–176. [Google Scholar] [CrossRef] [Green Version]
  14. Huang, B.; Kunoth, A. An optimization based empirical mode decomposition scheme. J. Comput. Appl. Math. 2013, 240, 174–183. [Google Scholar] [CrossRef]
  15. Huang, N.E.; Shen, Z.; Long, S.R.; Wu, M.C.; Shih, H.H.; Zheng, Q.; Yen, N.-C.; Tung, C.C.; Liu, H.H. The empirical mode decomposition and the Hilbert spectrum for nonlinear and non-stationary time series analysis. Proc. R. Soc. A Math. Phys. Eng. Sci. 1998, 454, 903–995. [Google Scholar] [CrossRef]
  16. Lee, S.; Jeong, S.; Park, K.; Kim, H.; Jeong, H. Kinematical Modeling of Pad Profile Variation during Conditioning in Chemical Mechanical Polishing. Jpn. J. Appl. Phys. 2009, 48, 126502. [Google Scholar] [CrossRef]
  17. Chen, C.-C.A.; Pham, Q.-P. Study on diamond dressing for non-uniformity of pad surface topography in CMP process. Int. J. Adv. Manuf. Technol. 2017, 91, 3573–3582. [Google Scholar] [CrossRef]
Figure 1. Dynamic swing-arm chromatic confocal system.
Applsci 11 00179 g001
Figure 2. Schematic of scanning locus of confocal sensor.
Applsci 11 00179 g002
Figure 3. Working frequency of swing arm.
Applsci 11 00179 g003
Figure 4. Measurement data of pad surface. (a) Raw data combined with arm tilting, pad waviness and asperities. (b) Extraction of pad surface profile. (c) Extraction pad asperities.
Applsci 11 00179 g004
Figure 5. Kinik 3EA-3 diamond dresser.
Applsci 11 00179 g005
Figure 6. Diagram of scanning locus by different pad speed.
Applsci 11 00179 g006
Figure 7. Re−allocating the measurement data into the surface.
Applsci 11 00179 g007
Figure 8. Results of metrological experiments.
Applsci 11 00179 g008
Figure 9. Results of PELI and PU for 50 rounds of CMP experiments.
Applsci 11 00179 g009
Figure 10. Re−mapped pad surface profile from round 1 to round 50.
Applsci 11 00179 g010
Figure 11. Cross-section SEM photo of pad.
Applsci 11 00179 g011aApplsci 11 00179 g011b
Figure 12. Average MRR of CuB wafer of 50 rounds of test.
Applsci 11 00179 g012
Figure 13. Average Sa of CuB wafer of 50 rounds of test.
Applsci 11 00179 g013
Figure 14. The correlations between MRR and PU.
Applsci 11 00179 g014
Figure 15. The correlations between MRR and PELI.
Applsci 11 00179 g015
Figure 16. The correlations between wafer Sa and PU.
Applsci 11 00179 g016
Figure 17. The correlations between wafer Sa and PELI.
Applsci 11 00179 g017
Table 1. Characteristics of IC1000 pad.
PadIC1000
Thickness (mm)1.36
Grid size (mm)7.5
Groove width (mm)0.5
Groove depth (mm)0.436
Hardness (Shore D)53
Compressibility (%)5%
Recovery (%)76%
Table 2. Break-in parameters of pad dressing.
Pressure6.89 kPa (1 psi)
Pad speed80 rpm
Dresser head speed70 rpm
SlurryDIW
Slurry feed rate200 mL/min
Conditioning time12 min
Table 3. Diamond conditioning parameters of pad.
Pressure13.79 kPa (2 psi)
Pad speed80 rpm
Dresser head speed70 rpm
SlurryDIW
Slurry feed rate200 mL/min
Conditioning time1.5 min
Table 4. Chemical mechanical planarization/polishing (CMP) parameters.
Pressure20.68 kPa (3 psi)
Pad speed80 rpm
Dresser head speed70 rpm
SlurryC8902
Slurry feed rate200 mL/min
Conditioning time1 min
Table 5. Parameters of metrological experiments.
Platen Rotation Speed1, 5, 10, 20, 30, 40, 50, 60, 70, 80, 90, 100 rpm
Swing Arm Rotation Speed1°/s
Sampling Rate1000 Hz
Measurement times50 times
Scan time50 s
Table 6. Correlations of Wafer and pad index.
Wafer/Pad IndexMRR(nm/min)Sa(μm)Sa(μm)
Last 25 rounds
PU(%)−0.940.760.93
PELI(%)0.94−0.76−0.91
Publisher’s Note: MDPI stays neutral with regard to jurisdictional claims in published maps and institutional affiliations.

