Article

Preliminary Study to Explore the Immune-Enhancement Mechanism of Platycodon grandiflorus Extract through Comparative Transcriptome Analysis

1
Department of Food and Nutrition, College of BioNano Technology, Gachon University, Gyeonggi-do 13120, Korea
2
Department of Computer Science, College of IT, Gachon University, Gyeonggi-do 13120, Korea
3
Institute for Aging and Clinical Nutrition Research, Gachon University, Gyeonggi-do 13120, Korea
*
Author to whom correspondence should be addressed.
Appl. Sci. 2021, 11(1), 226; https://doi.org/10.3390/app11010226
Submission received: 26 November 2020 / Revised: 23 December 2020 / Accepted: 24 December 2020 / Published: 29 December 2020

Abstract

:

Featured Application

Authors are encouraged to provide a concise description of the specific application or a potential application of the work. This section is not mandatory.

Abstract

Platycodon grandiflorus has huge potential medicinal applications in different diseases and immune enhancement (IE). In the past, limited studies have been conducted to decipher the molecular mechanism behind IE of Platycodon grandiflorus extract (PGE) despite the fact that IE can be one of the important factors for application of PGE in different diseases including cancer. In this study, whole transcriptome expression and subsequent analysis in PGE treated/untreated organisms were carried out to explore the molecular mechanism behind IE, and subsequently anticancer effect. Current study has the possibility of interaction of PGE treatment with diet, so further study is required to validate the results. The immunity-related genes were found to be up-regulated in the differential expression analysis, which is in line with the IE potential of PGE and the literature. Similarly, Siglec-15, the immune-suppressor gene that has recently been suggested as the normalization target in cancer, was one of the most down-regulated genes. In a set analysis with immune-suppressor genes, the high number of immune-suppressor genes were found to be down-regulated, which indicated that down-regulation of immune-suppressor genes can be the major mechanism behind the IE in PGE treatment. Identified genes, important in immunity and cancer, are highly recommended for anticancer and IE targets in future studies.

1. Introduction

Platycodon grandiflorus is a perennial flowering plant commonly known as balloon flower found in East Asia, including Korea, China, Japan and some parts of Russia. P. grandiflorus is the only member of the genus Platycodon and belongs to the family Campanulaceae. P. grandiflorus is the medicine food homology species that has been consumed as both food and medicine from ancient time mostly in Korea, China and Japan [1]. Although P. grandiflorus also has high ornamental value as the flower buds are balloon shaped and found in different colors such as blue, purple, red, violet, white or pink, their extraordinary medicinal properties make the plant highly valuable for anti-hypertension, anti-tumor, anti-obesity, anti-atherogenic, anti-inflammatory, immune enhancement, and reduction in blood sugar levels and blood pressure [1]. Generally, saponins (includes Platycodin A, Platycodin C, Platycodin D, Platycodin D2, Platycodin D3, Deapioplatycodin D, 16-oxo-platycodin D, Polygalin D), flavonoids such as (Luteolin-7-O-glucoside Apigenin-7-O-glucoside), Lobetyol palmitic acid, oleic acid, and gamma-aminobutyric acid are considered as the bioactive component in P. grandiflorus extract (PGE) [1]. The anticancer property of PGE against many types of cancer and metastasis can be considered as one of the most prospective properties of PGE that has potential for cancer treatment [2,3,4]. Diverse medicinal properties of PGE can be primarily attributed to immune-enhancement properties of PGE, which result in recovery against a number of diseases, including different types of cancers [1]. Immune-enhancement effects of PGE were observed in vitro and in vivo studies, which showed activation of both innate and adaptive immune responses in immunosuppressive conditions [5,6,7,8]. The effect of PGE treatment on expression of genes related to immune response can help to understand of the molecular mechanism of PGE in immune enhancement and subsequently other important medicinal properties of PGE i.e., anticancer activity against various cancers and metastasis. Concerning the importance of the immune-enhancing property of PGE, our previous studies found that cell proliferation of macrophages and splenocytes correlates positively with the PGE treatment. It also increased the phagocytic activity of macrophage cells, increased interleukin levels and induced phosphorylation of the p38 mitogen-activated protein kinase, which activated the nuclear factor-kappa B, as well as production of nitric oxide and cytokines [6]. In another study with treatment of fermented products of PGE, we also observed similar effects as the activation and phosphorylation levels of nuclear factor kappa B (NF-κB) were found to be increased [5,9]. In recent experiments with the rat model, the researchers found that PGE treatment increased the cell viability, activity of natural killer cells and cytotoxic T lymphocytes. They also observed the increased production of cyclophosphamide-induced cytokines and different immunoglobulins in splenocytes [5,9]. Overall the study found that PGE recovers the damage in the spleen and thymus caused by cyclophosphamide.
Although several studies were carried out on the role of PGE in immune enhancement, these studies were mainly focused on exploring the macrophage and other immune cell activity, levels of cytokines and interleukins [7,8] to confirm the immune-enhancement property. Limited studies have been performed to explore the molecular mechanism of immune enhancement, whereas no study was carried out to analyze the whole transcriptome expression in PGE treatment for a broader view on the mechanism of immune enhancement. Studying the expression profile of the different genes in the whole transcriptome can help to elucidate the mechanism of immune enhancement and the effects on different pathways in PGE treatment. The molecular mechanism of immune enhancement in PGE treatment can be of great importance in optimal use of PGE in immune enhancement and subsequently its use as an anticancer treatment and other pharmacological applications. High-throughput technology such as next-generation sequencing made it possible to study the whole transcriptome; RNA-Seq technology has especially proven its potential. RNA-Seq has been successfully used in several whole transcriptome studies to explore the molecular mechanism in the immune response in different organisms [10,11,12,13]
The RNA-Seq study coupled with computational analysis can provide a comprehensive understanding of molecular mechanisms involved in different and specific biological phenomena and disease conditions with the information on gene expression and function [12,14,15,16,17]. Pre-existing RNA-Seq datasets in the public repository can also be helpful to unveil and/or validate the molecular mechanism reported from related studies [12]. Hence, the available RNA-Seq dataset from PGE-treated organisms was considered in the current research to study expression of various genes. The differentially expressed gene playing a role in immunity-related functions can help to understand the mechanism of immune enhancement in PGE treatment for optimal use of PGE in different diseases and discovery of new targets for therapeutics.

2. Materials and Methods

The methodology for the current research was designed and followed in a stepwise manner to understand the transcriptomic changes important in immune modulation occurring in PGE treatment (Figure 1).

2.1. RNA-Seq Data Sets Used in the Study

The only available RNA-Seq dataset of the PGE-treated organisms was extracted from the NCBI-SRA database [18]. The dataset was in three groups, i.e., RNA-Seq datasets from epididymal white adipose tissue (eWAT) of mice fed with Normal Diet (ND), High Fat Diet (HFD) and PGE-treated HFD (PTFD). Therefore, 3 samples from every group were used in the study for the RNA-Seq analysis as the possible triplicate in the experiment, i.e., SRR8581331, SRR8581334 and SRR8581337 in group PTFD; SRR8581333, SRR8581335 and SRR8581336 in ND group; and SRR8581332, SRR8581338 and SRR8581339 in HFD group. Finally, two comparisons (comparison-I and comparison-II) were considered for the study according to PGE treatment and diet provided to the mice. In comparison-I, the PGE-treated HFD (PTFD) mice were grouped as PGE Treated group (PTG) and HFD mice as PGE Not-Treated group (PNTG). In comparison-II, again two groups were considered—the first group was the same as comparison-I PTFD as PTG, and the second group, i.e., PNTG was created through merging the ND and HFD mice to make comparison-II more challenging, as PNTG group in comparison-II has both normal-diet and high-fat diet mice.

2.2. RNA-Seq Analysis for Assembly and Differential Expression

All pair-end reads from nine different samples of both (PNTG and PTG) groups were converted into fastq reads through an SRA tool kit [19]. Furthermore, the fastq reads were analyzed through AfterQC for the quality control [20]. The suggested parameters were used in AfterQC analysis, which includes filtering, trimming, error removing and quality control of the reads [20]. Finally, only the good quality reads according to suggested parameters from quality- control analysis were subjected to alignment with genome using an HISAT2 alignment tool [21]. GRCm38, the mouse (Mus musculus) reference genome assembly released by the Genome Reference Consortium, was used for alignment of reads for all the samples that resulted in Sequence Alignment Map (SAM) files. SAM files were sorted and converted to bam files as per requirement for further assembly process using SAMtools [22]. The assembly was done using StringTie [23] with the -e option, which is required to combine the results of all samples for differential expression analysis. To combine the assembly results for all selected nine samples from both groups (PTG and PNTG) python script (prepDE.py) was used. Further, iDEP 9.1 was used for different expression-related analysis through EdgeR and DESeq2 [24,25,26]. Suggested parameters for differential expression (i.e., FDR < 0.1 and minimum 2-fold change) were used to identify the DEG in both comparisons (comparison-I and comparison-II) [24,25].

2.3. Function Enrichment of DEG

All differentially expressed genes (DEG) from both comparisons were subjected to functional enrichment analysis using PANTHER (protein analysis through evolutionary relationship), which is based on biological process, cellular component, molecular function, protein class and pathway enrichment [27,28]. Each analysis was carried out with suggested statistical cutoff, and the results were stored in tab-separated variable format (TSV) files [27,28].

2.4. Identification of DEG with Immunity Related Function in Subset Analysis

Two different immunity-related gene sets were prepared and compared with identified DEG between PTG and PNTG groups in both the comparisons. Information of all 871 immunity-related mouse genes present in IMGT/GENE-DB [29] corresponding to 1321 allele was extracted in tabular format. Furthermore, the gene names were converted to gene accession numbers using g:Profiler server [28]. All these genes were used to create immunity-related gene set-1. Immunity-related gene set-2, which is the collection of immune-suppressive genes, was created with all genes of mouse homologous to immunosuppressive genes reported in HisgAtlas 1.0 database (a human immunosuppression gene database) [30]. All immunosuppressive genes present in HisgAtlas database were mapped to homologous genes in mouse using g:Profiler server [28]. Names of these immune-suppressive genes in mouse were converted to gene accession numbers to create immunity-related gene set-2. These immunity-related gene set-1 and gene set-2 were used to identify common up- and down-regulated DEG in both the comparisons considered in the study from set analysis [31]. The list of ensembl ids for up- and down-regulated genes in both comparison and prepared gene set-1 and gene set-2 was used in set analysis through InteractiVenn [31].

2.5. Protein-Protein Interaction Network

All down-regulated common immune-suppressive genes identified in both comparisons were subjected to protein–protein interaction analysis using STRING version 11.0 [32]. Protein–protein interaction and KEGG network enrichment analysis were carried out using Mus musculus, which was selected as the target organism [33]. The ensemble ids of genes were used as input, and default parameters were utilized for the analysis. According to output, the results were stored in TSV and image format files.

3. Results

3.1. Preprocessing and Alignment of Reads to Reference Genome

Different analyses were carried out on all nine samples to obtain the whole transcription data in the form of assembled genes/transcripts for further differential expression and other downstream analysis (Figure 1). The preprocessing and quality control were carried out to select the good quality reads for alignment of the reads with reference genome, and finally more than 98.7% reads (with average of more than 99.5%) were obtained as good reads from all the selected samples (Table 1). After preprocessing, only the good quality reads were subjected to alignment with efficient method HISAT2 using the mouse reference genome GRCm38. Finally, high-alignment rate was achieved in all samples used in the study, i.e., more than 98% overall alignment rate in the alignment (Table 1).

3.2. Assembly and Expression Analysis

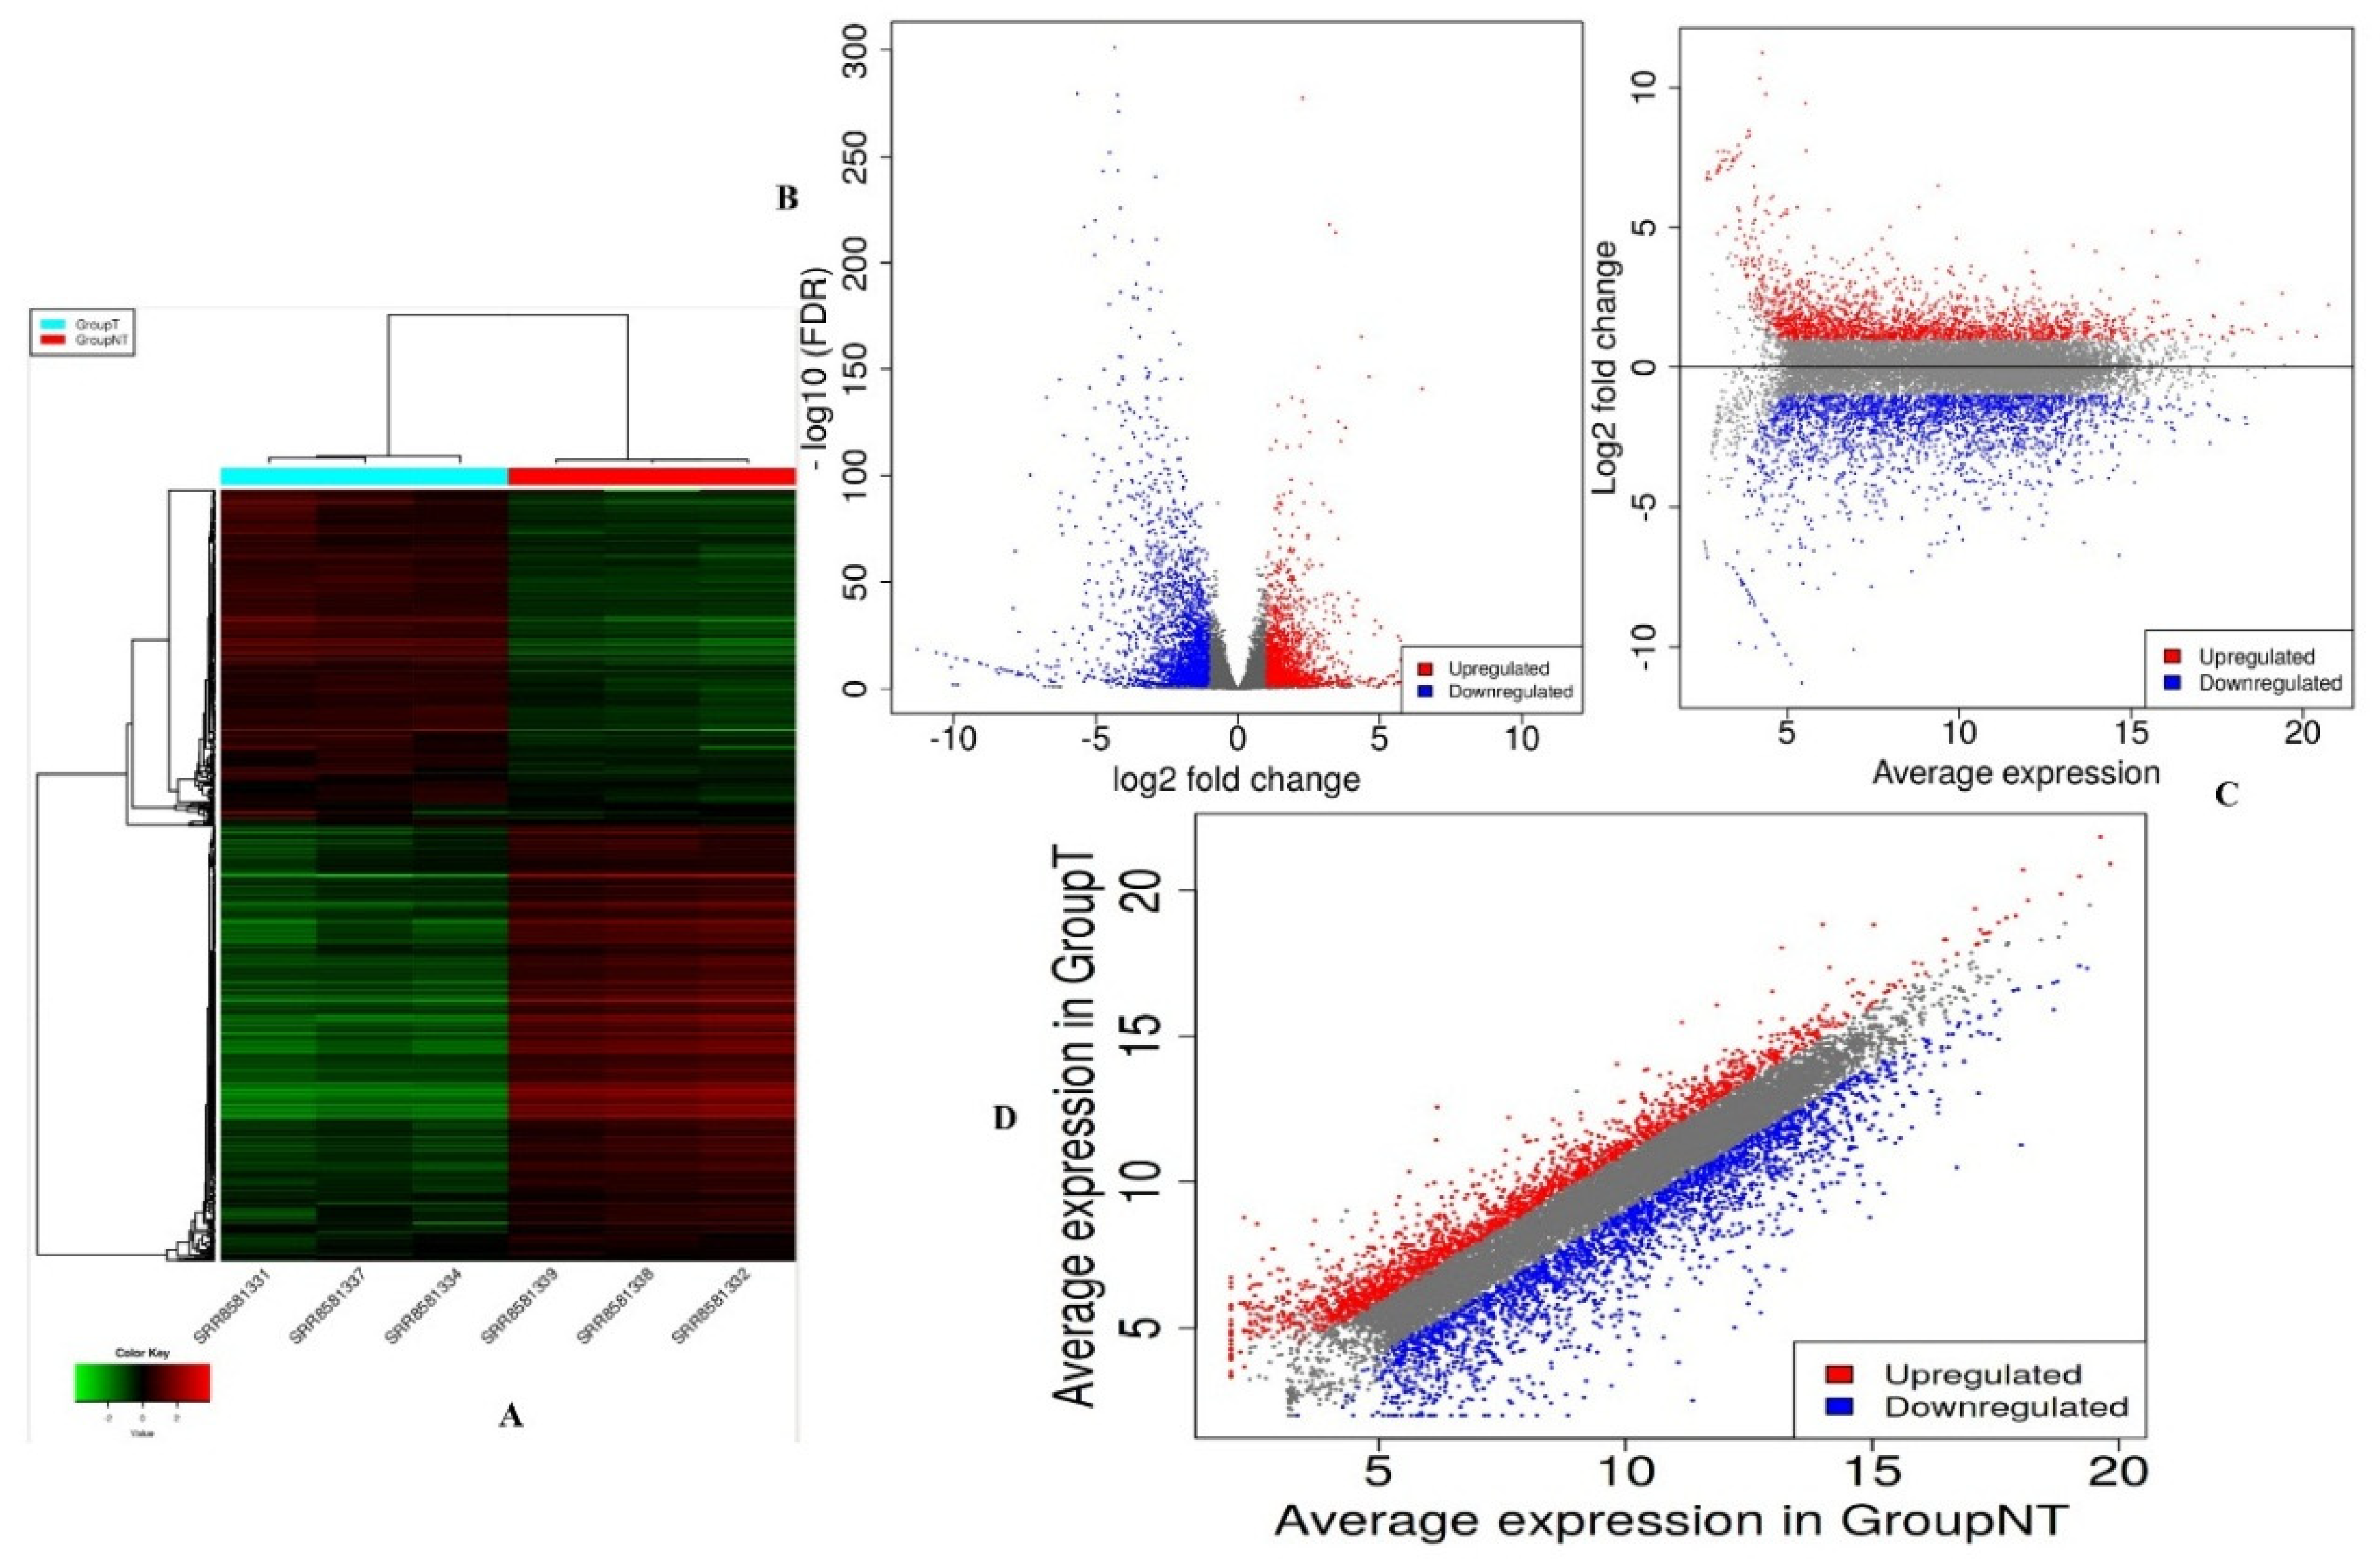
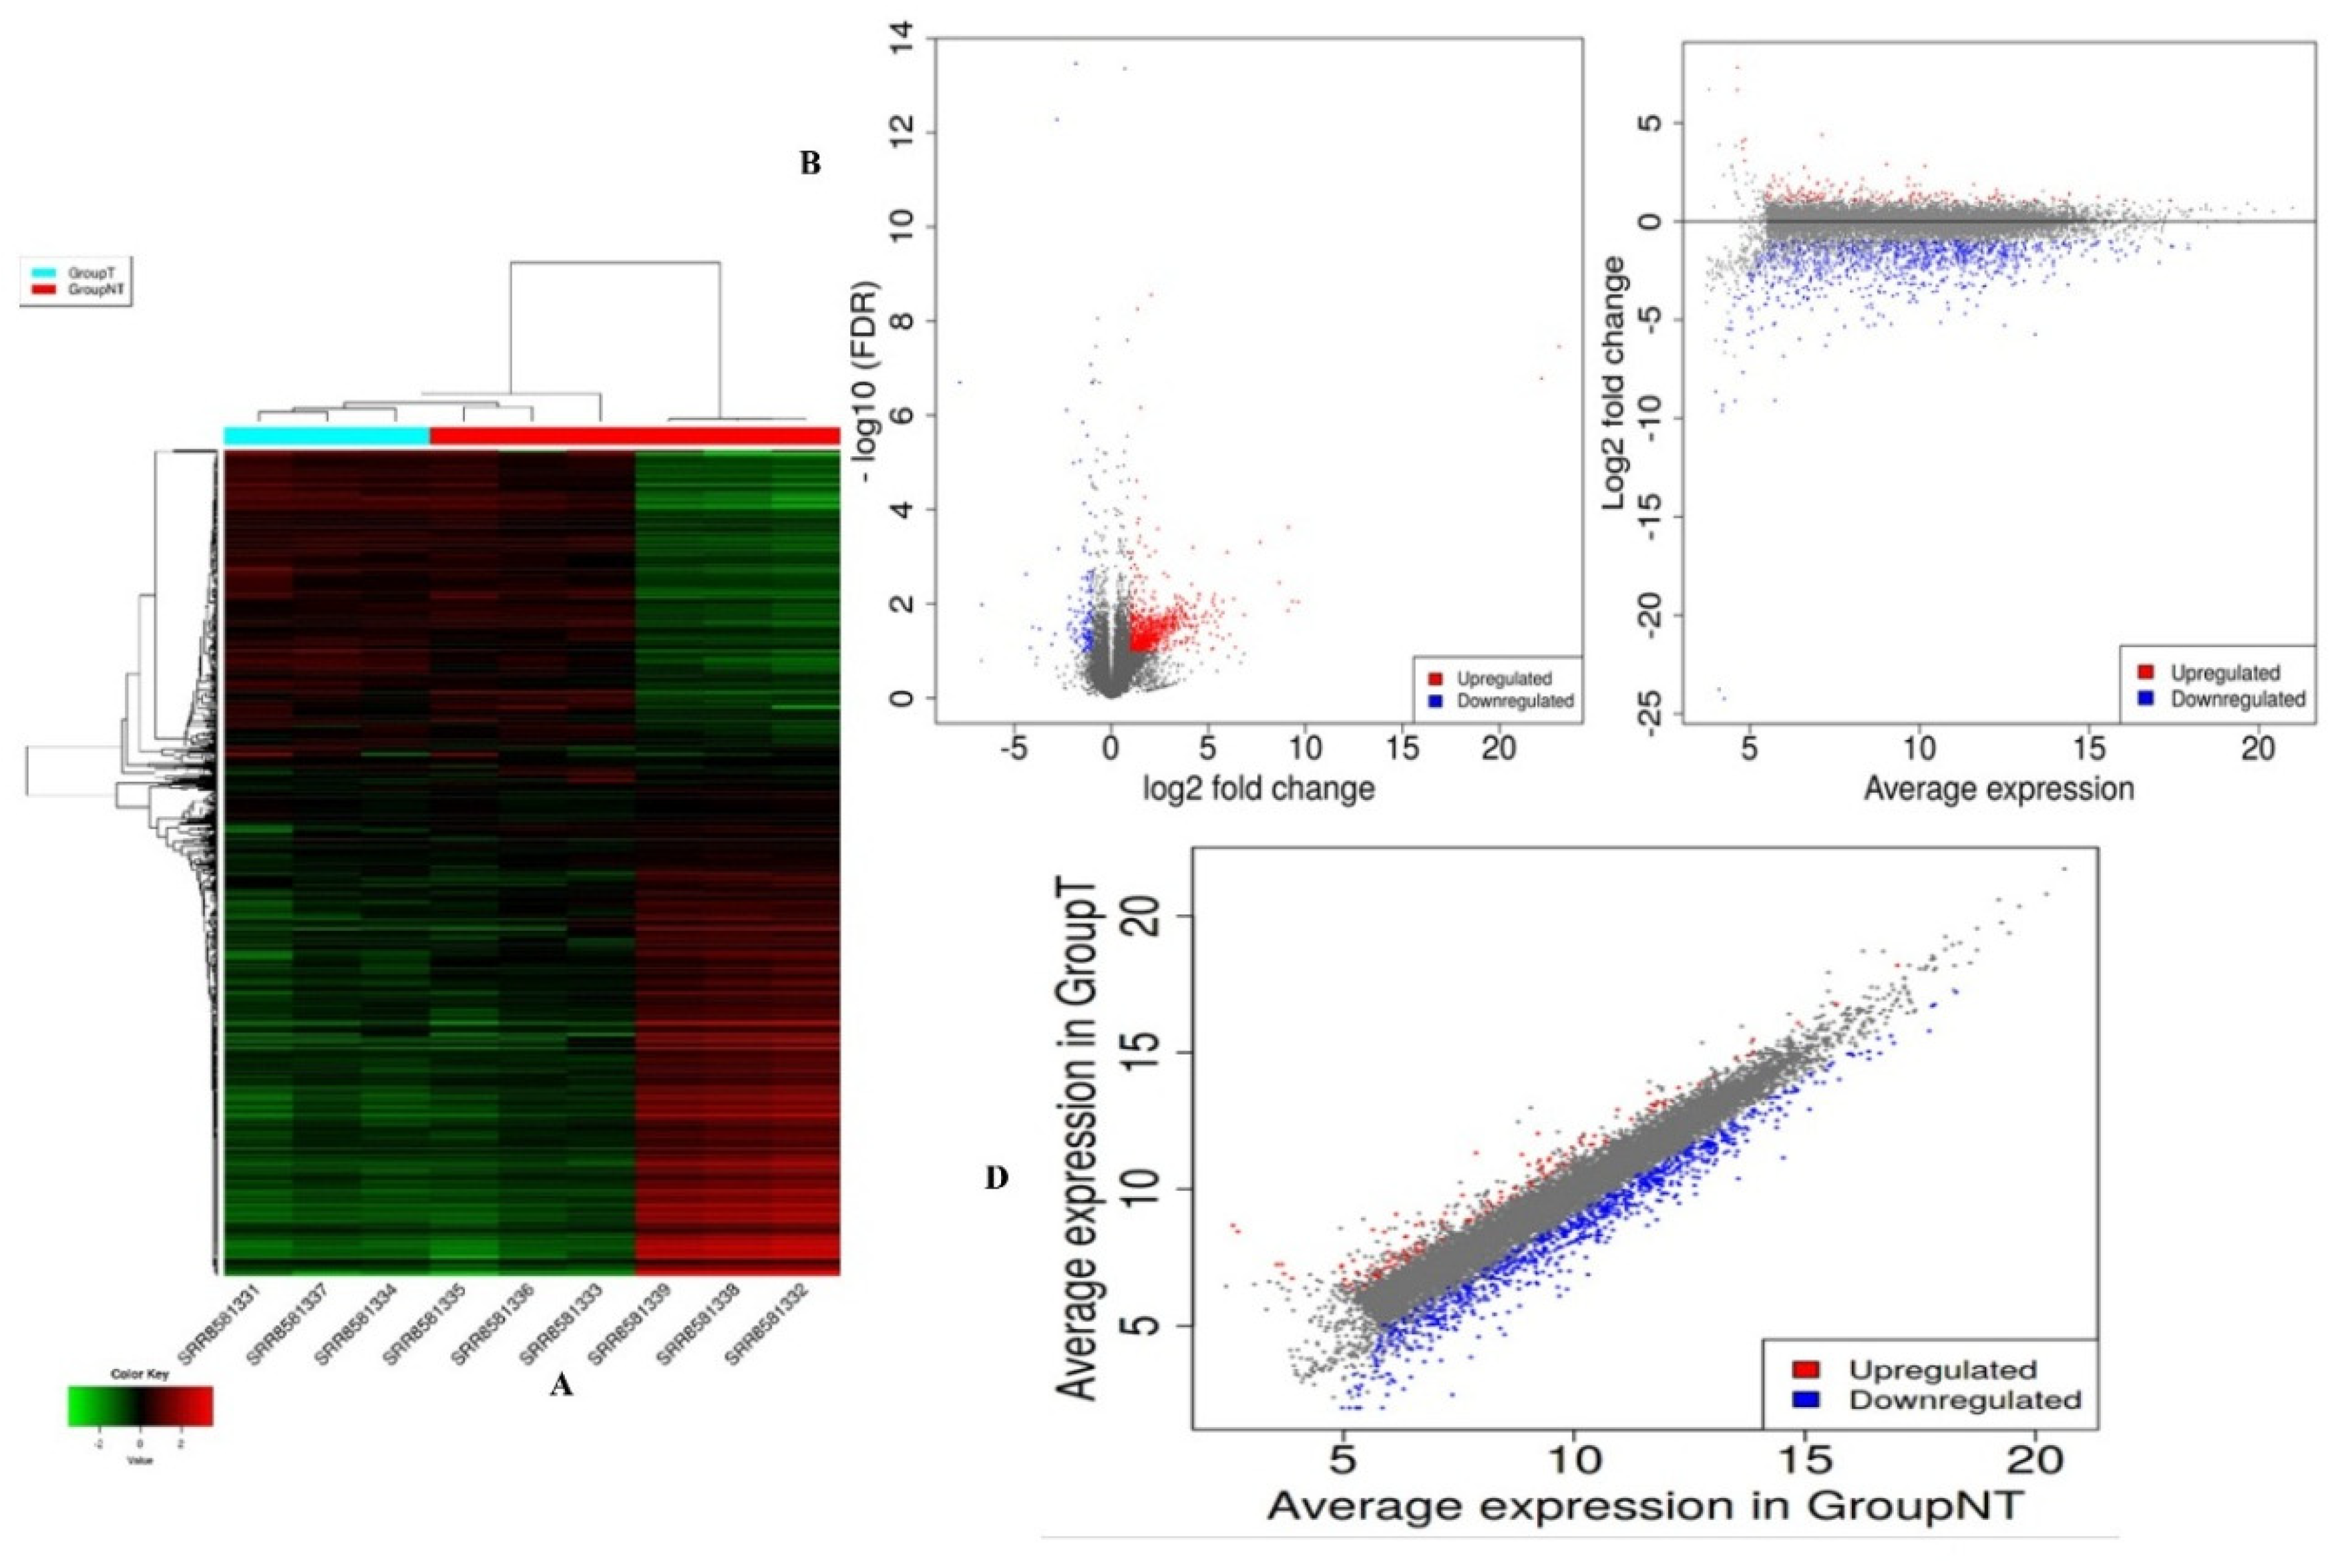
The alignment was used to assemble the transcripts through StringTie, which also calculates the read counts and fragment per kilobase of transcript per million map reads (FPKM) value corresponding to every assembled gene/transcript. Finally, the count matrix was made from the StringTie output of every sample as count matrix is the recommended input for the differential-expression analysis [23]. The read count matrix of comparison-I and comparison-II had six samples and nine samples, respectively, which were used for further analysis in iDEP 9.1. In expression analysis, genes with 0.5 minimal counts per million (CPM) in at least one library were selected and taken for the clustering and heatmap analysis. Heatmaps were generated using 1000 most differentially expressed genes in both the comparisons (comparison-I and comparison-II). Hierarchical clustering within the heatmaps clustered the PTG and PNTG groups in separate clusters in both the comparisons (Figure 2 and Figure 3). In differential expression analysis, a total of 1951 and 130 genes were found to be up-regulated in comparison-I and comparison-II, respectively (Table D1 and Table D2). Similarly, 2396 and 859 genes were found to be down-regulated in comparison-I and comparison-II, respectively (Table D1 and Table D2). Different plots such as MA plot, volcano plot and scattered plot were also constructed from the DEGs in both the comparisons (Figure 2 and Figure 3).

3.3. Functional Enrichment Analysis

Identified DEGs were subjected to functional enrichment analysis using PANTHER (protein analysis through evolutionary relationship) on the basis of biological process, cellular component, molecular function, protein class and pathway enrichment. In comparison-I, the DEGs were enriched in 8 (transcription regulator activity, molecular transducer activity, binding, structural molecule activity, molecular function regulator, catalytic activity, translation regulator activity and transporter activity) different molecular functions, 21 different biological processes, 14 different cellular components, 21 diverse protein classes and 137 various pathways (Tables S1a–S5a). Similarly, in comparison-II the DEGs were enriched in 7 (transcription regulator activity, molecular transducer activity, binding, structural molecule activity, molecular function regulator, catalytic activity and transporter activity) different molecular functions, 20 different biological processes, 14 different cellular components, 19 different protein classes and 85 different pathways (Tables S1b–S5b).

3.4. DEG with Immunity Related Function

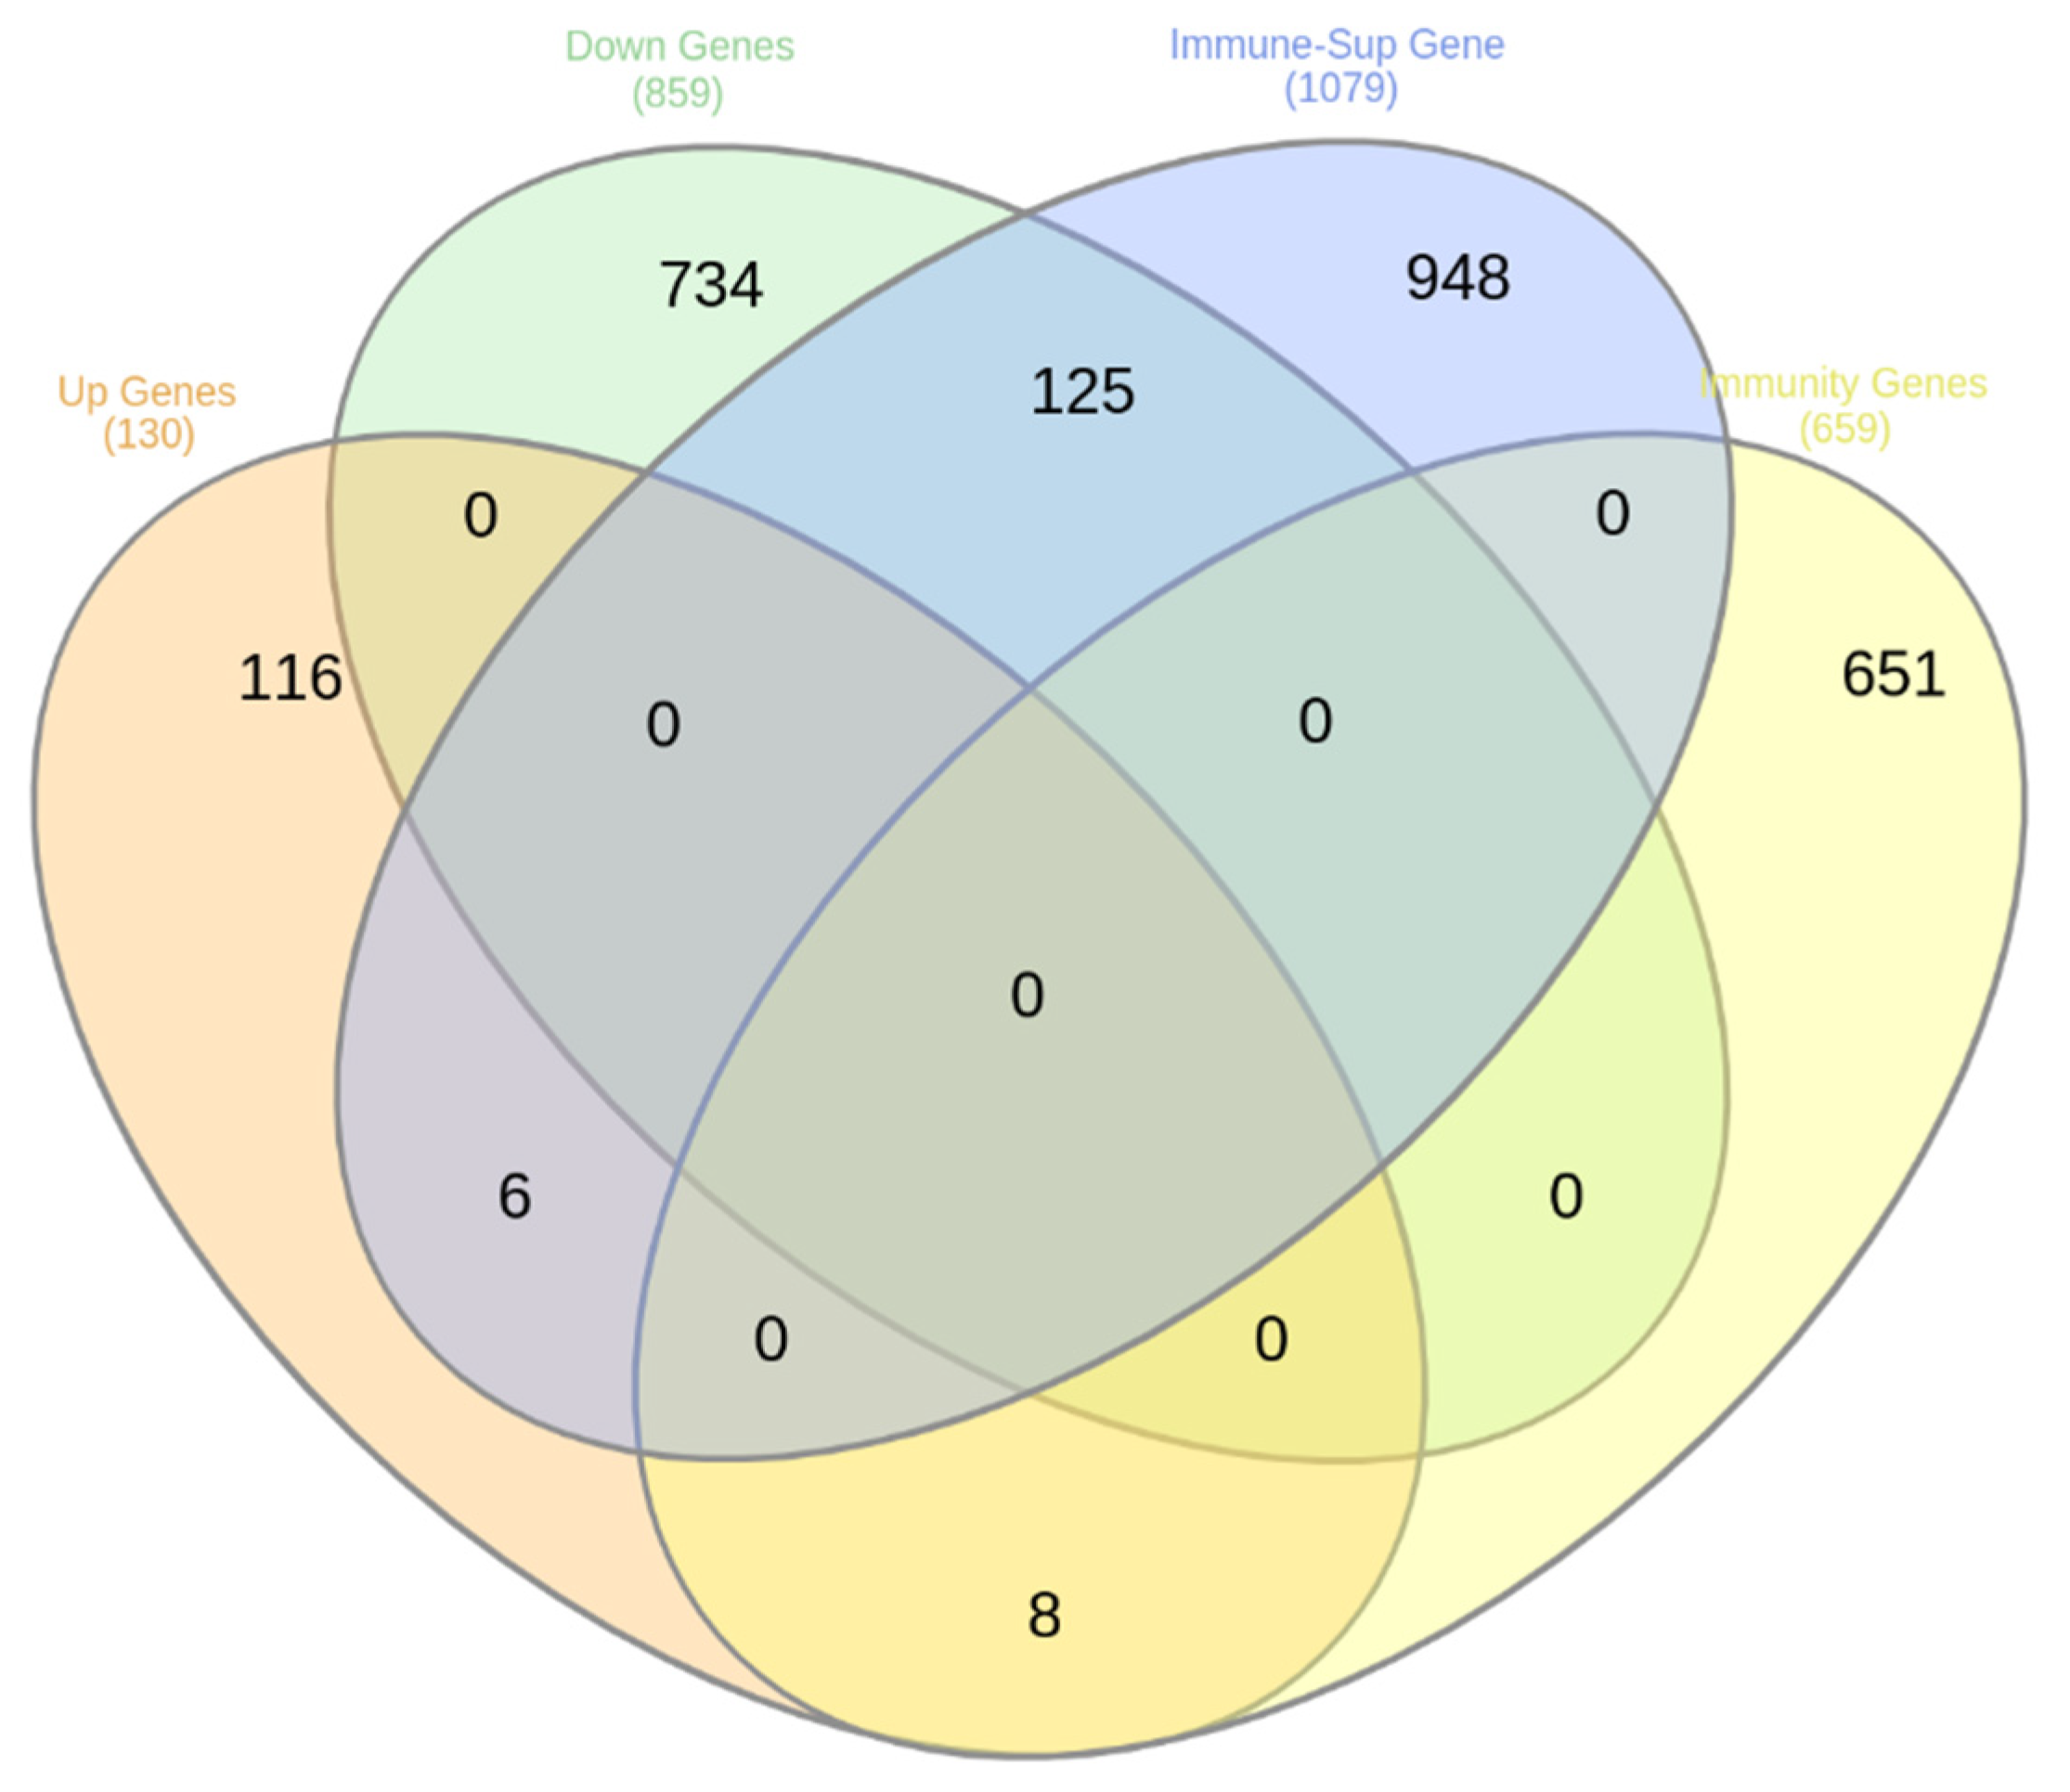
In set analysis, among the up-regulated genes the 61 and 8 genes from comparison-I and comparison-II, respectively, were found to be present in gene set-1, i.e., listed in mouse immunity-related genes (IMGT/GENE-DB) [29]; no gene was listed in gene set-1 within down-regulated genes from both the comparisons (comparison-I and comparison-II). Similarly, 219 and 125 genes among down-regulated genes from comparison-I and comparison-II, respectively, were found to be listed in gene set-2, which consisted of known immunosuppressive genes. All down-regulated immune-suppressive genes (125 genes) in comparison-II were also found to be common in 219 down-regulated immune-suppressive genes in comparison-I. However, only 98 and 6 genes from comparison-I and comparison-II, respectively, were found to be present ingene set-2 (Figure 4 and Figure 5).

3.5. Protein–Protein Interaction Analysis

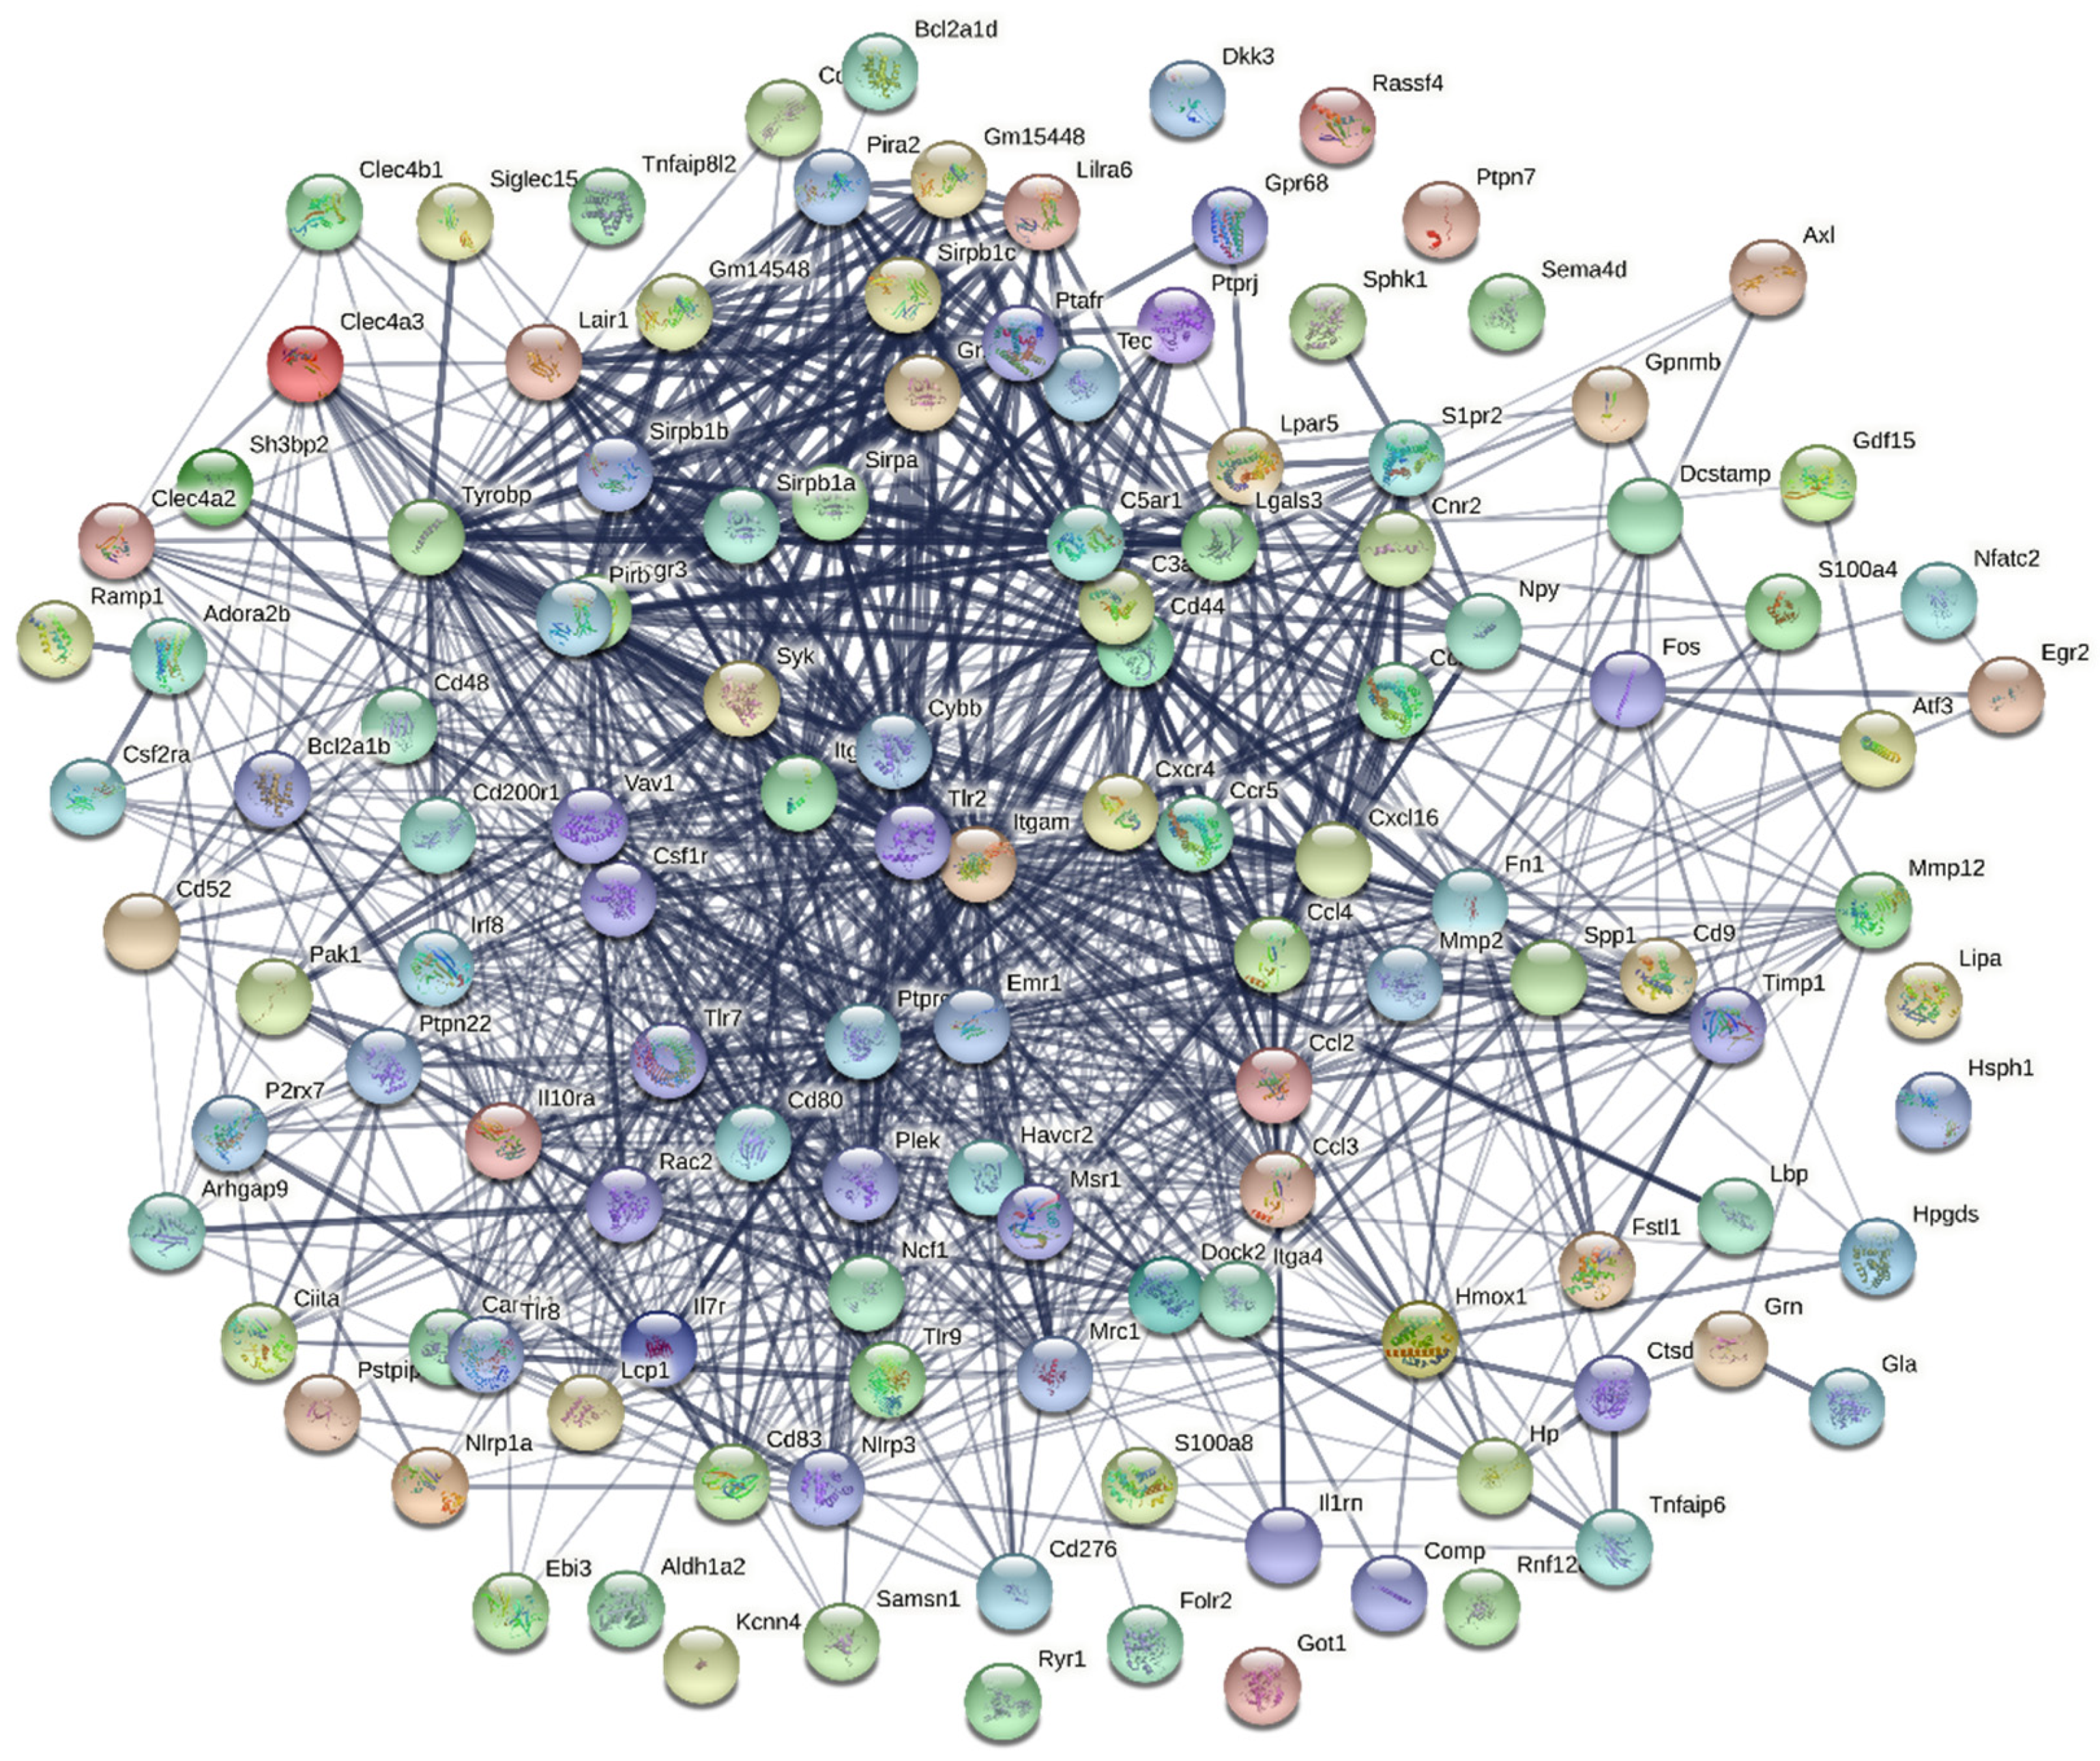
In protein–protein interaction analysis a total of 1065 connections (edges) were found between all 125 nodes (Figure 6) with an average degree of node 17 and PPI enrichment p-value < 1.0 × 10⁻¹⁶. The KEGG pathway enrichment analysis calculated a total of 53 pathway matches in Mus musculus (Figure 6 and Table S6). Most of the pathways were associated with immune-related functions as expected. Surprisingly, however, 3 pathways, i.e., transcriptional misregulation in cancer (mmu05202), pathways in cancer (mmu05200) and proteoglycans in cancer (mmu05205), were associated with cancer (Table S7). A total of 16 genes (Bcl2a1b, Bcl2a1d, Cd44, Csf1r, Csf2ra, Cxcr4, Fn1, Fos, Hmox1, Il7r, Itgam, Lpar5, Mmp2, Pak1, Rac2 and Tlr2) among 125 immune-suppressor genes were found to be associated with these cancer-related pathways (Table S7).

4. Discussion

P. grandiflorus has great potential for medicinal use in various diseases due to different pharmacological properties. Immune enhancement is one of the major outcomes of PGE treatment, which is considered to be one of the important factors behind the positive conclusion in different cancers and other diseases such as cough, phlegm and tuberculosis [1]. The immune-enhancement mechanism of PGE is encouraging the researchers to elucidate the PGE and/or its major constituents (platycodin D, etc.) as a possible treatment in many chronic diseases [1]. As immune enhancement is a complex process, its mechanism is currently attributed to the combined effect of several genes and different pathways. Different studies have reported immune enhancement in both innate and adaptive immune responses through increased activity of immune-system cells and molecules [5,6,7]; no study has been carried out to study immune enhancement through whole transcriptome analysis in PGE-treated organisms, which can elucidate the molecular mechanism and genes behind the immune enhancement.
Hence, to study the role of PGE on the whole transcriptome for immune enhancement, we analyzed the PGE-treated RNA-Seq datasets from PGE-treated mice in two comparisons. In comparison-II, the mice fed on PGE and HFD were compared with mice fed on HFD as well as normal diet. Having both normal and high-fat diet mice in PNTG group in comparison-II made this comparison more challenging, but it was necessary to minimize the effect of HFD in PGE-treated mice. The possibility of interaction between the HFD and PGE treatment cannot be ruled out, but unavailability of transcriptome data from normal PGE-treated organisms limits the current study. Thus, this preliminary study must be further extended according to availability of datasets in the future. The animal study with normal diet and PGE treatment can be used to generate whole transcriptome datasets that would be most appropriate for the immune-enhancement study. Furthermore, we included all of the nine samples in comparison-II, which increased the statistical significance of this study. High alignment rate was achieved in the alignment of reads with the reference genome (>98% overall alignment rate) in all nine samples, which signposted the good quality of samples used in the study (Table 1). The state-of-art RNA-seq analysis tools such as HISAT2, StringTie, iDEP9.1, DESeq2 and EdgeR were used [21,23] for different assembly and expressions analysis (Figure 1). Almost all (127 out of 130) up- and (853 out of 859) down-regulated genes in comparison-II were common with up- and down-regulated genes in comparison-I, which suggest the common pattern in both comparisons (Table D1 and Table D2). Siglec-15 was one of most down-regulated genes in both comparisons and was recently discovered as the therapeutic target in normalization cancer immunotherapy [34]. Down-regulation of Siglec-15 may be the main reason behind both immune enhancement and anticancer activity of PE. In a very recent landmark study, down-regulation of this immune-suppressor gene was found to suppress antigen-specific T cell responses in both in vitro and in vivo conditions [34]. Blockage of Siglec-15 through specific monoclonal antibodies reversed the suppression of T cells, enhanced tumor immunity and inhibited the growth of tumors in multiple established tumor models [34]. Down-regulation of Siglec-15 protein molecules can also be responsible for immune-enhancement activity of other plant extracts or compounds of unknown mechanism. Further research is highly required to study this candidate gene/protein.
All DEGs were used for the functional enrichment analysis through prediction of five important biological categories to predict genes important in immunity-related functions. In comparison-I, 150 DEGs were enriched in immune-system processes in the biological function category (Table S1a) which can be candidate genes in the immune-modulation effect of PGE. Similarly, 82 DEGs were enriched in defense/immunity protein (PC00090) in the protein-class category (Table S4b). In pathway enrichment analysis 70, 26, 21, 18, 12, 4 DEGs were found to be from inflammation mediated by the chemokine-and-cytokine signaling pathway (P00031), B cell activation (P00010), T cell activation (P00053), the interleukin signaling pathway (P00036), the toll receptor signaling pathway (P00054), and the interferon-gamma signaling pathway (P00035), respectively (Table S5b). All of these enriched immune-system-related pathways directly modulate the immune function and response [35,36]. Similarly, in comparison-II the functional enrichment 51 DEGs were enriched in immune-system processes in the biological-function category (Table S1b). In addition, 29 DEGs were enriched in defense/immunity protein (PC00090) in the protein-class category (Table S4b). In pathway-enrichment analysis 33, 13, 9, 5, 4, 2 DEGs were found to be from inflammation mediated by the chemokine-and-cytokine signaling pathway (P00031), B cell activation (P00010), T cell activation (P00053), toll-receptor signaling pathway (P00054), interleukin-signaling pathway (P00036) and interferon-gamma signaling pathway (P00035), respectively (Table S5b). Molecular function of these candidate DEGs can be studied in future studies, which may unveil their precise role in immune enhancement [35,36].
To further explore the role of DEGs in context to immune modulation, two gene sets, i.e., gene set-1 and set-2 were created and used in set analysis. Gene set-1 was composed of immunity genes present in IMGT/GENE-DB [29] that are involved in immune function, and gene set-2 comprised genes that suppress the immune function [30]. In set analysis, it was found that no genes were down-regulated from gene set-1 in both the comparisons. However, 61 and 8 genes were found to be up-regulated in comparison-I and comparison-II, respectively, which was consistent with the immune-enhancement properties PGE observed in different studies [5,6]. These genes were mostly composed of immunoglobulin genes that directly act as receptors in immune response [29]. These immunoglobulins were also found to be up-regulated in earlier studies carried out to study immune enhancement in PGE treatments [5,6,7]. Similarly, when gene set-2 was used in set analysis, a high number of immune suppressive genes were found to be down-regulated compared to up-regulated genes in both the comparisons (Figure 4 and Figure 5). The mechanism that down-regulates immune-suppressive genes is expected to increase immunity-related function and immune enhancement [30]. Therefore, a higher number of down-regulated immune-suppressive genes again justifies the immune-enhancing effect of PGE treatment [30]. All (125) down-regulated immune-suppressive genes in comparison I were also found to be down-regulated in comparison II. Expression of immunosuppressive genes can be used to study immune modulation in future high-throughput studies as the current finding is in line with the immune-enhancement effect of PGE. Furthermore, the protein–protein interaction (PPI) analysis was carried out in addition to the function enrichment and pathway analysis for common down-regulated immune-suppressor genes. The protein–protein interaction network of these common down-regulated immune-suppressor genes resulted in a highly connected network compared to random possible connections (Figure 6), which suggests that there must be some pattern in expression of genes in our study that may be attributed to the PGE treatment and immune-suppressive nature of the genes. Furthermore, KEGG enrichment analysis through the STRING PPI server revealed that three cancer-related pathways were associated with 16 immune-suppressive genes (Table S7) [32,33]. Most of these genes such as Cd44, Csf1r, Cxcr4, Fn1, Il7r, Lpar5, Mmp2, Pak1, Rac2, and Tlr2 were found to be studied in cancer and their expressions were associated with cancer progression and metastasis as expected, and these genes were proposed as the target in cancer [37,38,39,40,41,42,43,44,45,46]. Therefore, these immune-suppressor genes are proposed as the important candidates for further study in cancer application along with Siglec-15 (Table S7). Although our current study is based on only available RNA-Seq datasets from the eWAT of mice [18], there is a possibility of extending our study to further detailed research on other tissues or cells through deep sequencing and/or single cell sequencing to consider precise transcriptomic changes occurring in immune cells such as B-cell, T-cell or other immunity-related cells [47]. However, the preliminary nature of the current study further requires the validation of proposed genes in functional assays, which may include inhibition and/or overexpression studies. The current research has provided the strong basis of the immune-enhancement effect of PGE in terms of down-regulation of immune-suppressive and up-regulation of immune-enhancing genes that warrants the further research on Siglec-15 and other 16 immunosuppressive genes involved in cancer.

5. Conclusions

Comparative analysis of the whole transcriptome of PGE-treated mice was carried out successfully with the help of available transcriptomic resources. Up-regulation of immunity-related genes/proteins such as immunoglobulins, was in line with earlier reported immune-enhancement effects of PGE and justified our current study. Down-regulation of immune-suppression genes was identified as one of the major mechanisms in immune enhancement in PGE treatment. One of the most down-regulated genes (Siglec-15) was an immunosuppressive gene that was recently discovered as a therapeutic candidate in cancer. The results of the current study can have limitations from the possible interaction of HFD and PGE treatment, so further in vitro and in vivo studies are also required to generate the appropriate transcriptome datasets and further validation. Our finding can be considered an active pathway of mechanisms important for both immune enhancement and anticancer application of PGE.

Supplementary Materials

The following are available online at https://www.mdpi.com/2076-3417/11/1/226/s1, Table S1: title. Table S1a: Results of DEGs in panther enrichment analysis for biological function in comparison-I, Table S2a: Results of DEGs in panther enrichment analysis for molecular function in comparison-I, Table S3a: Results of DEGs in panther enrichment analysis for cellular components in comparison-I, Table S4a: Results of DEGs in panther enrichment analysis for protein class in comparison-I, Table S5a: Results of DEGs in panther enrichment analysis for pathways in comparison-I, Table S1b: Results of DEGs in panther enrichment analysis for biological function in comparison-II, Table S2b: Results of DEGs in panther enrichment analysis for molecular function in comparison-II, Table S3b: Results of DEGs in panther enrichment analysis for cellular components in comparison-II, Table S4b: Results of DEGs in panther enrichment analysis for protein class in comparison-II, Table S5b: Results of DEGs in panther enrichment analysis for pathways in comparison-II, Table S6: Network stats of protein-protein interaction network from STRING, Table S7: KEGG enrichment analysis of 126 immunosuppressive genes in STIRNG server, Table D1: Results of differential expression in comparison-I, Table D2: Results of differential expression in comparison-II.

Author Contributions

Conceptualization, V.J. and H.-J.L.; methodology, V.J.; software, V.J.; validation, V.J.; formal analysis, V.J.; investigation, V.J. and H.-J.L.; resources, V.J.; data curation, V.J.; writing—original draft preparation, V.J.; writing—review and editing, H.-J.L. and Y.-I.C.; visualization, V.J.; supervision, H.-J.L.; project administration, H.-J.L.; funding acquisition, H.-J.L. All authors have read and agreed to the published version of the manuscript.

Funding

This research was supported by Cooperative Research Program for Agriculture Science and Technology Development Rural Development Administration, Republic of Korea, grant number PJ01381002 and partly supported by the Gachon University research fund of 2018, grant number GCU-2019-0389.

Conflicts of Interest

The authors declare no conflict of interest.

References

  1. Ji, M.; Agula, B.; Yang, M.; Xu, J.; Jiang, L.-L.; Zhou, B.-C.; Li, M. The Pharmacological Effects and Health Benefits of Platycodon grandiflorus—A Medicine Food Homology Species. Foods 2020, 9, 142. [Google Scholar] [CrossRef] [Green Version]
  2. Lee, J.-Y.; Hwang, W.-I.; Lim, S.-T. Antioxidant and anticancer activities of organic extracts from Platycodon grandiflorum A. De Candolle roots. J. Ethnopharmacol. 2004, 93, 409–415. [Google Scholar] [CrossRef] [PubMed]
  3. Zhang, Z.; Zhao, M.; Zheng, W.; Liu, Y. Platycodin D, a triterpenoid saponin from Platycodon grandiflorum, suppresses the growth and invasion of human oral squamous cell carcinoma cells via the NF-κB pathway. J. Biochem. Mol. Toxicol. 2017, 31, e21934. [Google Scholar] [CrossRef] [PubMed]
  4. Lee, K.J.; Kim, J.Y.; Choi, J.H.; Kim, H.G.; Chung, Y.C.; Roh, S.H.; Jeong, H.G. Inhibition of tumor invasion and metastasis by aqueous extract of the radix of Platycodon grandiflorum. Food Chem. Toxicol. 2006, 44, 1890–1896. [Google Scholar] [CrossRef] [PubMed]
  5. Park, E.-J.; Lee, H.-J. Immunomodulatory effects of fermented Platycodon grandiflorum extract through NF-κB signaling in RAW 264.7 cells. Nutrition Res. Prac. 2020, 14, 453–462. [Google Scholar] [CrossRef] [PubMed]
  6. Park, E.-J.; Lee, Y.-S.; Kim, S.M.; Jung, A.J.; Yoo, J.-H.; Lee, S.-H.; Jeong, H.C.; Lee, H.-J. Immune-Enhancing Effects of Red Platycodon grandiflorus Root Extract via p38 MAPK-Mediated NF-κB Activation. Appl. Sci. 2020, 10, 5457. [Google Scholar] [CrossRef]
  7. Zhao, X.; Wang, Y.; Yan, P.; Cheng, G.; Wang, C.; Geng, N.; Wang, X.; Liu, J. Effects of Polysaccharides from Platycodon grandiflorum on Immunity-Enhancing Activity In Vitro. Molecules 2017, 22, 1918. [Google Scholar] [CrossRef] [Green Version]
  8. Zheng, P.; Fan, W.; Wang, S.; Hao, P.; Wang, Y.; Wan, H.; Hao, Z.; Liu, J.; Zhao, X. Characterization of polysaccharides extracted from Platycodon grandiflorus (Jacq.) A.DC. affecting activation of chicken peritoneal macrophages. Int. J. Biol. Macromol. 2017, 96, 775–785. [Google Scholar] [CrossRef]
  9. Noh, E.-M.; Kim, J.-M.; Lee, H.Y.; Song, H.-K.; Joung, S.O.; Yang, H.J.; Kim, M.J.; Kim, K.S.; Lee, Y.-R. Immuno-enhancement effects of Platycodon grandiflorum extracts in splenocytes and a cyclophosphamide-induced immunosuppressed rat model. BMC Complement. Altern. Med. 2019, 19, 1–12. [Google Scholar] [CrossRef] [Green Version]
  10. Hamzić, E.; Kjaerup, R.B.; Mach, N.; Minozzi, G.; Strozzi, F.; Gualdi, V.; Williams, J.L.; Chen, J.; Wattrang, E.; Buitenhuis, B.; et al. RNA sequencing-based analysis of the spleen transcriptome following infectious bronchitis virus infection of chickens selected for different mannose-binding lectin serum concentrations. BMC Genom. 2016, 17, 1–13. [Google Scholar] [CrossRef]
  11. Sudhagar, A.; Kumar, G.; El-Matbouli, M. Transcriptome Analysis Based on RNA-Seq in Understanding Pathogenic Mechanisms of Diseases and the Immune System of Fish: A Comprehensive Review. Int. J. Mol. Sci. 2018, 19, 245. [Google Scholar] [CrossRef] [PubMed] [Green Version]
  12. Guleria, V.; Jaiswal, V. Comparative transcriptome analysis of different stages of Plasmodium falciparum to explore vaccine and drug candidates. Genomics 2020, 112, 796–804. [Google Scholar] [CrossRef] [PubMed]
  13. Lopez, B.I.; Santiago, K.G.; Lee, D.; Ha, S.; Seo, K. RNA Sequencing (RNA-Seq) Based Transcriptome Analysis in Immune Response of Holstein Cattle to Killed Vaccine against Bovine Viral Diarrhea Virus Type, I. Animals 2020, 10, 344. [Google Scholar] [CrossRef] [PubMed] [Green Version]
  14. Kumar, P.; Jaiswal, V.; Pal, T.; Singh, J.; Chauhan, R.S. Comparative whole-transcriptome analysis in Podophyllum species identifies key transcription factors contributing to biosynthesis of podophyllotoxin in P. hexandrum. Protoplasma 2016, 254, 217–228. [Google Scholar] [CrossRef]
  15. Chawla, A.; Stobdan, T.; Srivastava, R.B.; Jaiswal, V.; Chauhan, R.S.; Kant, A. Sex-Biased Temporal Gene Expression in Male and Female Floral Buds of Seabuckthorn (Hippophae rhamnoides). PLoS ONE 2015, 10, e0124890. [Google Scholar] [CrossRef] [Green Version]
  16. Sood, A.; Jaiswal, V.; Chanumolu, S.K.; Malhotra, N.; Pal, T.; Chauhan, R.S. Mining whole genomes and transcriptomes of Jatropha (Jatropha curcas) and Castor bean (Ricinus communis) for NBS-LRR genes and defense response associated transcription factors. Mol. Biol. Rep. 2014, 41, 7683–7695. [Google Scholar] [CrossRef]
  17. Qi, Y.; Bin Liu, Y.; Rong, W.-H. RNA-Seq and its applications: A new technology for transcriptomics. Hereditas 2011, 33, 1191–1202. [Google Scholar] [CrossRef]
  18. Kim, Y.J.; Ryu, R.; Choi, J.-Y.; Choi, M.S. Platycodon grandiflorus Root Ethanol Extract Induces Lipid Excretion, Lipolysis, and Thermogenesis in Diet-Induced Obese Mice. J. Med. Food 2019, 22, 1100–1109. [Google Scholar] [CrossRef]
  19. Sherry, S.; Xiao, C.; Durbrow, K.; Kimelman, M.; Rodarmer, K.; Shumway, M.; Yaschenko, E. Ncbi sra toolkit technology for next generation sequence data. In Proceedings of the Plant and Animal Genome XX Conference, San Diego, CA, USA, 14–18 January 2012. [Google Scholar]
  20. Chen, S.; Huang, T.; Zhou, Y.; Han, Y.; Xu, M.; Gu, J. AfterQC: Automatic filtering, trimming, error removing and quality control for fastq data. BMC Bioinform. 2017, 18, 91–100. [Google Scholar] [CrossRef] [Green Version]
  21. Kim, D.; Paggi, J.M.; Park, C.; Bennett, C.; Salzberg, S.L. Graph-based genome alignment and genotyping with HISAT2 and HISAT-genotype. Nat. Biotechnol. 2019, 37, 907–915. [Google Scholar] [CrossRef]
  22. Li, H.; Handsaker, B.; Wysoker, A.; Fennell, T.; Ruan, J.; Homer, N.; Marth, G.; Abecasis, G.; Durbin, R.; 1000 Genome Project Data Processing Subgroup. The Sequence Alignment/Map format and SAMtools. Bioinformatics 2009, 25, 2078–2079. [Google Scholar] [CrossRef] [PubMed] [Green Version]
  23. Pertea, M.; Kim, D.; Pertea, G.M.; Leek, J.T.; Salzberg, S.L. Transcript-level expression analysis of RNA-seq experiments with HISAT, StringTie and Ballgown. Nat. Protoc. 2016, 11, 1650–1667. [Google Scholar] [CrossRef] [PubMed]
  24. Ge, S.X.; Son, E.W.; Yao, R. iDEP: An integrated web application for differential expression and pathway analysis of RNA-Seq data. BMC Bioinform. 2018, 19, 534. [Google Scholar] [CrossRef] [PubMed] [Green Version]
  25. Love, M.I.; Huber, W.; Anders, S. Moderated estimation of fold change and dispersion for RNA-seq data with DESeq2. Genome Biol. 2014, 15, 550. [Google Scholar] [CrossRef] [Green Version]
  26. Robinson, M.D.; McCarthy, D.J.; Smyth, G.K. edgeR: A Bioconductor package for differential expression analysis of digital gene expression data. Bioinformation 2009, 26, 139–140. [Google Scholar] [CrossRef] [Green Version]
  27. Thomas, P.D.; Muruganujan, A.; Ebert, D.; Huang, X.; Thomas, P.D. PANTHER version 14: More genomes, a new PANTHER GO-slim and improvements in enrichment analysis tools. Nucleic Acids Res. 2019, 47, D419–D426. [Google Scholar] [CrossRef]
  28. Raudvere, U.; Kolberg, L.; Kuzmin, I.; Arak, T.; Adler, P.; Peterson, H.; Vilo, J. g:Profiler: A web server for functional enrichment analysis and conversions of gene lists (2019 update). Nucleic Acids Res. 2019, 47, W191–W198. [Google Scholar] [CrossRef] [Green Version]
  29. Giudicelli, V.; Chaume, D.; Lefranc, M.-P. IMGT/GENE-DB: A comprehensive database for human and mouse immunoglobulin and T cell receptor genes. Nucleic Acids Res. 2004, 33, D256–D261. [Google Scholar] [CrossRef]
  30. Liu, Y.; He, M.; Wang, D.; Diao, L.; Liu, J.; Tang, L.; Guo, S.; He, F.; Li, D. HisgAtlas 1.0: A human immunosuppression gene database. Database 2017, 2017. [Google Scholar] [CrossRef]
  31. Heberle, H.; Meirelles, G.V.; Da Silva, F.R.; Telles, G.P.; Minghim, R. InteractiVenn: A web-based tool for the analysis of sets through Venn diagrams. BMC Bioinform. 2015, 16, 1–7. [Google Scholar] [CrossRef]
  32. Szklarczyk, D.; Gable, A.L.; Lyon, D.; Junge, A.; Wyder, S.; Huerta-Cepas, J.; Simonovic, M.; Doncheva, N.T.; Morris, J.H.; Bork, P.; et al. STRING v11: Protein–protein association networks with increased coverage, supporting functional discovery in genome-wide experimental datasets. Nucleic Acids Res. 2019, 47, D607–D613. [Google Scholar] [CrossRef] [PubMed] [Green Version]
  33. Kanehisa, M.; Furumichi, M.; Tanabe, M.; Sato, Y.; Morishima, K. KEGG: New perspectives on genomes, pathways, diseases and drugs. Nucleic Acids Res. 2017, 45, D353–D361. [Google Scholar] [CrossRef] [PubMed] [Green Version]
  34. Wang, J.; Sun, J.; Liu, L.N.; Flies, D.B.; Nie, X.; Toki, M.; Zhang, J.; Song, C.; Zarr, M.; Zhou, X.; et al. Siglec-15 as an immune suppressor and potential target for normalization cancer immunotherapy. Nat. Med. 2019, 25, 656–666. [Google Scholar] [CrossRef] [PubMed]
  35. Kumar, H.; Kawai, T.; Akira, S. Toll-like receptors and innate immunity. Biochem. Biophys. Res. Commun. 2009, 388, 621–625. [Google Scholar] [CrossRef] [PubMed]
  36. Bhat, M.Y.; Solanki, H.S.; Advani, J.; Khan, A.A.; Prasad, T.S.K.; Gowda, H.; Thiyagarajan, S.; Chatterjee, A. Comprehensive network map of interferon gamma signaling. J. Cell Commun. Signal. 2018, 12, 745–751. [Google Scholar] [CrossRef] [PubMed]
  37. Naor, D.; Nedvetzki, S.; Golan, I.; Melnik, L.; Faitelson, Y. CD44 in Cancer. Crit. Rev. Clin. Lab. Sci. 2008, 39, 527–579. [Google Scholar] [CrossRef] [PubMed]
  38. Murga-Zamalloa, C.; Rolland, D.C.; Polk, A.; Wolfe, A.; Dewar, H.; Chowdhury, P.; Önder, Ö.; Dewar, R.; Brown, N.A.; Bailey, N.G.; et al. Colony-Stimulating Factor 1 Receptor (CSF1R) Activates AKT/mTOR Signaling and Promotes T-Cell Lymphoma Viability. Clin. Cancer Res. 2019, 26, 690–703. [Google Scholar] [CrossRef] [Green Version]
  39. Chatterjee, S.; Azad, B.B.; Nimmagadda, S. The Intricate Role of CXCR4 in Cancer. In Advances in Cancer Research; Elsevier: Heidelberg, Germany, 2014; Volume 124, pp. 31–82. [Google Scholar]
  40. Sun, Y.; Zhao, C.; Ye, Y.; Wang, Z.; He, Y.; Li, Y.; Mao, H. High expression of fibronectin 1 indicates poor prognosis in gastric cancer. Oncol. Lett. 2019, 19, 93–102. [Google Scholar] [CrossRef] [Green Version]
  41. Kim, M.J.; Choi, S.K.; Hong, S.H.; Eun, J.W.; Nam, S.W.; Han, J.-W.; You, J.S. Oncogenic IL7R is downregulated by histone deacetylase inhibitor in esophageal squamous cell carcinoma via modulation of acetylated FOXO1. Int. J. Oncol. 2018, 53, 395–403. [Google Scholar] [CrossRef] [Green Version]
  42. Wu, C.-Y.; Zheng, C.; Xia, E.-J.; Quan, R.-D.; Hu, J.; Zheng, C.; Hao, R.-T. Lysophosphatidic Acid Receptor 5 (LPAR5) Plays a Significance Role in Papillary Thyroid Cancer via Phosphatidylinositol 3-Kinase/Akt/Mammalian Target of Rapamycin (mTOR) Pathway. Med. Sci. Monit. 2020, 26, e919820-1. [Google Scholar] [CrossRef]
  43. Juuti, A.; Lundin, J.; Nordling, S.; Louhimo, J.; Haglund, C. Epithelial MMP-2 Expression Correlates with Worse Prognosis in Pancreatic Cancer. Oncology 2006, 71, 61–68. [Google Scholar] [CrossRef] [PubMed]
  44. Chen, M.-J.; Wu, D.-W.; Wang, Y.-C.; Chen, C.-Y.; Lee, H. PAK1 confers chemoresistance and poor outcome in non-small cell lung cancer via β-catenin-mediated stemness. Sci. Rep. 2016, 6, 34933. [Google Scholar] [CrossRef] [PubMed]
  45. Liu, Y.; Cheng, G.; Song, Z.; Xu, T.; Ruan, H.; Cao, Q.; Wang, K.; Bao, L.; Liu, J.; Zhou, L.; et al. RAC2 acts as a prognostic biomarker and promotes the progression of clear cell renal cell carcinoma. Int. J. Oncol. 2019, 55, 645–656. [Google Scholar] [CrossRef] [PubMed] [Green Version]
  46. Urban-Wojciuk, Z.; Khan, M.M.; Oyler, B.L.; Fåhraeus, R.; Marek-Trzonkowska, N.; Nita-Lazar, A.; Hupp, T.; Goodlett, D.R. The Role of TLRs in Anti-cancer Immunity and Tumor Rejection. Front. Immunol. 2019, 10, 2388. [Google Scholar] [CrossRef] [PubMed]
  47. Papalexi, E.; Satija, R. Single-cell RNA sequencing to explore immune cell heterogeneity. Nat. Rev. Immunol. 2018, 18, 35–45. [Google Scholar] [CrossRef] [PubMed]
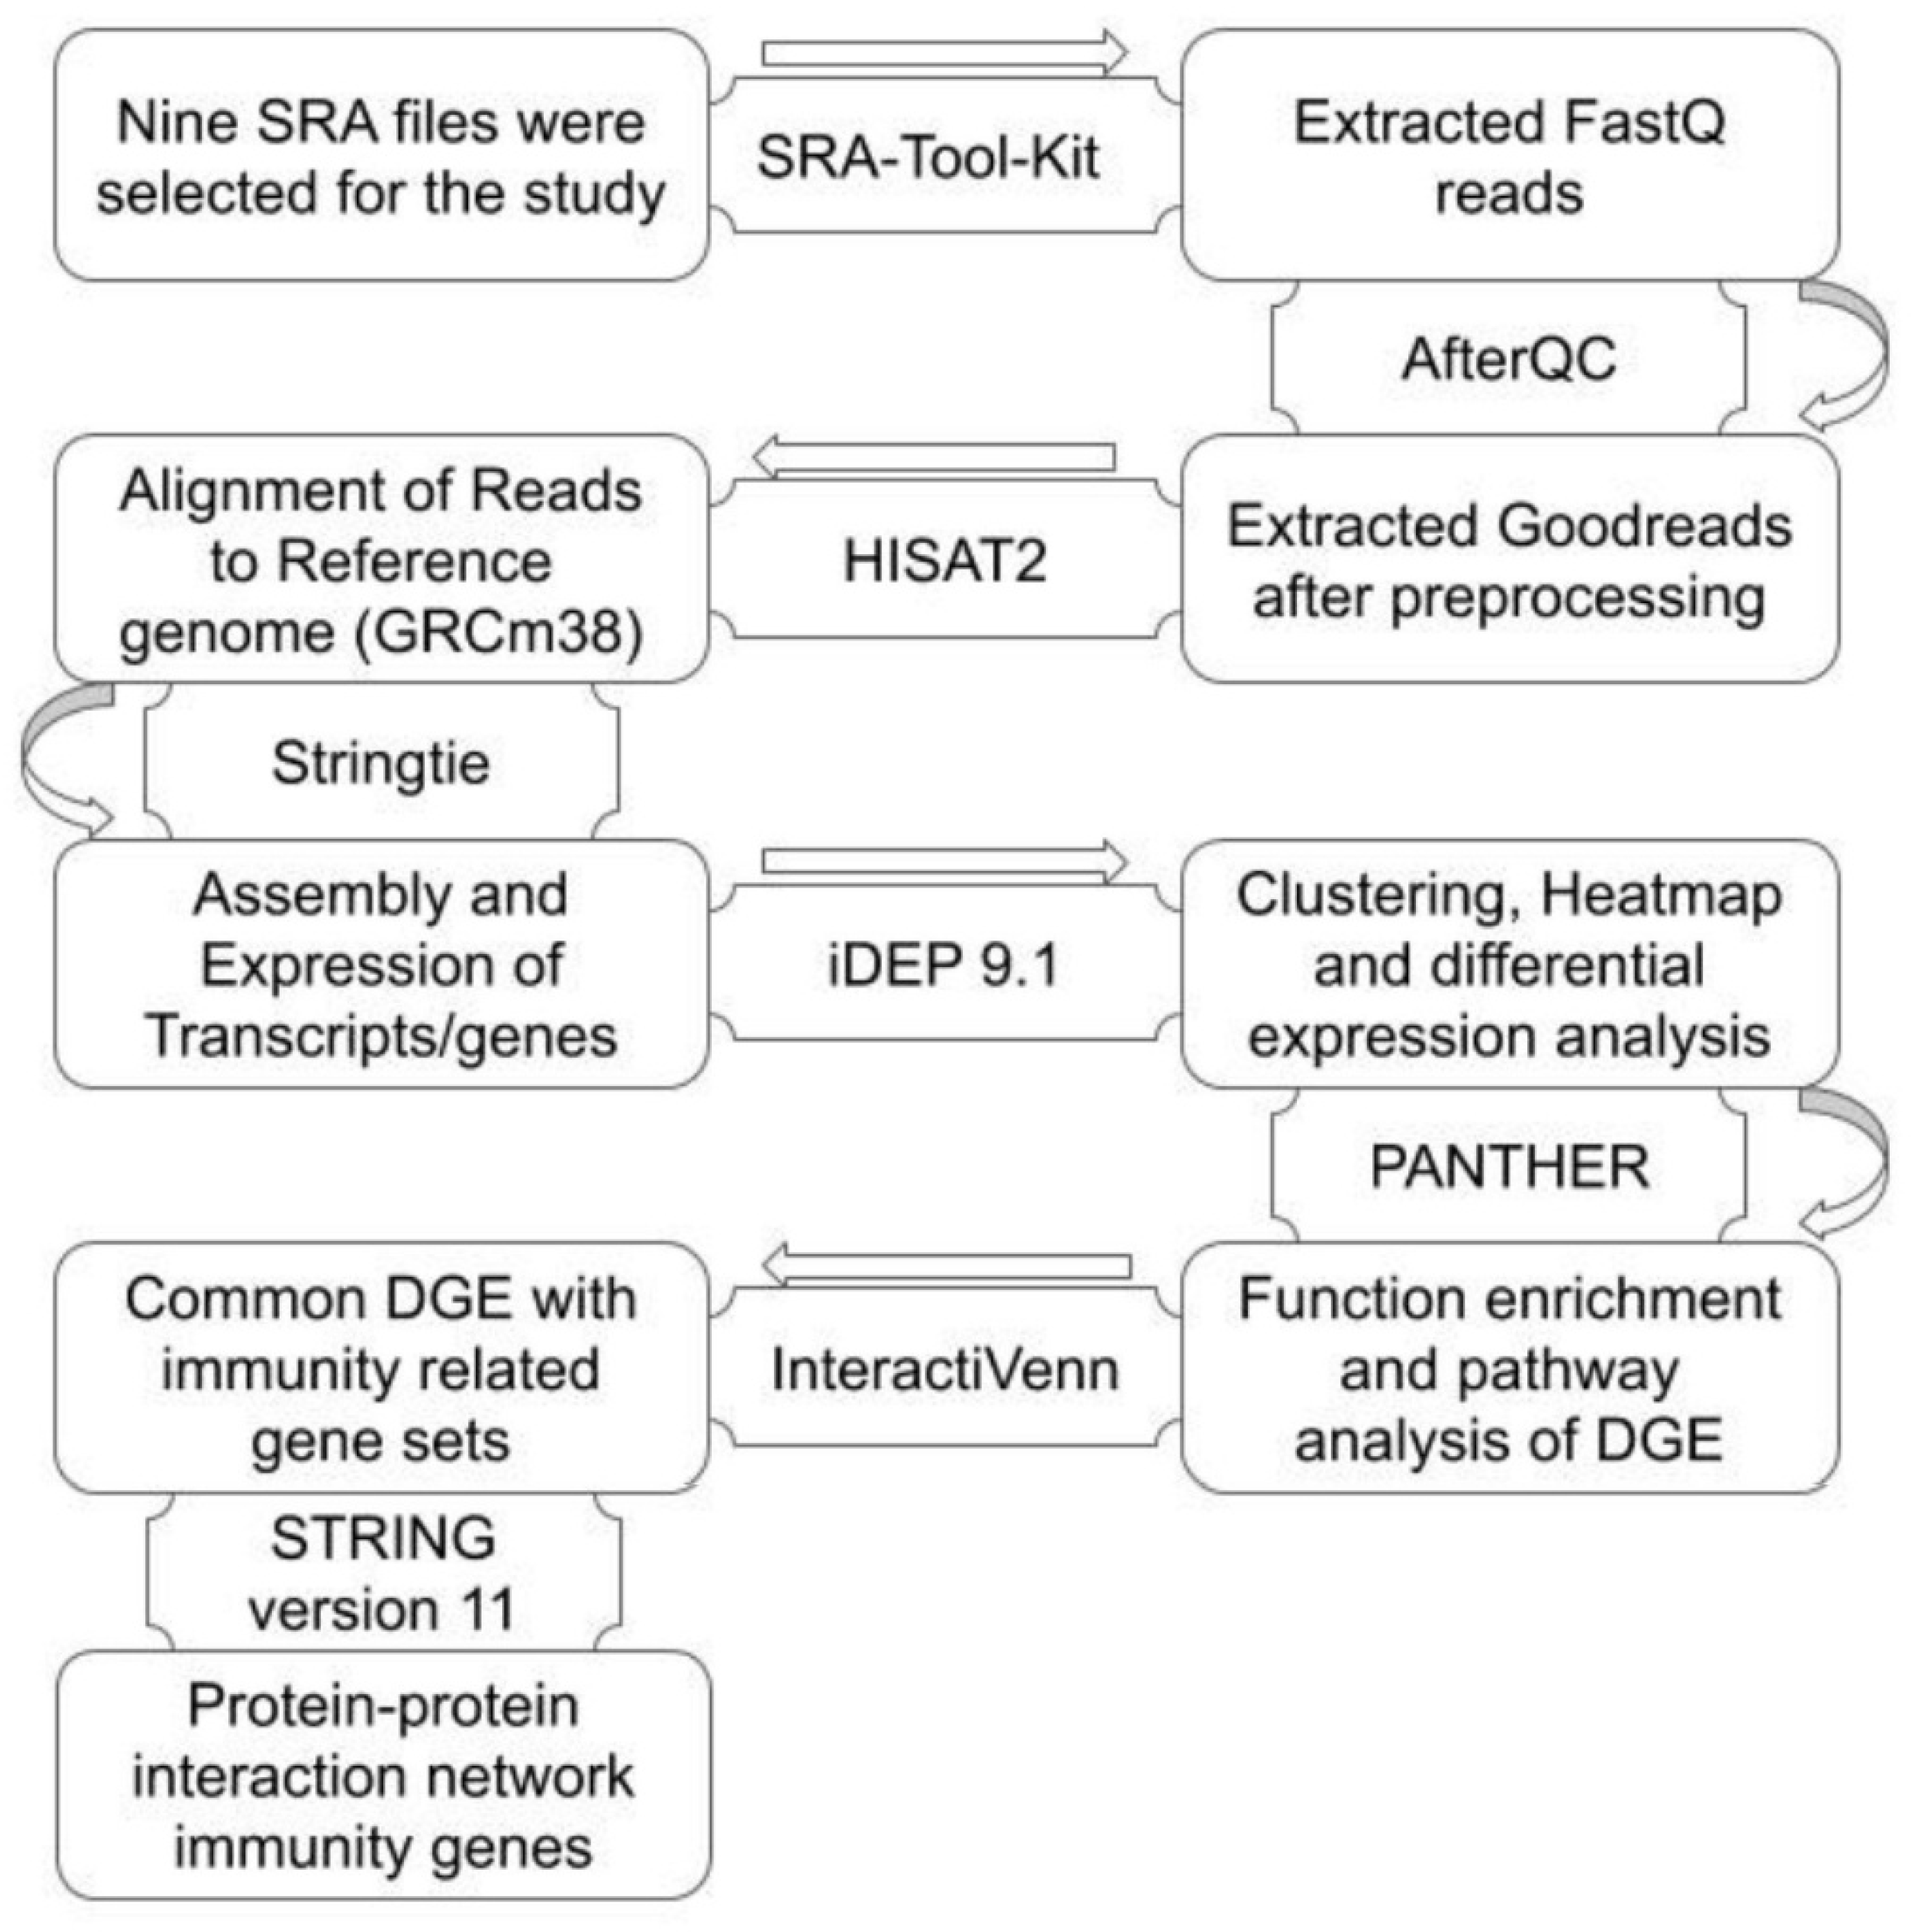
Figure 1. Flowchart of the methodology.
Applsci 11 00226 g001
Figure 2. Heatmap and plots of differentially expressed genes in comparison-I (A) Heatmap build with top 1000 differentially expressed genes, (B) volcano plots with differentially expressed genes (DEGs), (C) MA plot with DEGs and (D) scattered plots with DEGs).
Applsci 11 00226 g002
Figure 3. Heatmap and plots of differentially expressed genes in comparison-II (A) heatmap build with top 1000 differentially expressed genes, (B) volcano plots with DEGs, (C) MA plot with DEGs and (D) scattered plots with DEGs.
Applsci 11 00226 g003
Figure 4. Venn diagram between DEGs of comparison-I with gene set-2 (immune suppressor) and gene set-1 immunity related genes.
Applsci 11 00226 g004
Figure 5. Venn diagram between DEGs of comparison-II with gene set-2 (immune suppressor) and gene set-1 immunity related genes.
Applsci 11 00226 g005
Figure 6. Protein–protein interaction network between 126 down-regulated immune-suppressor genes.
Applsci 11 00226 g006
Table 1. Preprocessing and alignment results of all nine samples.
Sr. No.SRA IDsGood Reads %Alignment Rate
1SRR858133198.79%98.10%
2SRR858133299.70%98.63%
3SRR858133399.60%98.54%
4SRR858133499.71%98.46%
5SRR858133599.68%98.39%
6SRR858133699.59%98.53%
7SRR858133799.71%98.45%
8SRR858133899.71%98.45%
9SRR858133999.66%98.56%
10Average all sample99.57%98.45%
Publisher’s Note: MDPI stays neutral with regard to jurisdictional claims in published maps and institutional affiliations.