Abstract
Elastomeric bearings are commonly used in base-isolation systems to protect the structures from earthquake damages. Their design is usually developed by using nonlinear models where only the effects of shear and compressive loads are considered, but uncertainties still remain about consequences of the tensile loads produced by severe earthquakes like the near-fault ones. The present work aims to highlight the relapses of tension on the response of bearings and superstructure. To this end, three-, seven- and ten-storey r.c. framed buildings are designed in line with the current Italian seismic code, with a base-isolation system constituted of High-Damping-Rubber Bearings (HDRBs) designed for three values of the ratio between the vertical and horizontal stiffnesses. Experimental and analytical results available in literature are used to propose a unified nonlinear model of the HDRBs, including cavitation and post-cavitation of the elastomer. Nonlinear incremental dynamic analyses of the test structures are carried out using a homemade computer code, where other models of HDRBs considering only some nonlinear phenomena are implemented. Near-fault earthquakes with comparable horizontal and vertical components, prevailing horizontal component and prevailing vertical component are considered as seismic input. Numerical results highlight that a precautionary estimation of response parameters of the HDRBs is attained referring to the proposed model, while its effects on the nonlinear response of the superstructure are less conservative.
1. Introduction
Seismic isolation techniques are an effective tool for protecting different structures, such as buildings, bridges and nuclear power plants, from potential earthquake damages [1,2]. This aim is usually achieved by introducing, at the base of the superstructure, bearings which combine great damping capacity, low horizontal stiffness and high vertical stiffness. The low horizontal (shear) stiffness of the bearings enables the superstructure to absorb the dynamic displacements due to ground motions and high winds, quasi-static movements due to thermal effects and other phenomena, while the marked vertical (axial) stiffness of the bearings enables these devices to support the weight of the superstructure. Moreover, the superstructure exhibits a fixed-base or base-isolated response along the vertical direction depending on the value of the ratio between vertical stiffness and horizontal stiffness of the bearings. In the case of high damping rubber bearings (HDRBs), composed of rubber layers interspersed with steel shims, the total thickness of rubber provides the low horizontal stiffness required to shift the fundamental vibration period of the base-isolated structure away from both fixed-base period of the superstructure and predominant period of the ground motion while the close spacing of the intermediate shim plates ensures (compared to the horizontal) a notable vertical stiffness required to withstand the vertical loads. The design of the elastomeric bearings and the nonlinear analysis of the base-isolated structures are usually based on prescriptions and limitations with regards to acceptable limit states provided by technical codes and guidelines [3,4,5,6] where the possible modellings of the bearings are often presented. Most of these only consider compressive and shear stresses and describe the behavior of the bearings by referring to one or more springs with constant stiffness. However, large vertical loads and lateral displacements produced by strong EQs can be responsible for substantial reductions in the horizontal and vertical stiffnesses of the elastomeric bearings and of their load-carrying capacity.
1.1. State of the Art
The influence of a considerable axial load on the horizontal stiffness of bearings has been investigated in [7,8,9,10,11] while a nonlinear extension of the two-spring model proposed for the bearings in [12], consisting of one shear spring and one rotational spring, is found in [13] to take into account the variation of the horizontal and vertical stiffnesses with the axial load and the lateral deformation, respectively. The influence of severe displacement on the vertical stiffness of bearings has been investigated in [14], where experimental tests on different types of bearings have been used to validate four models, two empirical, proposed by the same authors, and two physical, presented in [8]. Further effects on the critical load and horizontal stiffness of bearings, from increasing horizontal displacement and axial load, have been studied in [15] where a nonlinear model predicting an unstable postcritical reaction has been developed by including large displacements and rotations in the linear model by Koh-Kelly, originally based on small displacements and rotations. Lately, an analytical model has been also introduced in [16] to describe the coupled horizontal-vertical behaviour of the elastomeric bearings when the vertical stiffness decreases and the vertical deformation increases beyond the point of stability. In this model, geometric effects like axial shortening are distinct from the vertical deformation of the isolator when the relationships between horizontal and vertical deformations are defined by using experimental results corresponding to quasi-static and dynamic loadings. Another important issue concerns the evaluation of the stability limit of the base-isolation system. This problem has been tackled in [17,18,19] where the evaluation of the critical load of an elastomeric bearing, the definition of a relationship between the vertical stiffness and the overlapping area of an elastomeric bearing and the validation of this expression have been studied, respectively. The stability limit of the base-isolation system can also be influenced by the end rotation of the bearings which can occur in configurations without bottom girders. To simulate this effect, a model has been introduced in [20] which includes a series of axial springs at the top, mid-height, and bottom of the bearing to vertically reproduce asymmetric bending moment distribution in the bearings. The simplified or refined models, usually adopted to describe the behavior of the elastomeric bearings, work well so long as these devices do not undergo large tensions. These stresses, which often occur in high-rise buildings under severe near-fault EQs, can produce the onset of voids inside the rubber after exceeding the theoretical yielding point, as described in [21,22,23] and the buckling of the bearings at a load close to that for buckling in compression, as shown in [24,25]. Other consequences are the reduction of both tensile stiffness and compressive stiffness in the high damping rubber bearings and the reduction in the damping effect in the lead rubber bearings under tension or low compression, mentioned in [26], which suggest that the energy dissipation target could not be reached in structures base-isolated by these devices. Moreover, the survey of the effects produced by EQs worldwide in Asia (i.e., Chi-Chi, Taiwan 1999) and South America (i.e., Chile, 2010) have shown that the bearings can undergo local tensile stress even when they exhibit a shear and compressive global response [27,28]. The numerical study [29] into the response of bearings subjected to variable axial loads and the development of tensile stresses has instead allowed researchers to define the range of variation in the stiffness and damping ratio and the local tensile stresses corresponding to notable cyclic shear displacements and variable axial load. Currently, few codes and standards, like the Eurocode 8 [30] and the Chinese seismic design code [31], consider the response in axial tension of the bearings. These codes exclude the possibility of a tensile loading or limit the value of the allowable tensile stress in elastomeric bearing under design loading. To take the consequences of tension into account appropriately, the design of base-isolated buildings and bearings requires the use of a reliable mathematical model for the elastomeric bearings and the knowledge of their tensile properties, both presented in [32]. The tensile force able to produce cavitation inside the rubber is defined according to the study [22] while the instantaneous post-cavitation stiffness is evaluated by decreasing the post-cavitation stiffness exponentially, proposed in [33]. In the same work [32] strength degradation under cyclic loading has also been considered. To this end, the initial cavitation strength was updated by applying a damage index to take into account the reduction in strength reduced when the bearing is loaded beyond the point of cavitation and then unloaded. As for the buckling in compression, the reduced critical load has been quantified by the model suggested in [18] which uses a bilinear approximation of the area-reduction method and considers the finite buckling capacity of a bearing at zero overlap. The coupling of horizontal and vertical behavior was finally considered by introducing the variation of shear stiffness with axial load and of axial stiffness with lateral displacement. These have been incorporated in the model described in [32] by using the vertical and horizontal stiffnesses resulting from the two-spring model presented in [8].
1.2. Aims and Contents
The summary presented in the above subsection has shown that the behavior of the elastomeric bearings is influenced by numerous factors that often interact in a complex way. Although the influence of lateral displacement and axial loads have been well described, only few scientific works are currently available regarding the influence of the tension on the response of base-isolated structures. Moreover, no significant efforts were made to combine the results of the aforementioned research works in a single model and to evaluate its influence on the nonlinear response of base-isolated structures. In the present work a unified modelling of the high damping rubber bearings (HDRBs), able to take into account for the effects of tension loads together with other important nonlinear phenomena which affect these devices, is introduced. It exploits the findings of well-established theoretical studies, numerical simulations, and experimental tests available in the scientific literature. The most promising results presented in different works are used by the authors to correct and improve the classical linear modelling of the HDRBs so that it also includes the influences of different nonlinear phenomena. To this end, the constant stiffnesses of the viscoelastic linear model, usually adopted to predict the seismic response of base-isolated buildings, are modified by applying four additional parameters. Specifically, the horizontal linear stiffness at shear zero strain is corrected, multiplying its original expression with two parameters, resulting from the research works presented in [13,15]. The latter leads to a nonlinear expression of the horizontal stiffness which includes the effects of both axial-load and lateral displacements. In a similar way, the rotational stiffness at shear zero strain is corrected, multiplying its original linear expression as proposed in [15], while the nonlinear expression of the vertical stiffness at shear zero strain is obtained modifying the original stiffness at shear zero strain as suggested in [32]. This work accounts for effects of lateral displacement, cyclic vertical and horizontal loading and cavitation and post-cavitation phenomena. Reliability and accuracy of the proposed model are investigated by a series of numerical simulations in which the response of both the superstructure and base-isolation system are compared with that obtained by a simplified viscoelastic model and less sophisticated nonlinear models. In particular, nonlinear incremental dynamic analyses of three office buildings with three-, seven- and ten-storeys, all designed in compliance with the NTC18 Italian seismic code, are carried out by using a finite element computer code, developed by the authors. In this specially designed software, the nonlinear response of the superstructure is modeled by the lumped plasticity model proposed in [34,35] while the nonlinear behavior of the HDRBs is simulated by the aforementioned models. As for the seismic input, three near-fault earthquakes (EQs) are selected from the PEER database [36,37], one with prevailing horizontal component, characterized by long-duration horizontal velocity pulses, one with prevailing vertical component, characterized by high values of the ratio between peak values of the vertical and horizontal ground accelerations, and one with comparable horizontal and vertical components. To quantify the influence of the tension loads on the seismic response of the test structures, maximum ductility demands of r.c. frame members and total shear deformations, critical and cavitation loads of the HDRBs are evaluated comparing results obtained considering the proposed numerical model and other models of the HDRBs. These comparisons allow to define the situations where the use of the unified model is recommended to design both superstructure and isolators in a conservative way. A detailed presentation of the model developed by the authors to describe the nonlinear response of the HDRBs is shown in Section 2. In Section 3 layout and design of the test structure is presented, enclosing a summary of the most important features of the elastomeric bearings used in the base-isolation systems. Section 4 presents the numerical results resulting from the nonlinear dynamic analysis of the test structures carried out by the homemade computer code of the authors. Finally, a summary of the main conclusions is shown in Section 5.
2. Nonlinear Modelling of the High Damping Rubber Bearings
The elastomeric bearing can experiment different phenomena influencing the seismic response of the base-isolated buildings: (1) nonlinear decrease of the nominal horizontal and vertical stiffnesses due to the increase of axial load and lateral displacement, respectively; (2) decrease of the vertical stiffness due to axial shortening or lengthening which result from second order geometric effects; (3) change of the horizontal stiffness corresponding to the reduction of the critical buckling load which occur when the lateral deformation increases; (4) decrease of the vertical stiffness due to the onset of voids and microcracks inside the rubber (i.e., cavitation phenomenon).
This work presents a model which provides a simultaneous description of all the phenomena is explained. The model, henceforth named CM2CR (Coupled Model 2 with Cavitation and Rotation), uses two (horizontal and vertical) axial elastic springs, one rotational elastic spring, and two (horizontal and vertical) dashpots with viscous damping coefficients (Figure 1) with the following stiffness and damping factors:
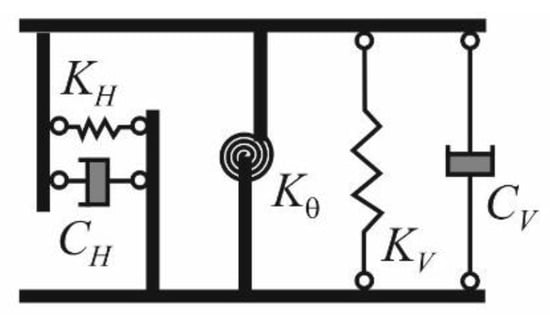
Figure 1.
Three spring—two dashpot model for HDRBs.
and being the fundamental vibration period and the equivalent viscous damping ratio in the horizontal (vertical) direction. The first three analytical expressions are obtained by modifying the original stiffnesses at shear zero strain (i.e., , ) and zero rotation (i.e., )
using the additional parameters by [13], and by [15] and [32]
In the above expressions represents the total thickness of the elastomeric layers, is the thickness of the elastomeric layer with diameter area , moment of inertia and total height To take into account that the critical load buckling enclosed in the Equation (9) slacks off when lateral deformation increases, this load must be replaced by a reduced load obtained by one of the following formulas proposed in [14]
where
being the angle corresponding to the superposition area between the top and bottom plates of the bearing and the reduced effective area whose value changes according to the ratio between the design horizontal displacement and the diameter of the bearing presented in [1,37,38]. In the above formulas, the primary and secondary shape factors are defined as and , respectively. Following the aforementioned approach, forces and corresponding to the horizontal and vertical springs and to the dashpots and moment corresponding to the rotational spring are obtained by the formulas
Here ( are horizontal (vertical) displacement and velocity, is the vertical displacement of the elastomeric bearing at the onset of cavitation inside the rubber and represents the modified vertical displacement corresponding to second order geometric effects. In the same formulas describes the post-cavitation variation of the tensile stiffness depending on the rubber mixture and construction quality of the HDRB, and denote shear and volumetric compressibility modulus of the rubber, is the compression modulus defined by
while the modulus is equal to
To include in the CM2CR model the damage (i.e., microcracks) affecting the rubber when loading and unloading take place many times beyond the cavitation threshold, the original expression of the cavitation load
must be replaced by the formula proposed in [32]
where represents the bonder rubber area before cavitation.
In this work the performances of the above CM2CR model are compared with those provided by three more simple HDRB models, denoted by the acronyms VEL (ViscoELastic Model), CM1 (Coupled Model 1) and CM1C (Coupled Model 1 with Cavitation). The first one simulates the behavior of the HDRBs through viscoelastic linear laws proposed by the Italian technical regulations [6] as an alternative to complex hysteretic laws. It uses the expression of the horizontal and vertical stiffness at zero shear strain and the expression of the rotational stiffness at zero rotation presented in [15,34]. The two remaining models change the stiffnesses adopted in the VEL model by additional parameters to take into account for the phenomena summarized in the first part of this section. In particular, the CM1 model uses the same damping factors and rotational stiffness as the VEL model while correcting the remaining stiffnesses by two additional parameters and The latter can take into account the nonlinear decrease of the nominal horizontal and vertical stiffnesses due to the increase in axial load and lateral displacement [7,13], the decrease in vertical stiffness due to axial shortening or lengthening resulting from second geometric effects [13,34], the change of horizontal stiffness corresponding to the reduction of the critical buckling load which occurs when the lateral deformation increases [19,32]. The additional parameter is obtained from the formula
where the nominal stiffness ratio and the geometric ratio are defined as follows
As for the CM1C model, it assumes damping factors and rotational stiffness of the VEL model and the horizontal stiffness of the CM1 model while it corrects the vertical stiffness by means of the additional parameter to consider the decrease of the vertical stiffness due to the onset of voids and microcracks inside the rubber (i.e., cavitation phenomenon) [22,32]. Table 1 provides a comparison of the stiffnesses of the different models obtained after updating the stiffnesses at zero shear strain and at zero rotation of the VEL model by the above-mentioned additional parameters.

Table 1.
Stiffnesses parameters of the elastomeric bearing in the different models.
3. Layout and Design of the Test Structures
The seismic response of r.c. framed buildings can be notably influenced by the nonlinear behavior of the bearings used in the base-isolation system. These devices must retain their ability to function also when subjected to nonlinear effects including those due to the tensile axial loads resulting from the combined action of vertical and seismic loads (i.e., cavitation, post-cavitation and buckling). To identify and study the consequences of such phenomena and estimate their importance in comparison with other nonlinear effects, three office buildings with three-(B3), seven-(B7) and ten-storeys (B10) are considered below. Their r.c. framed structures include masonry infill walls located along the perimeter, regularly distributed in elevation. In particular, the frames along X direction have two lateral bays of 4 m and two central bays of 5 m, those along Y direction contain two bays of 5 m (Figure 2a) while the first floor and upper floors are of 4 m and 3 m in height, respectively (Figure 2b). The superstructures of the above buildings are designed in line with the Italian seismic code NTC18 [6]. To this end, a live load equal to 2 kN/m2 for all the floors and a gravity load equal to 4.98 kN/m2, 6.28 kN/m2 and 6.68 kN/m2 for the top, intermediate and base-isolated floors, respectively, are considered; an average weight of about 2.7 kN/m2 for the masonry infill walls located along the exterior perimeter is also assumed. Seismic loads are evaluated on the basis of the masses summarized in Table 2 and assuming: elastic response of the superstructure (behaviour qH = 1.0); medium-dense subsoil (type class C); high-risk seismic zone, with peak ground acceleration in the horizontal direction PGAH = 0.201 g, at the life-safety (LS) limit state, and PGAH = 0.264 g, at the collapse prevention (CP) limit state. Moreover, a yield strength of 375 MPa for the steel and a cylindrical compressive strength of 25 MPa for the concrete are assumed to design both the beams and columns of the test structures, whose geometric dimensions are summarized in Table 3, Table 4 and Table 5. The base-isolation system of the test structures is made up of fifteen (i.e., nb = 15) identical high-damping-rubber-bearings (HDRBs). The first step in their design consists of evaluating the horizontal and vertical stiffnesses (KH0, KV0) of the single elastomeric device considering the same fundamental vibration period in the horizontal direction (i.e., T1H = 2.5 s) and selecting a nominal stiffness ratio αK 0= KH0/KV0 (i.e., 400, 1200, 2400). To this end the following formulas can be used
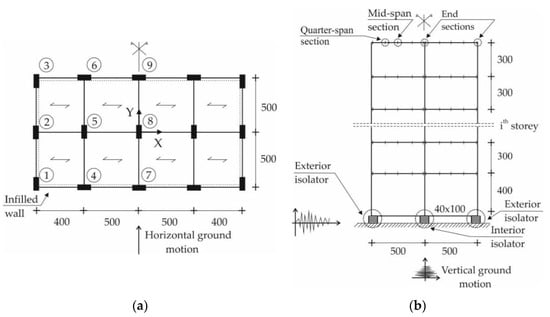
Figure 2.
Three-, seven- and ten-storey structures—(a) plan; (b) elevation (dimensions in cm).
Table 2.
Floor masses of the B3, B7 and B10 test structures (dimensions in kNs2/m).
Table 3.
Cross sections of beams and columns of the B3 structure (dimensions in cm).
Table 4.
Cross sections of beams and columns of the B7 structure (dimensions in cm).
Table 5.
Cross sections of beams and columns of the B10 structure (dimensions in cm).
The damping coefficients (CH0, CV0) of the single HDRB are then obtained assuming different equivalent viscous damping ratios in the horizontal (ξH = 10%) and vertical (ξV = 5%) direction by
Next, the effective geometric dimensions of the HDRB, like diameter D, total thickness te of the elastomeric layers and thickness ti of the single elastomeric layers, are evaluated by an iterative procedure including: a design displacement Sd = 27.8 cm, at the collapse prevention (CP) limit state of the Italian seismic code [6]; a shear modulus G = 0.035 kN/cm2; a volumetric compression modulus Eb = 200 kN/cm2. This procedure is repeated until the effective horizontal and vertical stiffnesses (KH, KV) match the initial stiffnesses (KH0, KV0), and the ultimate limit state verifications regarding the maximum shear strains are fulfilled
Here γtot, γs, γc and γα represent the total shear strain of the elastomer and its shear strains due to the seismic displacement, axial compression, and angular rotation, respectively. In particular, the thickness of the single elastomeric layer (ti), the total thickness (te) of the elastomeric layers and the diameter D of the bearing can be obtained by using the expressions
Two further verifications are added to complete the design of the bearings. The first obviates buckling phenomena by satisfying the following condition
In this expression P is the maximum axial load on the single HDRB while Pcr is its critical load
with reduced area Ar. The second verification ensures prevention of rollout phenomena checking that
where t1 (t2) is the thickness of the contiguous rubber layer contiguous to the upper (lower) steel plates each having thickness ts while is the yield strength. Main properties of the base-isolation systems are presented in Table 5, Table 6 and Table 7 for the B3, B7, and B10 test structures.
Table 6.
Properties of HDRBs for the B7 test structure (dimensions in kN, cm and s).
Table 7.
Properties of HDRBs for the B10 test structure (dimensions in kN, cm and s).
4. Numerical Results
Although traditional linear models of HDRBs (e.g., VEL model) are usually considered sufficient to predict the seismic response of base-isolated buildings, more complex models can become necessary in particular circumstances. Indeed, various developments can crop up, such as coupling of horizontal and vertical motions, change of critical buckling load due to large horizontal displacement, tension buckling, cavitation, and post-cavitation phenomena affecting the rubber layers in tension and strength degradation in cyclic tensile loading. Advanced nonlinear models of shear and axial laws of HDRBs, like the CM1, CM1C and CM2CR models mentioned in Section 2, take into account these phenomena, providing more accurate expressions of their horizontal and vertical stiffnesses. Herein particular attention is paid to the study of the CM2CR model used to include the consequences of tension buckling and cavitation and post-cavitation phenomena. To assess the reliability of this model when the seismic response of base-isolated buildings subjected to strong EQs is simulated, the incremental dynamic analysis (IDA) of the test structures described in Section 3 is carried out with reference to different values of the nominal stiffness ratio, comparing results provided by linear (i.e., VEL) and nonlinear (i.e., CM1, CM1C, CM2CR) models. For this purpose, a homemade computer code based on a lumped plasticity approach [34,35] has been developed, using a bending moment-axial load interaction domain for the columns and adopting a bilinear moment-curvature law with a hardening ratio of 5% for the sections of all frame members where inelastic deformations occur. Moreover, each beam is discretized in four elements of equal length and each column in a single element, since the inelastic deformations can appear at the end, quarter-span and mid-span sections, or at the end sections, respectively. An equivalent viscous damping equal to 2% is used for the superstructure following the Rayleigh approach, with reference to the fundamental vibration modes in the horizontal (Y) and vertical (Z) directions. As for the seismic input considered in the IDAs, three near-fault EQs are selected from the PEER database [36,37] ensuring that each one has long-duration horizontal velocity pulses and agrees with main design hypotheses (i.e., high-risk seismic region and medium subsoil class). Table 8 lists names and dates of the EQs, the recording station, magnitude (Mw), epicentral distance (Δ), horizontal (PGAH), and vertical (PGAV) peak ground accelerations of the selected near-fault ground motions whose horizontal and vertical response spectra are shown in Figure 3a,b, respectively.
Table 8.
Main features of the selected near-fault EQs (PEER database) [37].
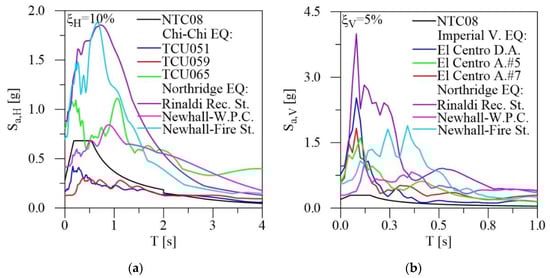
Figure 3.
Horizontal (a) and vertical (b) acceleration spectra.
After some preliminary results presented in [38], the accuracy of the CM2CR model is tested by examining the seismic response of superstructures and isolators of the test buildings. As first step, the ductility demands of beams and columns provided by the CM2CR model are compared with those obtained by less sophisticated HDRBs models (i.e., VEL, CM1, CM1C). To this end, the results are plotted as a function of the submultiple of the peak ground acceleration of the selected EQ (i.e., ), for each test structure, storey, nominal stiffness ratio and HDRB model. More specifically, three different values of the nominal stiffness ratio (i.e., 400, 1200, 2400) and three different near-fault EQs, one with prevailing horizontal component (i.e., Chi-Chi EQ), one with prevailing vertical component (i.e., Imperial Valley EQ), and one with comparable horizontal and vertical components (i.e., Northridge EQ), are considered in the IDA of three—(i.e., B3), seven—(i.e., B7) and ten—(i.e., B10) storey buildings. For the sake of brevity, ductility demands of the B3 structure corresponding to nominal stiffness ratio = 1200 are plotted in Figure 4 with reference to the Imperial Valley EQ. These figures show that the different HDRB models provide overlapping results until the coefficient attains a specific value, different for each storey. Once exceeded such threshold, the different models continue to provide similar results except for the first storey (Figure 4a–c) where the ductility demands corresponding to the CM2CR model are lower than those provided by the other models, with a percentage reduction compared to the VEL model reaching −110.9% and −156.4% at the end sections and mid-span sections of the beams, respectively, when the maximum value of the acceleration ratio (i.e., α = 0.71) is attained (Figure 4a,b). Moreover, the highest ductility demands in the mid-span section of beams are recorded at the third storey (Figure 4h), where a significant contribution of the vertical component of the selected earthquake is expected. In order to better understand the response of the superstructure, main parameters of the base-isolation systems are shown in Figure 5a–c with reference to the most stressed isolator (see isolator n.9 in Figure 2a): i.e., the maximum shear strain of the elastomer due to seismic displacements (), the maximum total shear strain ( and the ratio () between the maximum and critical axial loads. As can be observed, the base-isolation system presents a behavior opposite to that of the superstructure, with the CM2CR model highlighting the most conservative results, contrary to the other models which correspond to the lower-bound values of (i.e., an increase of about +25% with reference to the VEL model in Figure 5a) and (i.e., an increase of about +32% with reference to the VEL model in Figure 5b) and (i.e., an increase of about +52.8% with reference to the VEL model in Figure 5c).
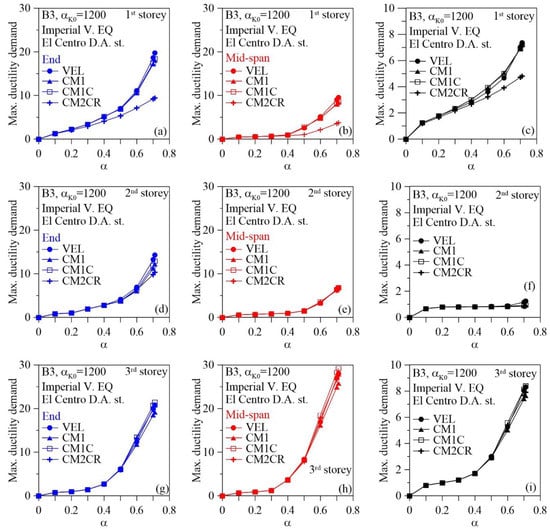
Figure 4.
Ductility demands of the B3 structure subjected to the Imperial Valley EQ: end sections (a,d,g) and mid-span sections (b,e,h) of beams; end sections (c,f,i) of columns.
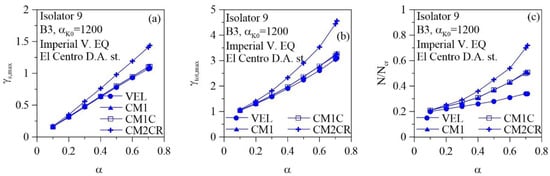
Figure 5.
Response parameters of the base-isolation system for the B3 test structure subjected to the Imperial Valley EQ. (a–c) main parameters of the base-isolation systems.
Graphs similar to the previous ones are plotted in Figure 6, referring to the B7 structure (. subjected to the Imperial Valley EQ. Specifically, ductility demands at the first level confirm that CM2CR model is the least conservative among those examined (Figure 6a–c), with percentage reduction of about −95.7% and −165.5%, similar to those observed for the B3 structure. Effects of the vertical component of the Imperial Valley EQ, characterized by high values of spectral acceleration in the range of vibration periods of interest for the selected structure (see Figure 3b and T1V values in Table 6) are more evident at the mid-span sections at the seventh floor (Figure 6e), where bending moments due to the vertical seismic loads are more important than those due to the horizontal ones.
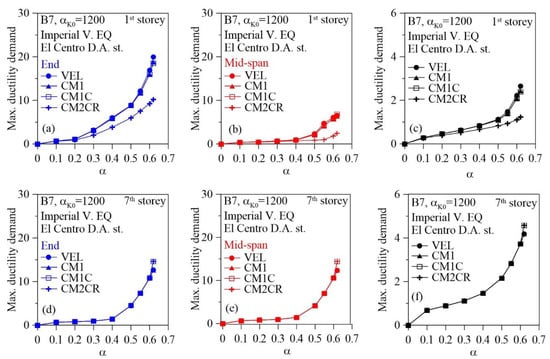
Figure 6.
Ductility demands of the B7 structure subjected to the Imperial Valley EQ: end sections (a,d) and mid-span sections (b,e) of beams; end sections (c,f) of columns.
More evident differences among the four HDRB models can be observed by examining the ductility demands of beams and columns provided by the IDAs of the B7 structure with nominal stiffness . As shown in Figure 7 for the Northridge EQ, after an initial overlapping of results the ductility demands take different values depending on the HDRB model used in the IDA. In particular, at the lower storeys the highest and lowest values of ductility demands are obtained by the VEL and CM2CR models, respectively, with a percentage reduction of about −223.2% and −528.3% at the end and mid-span section of the beams respectively, while at the top storey the different models provide very close values. To complete the comparison, the results provided the IDA of the B10 structure. Figure 8 shows the ductility demands of beams and columns obtained carrying out the IDA of the test structure with nominal stiffness ratio subjected to Chi-Chi EQ. These results prove that all the HDRB models lead to comparable values of the ductility demand for all the columns and for all the mid-span sections of the beams while differences between the CM2CR model and the other models concern the end sections of the beams. Specifically, ductility demands for beams under the Chi-Chi ground motion, characterized by high values of the corresponding pseudo-acceleration (see Figure 3a), are more evident, especially at the lower storeys (Figure 8a,d), while the addition of the vertical component of Chi-Chi ground motion is negligible at the upper storeys (Figure 8g,j). After having analyzed how the CM2CR model can influence the evaluation of the ductility demands of beams and columns, the influence of this numerical model on the predictions of the seismic response of the HDRBs is investigated in Figure 9.
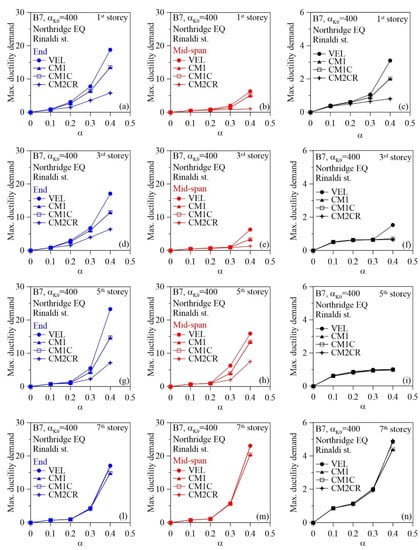
Figure 7.
Ductility demands of the B7 structure subjected to the Northridge EQ: end sections (a,d,g,l) and mid-span sections (b,e,h,m) of beams; end sections (c,f,i,n) of columns.
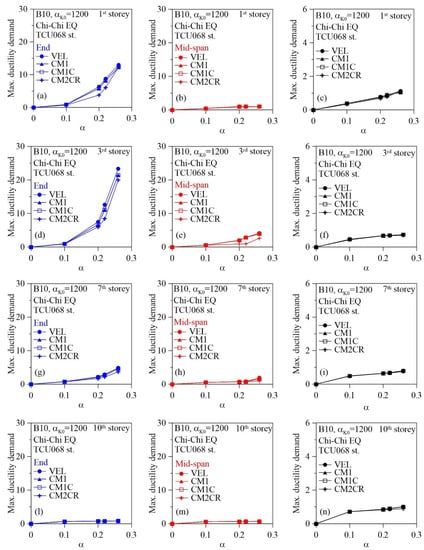
Figure 8.
Ductility demands of the B10 structure subjected to the Chi-Chi EQ: end sections (a,d,g,l) and mid-span sections (b,e,h,m) of beams; end sections (c,f,i,n) of columns.
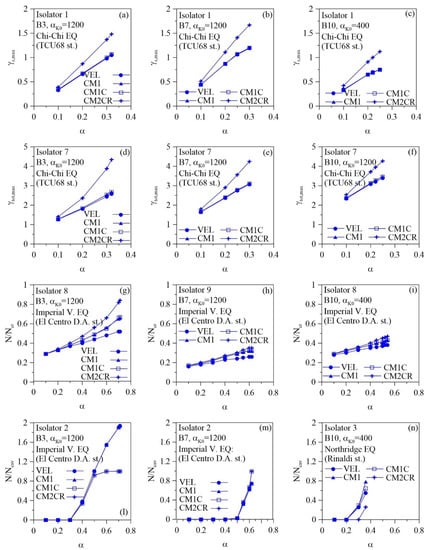
Figure 9.
Response parameters of the base-isolation system for the B3 (a,d,g,l), B7 (b,e,h,m) and B10 (c,f,i,n) test structures subjected to the Chi-Chi EQ.
For this purpose, the maximum shear strain of the elastomer due to seismic displacements (), the maximum total shear strain (, the ratio between the maximum axial load and the critical axial load and the ratio () between the maximum axial load and the cavitation load provided by the CM2CR model are compared with those provided by the other HDRB models. As with beams and columns, the above quantities are plotted as a function of the submultiple of the peak ground acceleration of the selected EQs, for each test structure, nominal stiffness ratio, isolator, and HDRB model. For the sake of brevity, only the results for the most stressed isolators are presented below, denoting each device by the reference number in Figure 2a. In particular, the plots of Figure 9 show the shear strain of the corner isolator 1 when the IDA of the test structures B3, B7, and B10 are carried out considering the nominal stiffness and the Chi-Chi EQ. These results prove that as the value of the submultiple α of the peak ground acceleration increases, the shear strains obtained by the CM2CR model and other models diverge progressively although their starting values, corresponding to , are close. Specifically, percentage variations of range from +29.1% for the B3 (Figure 9a) to +33% for the B10 (Figure 9c). The same remark can be made for the Imperial Valley EQ while for the Northridge EQ the different HDRB models lead to similar evaluations of the shear strains affecting the elastomeric bearings. A similar situation can be observed when comparing the total shear strains , as shown by Figure 9 where the plots corresponding to the perimetral isolator 7 and to the Chi-Chi EQ are presented. Specifically, percentage variations of , range from +40.7% for the B3 (Figure 9d) to +21.3% for the B10 (Figure 9f). Certain differences can be noted in the plots of Figure 9 where the ratio , provided by the IDAs for the Imperial Valley EQ, is presented for isolators 8 and 9. They highlight that the CM2CR and VEL models provide the highest and lowest values of the ratio all the test structures, with a percentage variation of about +38.1% and +19.2% for the B3 and B10 test structures respectively, while the CM1 and CM1C models lead to intermediate results. These differences are less evident for the Chi-Chi and Northridge EQs. Finally, the plots where the ratios provided by the different HDRB models are presented for the Imperial Valley and Northridge EQs. They show that substantial differences are obtained when using different nonlinear models for HDRBs, also depending on the nominal stiffness ratio of the isolation system. Further results omitted for the sake of brevity highlight similar behavior for the Chi-Chi and Northridge EQs.
5. Conclusions
The aim of the present work is to evaluate the main effects of tensile axial loads in the elastomeric bearings of the base-isolation system on the nonlinear seismic response of r.c. framed structures subjected to the horizontal and vertical components of near-fault earthquakes. To fill this gap, three base-isolated r.c. office buildings with three-, seven- and ten-storeys are designed in compliance with the Italian technical code NTC18, considering three values of the nominal stiffness ratio and assuming that all the buildings are located in a high-risk seismic zone. For each structure, incremental dynamic analysis is carried out with regard to three different near-fault EQs with prevailing horizontal component, prevailing vertical component, and comparable horizontal and vertical components, respectively. The following conclusions can be drawn from the results.
- Ductility demands for beams under near-fault ground motions with prevailing horizontal component (e.g., Chi-Chi EQ) are more evident, especially at the end section of the lower storeys, while comparable ductility demands along the building height can be obtained when also the vertical component is significant (e.g., Northridge EQ). On the other hand, the highest ductility demands in the mid-span section of beams are recorded at the upper storeys when significant contribution of the vertical component is added (e.g., Northridge and Imperial Valley EQs).
- For all the examined test structures and typologies of near-fault ground motions, the lowest values of ductility demand of the r.c. frame members are generally obtained considering the CM2CR model; moreover, the simplified VEL model of the HDRBs is generally the most conservative, producing upper-bound values of ductility demand, while overlapping results are provided by IDAs with the CM1 and CM1C models.
- Maximum values of the horizontal and total shear strains of the HDRBs are attained for near-fault ground motions characterized by prevailing horizontal component (e.g., Chi-Chi EQ), and precautionary estimation corresponds to the CM2CR model while lower and similar results are provided by the other models.
- Maximum values of the ratio between the compressive and critical axial load in the HDRBs are induced by earthquakes with significant vertical component acting alone (e.g., Imperial Valley EQ) or in combination (e.g., Northridge EQ) with a significant horizontal component. The CM2CR and VEL models define the upper and lower bounds of this parameter, respectively, while the CM1 and CM2C models provide intermediate values of the same quantity.
- Maximum values of the ratio between the tensile and cavitation axial loads in the HDRBs are influenced by the nominal stiffness ratio of the isolation system; the most conservative results under the Imperial Valley and Northridge EQs could be provided by nonlinear models with different level of complexity rather than the CM2CR model.
6. Take-Home Summary
A homemade computer code is implemented in order to represent the nonlinear behavior of the HDRBs when subjected to tensile loads (i.e., cavitation and post-cavitation of the elastomer) in the incremental dynamic analysis of base-isolated r.c. framed structures. A unified nonlinear model of the HDRBs is presented and compared with other models considering only some nonlinear effects. Near-fault earthquakes with pulse-type horizontal components and high values of the ratio between vertical and horizontal peak ground accelerations are considered for the numerical investigations.
Author Contributions
F.M. and M.M. developed the HDRB model to take into account for the effects of tension loads together with other important nonlinear phenomena and implemented it in a homemade computer code. F.M. and M.M. designed the test structures and carried out the numerical tests by using the aforementioned software. F.M. and M.M. wrote the manuscript and prepared all figures, tables, plots and list of references. All authors have read and agreed to the published version of the manuscript.
Funding
This research received no external funding.
Institutional Review Board Statement
This study did not require ethical approval.
Informed Consent Statement
Not applicable.
Data Availability Statement
The data presented in this study are available on request from the corresponding author.
Conflicts of Interest
The authors declare no conflict of interest.
References
- Naeim, F.; Kelly, J.M. Design of Seismic Isolated Structures: From Theory to Practice; John Wiley & Sons: New York, NY, USA, 1999. [Google Scholar]
- Christopoulos, C.; Filiatrault, A. Principles of Passive Supplemental Damping and Seismic Isolation; Iuss Press: Pavia, Italy, 2019. [Google Scholar]
- EN 1337-3. Structural Bearings—Part 3: Elastomeric Bearings; European Committee for Standardization: Brussels, Belgium, 2005. [Google Scholar]
- BS EN 15129. Anti-Seismic Devices; BSI British Standards: London, UK, 2010. [Google Scholar]
- Japan Road Association, JRA. Bearing Support Design for Highway Bridges; Japan Road Association: Tokyo, Japan, 2011. [Google Scholar]
- NTC18. Updating of Technical Regulations for the Constructions; D.M. 17-01-2018 and C.M. 21-01-2019; Italian Ministry of Infrastructures and Transports: Rome, Italy, 2018. [Google Scholar]
- Buckle, I.G.; Kelly, J.M. Properties of slender elastomeric isolation bearings during shake table studies of a large-scale model bridge deck. In Joint Sealing and Bearing Systems for Concrete Structures; American Concrete Institute: Detroit, MI, USA, 1986; Volume 94, pp. 247–270. [Google Scholar]
- Koh, C.G.; Kelly, J.M. Effects of Axial Load on Elastomeric Isolation Bearings; Rep. No. EERC/UBC 86/12; Earthquake Engineering Research Center, University of California: Berkeley, CA, USA, 1987. [Google Scholar]
- Kelly, J.M.; Buckle, I.G.; Koh, C.-G. Mechanical Characteristics of Base Isolation Bearings for a Bridge Deck Model Test; Rep. No. UCB/EERC-86/11; Earthquake Engineering Research Center, University of California: Berkeley, CA, USA, 1987. [Google Scholar]
- Griffith, M.C.; Kelly, J.M.; Coveney, V.A.; Koh, C.-G. Experimental Evaluation of Medium-Rise Structures Subject to Uplift; Rep. No. UCB/EERC-88/02; Earthquake Engineering Research Center, University of California: Berkeley, CA, USA, 1988. [Google Scholar]
- Aiken, I.D.; Kelly, J.M.; Tajirian, F.F. Mechanics of Low Shape Factor Elastomeric Seismic Isolation Bearings; Rep. No. UCB/EERC-89/13; Earthquake Engineering Research Center, University of California: Berkeley, CA, USA, 1989. [Google Scholar]
- Kelly, J.M. Earthquake-Resistant Design with Rubber; Spring: London, UK, 1997. [Google Scholar]
- Ryan, K.L.; Kelly, J.M.; Chopra, A.K. Nonlinear model for lead-rubber bearings including axial-load effects. J. Eng. Mech. 2005, 131, 1270–1278. [Google Scholar] [CrossRef]
- Warn, G.P.; Whittaker, A.S.; Constantinou, M.C. Vertical stiffness of elastomeric and lead-rubber seismic isolation bearings. J. Struct. Eng. 2007, 133, 1227–1236. [Google Scholar] [CrossRef]
- Nagarajaiah, S.; Ferrell, K. Stability of elastomeric seismic isolation bearings. J. Struct. Eng. 1999, 125, 946–954. [Google Scholar] [CrossRef]
- Vemuru, V.S.M.; Nagarajaiah, S.; Mosqueda, G. Coupled horizontal-vertical stability of bearings under dynamics loading. Earthq. Eng. Struct. Dyn. 2016, 45, 913–934. [Google Scholar] [CrossRef]
- Buckle, I.; Nagarajaiah, S.; Ferrell, K. Stability of elastomeric isolation bearings: Experimental study. J. Struct. Eng. 2002, 128, 3–11. [Google Scholar] [CrossRef]
- Warn, G.P. Whittaker, Vertical earthquake loads on seismic isolation systems in bridges. J. Struct. Eng. 2008, 34, 1696–1704. [Google Scholar] [CrossRef]
- Warn, G.P.; Weisman, J. Parametric finite element investigation of the critical load capacity of elastomeric strip bearings. J. Struct. Eng. 2007, 33, 3509–3515. [Google Scholar] [CrossRef]
- Ishii, K.; Kikuchi, M.; Nishimura, T.; Black, C.J. Coupling behavior of shear deformation and end rotation of elastomeric seismic isolation bearings. Earthq. Eng. Struct. Dyn. 2016, 4, 677–694. [Google Scholar] [CrossRef]
- Gent, A.N.; Lindley, P.B. Internal rupture of bonded rubber cylinders in tension. Proc. R. Soc. A Math. Phys. Eng. Sci. 1959, 249, 195–205. [Google Scholar] [CrossRef]
- Gent, A.N. Cavitation in rubber: A cautionary tale. Rubber Chem. Technol. 1990, 63, 49–53. [Google Scholar] [CrossRef]
- Dorfmann, A.; Burtscher, S.L. Aspects of cavitation damage in seismic bearings. J. Struct. Eng. 1990, 126, 573–579. [Google Scholar] [CrossRef]
- Imbimbo, M.; Kelly, J.M. Stability aspects of elastomeric isolators. Earthq. Spectra 1997, 13, 431–449. [Google Scholar] [CrossRef]
- Kelly, J.M.; Marsico, M.R. Tension buckling in rubber bearings affected by cavitation. Eng. Struct. 2013, 56, 656–663. [Google Scholar] [CrossRef]
- Mangerig, I.; Mano, T. Characteristics of various elastomeric bearings in tension. Steel Constr. 2009, 2, 161–166. [Google Scholar] [CrossRef]
- Lu, C.H.; Liu, K.Y.; Chang, K.C. Seismic performance of bridges with rubber bearings: Lessons learnt from the 1999 Chic-hi Taiwan Earthquake. J. Chin. Inst. Eng. 2011, 34, 889–904. [Google Scholar] [CrossRef]
- Kwon, O.S.; Jeong, S.H. Seismic displacement demands on skewed bridge decks supported on elastomeric bearings. J. Earthq. Eng. 2013, 17, 998–1022. [Google Scholar] [CrossRef]
- Kalfas, K.N.; Mitoulis, S.A.; Katakalos, K. Numerical study on the response of steel laminated elastomeric bearings subjected to variable axial loads and development of local tensile stresses. Eng. Struct. 2017, 134, 346–357. [Google Scholar] [CrossRef]
- European Committee for Standardisation. Eurocode 8: Design of Structures for Earthquake Resistance—Part 2: Bridges; EN-1998-2; Brussels, Belgium, 2005. [Google Scholar]
- Ministry of Construction of the People’s Republic of China. Code for Seismic Design of Buildings; China Architecture & Building Press: Beijing, China, 2010. [Google Scholar]
- Kumar, M.; Whittaker, A.S.; Constantinou, C. An advanced numerical model of elastomeric seismic isolation bearings. Earthq. Eng. Struct. Dyn. 2014, 43, 1955–1974. [Google Scholar] [CrossRef]
- Constantinou, M.C.; Whittaker, A.S.; Kalpakidis, Y.; Fenz, D.M.; Warn, G.P. Performance of Seismic Isolation Hardware under Service and Seismic Loading; Technical Report MCEER-07-0012; University at Buffalo, The State University of New York: Buffalo, NY, USA, 2007. [Google Scholar]
- Mazza, F.; Vulcano, A. Effects of near-fault ground motions on the nonlinear dynamic response of base-isolated r.c. framed buildings. Earthq. Eng. Struct. Dyn. 2012, 4, 211–232. [Google Scholar] [CrossRef]
- Mazza, F.; Mazza, M. Nonlinear analysis of spatial framed structures by a lumped plasticity model based on the Haar–Kàrmàn principle. Comput. Mech. 2010, 45, 647–664. [Google Scholar] [CrossRef]
- Ancheta, T.D.; Darragh, R.B.; Stewart, J.P.; Seyhanb, E.; Silva, W.J.; Chiou, B.; Wooddell, K.; Graves, R.; Kottke, A.R.; Boore, D.; et al. NGA-West2 database. Earthq. Spectra 2014, 30, 989–1005. [Google Scholar] [CrossRef]
- PEER Ground Motion Database, Pacific Earthquake Engineering Research Center, University of California, Berkeley, USA. Available online: https://ngawest2.berkeley.edu/ (accessed on 10 September 2020).
- Mazza, F. Advanced shear and axial laws of bearings in the nonlinear seismic analysis of r.c. buildings. In Proceedings of the Eleventh U.S. National Conference on Earthquake Engineering Integrating Science, Engineering & Policy, Los Angeles, CA, USA, 25–29 June 2018. [Google Scholar]


Publisher’s Note: MDPI stays neutral with regard to jurisdictional claims in published maps and institutional affiliations. |
© 2020 by the authors. Licensee MDPI, Basel, Switzerland. This article is an open access article distributed under the terms and conditions of the Creative Commons Attribution (CC BY) license (http://creativecommons.org/licenses/by/4.0/).