Article

Use of a Heating System to Control the Probiotic Beverage Production in Batch Bioreactor

1
Faculty of Electrical Engineering and Computer Science, University of Maribor, Koroška cesta 46, 2000 Maribor, Slovenia
2
Faculty of Chemistry and Chemical Engineering, University of Maribor, Smetanova ulica 17, 2000 Maribor, Slovenia
*
Author to whom correspondence should be addressed.
Appl. Sci. 2021, 11(1), 84; https://doi.org/10.3390/app11010084
Submission received: 28 November 2020 / Revised: 18 December 2020 / Accepted: 22 December 2020 / Published: 24 December 2020

Abstract

:
Fermentation is a crucial bioengineering process, existentially important for modern society. The most commonly used production unit for this process is the batch bioreactor. Its main advantage is unsophisticated construction, which unfortunately results in its incapability of controlling the transient state of the fermentation process. Control of the fermentation can significantly improve the quality of the product and the economy of the process; therefore, it is useful for bioreactors to be equipped with a control system. Based on the experimental results, we used an optimization method to identify a mathematical model that describes the impact of the bioreactor’s temperature on the fermentation’s transient process. The obtained model was applied for the design and synthesis of the closed-loop control system. Simulations and experiments confirmed the effectiveness of the proposed control system. In this way, we can ensure the consistent quality of the produced probiotic product, increase the amount of the product, and shorten the fermentation time. The original results display the feasibility of the closed-loop control of the batch bioreactor’s fermentation process by changing the temperature. So far, the process has been carried without a closed-loop control system. The problem is current and has not yet been solved sufficiently. There are many attempts published; one of the last shows the possibility of controlling the fermentation process by changing the oxygen supply, which is more complex and expensive for realization than the solution from our study.

1. Introduction

Bioreactors of three basic forms have been used widely in the fields of environmental protection, healthcare, industrial biotechnology, and space exploration: batch, fed-batch and continuous ones [1,2,3]. For batch bioreactors, it is typical that their content has no contact with external substances or organisms during the execution of the biological process, i.e., the bioreactor is closed during the operation, and no addition or removal in/from the bioreactor is possible. This mode of operation allows easy construction of batch bioreactors, which is reflected in low production costs and easy maintenance. Therefore, batch bioreactors are the most widespread and most used among all types of bioreactors [4,5,6,7,8,9]. In fed-batch bioreactors, it is possible to add substances or organisms during the biological process’s execution to cultivate one or more nutrients [3,10,11,12,13]. All products remain in the bioreactor till the end of the fermentation process. Continuous bioreactors (also named flow bioreactors) enable the inflow and outflow of substances or organisms into/from the reactor as a flowing stream. The microorganisms or cells in bioreactors are fed continuously [14,15,16].
In our article, we focused on batch bioreactors for the production of probiotic dairy beverages. Depending on the type of microorganism, the carbon dioxide, acetic acid, diacetyl, acetaldehyde, ethyl alcohol, and several other substances are formed during the fermentation process, and these give the products their characteristic fresh taste and aroma. To obtain high-quality milk products, some main parameters of the fermentation process must follow the prescribed reference values. One of the quantities which correlates well with the vital fermentation process parameters is CO2 release. Thus, the control of the proper dynamic profile of the CO2 release can also assure proper values of the fermentation process parameters.
The quality and quantity of the produced probiotic beverages and the time required to obtain them depend on the time course of the fermentation process. Based on experiences, technologists working in this field know what the time course of the fermentation process should be to make production as optimal as possible. The main problem in using the present batch bioreactors is that they do not enable control of the fermentation process after the beginning of the operation. The whole fermentation process subordinates only from the compounds selected before the start of the fermentation process.
However, the transient state of the fermentation process can also be influenced by batch bioreactors. Despite the fact that it is not possible to supply microorganisms or substrates during operation, we can change some physical and chemical quantities in the bioreactor during operation: temperature (by heating or cooling), homogenization (by mixing), ventilation (by supplying oxygen). Many laboratory tests were performed, from which we tried to determine which physical/chemical quantity can most influence the transient state of the fermentation process. It has been shown that changing the temperature has a great influence on fermentation. Changing the bioreactor temperature is also easy to realize, as most bioreactors are equipped with a heating system. This was why we decided to develop a control system that will influence the fermentation process by changing the bioreactor’s temperature.
In the initial phase of the study, we also performed a thorough review of relevant journal publications in the period 2000–2020. The purpose of this review was to determine the directions of research in this area. We found many interesting articles in the field of Continuous Bioreactor Control [2,17,18,19] and even more in the field of Fed-batch Bioreactor Control [20,21,22,23].
However, unexpected and very interesting was the disclosure that there are very few publications dealing with the control of batch bioreactors. Most publications in this field deal with the control of dissolved oxygen. Dissolved oxygen is one of the significant parameters in the anaerobic fermentation process. Its control is challenging to achieve due to the variations in process dynamics during batch/fed-batch processes and the bioreactor’s complex non-linear behavior. In all cases, the changing of airflow of oxygen concentration was used for control: in [24] the fractional order PID controller was used, in [25] the gain scheduling control approach was proposed, and in [26] the design and implementation of a model reference adaptive control scheme to dissolved oxygen control of the bioreactor using the stirrer speed as the control signal was applied. Lack of publications in this area was also an additional motivation for us to work even more in-depth and intensively in this area.
The Section 2 is divided into three parts. First, a laboratory system with a batch bioreactor is shown, which allows changing the temperature in the bioreactor and measuring CO2 in the probiotic beverage. Experimental results are shown of the influence of temperature change on the response of the fermentation process. A closed-loop control system was developed on this phenomenon. The second part presents the derivation of a mathematical model of the fermentation process in a batch bioreactor. A novelty in comparison with already known mathematical models is that the mathematical model presented in the article also describes the influence of temperature change on the dynamics of the product quantity. The third part shows the selection of the controller structure and the determination of its parameters. In the Results and discussion section, the results of the identification of the derived models are given, the procedure for selecting the reference course of CO2 concentration is explained, the results of tuning of the controller parameters are presented, and the laboratory tests of the developed closed-loop control system are shown and discussed.

2. Materials and Methods

2.1. Laboratory Equipment and Measurements

2.1.1. Batch Bioreactor

Laboratory fermentations were performed in the reaction calorimeter RC1e from Mettler Toledo (Greifensee, Switzerland). It is a computer-controlled benchtop batch bioreactor with a working volume of 0.7 L. By using specific modifications in hardware and software, it was used as a bioreactor. A more detailed description of RC1e can be found in our previous paper [27].

2.1.2. Heating System

A heating system was used to control the fermentation process. It is an integral part of the batch bioreactor and allows change of the internal temperatures in the range from 5 to 200 °C. The external thermostat controls the temperature of the reactor. The silicone oil used as heat transfer agent is pumped through the double jacket of the reactor in a closed circulation system. This keeps the temperature of the reactor contents at the desired temperature. The heating system’s time constant is very short compared to the fermentation process. The temperature change for 5 °C takes less than 1 min.

2.1.3. CO2 Measurement System

Although, in the dairy industry, pH of the fermentation mixture or dissolved oxygen is usually followed, for our study we introduced CO2 as one of the bioreaction products that contribute significantly to the specific taste of the kefir. We assumed that the measured CO2 concentration profile could also be the indicator of the fermentation progress. Concentration profiles of other fermentation products are expected to have similar behavior. Thus, dissolved CO2 was chosen as the output and controlled variable in our case. The SevenMulti Apparatus (Mettler Toledo, Greifensee, Switzerland), equipped with an ISE51B ion-selective electrode, was used for monitoring the CO2 dynamics in liquid media. The principles of this device are described in [27].

2.1.4. Substances for the Fermentation Process

The kefir grains for the fermentation process were obtained from the local dairy (Kele and Kele d.o.o., Logatec, Slovenia). They were maintained at room temperature in fresh whole fat (3.5%) cow’s milk (Ljubljanske mlekarne d.d., Ljubljana, Slovenia) without mixing. For activation, they were washed with cold water and transferred into the fresh milk for 5 successive days. Milk from the same producer was used as a fermentation medium.

2.2. Mathematical Model of the Fermentation Process

For the control system’s design and synthesis, the dynamical mathematical model of the controlled plant is necessary. There are many mathematical models of different grades of complexity that describe the fermentation process in batch bioreactors. Almost all models are based on the mass balances of all three components of the fermentation process. However, all known mathematical models have in common that they describe the fermentation process in a batch bioreactor in the case of a constant temperature. The time course of the fermentation process substances depends only on the concentrations of the microorganisms, substrate, and product in the bioreactor at the beginning of the fermentation. For the needs of the control system design and synthesis, it is also necessary to know the mathematical model that describes the influence of temperature changes on the fermentation process. For this purpose, we derived a mathematical model of the fermentation process, which consists of two partial models. The first model, called the “constant temperature model,” describes the course of the fermentation process in the case of a constant temperature. The second model, called the “temperature-dependent model,” describes how a change in temperature affects the fermentation process.

2.2.1. Constant Temperature Model

A basic and most used mathematical model of the fermentation process is made up of a set of three non-linear differential equations, which define the concentration of the microorganisms, substrate, and product [28,29]:
X ˙ ( t ) = μ m S ( t ) K m + S ( t ) X ( t )
S ˙ ( t ) = μ m S ( t ) K m + S ( t ) S ( t )
P ˙ ( t ) = μ m S ( t ) K m + S ( t ) [ α μ m S ( t ) K m + S ( t ) β ] P ( t )
where the variables of the mathematical model denote the following biological quantities:
  • X(t)—the concentration of the microorganisms (g/L),
  • S(t)—the concentration of the substrate (g/L),
  • P(t)—the concentration of the product (mol/L),
and the parameters of the mathematical model are:
  • μm—maximum microorganisms’ growth rate (h−1),
  • Km—substrate saturation constant (g/L),
  • α—parameter that describes the relation between product yield and microorganism growth,
  • β—parameter that describes the product yield independent of the microorganism growth (h−1).
In this model, the simplified rational expression called Monod’s law was used to describe growth function [28].

2.2.2. Temperature-Dependent Model

The constant temperature model was determined using theoretical modeling based on knowledge of biochemical reactions in the fermentation process. Since the influence of temperature change on the fermentation process dynamics is less investigated, we determined the temperature-dependent model using experimental modeling, i.e., identification. In the first step, we tried to find a mathematical model structure that enables the best possible fitting of measured courses with the courses obtained from simulations with the identified model. Based on the systematic analysis of time courses of various fermentation processes in which we changed the temperature, we found out that accurate fitting could be obtained with the linear mathematical model built of two parallel-connected terms described with the Equations (4)–(6). A detailed description of the structure determination is given in [27,30]. For ease of presentation, transfer functions representing the input-output relationship in the Laplace domain are used to describe the temperature-dependent model.
P Δ ( s ) = G 1 ( s ) T Δ ( s ) + G 2 ( s ) T Δ ( s )
G 1 ( s ) = k 1 s T 1 + 1
G 2 ( s ) = k 2 s 2 T 2 2 + 2 s z T 2 + 1 s T d
The symbols used have the following meaning:
  • PΔ(s)—output of the temperature-dependent model (i.e., fermentation product deviation due to change in bioreactor’s temperature),
  • TΔ(s)—input of the temperature-dependent model (i.e., bioreactor’s temperature deviation)
  • G1(s)—transfer function that denotes the long-term influence of the temperature deviation TΔ(s) on fermentation product deviation PΔ(s), and is especially important after the transient response caused by temperature change,
  • G2(s)—transfer function that denotes the short-term influence of the temperature deviation TΔ(s) on fermentation product deviation PΔ(s), it has an impact during the transient response caused by temperature change,
  • k1, T1—gain and time constant of the first-order transfer function G1(s),
  • k2, T2, z—gain, time constant and damping of the second-order term in transfer function G2(s),
  • Td—time constant of the differentiator which is in series with the second-order term in transfer function G2(s), and
  • s—complex variable.

2.2.3. Complete Model

The complete mathematical model that describes the transient of the fermentation product concentration is presented in Figure 1.
The complete model output Pc(t) represents the sum of the outputs of both submodels. The constant temperature model is non-linear and described with Equations (1)–(3). It calculates the P(t) as a response to the initial values of the microorganisms X(0), substrate S(0), and product P(0). The temperature-dependent model is linear and described with Equations (4)–(6). It calculates the PΔ(t) as a response to the temperature variations TΔ(t) in the batch bioreactor. The derived complete model was used for control system design and synthesis.

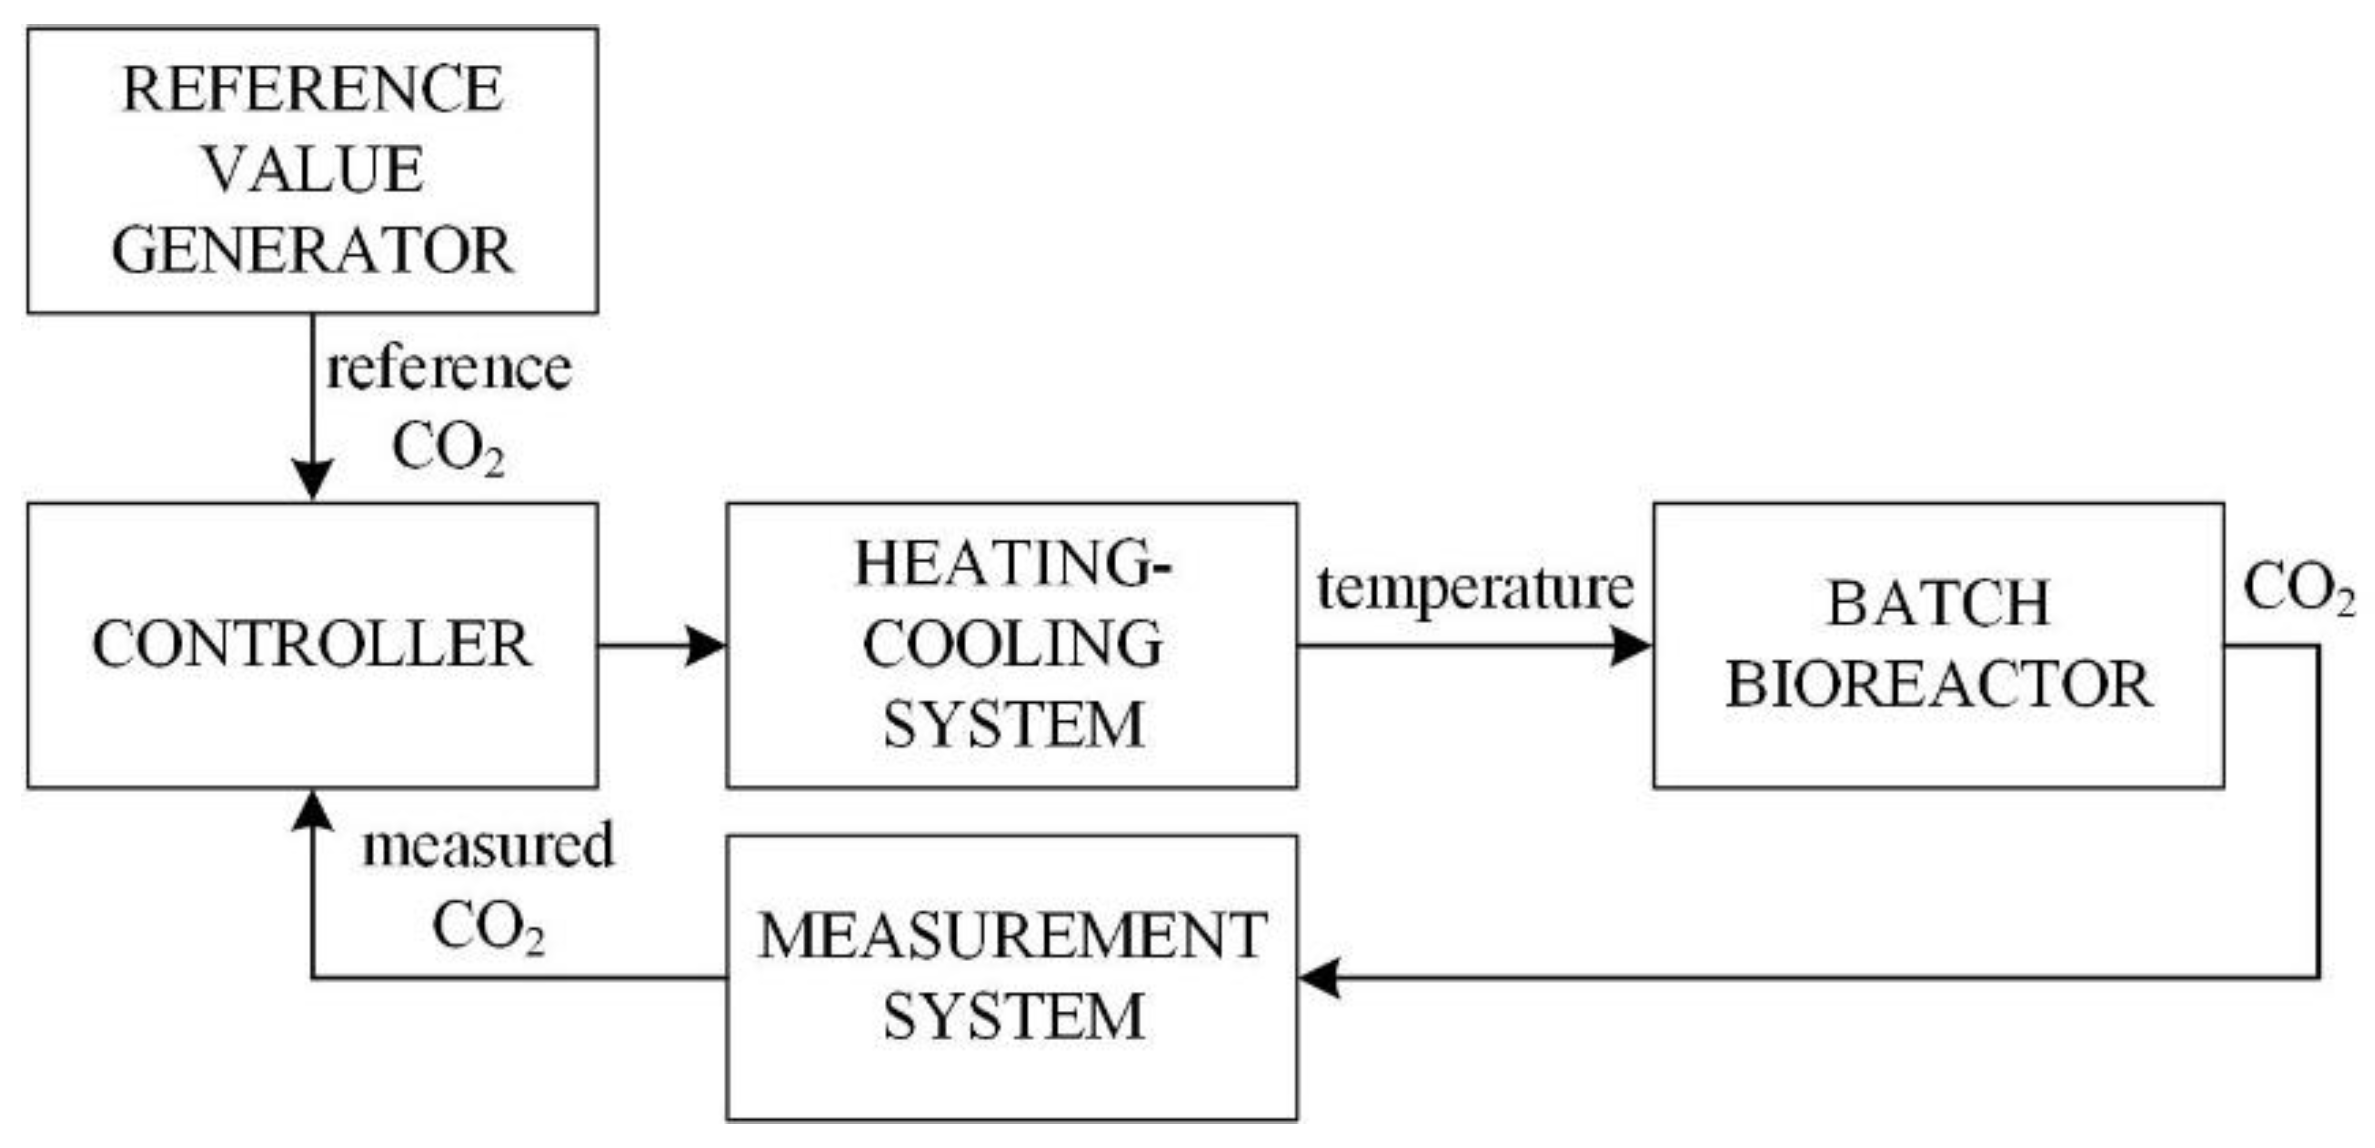
2.3. Control System for the Fermentation Process

The developed closed-loop control system for the fermentation process of probiotic beverage is shown in Figure 2.
The control system consists of the following components:
-
The reference value generator that determines the reference value of the CO2, which provides a sufficient amount of high-quality fermentation product in short fermentation time;
-
The measurement system which measures the CO2 concentration;
-
The controller, its input is the error between the reference CO2 value and measured CO2 concentration. Based on this deviation, the controller calculates the required temperature change to ensure that the measured CO2 value will be as close as possible to the reference CO2 value;
-
The heating/cooling system that provides that the temperature in the reactor is as required by the controller.

3. Results and Discussion

3.1. Identification of the Mathematical Model

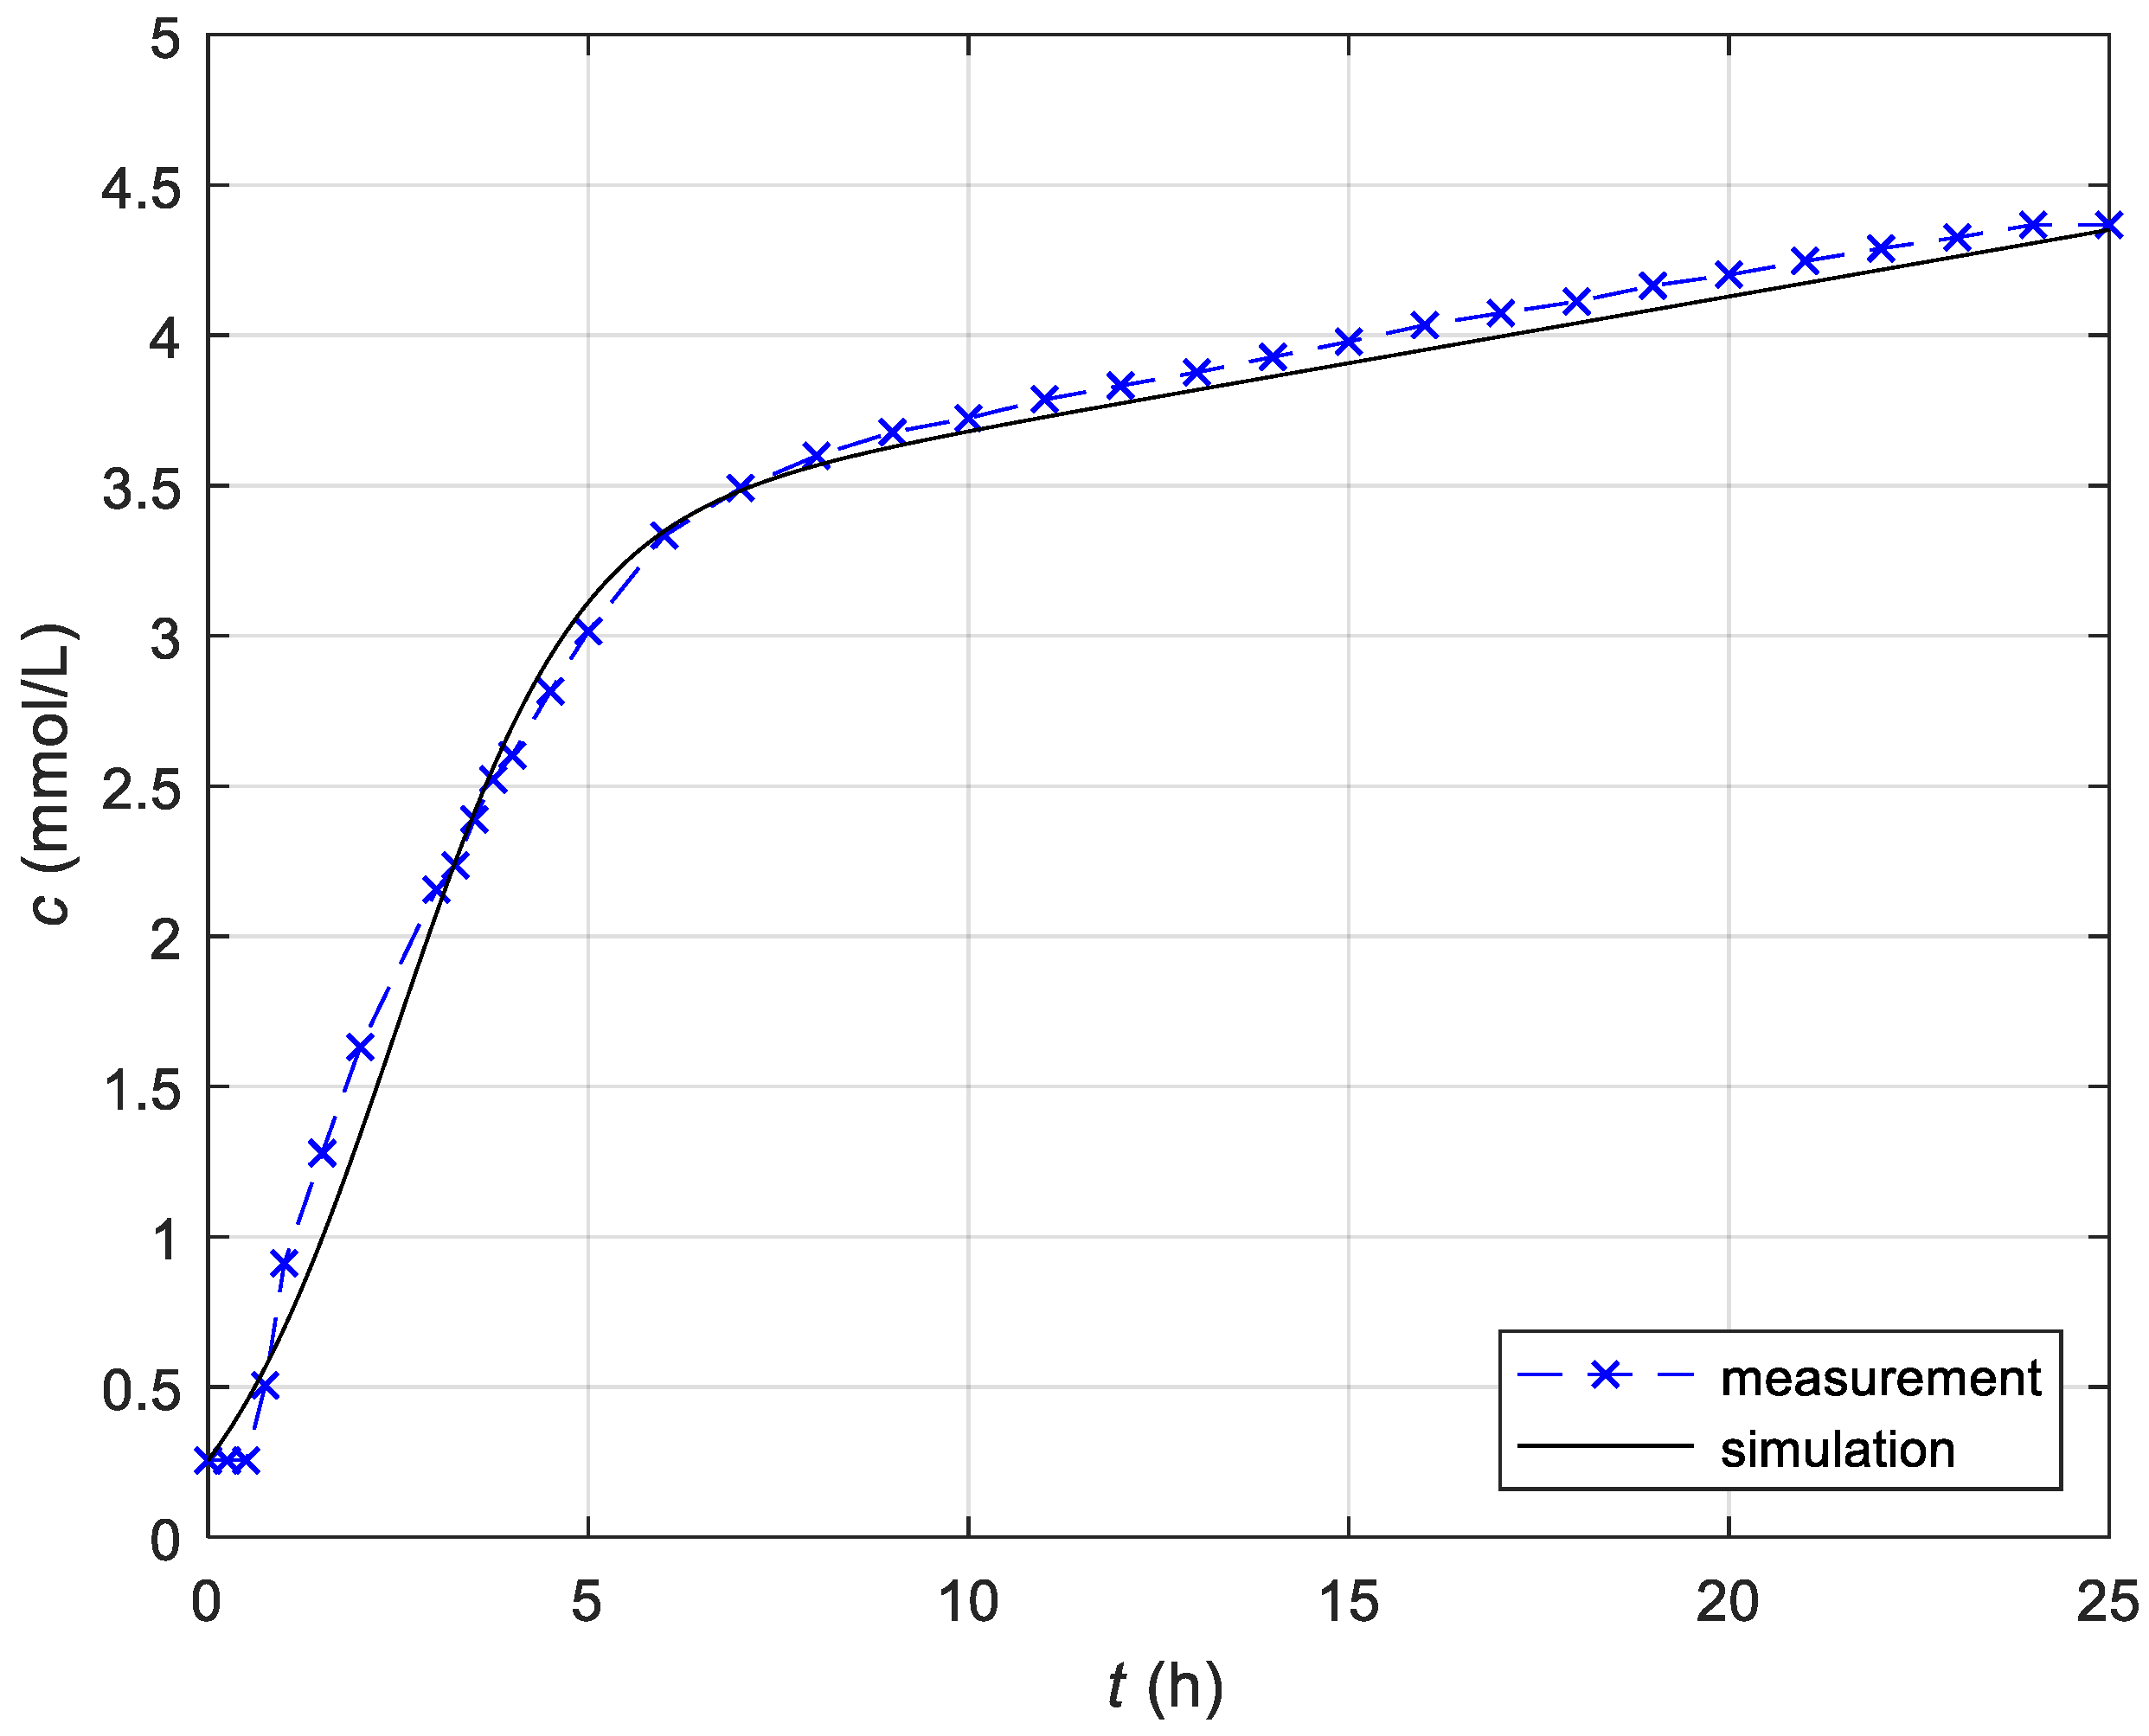
3.1.1. Identification of the Constant Temperature Model

In the first phase, we searched the constant temperature model parameters for the analyzed fermentation process in the studied laboratory batch bioreactor. The differential evolution optimization method was used to calculate the parameters of the model [31]. We tried to find the model parameters that will simulate the product response P(t) as close as possible to the measured CO2 response of the analyzed laboratory reactor. The integral square error objective function was used to evaluate the matching of both responses. Product response P(t) of the constant temperature model was calculated with Equations (1)–(3). The measured response was obtained from the laboratory bioreactor presented in [27].
Data of initial concentrations of the microorganisms, substrate, and product were required for simulation with the constant temperature model. These values were measured before the beginning of the fermentation process. Using the optimization method, we were changing the parameters μm, Km, α, and β of the constant temperature model so long that we obtained a minimal deviation between the responses of the identified model and the measured data in the laboratory bioreactor, i.e., that a minimum of the objective function was obtained. Measured initial values and obtained parameters of the constant temperature model are shown in Table 1.
The fitting of the measured CO2 response with the simulations obtained by the identified constant temperature model is shown in Figure 3.
The quantitative assessment of the accuracy of the identified Constant temperature model was carried out. The deviation (i.e., error) between the response of the identified model and the response of the laboratory batch bioreactor was calculated (cerror = csimulationcmeasurement). Based on the calculated error, the following indexes were determined: the maximum absolute error (emax), the average absolute error (ea), the integral square error (ISE), and the integral absolute error (IAE). The results are presented in Table 2.

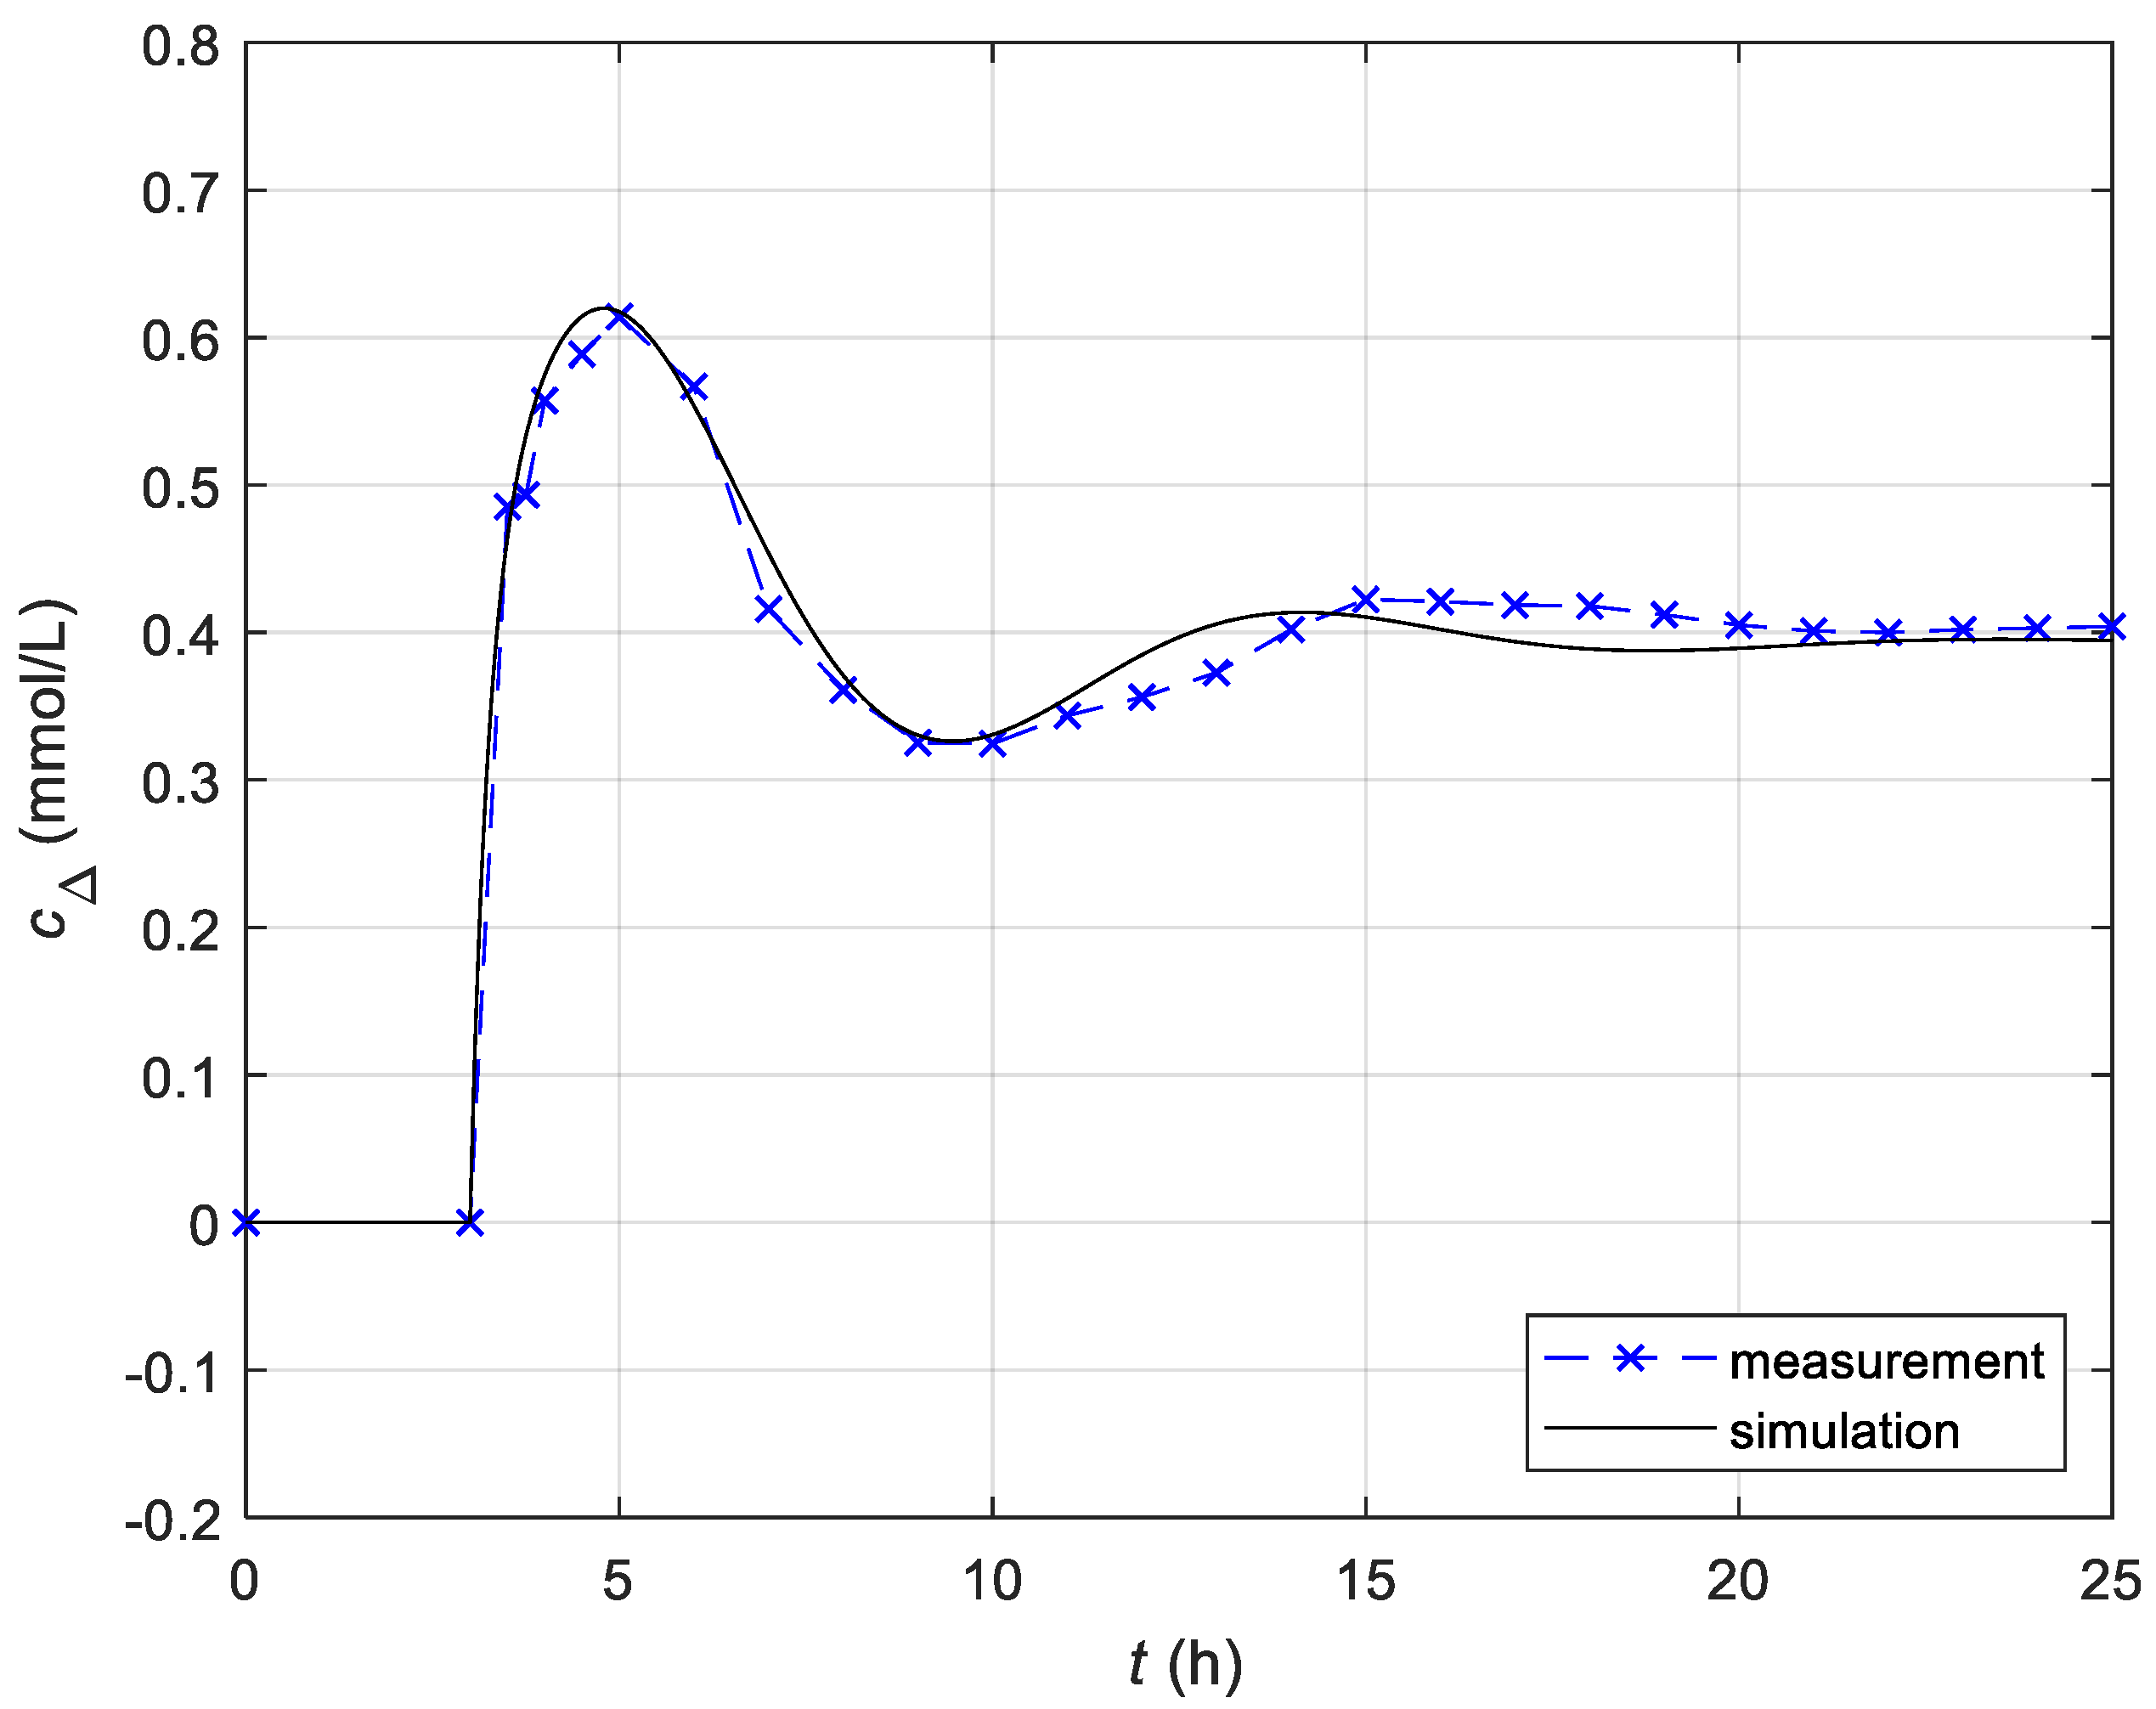
3.1.2. Identification of the Temperature-Dependent Model

In the second phase, we searched the parameters of the temperature-dependent model. This model describes the impact of temperature change on the increase or decrease of CO2 production. In order to determine the effect of the change in temperature, we carried out the fermentation process two times: First with a constant temperature, and then in such a way that the temperature was changed rapidly by 5 °C (from 22 to 27 °C) during the fermentation. The heating system needs a very short time (less than 1 min) to raise the temperature. Since the dynamics of the fermentation is very slow compared to the time constant of the heating system, the temperature change can be considered as a step change. The impact of temperature change on the production of CO2 was significant. We searched the model, which describes how a variation in temperature affects the difference between the two courses. We used the same optimization method and the same objective function as in the previous case. However, in this case, we looked for the parameters of the temperature-dependent model that will give, for the same change in temperature TΔ(t), a response PΔ(t) that will be as close as possible to the deviation of both measured CO2 courses.
Using the optimization method, we changed the parameters k1, T1, k2, T2, z, Td of the temperature-dependent model so that we obtained a minimal deviation between the simulation course with the identified model and deviation of the measured courses of the laboratory bioreactor (without and with temperature change). Identified parameters of the temperature-dependent model are shown in Table 3.
The fitting of the difference of measured CO2 courses with the course obtained with the identified temperature-dependent model is shown in Figure 4 [27]. The overshoot that we can see in Figure 4 is due to the under damped response of the heating control system. The heater/cooler was equipped with the proportional-integral (PI) control system. The predefined parameters of the PI-controller have resulted in the considerable overshoot of the response of the bioreactor’s temperature to the step change of the reference temperature.
The deviation between the response of the identified temperature-dependent model and the response of the experiment of the laboratory batch bioreactor was calculated. The maximum absolute error (emax), the average absolute error (ea), the integral square error (ISE), and the integral absolute error (IAE) are presented in Table 4.
The obtained results led us to conclude that the heating system, which allows rapid temperature change in the batch bioreactor during the fermentation process, can be used to implement a control system.

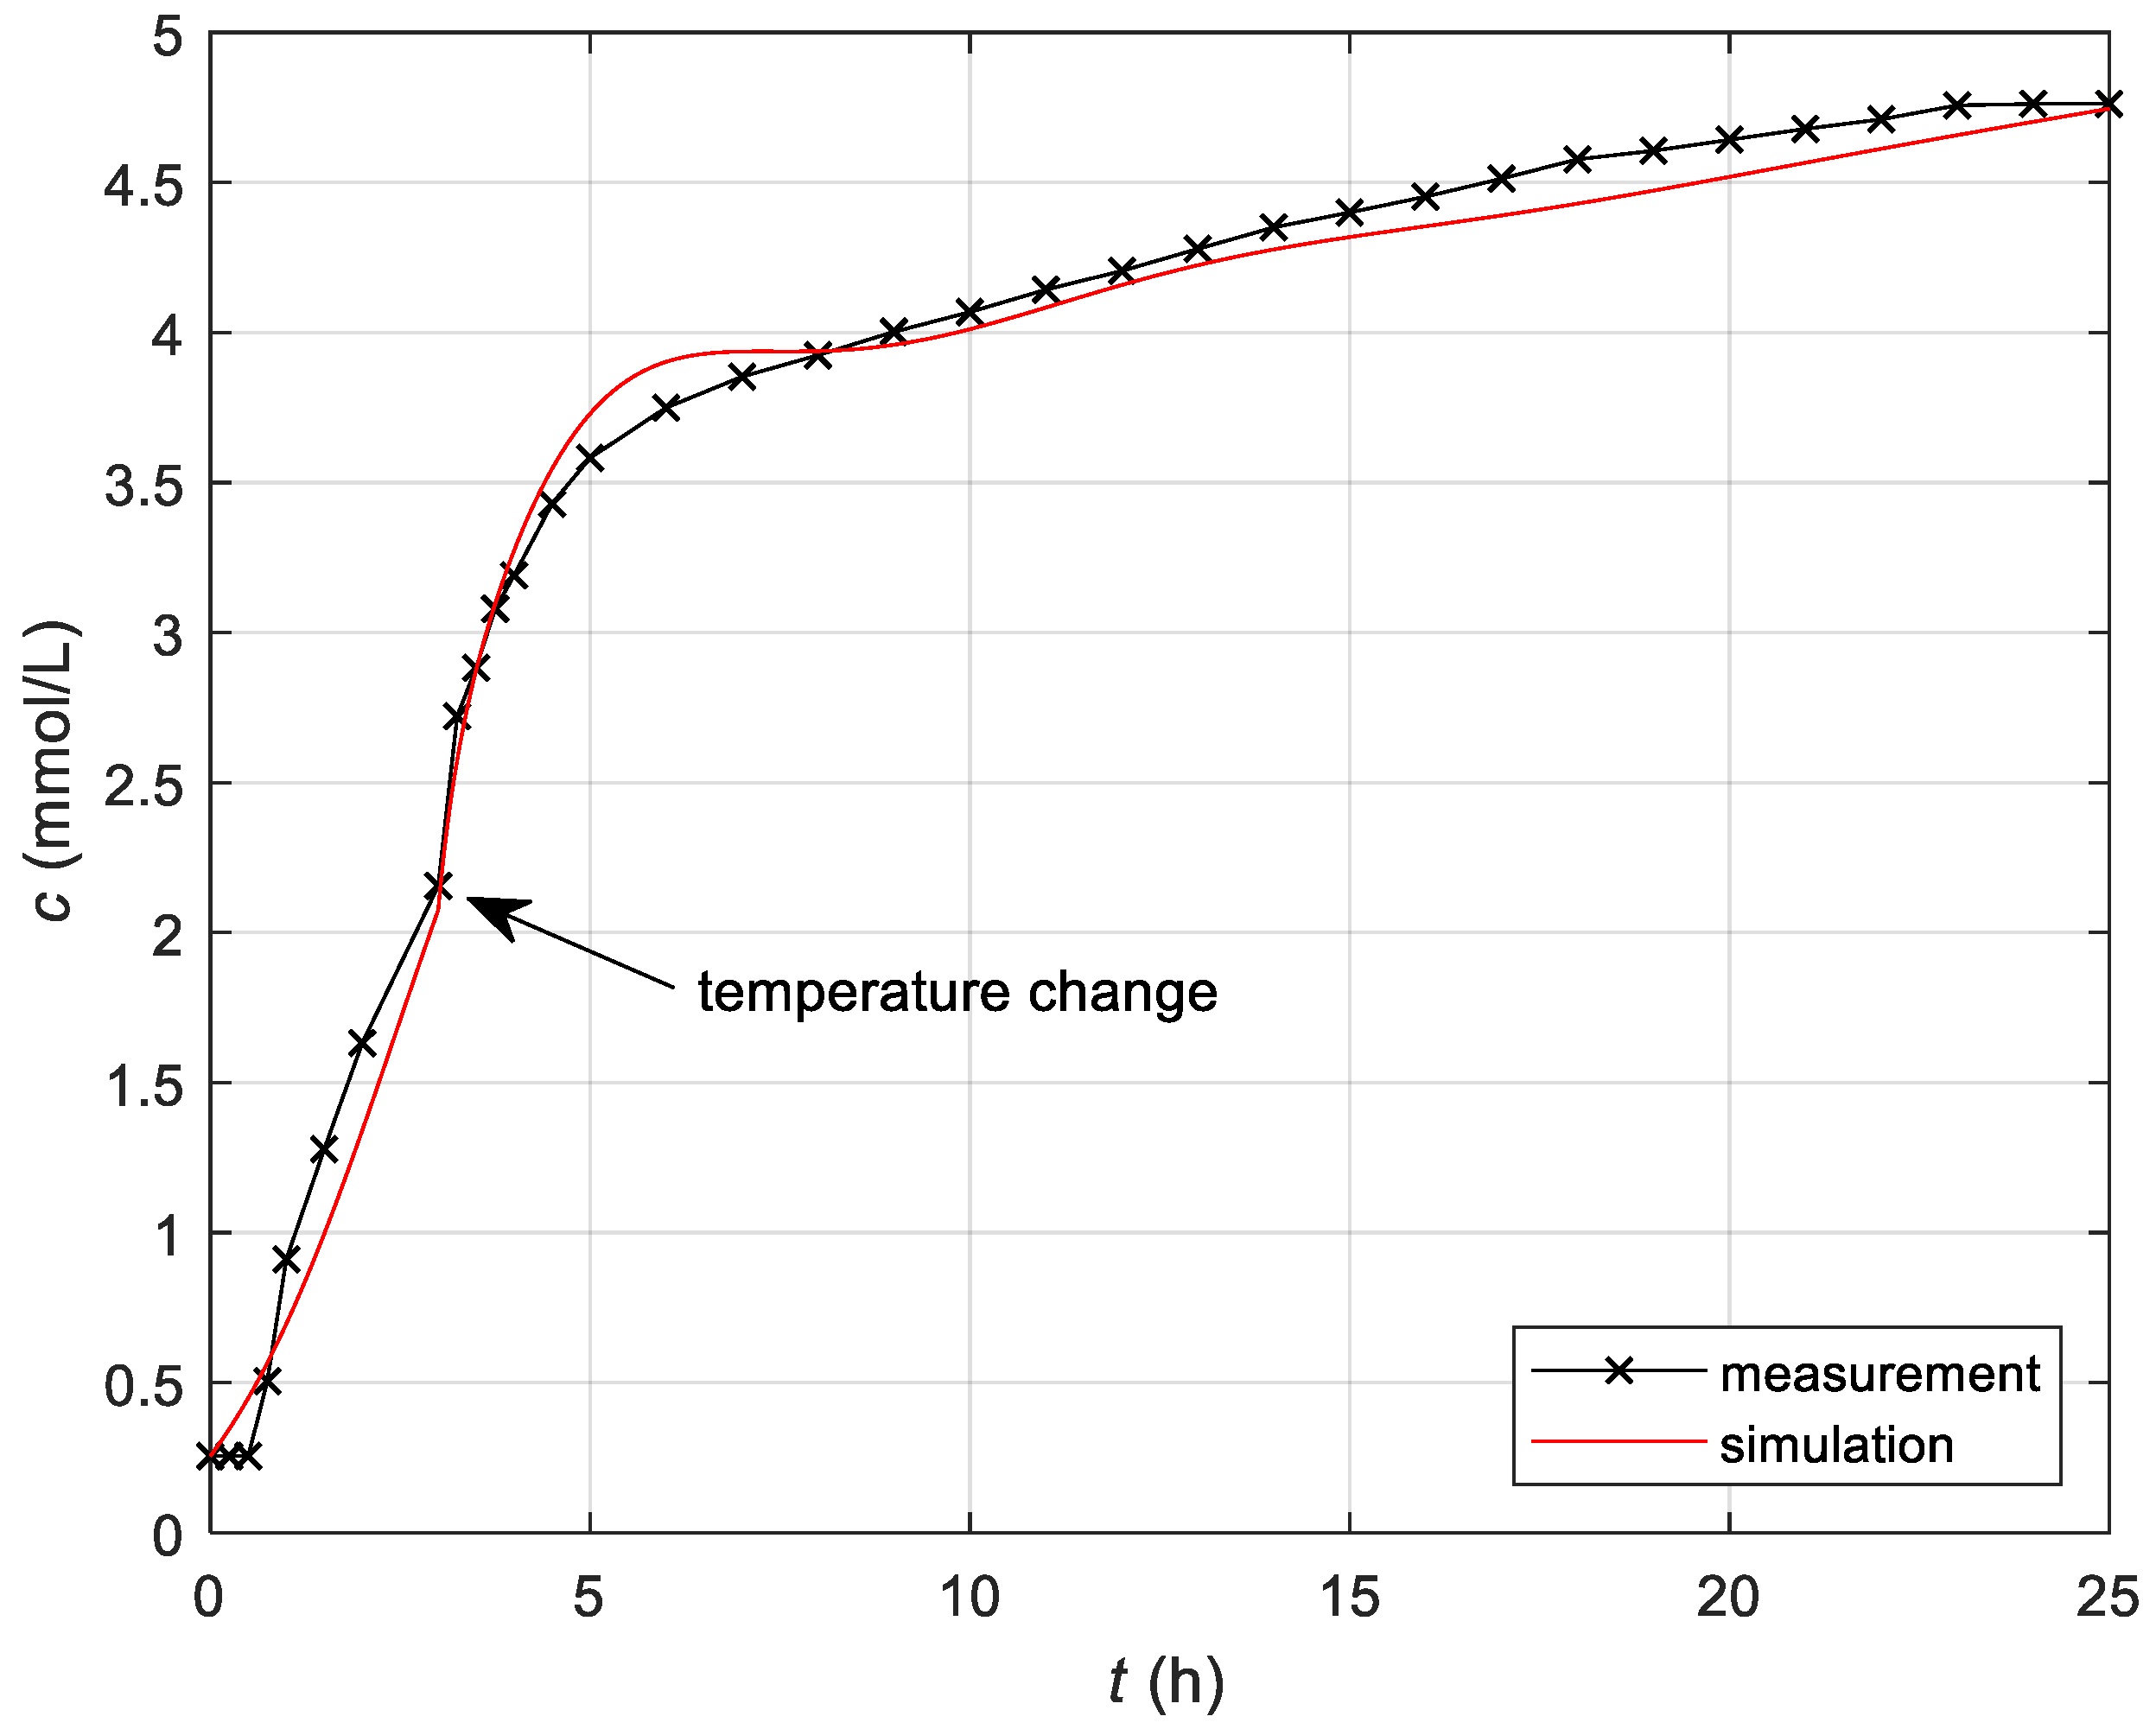
3.1.3. Simulation of the Complete Model

The fitting of the measured CO2 response with the simulations obtained by the identified complete model is shown in Figure 5. The fermentation process was carried out for the first three hours at a constant temperature of 22 °C. At time t = 3 h, the heating system raised the temperature in the bioreactor to 27 °C. The temperature of the mixture in the bioreactor increased in a short time (less than 1 min). Therefore, the change in temperature was estimate as a step change. Subsequently, the fermentation process was carried out until the end at a constant higher temperature of 27 °C.
The deviation between the response of the identified Complete model and the response of the laboratory batch bioreactor was calculated. The deviations of the dissolved CO2 concentration at different moments of the fermentation process are shown in Figure 6. The maximum absolute error (emax), the average absolute error (ea), the integral square error (ISE), and the integral absolute error (IAE) are presented in Table 5.
From the obtained results shown in Figure 3, Figure 4, Figure 5 and Figure 6, it can be seen that the proposed two-part structure of the mathematical model of the fermentation process in the batch bioreactor allows simulations that match the measurements of the real bioreactor very well. The optimization method used with the selected objective function proved to be easy to use and very efficient.

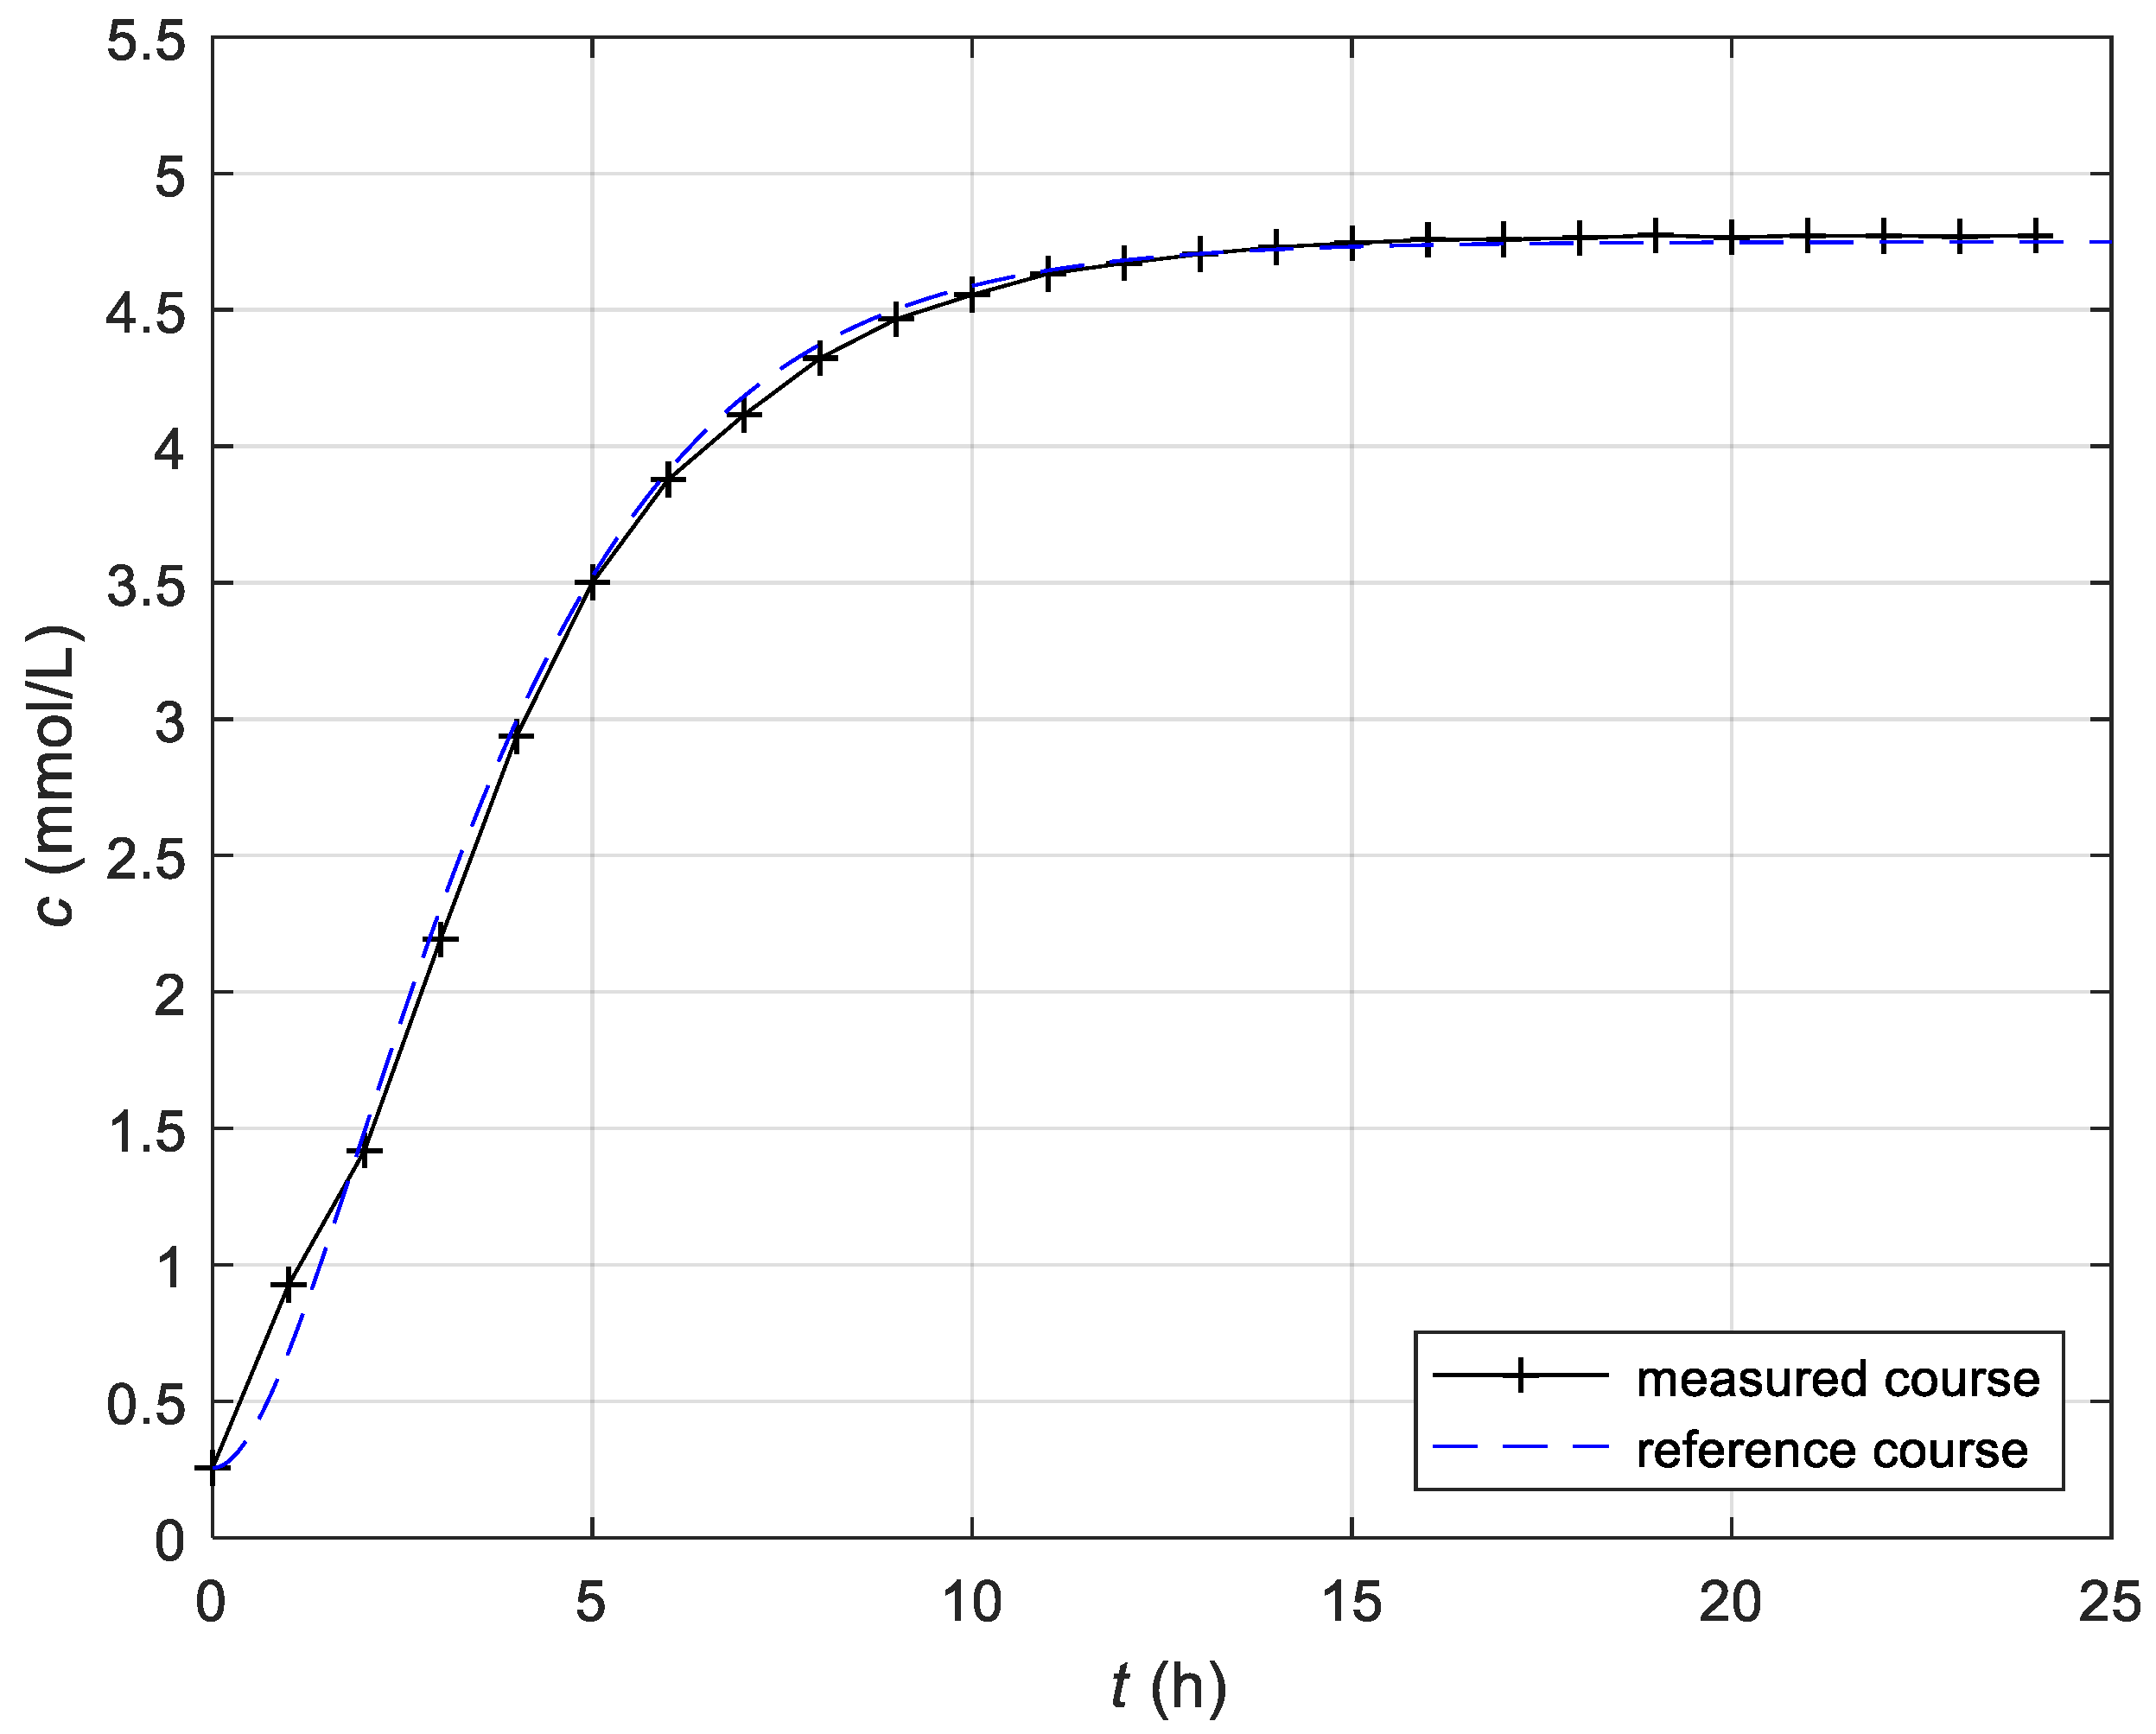
3.2. Determination of the Reference Course of CO2 Concentration

The aim of the control system was to control the fermentation process in such a way that the produced probiotic beverage will have the best possible taste (quality) and that high amount of product as possible will be produced in the shortest possible time (economy). In order to achieve these goals, it is necessary to reshape the time course of CO2 production so that the final state will be reached in a shorter time and so that the final achieved value of CO2 concentration will be higher. In addition, it is desirable that the increase in CO2 concentration during the transient will be continuous, without fast large changes in gradient, which reduce the quality. All this is possible only to the extent allowed by the available microorganisms and substrate. For the studied fermentation process, the ideal trajectory of the CO2 concentration was appraised on the basis of empirical knowledge of technologists and laboratory tests. Compared to the CO2 concentration course of the non-controlled fermentation process in the laboratory bioreactor, the proposed ideal trajectory has a very short starting induction phase, a smaller gradient at the beginning of the followed exponential growth phase of the fermentation process (t < 1.5 h), after than quicker progression to the final state value (t ≈ 12 h), and also little increase of the final state value (≈10%). The appraised ideal (reference) time course of the CO2 concentration Pref(t) was estimated with Equation (7) and will be shown in Figure 7 and Figure 8.
P ref ( t ) = 4.75 · 10 3   6.42 · 10 7   t   e 1.43 · 10 4 · t 4.49 · 10 3   e 1.43 · 10 4 · t

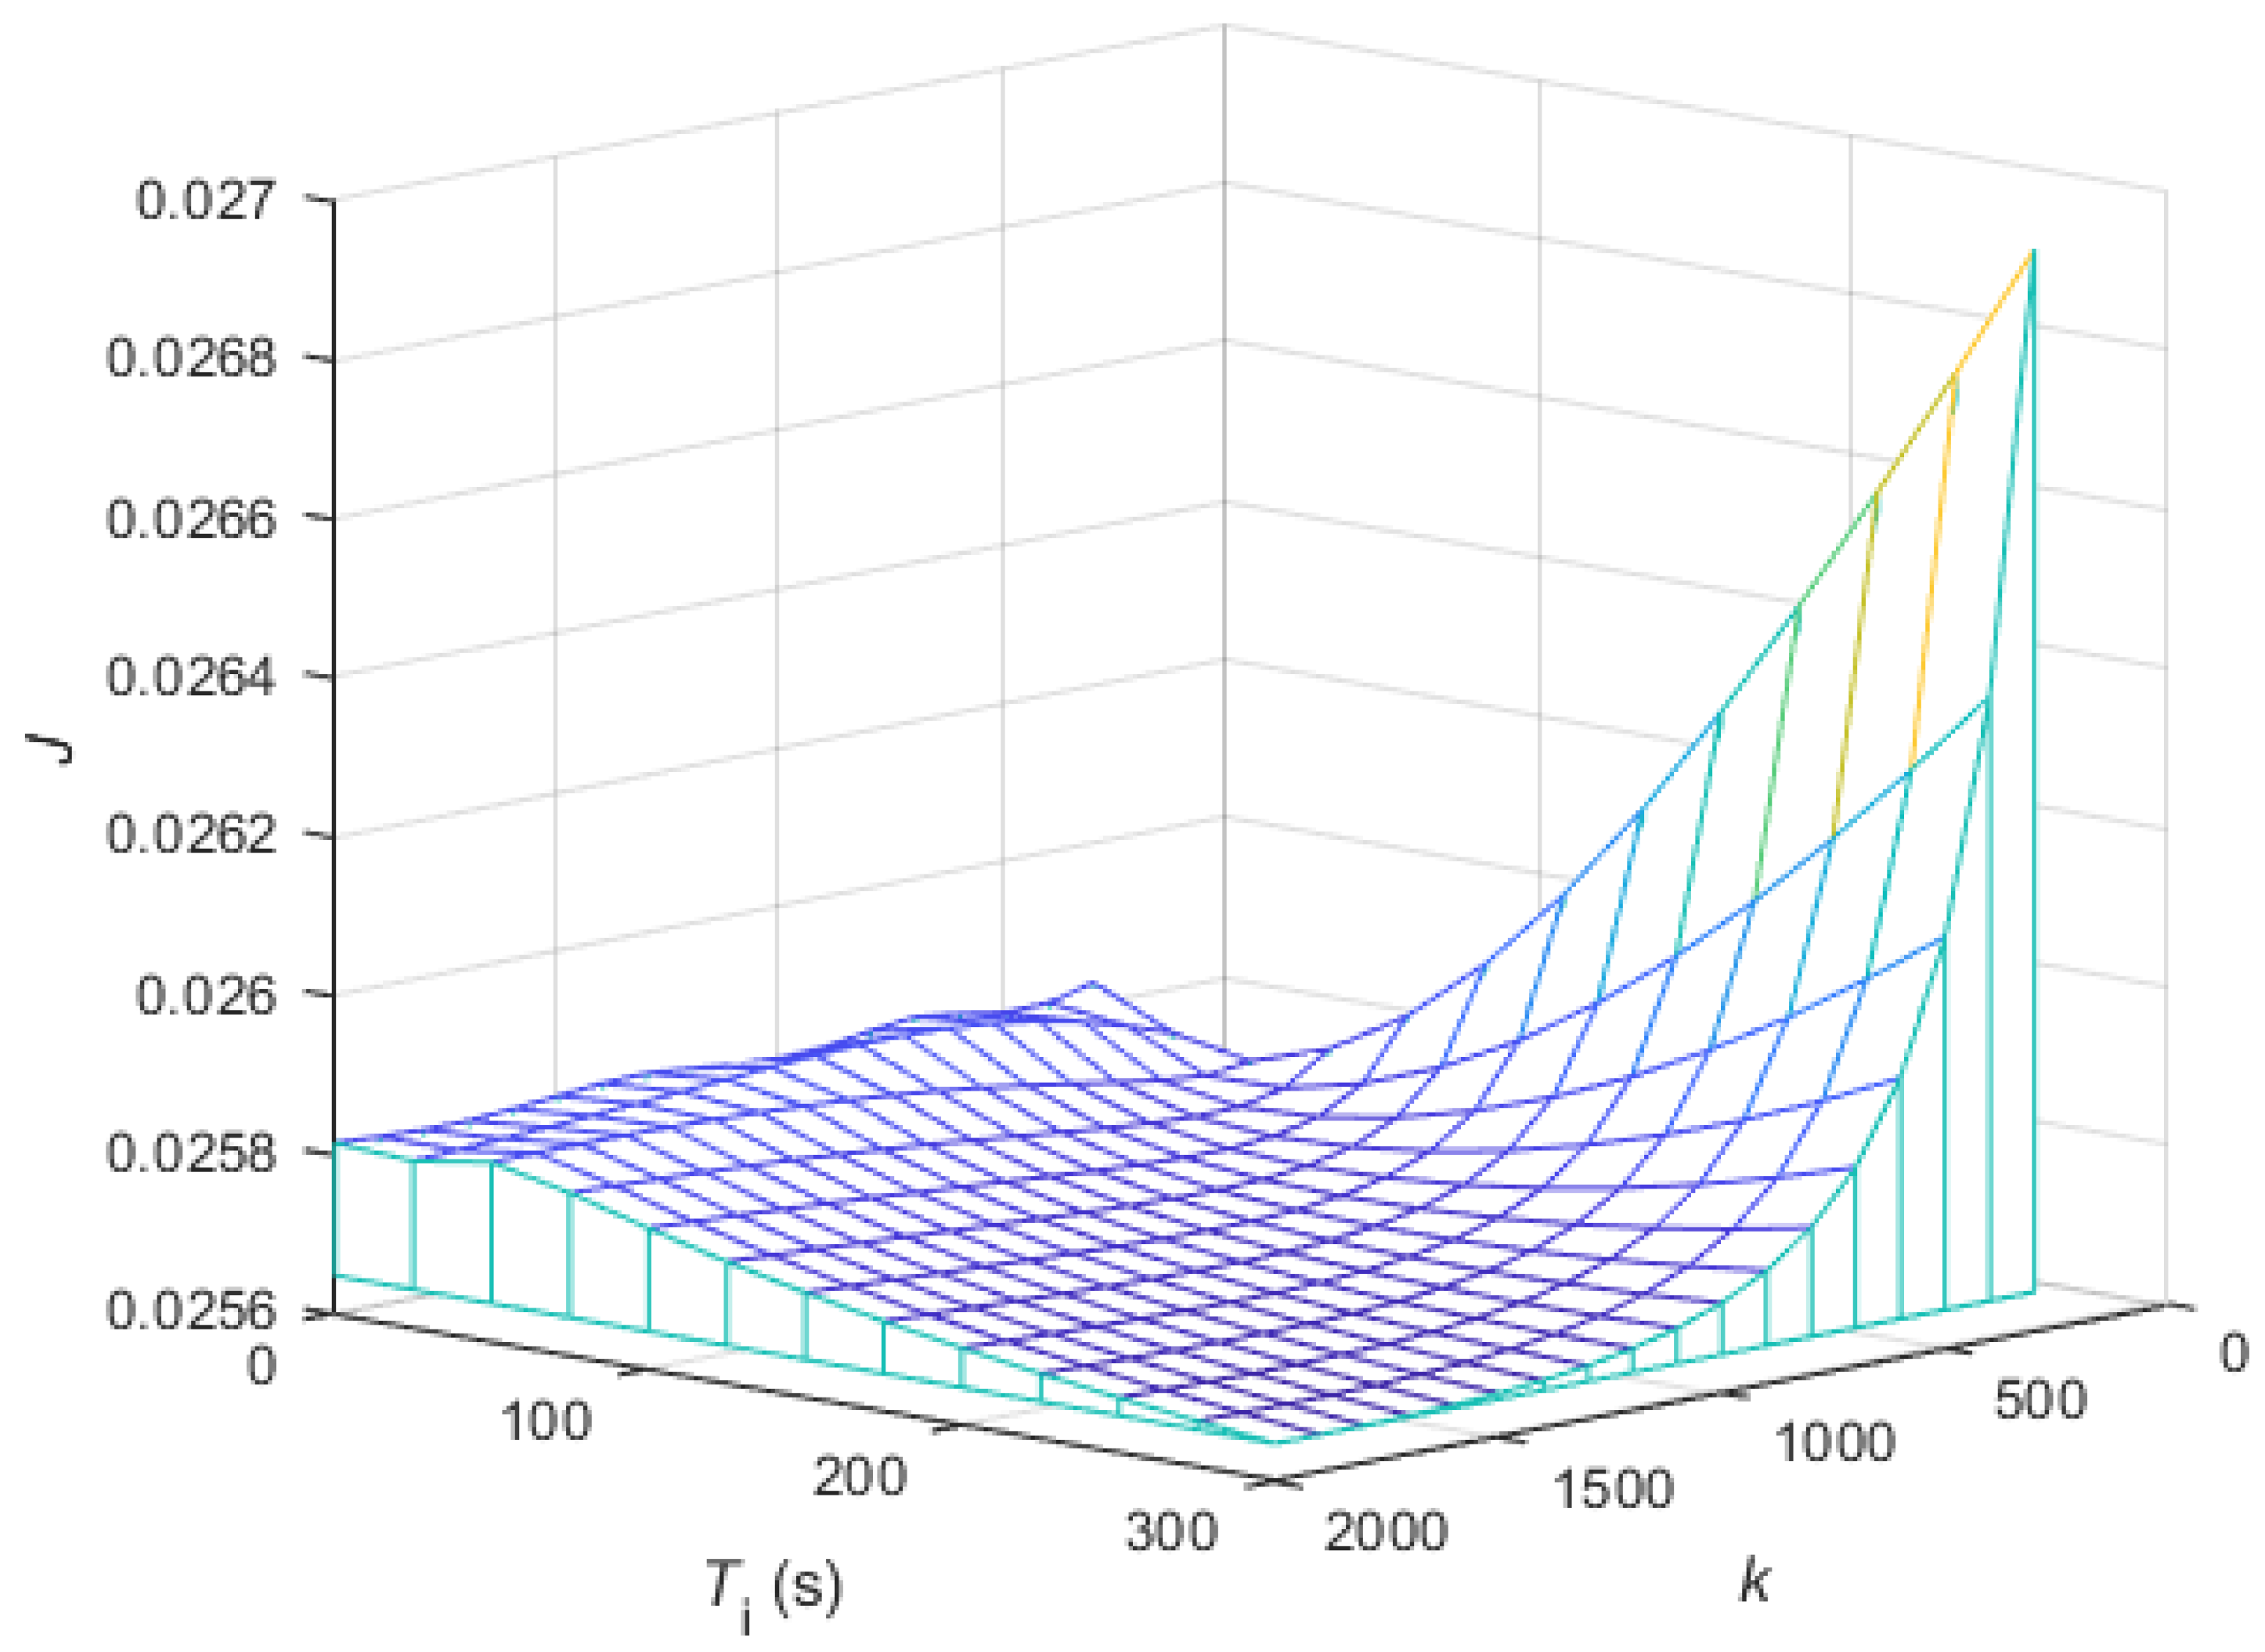
3.3. Tuning of the Controller Parameters

The identified complete model was used for the synthesis of the closed-loop control system presented in Figure 2. The conventional proportional-integral (PI) controller was chosen in order to make the control system as uncomplicated as possible [32]. The PI-controller is described with the transfer function:
G PI ( s ) = k s T i + 1 s i
where parameter k denotes gain and Ti is the time constant of the PI-controller defined with the transfer function GPI(s).
The objective function was used for the tuning of the controller parameters k and Ti. It was selected so as to include a deviation between the reference and the actual value of CO2 concentration and the required temperature change. The objective function is presented with the equation:
J = [ q e 2 ( t ) + r u 2 ( t ) ]   d t
where the used symbols have the following meanings:
  • J—objective function (i.e., cost function),
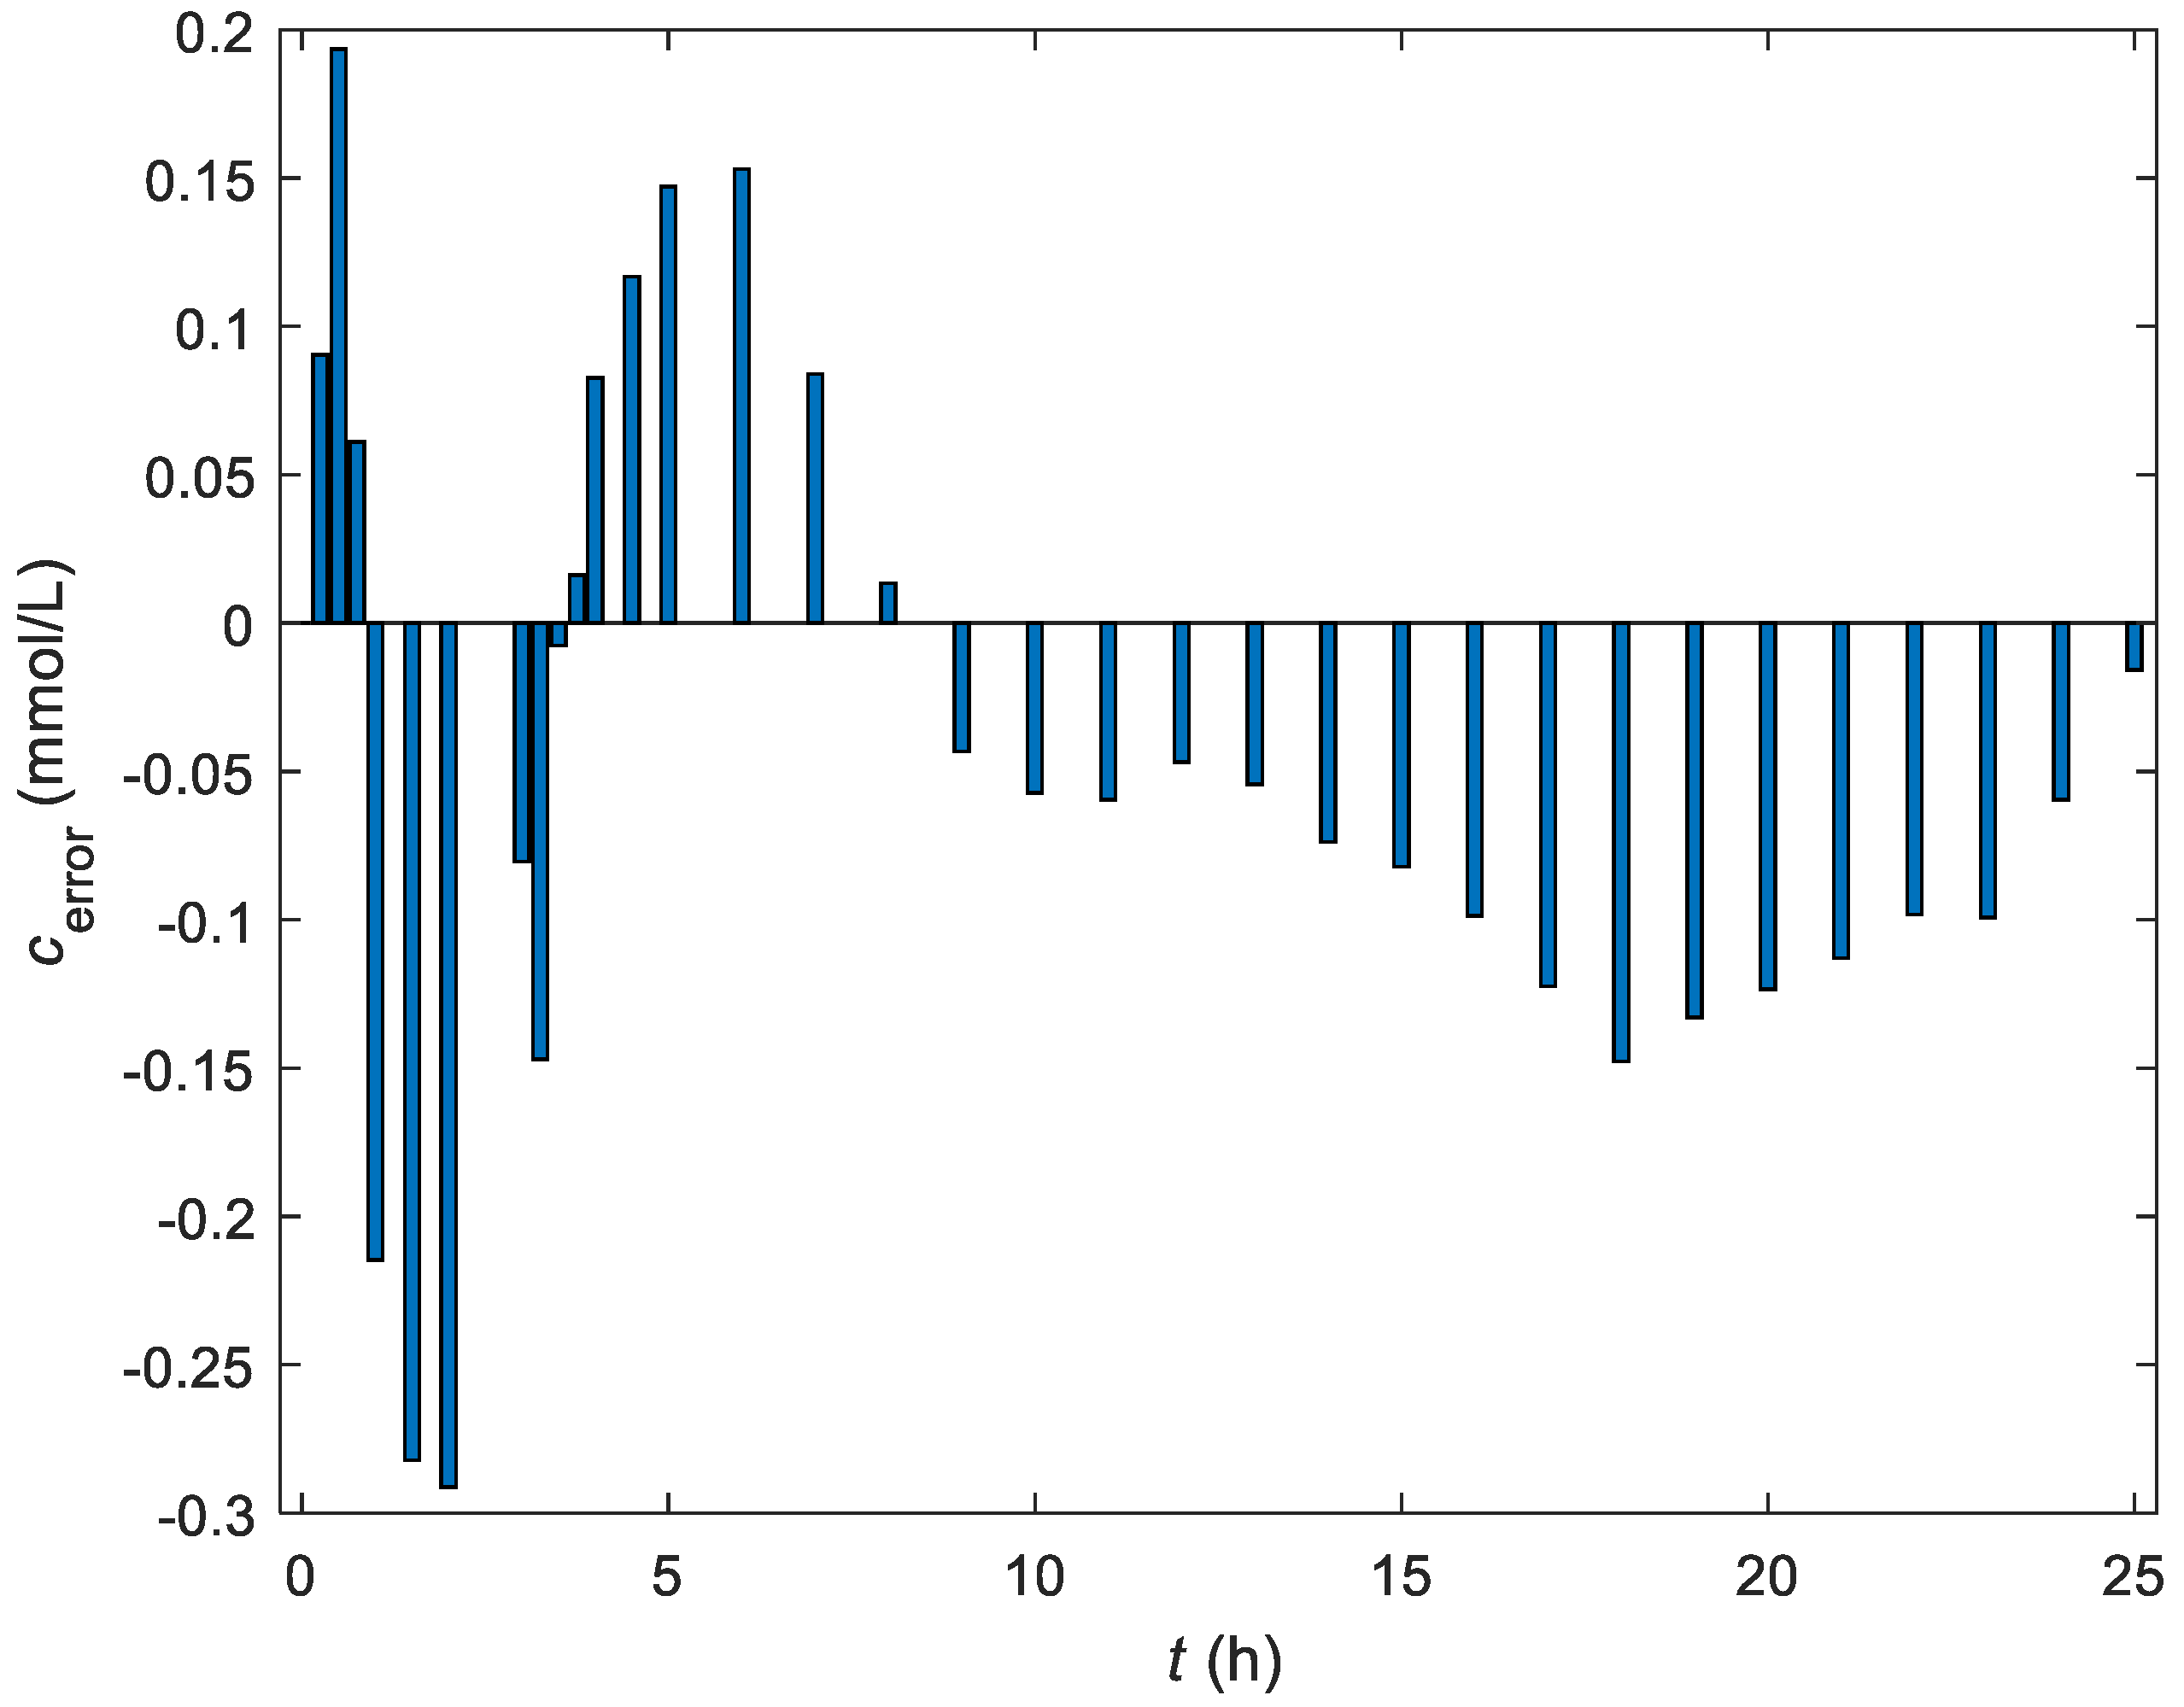
  • e(t)—deviation between the reference and the actual value of CO2 concentration (i.e., control error),
  • u(t)—calculated required change of temperature (i.e., controller output) and
  • q, r—parameters that enable different weighting of e(t) and u(t) in the objective function.
In Figure 7, the objective function is shown in dependence on the controller parameters k and Ti. The objective function was calculated with the complete model for the time period from t = 0 h to t = 25 h for different values of controller parameters. The weighting parameters have been chosen to keep the required temperature within the limits of the available heating system (q = 1, r = 2 × 10⁻⁹).
Figure 7 shows the area where the objective function has a low value. The associated values of parameters of the PI-controller are also visible. The values k = 1600 and Ti =250 s were chosen for the implemented controller.

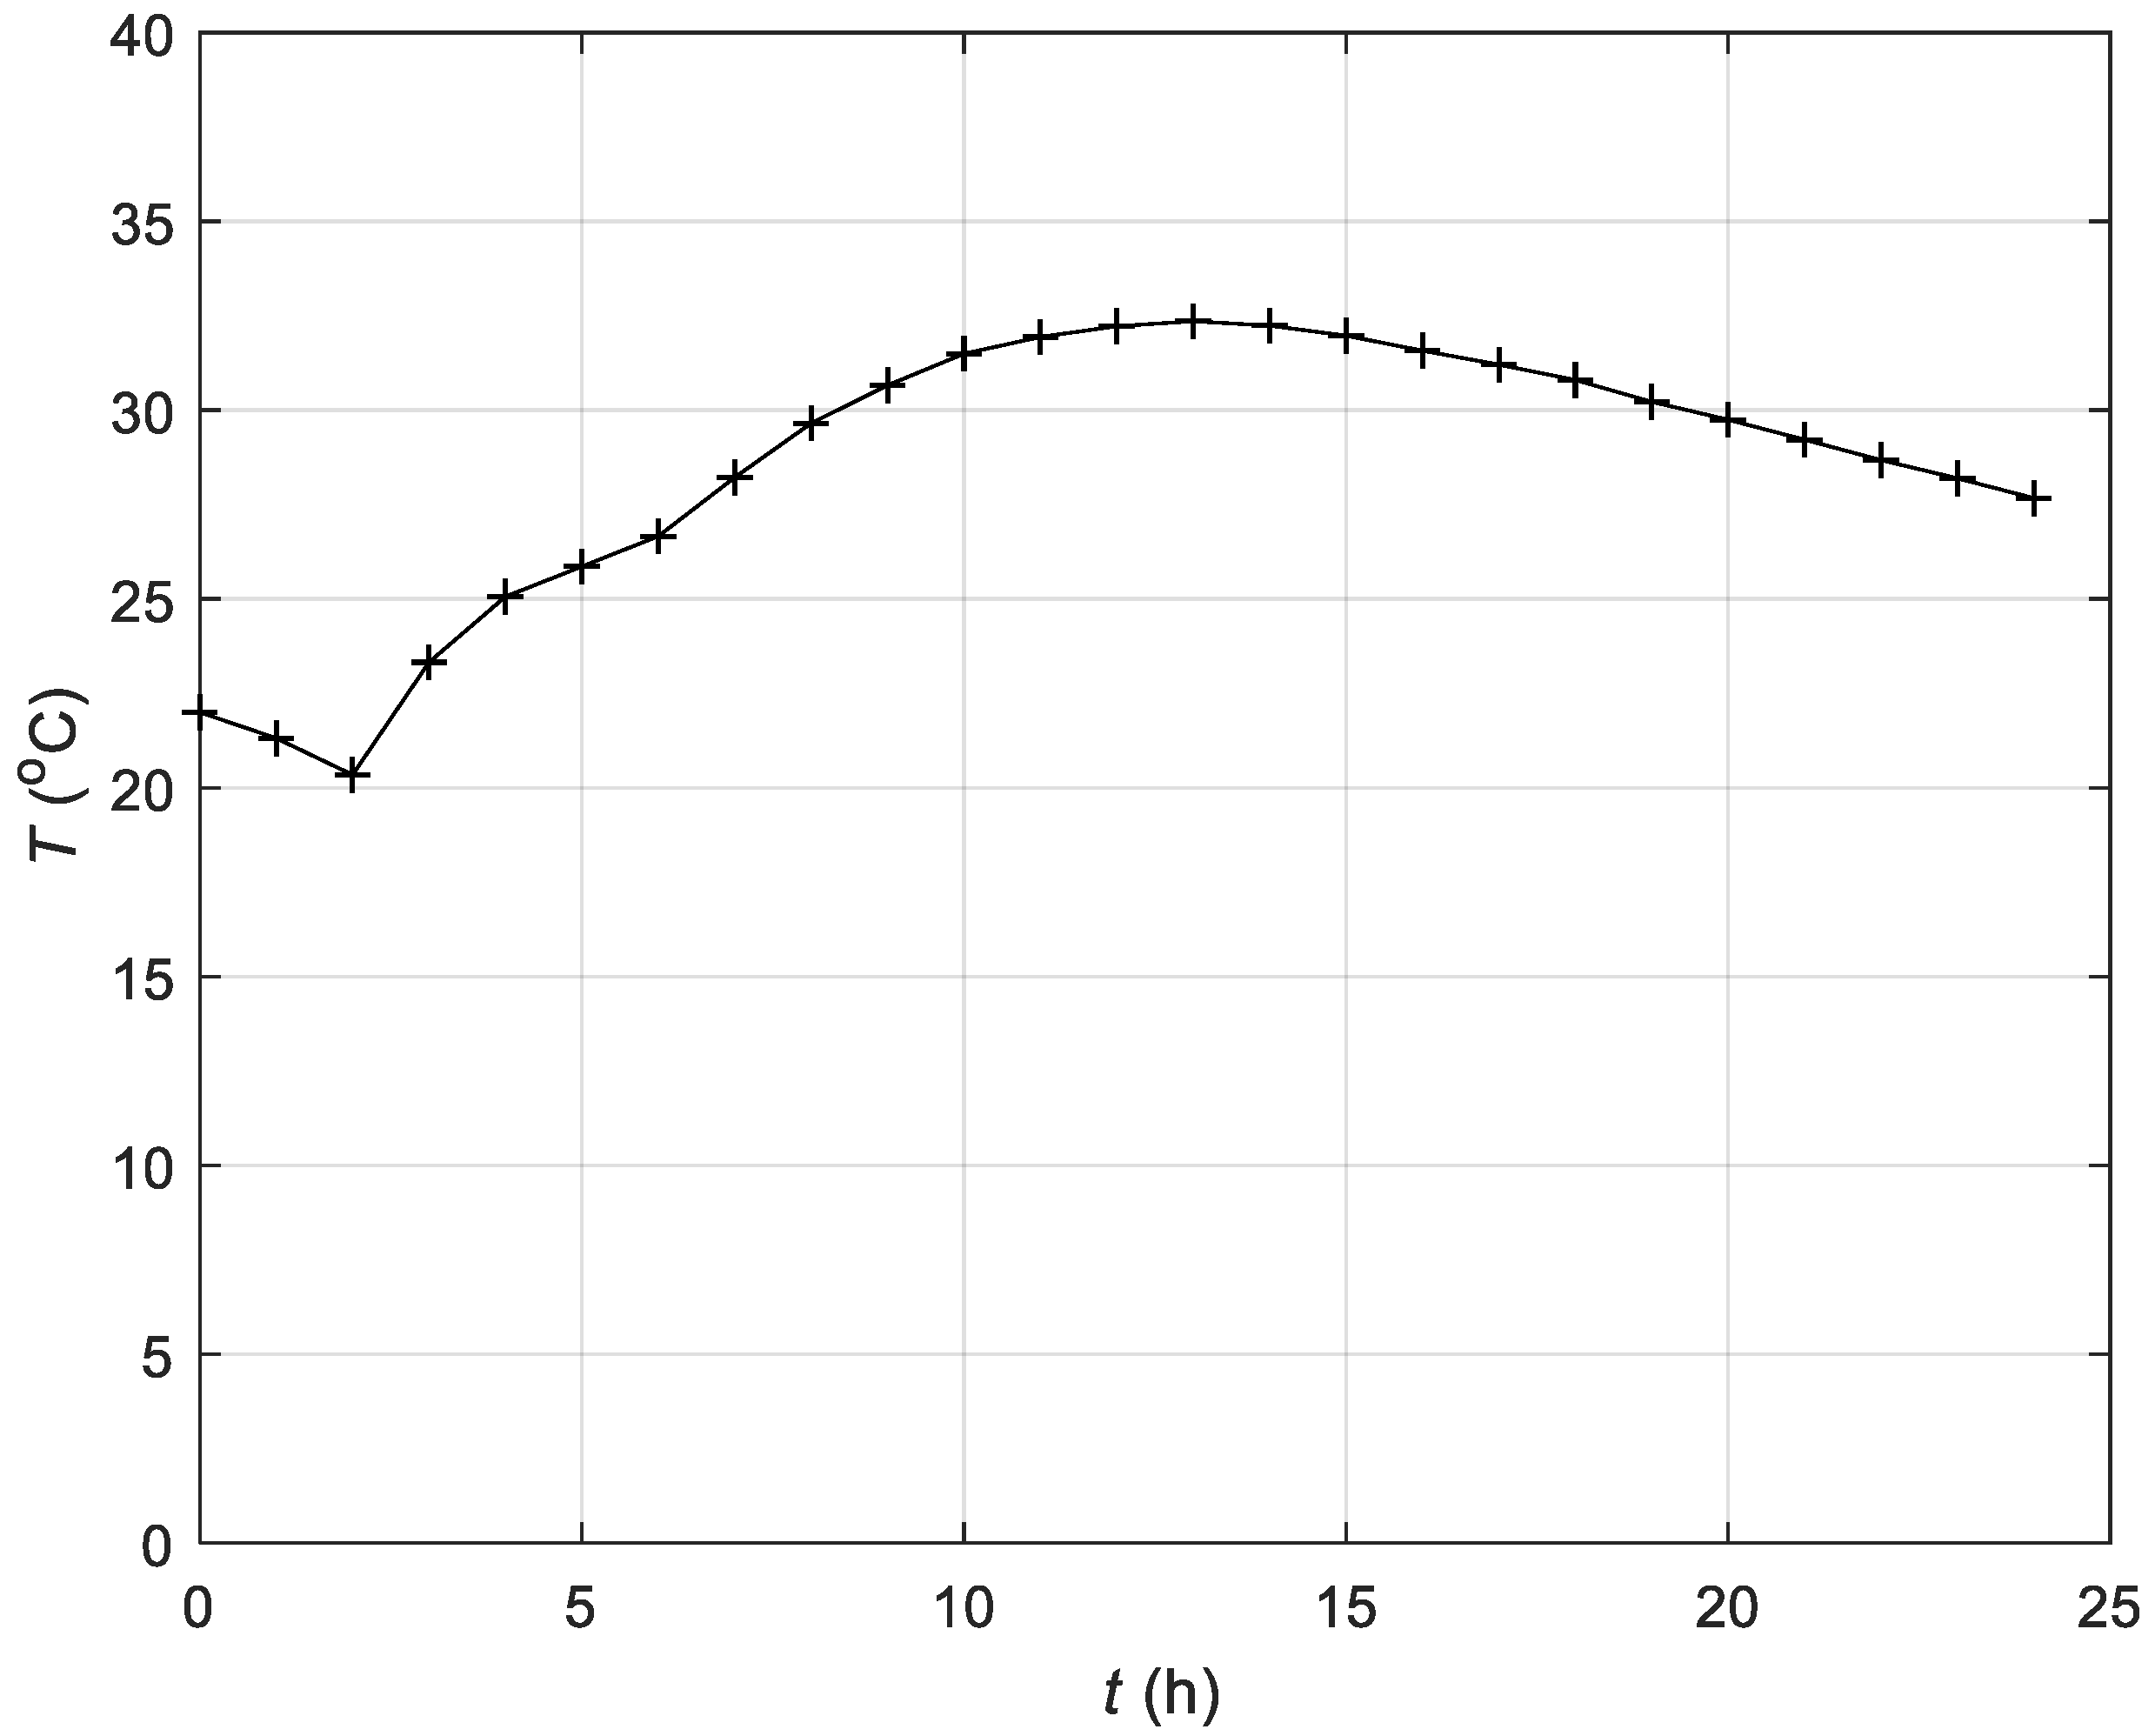
3.4. Experimental Results of the Control of the Fermentation Process in the Batch Bioreactor

The developed control system was used for the control of the fermentation process in a laboratory bioreactor. The measured course of the produced CO2 of the non-controlled bioreactor is shown in Figure 3. The task of the closed-loop control system was to ensure that the course of the measured CO2 concentration would be as close as possible to the reference course described with Equation (7). The reference CO2 concentration course and the measured CO2 course from the controlled batch bioreactor are shown in Figure 8.
Figure 8 shows clearly that the developed controller provides very good tracking of the actual CO2 concentration to the reference value. In this way, we made the fermentation process significantly more economical. The fermentation time was shortened significantly. The duration of the non-controlled fermentation was about 25 h (shown in Figure 3), and the duration of the controlled fermentation was approximately 15 h (shown in Figure 8). We also achieved an increase in fermentation product concentration of approx. 0.5 × 10⁻³ mol/L.
The improvement shown was achieved by controlling the temperature in the bioreactor. The time course of the temperature variation is shown in Figure 9. From this course, it is seen that a significant improvement of the fermentation process is possible with relatively small changes in temperature.

4. Conclusions

The paper describes the problem of automatic control of the fermentation process transient in a batch bioreactor. The main limitation is the requirement that the control system should be realized only with the standard equipment of the industrial batch bioreactors. The presented solution shows how the control of the fermentation process can be carried out using a standard heating system of batch bioreactor. The following contributions would be highlighted:
-
An experimental analysis of the batch bioreactor, and finding that it is possible to develop a control system based on temperature changes in the bioreactor;
-
Derivation of a new, enhanced model of the fermentation process in the batch bioreactor;
-
Identification of the parameters of the mathematical model utilizing the differential evolution optimization method;
-
Design of a closed-loop control system for a batch bioreactor;
-
Tuning of the controller parameters by means of selected objective functions.
The described solution is original, easy to implement, and validated with simulations and experiments. It is evident from the obtained experimental results that we succeeded in making the fermentation process considerably more efficient by using closed-loop control. The fermentation time was shortened by approximately 40 %, and the amount of probiotic beverage was increased by approximately 10%.
We estimate that the advanced concept will be used in such commercial systems in the near future.
We expect that the development in the field of closed-loop control for fermentation processes in batch bioreactors will intensify in the near future. It would be reasonable to implement advanced control methods for similar bioprocesses performed in batch bioreactors.

Author Contributions

Conceptualization, J.R., A.G. and D.P.; methodology, J.R., A.G. and D.P.; software, J.R.; validation, J.R.; formal analysis, J.R.; investigation, J.R., A.G. and D.P.; resources, J.R.; data curation, J.R. and D.P.; writing—original draft preparation, J.R. and A.G.; writing—review and editing, J.R., A.G. and D.P; visualization, J.R.; supervision, J.R.; project administration, J.R. and D.P.; funding acquisition, J.R. All authors have read and agreed to the published version of the manuscript.

Funding

This research received no external funding.

Institutional Review Board Statement

Not applicable.

Informed Consent Statement

Not applicable.

Data Availability Statement

The data presented in this study are available on request from the corresponding author.

Conflicts of Interest

The authors declare no conflict of interest.

References

  1. Aguirre-Ezkauriatza, E.J.; Aguilar-Yáñez, J.M.; Ramírez-Medrano, A.; Alvarez, M.M. Production of probiotic biomass (Lactobacillus casei) in goat milk whey: Comparison of batch, continuous and fed-batch cultures. Bioresour. Technol. 2010, 101, 2837–2844. [Google Scholar] [CrossRef] [PubMed]
  2. Wang, B.; Wang, Z.; Chen, T.; Zhao, X. Development of Novel Bioreactor Control Systems Based on Smart Sensors and Actuators. Front. Bioeng. Biotechnol. 2020, 8, 7. [Google Scholar] [CrossRef]
  3. Yang, J.-D.; Lu, C.; Stasny, B.; Henley, J.; Guinto, W.; Gonzalez, C.; Gleason, J.; Fung, M.; Collopy, B.; Benjamino, M.; et al. Fed-batch bioreactor process scale-up from 3-L to 2,500-L scale for monoclonal antibody production from cell culture. Biotechnol. Bioeng. 2007, 98, 141–154. [Google Scholar] [CrossRef] [PubMed]
  4. Liu, C.-T.; Erh, M.-H.; Lin, S.-P.; Lo, K.-Y.; Chen, K.-I.; Cheng, K.-C. Enrichment of two isoflavone aglycones in black soymilk by Rhizopus oligosporus NTU 5 in a plastic composite support bioreactor. J. Sci. Food Agric. 2016, 96, 3779–3786. [Google Scholar] [CrossRef] [PubMed]
  5. Xia, Y.; Chen, Y.; Liu, X.; Zhou, X.; Wang, Z.; Wang, G.; Xiong, Z.; Ai, L. Enhancement of antroquinonol production during batch fermentation using pH control coupled with an oxygen vector. J. Sci. Food Agric. 2019, 99, 449–456. [Google Scholar] [CrossRef] [PubMed] [Green Version]
  6. Alvarez, M.M.; Aguirre-Ezkauriatza, E.J.; Ramírez-Medrano, A.; Rodríguez-Sánchez, Á. Kinetic analysis and mathematical modeling of growth and lactic acid production of Lactobacillus casei var. rhamnosus in milk whey. J. Dairy Sci. 2010, 93, 5552–5560. [Google Scholar] [CrossRef] [PubMed]
  7. Wang, J.; Huang, J.; Jiang, S.; Zhang, J.; Zhang, Q.; Ning, Y.; Fang, M.; Liu, S. Parametric optimization and kinetic study of l-lactic acid production by homologous batch fermentation of Lactobacillus pentosus cells. Biotechnol. Appl. Biochem. 2020. [Google Scholar] [CrossRef]
  8. Zelle, R.M.; de Hulster, E.; Kloezen, W.; Pronk, J.T.; van Maris, A.J.A. Key Process Conditions for Production of C4 Dicarboxylic Acids in Bioreactor Batch Cultures of an Engineered Saccharomyces cerevisiae Strain. Appl. Environ. Microbiol. 2010, 76, 744–750. [Google Scholar] [CrossRef] [Green Version]
  9. Dumbrepatil, A.; Adsul, M.; Chaudhari, S.; Khire, J.; Gokhale, D. Utilization of molasses sugar for lactic acid production by Lactobacillus delbrueckii subsp. delbrueckii mutant Uc-3 in batch fermentation. Appl. Environ. Microbiol. 2008, 74, 333–335. [Google Scholar] [CrossRef] [Green Version]
  10. Schorsch, J.; Castro, C.C.; Couto, L.D.; Nobre, C.; Kinnaert, M. Optimal control for fermentative production of fructo-oligosaccharides in fed-batch bioreactor. J. Process Control 2019, 78, 124–138. [Google Scholar] [CrossRef] [Green Version]
  11. Li, S.; Cui, Y.; Zhou, Y.; Luo, Z.; Liu, J.; Zhao, M. The industrial applications of cassava: Current status, opportunities and prospects. J. Sci. Food Agric. 2017, 97, 2282–2290. [Google Scholar] [CrossRef] [PubMed]
  12. Jiang, H.-L.; He, Q.; He, Z.; Hemme, C.L.; Wu, L.; Zhou, J. Continuous Cellulosic Bioethanol Fermentation by Cyclic Fed-Batch Cocultivation. Appl. Environ. Microbiol. 2013, 79, 1580–1589. [Google Scholar] [CrossRef] [PubMed] [Green Version]
  13. Liu, Z.-Y.; Jia, D.-C.; Zhang, K.-D.; Zhu, H.-F.; Zhang, Q.; Jiang, W.-H.; Gu, Y.; Li, F.-L. Ethanol Metabolism Dynamics in Clostridium ljungdahlii Grown on Carbon Monoxide. Appl. Environ. Microbiol. 2020, 86. [Google Scholar] [CrossRef]
  14. Hernández-Cortés, G.; Córdova-López, J.A.; Herrera-López, E.J.; Morán-Marroquín, G.A.; Valle-Rodríguez, J.O.; Díaz-Montaño, D.M. Effect of pH, aeration and feeding non-sterilized agave juice in a continuous agave juice fermentation. J. Sci. Food Agric. 2010, 90, 1423–1428. [Google Scholar] [CrossRef]
  15. Plessas, S.; Kourkoutas, Y.; Psarianos, C.; Kanellaki, M.; Koutinas, A.A. Continuous baker’s yeast production using orange peel as promoting support in the bioreactor. J. Sci. Food Agric. 2006, 86, 407–414. [Google Scholar] [CrossRef]
  16. Thomsen, M.H.; Kiel, P. Selection of lactic acid bacteria for acidification of brown juice (grass juice), with the aim of making a durable substrate for L-lysine fermentation. J. Sci. Food Agric. 2008, 88, 976–983. [Google Scholar] [CrossRef]
  17. de Andrade, G.A.; Pagano, D.J.; Guzmán, J.L.; Berenguel, M.; Fernández, I.; Acién, F.G. Distributed Sliding Mode Control of pH in Tubular Photobioreactors. IEEE Trans. Control Syst. Technol. 2016, 24, 1160–1173. [Google Scholar] [CrossRef]
  18. Ramaswamy, S.; Cutright, T.J.; Qammar, H.K. Control of a continuous bioreactor using model predictive control. Process Biochem. 2005, 40, 2763–2770. [Google Scholar] [CrossRef]
  19. Yan, X.; Bergstrom, D.J.; Chen, X.B. Modeling of Cell Cultures in Perfusion Bioreactors. IEEE Trans. Biomed. Eng. 2012, 59, 2568–2575. [Google Scholar] [CrossRef]
  20. Peroni, C.V.; Kaisare, N.S.; Lee, J.H. Optimal control of a fed-batch bioreactor using simulation-based approximate dynamic programming. IEEE Trans. Control Syst. Technol. 2005, 13, 786–790. [Google Scholar] [CrossRef]
  21. Romoli, S.; Scaglia, G.J.E.; Serrano, M.E.; Godoy, S.A.; Ortiz, O.A.; Vega, J.R. Control of a Fed-Batch Fermenter Based on a Linear Algebra Strategy. IEEE Lat. Am. Trans. 2014, 12, 1206–1213. [Google Scholar] [CrossRef]
  22. Rodriguez, A.E.; Munoz, J.A.T.; Luna, R.; Correa, J.R.P.; Bocanegra, A.R.D.; Ramirez, H.S.; Castro, R. Robust Control for cultivation of microorganisms in a high density fed-batch bioreactor. IEEE Lat. Am. Trans. 2015, 13, 1927–1933. [Google Scholar] [CrossRef]
  23. Williams, D.; Yousefpour, P.; Wellington, E.M. On-line adaptive control of a fed-batch fermentation of Saccharomyces cerevisiae. Biotechnol. Bioeng. 1986, 28, 631–645. [Google Scholar] [CrossRef] [PubMed]
  24. Estakhrouiyeh, M.R.; Vali, M.; Gharaveisi, A. Application of fractional order iterative learning controller for a type of batch bioreactor. IET Control Theory Appl. 2016, 10, 1374–1383. [Google Scholar] [CrossRef]
  25. Arévalo, H.; Snáchez, F.; Ruiz, F.; Guerrero, D.; Patino, D.; Alméciga-Díaz, C.; Rodríguez-López, A. Gain-Scheduled Oxygen Concentration Control System for a Bioreactor. IEEE Lat. Am. Trans. 2018, 16, 2689–2697. [Google Scholar] [CrossRef]
  26. Chitra, M.; Pappa, N.; Abraham, A. Dissolved Oxygen Control of Batch Bioreactor using Model Reference Adaptive Control scheme. IFAC-Pap. 2018, 51, 13–18. [Google Scholar] [CrossRef]
  27. Ritonja, J.; Gorsek, A.; Pecar, D. Control of Milk Fermentation in Batch Bioreactor. Elektron. Elektrotechnika 2020, 26, 4–9. [Google Scholar] [CrossRef] [Green Version]
  28. Cinar, A.; Parulekar, S.J.; Undey, C.; Birol, G. Batch Fermentation: Modeling: Monitoring, and Control; CRC Press: Boca Raton, FL, USA, 2003; ISBN 978-0-8247-4849-4. [Google Scholar]
  29. Henson, M.A. Exploiting cellular biology to manufacture high-value products—Biochemical reactor modelling and control. IEEE Control Syst. Mag. 2006, 54–62. [Google Scholar]
  30. Goršek, A.; Ritonja, J.; Pečar, D. Mathematical model of CO2 release during milk fermentation using natural kefir grains. J. Sci. Food Agric. 2018, 98, 4680–4684. [Google Scholar] [CrossRef]
  31. Price, K.; Storn, R.M.; Lampinen, J.A. Differential Evolution: A Practical Approach to Global Optimization; Natural Computing Series; Springer: Berlin/Heidelberg, Germany, 2005; ISBN 978-3-540-20950-8. [Google Scholar]
  32. Åström, K.J.; Hägglund, T. PID Controllers: Theory, Design, and Tuning; The International Society for Measurement and Control: Research Triangle Park, NC, USA, 1988. [Google Scholar]
Figure 1. Block diagram of the complete mathematical model that takes into consideration the impact of temperature on the fermentation process in the batch bioreactor.
Applsci 11 00084 g001
Figure 2. Block diagram of the control system for the fermentation process in batch bioreactors.
Applsci 11 00084 g002
Figure 3. Time courses of the dissolved CO2 concentration c during the milk fermentation with kefir grains at constant temperature T = 22 °C obtained by measurements and with simulations with the identified Constant temperature model.
Applsci 11 00084 g003
Figure 4. Time courses of deviations of dissolved CO2 concentrations cΔ due to temperature change obtained by measurements in laboratory bioreactor and simulation with the identified temperature-dependent model.
Applsci 11 00084 g004
Figure 5. Time courses of dissolved CO2 concentration c obtained by measurements in laboratory bioreactor and simulation with the identified Complete model. The analyzed fermentation process was carried out in a time range from t = 0 to t = 3 h at temperature 22 °C, and from t = 3 h to t = 25 h at temperature 27 °C.
Applsci 11 00084 g005
Figure 6. The deviation between the response of the dissolved CO2 concentration of the identified complete model and the response of the dissolved CO2 concentration of the laboratory batch bioreactor at different moments of the fermentation process.
Applsci 11 00084 g006
Figure 7. Three-dimensional graph showing the dependence of the objective function J on the gain k and time constant Ti of the PI-controller.
Applsci 11 00084 g007
Figure 8. Reference and measured time courses of the CO2 when the proposed control system was used.
Applsci 11 00084 g008
Figure 9. Time course of bioreactor temperature required to control the fermentation process.
Applsci 11 00084 g009
Table 1. Measured initial values and identified parameters of the constant temperature model.
Measured Initial ValuesIdentified Parameters
X(0) = 6.0 × 10⁻⁴ g/Lμm = 6.0 h−1
S(0) = 3.7 × 10⁻³ g/LKm = 0.03 g/L
P(0) = 2.6 × 10⁻⁴ mol/Lα = 0.84
β = 0.01 h−1
Table 2. Quantitative assessment of the accuracy of the identified constant temperature model (deviation between simulated and measured response).
IndexValue
maximum absolute erroremax = 2.9125 × 10⁻⁴ mol/L
average absolute errorea = 8.0249 × 10⁻⁵ mol/L
integral square errorISE = 2.5640 × 10⁻⁷
integral absolute errorIAE = 1.991 × 10⁻³
Table 3. Identified parameters of the temperature-dependent model.
G1(s)G2(s)
k1 = 7.87 × 10⁻⁵k2 = 1.8
T1 = 800 sT1 = 5000 s
z = 0.36
Td = 0.2 s
Table 4. Quantitative assessment of the accuracy of the identified temperature-dependent model (deviation between simulated and measured response).
IndexValue
maximum absolute erroremax = 4.0220 × 10⁻⁵ mol/L
average absolute errorea = 1.5853 × 10⁻⁵ mol/L
integral square errorISE = 8.0573 × 10⁻⁹
integral absolute errorIAE = 3.6025 × 10⁻⁴
Table 5. Quantitative assessment of the accuracy of the identified model (deviation between simulated and measured valued).
IndexValue
maximum absolute erroremax = 2.9125 × 10⁻⁴ mol/L
average absolute errorea = 1.0027 × 10⁻⁴ mol/L
integral square errorISE = 3.7115 × 10⁻⁷
integral absolute errorIAE = 2.6139 × 10⁻³
Publisher’s Note: MDPI stays neutral with regard to jurisdictional claims in published maps and institutional affiliations.

