Featured Application
The results of this study can provide promising insights for the retailers both in physical and future virtual stores.
Abstract
Virtual reality (VR) in retailing (V-commerce) has been proven to enhance the consumer experience. Thus, this technology is beneficial to study behavioral patterns by offering the opportunity to infer customers’ personality traits based on their behavior. This study aims to recognize impulsivity using behavioral patterns. For this goal, 60 subjects performed three tasks—one exploration task and two planned tasks—in a virtual market. Four noninvasive signals (eye-tracking, navigation, posture, and interactions), which are available in commercial VR devices, were recorded, and a set of features were extracted and categorized into zonal, general, kinematic, temporal, and spatial types. They were input into a support vector machine classifier to recognize the impulsivity of the subjects based on the I-8 questionnaire, achieving an accuracy of 87%. The results suggest that, while the exploration task can reveal general impulsivity, other subscales such as perseverance and sensation-seeking are more related to planned tasks. The results also show that posture and interaction are the most informative signals. Our findings validate the recognition of customer impulsivity using sensors incorporated into commercial VR devices. Such information can provide a personalized shopping experience in future virtual shops.
1. Introduction
Imagine that you can go shopping, walk down the aisles, look at the products, interact with them, and purchase them without ever leaving your house. New shops based on virtual reality (VR) [1] aim to provide this opportunity.
Virtual reality is a multi-sensory experience created by the real-time production of graphics in a multi-dimensional framework, depicted in a display technology that provides the user with the possibility of immersing in a virtual environment [2]. The first virtual system was presented by Morton Heilig in the early 1960s using a recorded colored film and the ambient properties of sound and scent, but no interaction with the environment [3]. In recent years, this technology has been improved in several aspects such as interactive graphics, head tracking, and interactions between individuals [2]. These technological advancements have resulted in using different kinds of VR apparatus in behavioral studies [4], since this technology provides researchers with the possibility of studying scenarios under controlled laboratory conditions [5], and it permits time- and cost-efficient manipulation of behavioral variables in comparison with real situations [6].
Virtual experience in marketing (VEM) for research is a relatively new concept, but the phenomenon has been used for three decades. The use of VR technologies in retailing applications started in the late 1990s [7]. Pioneer VR studies explored the use of virtual environments to simulate physical shopping experiences using low immersive systems such as computer screens and traditional input devices, e.g., mouse and keyboard [8,9]. In the 2010s, the number of studies using VR interfaces increased, but most of them still relied on medium- or low-immersion displays, such as fish tank interfaces or large stereo-screen systems [7]. For instance, the powerwall setup (a large screen with stereoscopic vision), as a low-immersive stereoscopic, was used to investigate consumer reactions to VR technologies [10]. Some studies also created a 3D web-based virtual supermarket using a low-immersive desktop to research consumer reactions to marketing strategies, including price and product labeling [11], emotional responses to retail ambiance [12], and reactions to empty shelf space [13]. In a more immersive approach, Van Herpen et al. [14] simulated a virtual supermarket using three 42-inch LCD screens that created a 180° field of view. They used a choice task to compare using VR versus photographs of products. In this study, participants could navigate using a keyboard and mouse. Another fully immersive system that has been used in VEM studies is the head-mounted display (HMD), which blocks stimuli from the external world. This brilliant feature, which can provide simulated immersive experiences with a high sense of presence similar to the real world, has made VR an attractive tool for scientific study [15]. The first use of HMD interfaces in VEM was in 1995, to undertake supermarket redesigns with reduced costs [7]. Recently, this technology has attracted researchers’ attention. As an instance, Bigné et al. [16] compared subjects’ gaze patterns by presenting a 360° video in an HMD and a 3D display. This relatively new technology has been used in several studies of consumer behavior [17,18,19,20,21,22,23]; however, extensive research should still be performed to shed light on every aspect of consumer behavior in VEM.
The popularity of VR has increased in recent years in academic and commercial frameworks [24]. Additionally, several efforts have been made to take advantage of VR technologies to replicate the significant achievements of using the internet in commerce [25]. VR technology is playing a prominent role in the contemporary business landscape [26]. Hence, physical as well as online retailers are progressively considering employing VR to endure in the current competitive market and grasp new opportunities [27]. As tangible instances, Alibaba, one of the most renowned retailers, as well as Coca-Cola, McDonald’s, and IKEA are currently employing VR technology [28,29].
VEM properties, such as the sense of presence and transferability to reality [30,31,32], make it a suitable tool for studying human behavior. It is known that behavioral signals can reveal subconscious processes and psychological traits [4,33,34]. Thus, VEM can be used to track such signals to study and predict the psychological traits of shoppers as they interact with the virtual environment. Not only can such prediction be applied in the real environment, but it can also help retailers to provide personalized shopping experiences [18] as well as adaptive environments and advertisements [35] in VR-based retailing.
An important personality trait for investigation in VEM is impulsivity, since previous studies indicate that 39% of purchases are the result of impulsive buying [36]. Other studies show that about 50–70% of purchase decisions in supermarkets involve impulsive buying [37]. Impulsive buying is a complicated process in which shoppers decide to purchase immediately without considering the consequences [38]. Impulsive buying is conceived as a problem from the consumers’ point of view, but from the marketers’ perspective, it is a tactic to enhance the purchase rate [39,40]. In the late 1960s, Kollat and Willett [41] conducted one of the earliest studies of the relationship between impulsive buying and personality traits [42]. Although, the concept of impulsive buying was not new, in the early 1950s, some attempts were made to grasp the relation between impulsive buying and different product categories [43].
Impulse buying has been researched from two perspectives: the state of the mind created by the shopping environment [44] and the personality traits of consumers [45]. In this regard, several environmental cues have been studied to determine their effect on the consumer’s state of mind and whether these cues urge consumers to buy impulsively [46]. Other studies have investigated the influence of consumers’ impulsiveness on the intention to purchase [47,48]. To our knowledge, there has yet to be a study that investigates the relative effects of impulsivity on consumer behavior. Therefore, the goal of this paper is twofold: to examine the influence of impulsivity on consumer behavior using VR, and then, to analyze how behavioral patterns can predict impulsivity.
Impulsivity is an important psychological construct that appears in most major scales of personality [49]. In recent decades, several scales have been proposed to assess impulsivity [50,51,52,53]. Among them is the impulsivity behavior scale (I-8) [54], which is based on the conceptualization of this trait in [49]. It has been used in several studies [55,56,57]. The scale uses a questionnaire that indicates the impulsivity level of the subject in four dimensions: urgency, (lack of) premeditation, (lack of) perseverance, and sensation-seeking [57]. The trait of urgency is defined as the tendency to act rashly when distressed [58]. Premeditation means that the person tends to think and have a plan before acting [59]. Lack of perseverance is described as the inclination to quit tasks that are difficult or boring, and sensation-seeking is the need to look for novel, thrilling, or risky stimulation [60].
In behavioral studies, statistical inference and machine learning are the two most frequently used tools for analysis. However, researchers have become more inclined toward exploiting machine learning [61], which can learn from instances to predict the relationship between inputs and outputs [62]. This property can be applied to data gathered from several types of physiological or behavioral sensors such as eye-tracking, electroencephalography (EEG), heart rate variability (HRV), and functional magnetic resonance imaging (fMRI) [63]. Moreover, these methods can be applied to low-cost, noninvasive signals, which can be accessible through VR headgear such as 3D eye movement, gaze information [16], eye blink rate [64], head movement and orientation, controller (hand) movement, and orientation [19]. These signals can be highly informative. For instance, head and eye movement imply macro and micro levels of attention allocation, respectively [4], and eye-tracking represents visual perception and processing, which are related to human behavior, cognitive status, and psychological activities [33]. By tracking the head position in 2D, the navigational pattern of the shopping travel can be developed. This is an important signal since—based on the literature—up to 80% of a shopper’s in-store time is allocated to navigating [65].
Recent studies have been conducted in the VR environment to study impulsivity behavior. For instance, Ketoma et al. investigated impulsive buying by using a virtual grocery store implemented through an HMD. In this study, the analysis was performed based on post-interviews conducted after the VR experience [17]. A second study explored the impact of impulsivity on risky decisions through an immersive virtual reality game and physiological signals [66]. A third used self-assessment to investigate the impact of risky environments on the emerged level of impulsivity and sensation-seeking [67]. Although using VR in studies of consumer behavior is trending, to our knowledge, no research has been made to investigate and recognize the impacts of impulsivity on shopping behavior using virtual behavior tracking. Either the other works did not investigate behavioral signals or they did not focus on consumer behavior.
The current study has been conducted to examine the relationship between customers’ behavior while shopping and their impulsivity. Moreover, it has explored which kind(s) of behavior(s) could represent different subscales of impulsivity. To achieve this, it was necessary to define some tasks that could elicit certain types of behavior so customers could be distinguished based on their impulsivity levels. Hence, the research questions for this study are:
To what extent can shoppers’ impulsivity be predicted by their behaviors while shopping in virtual shops?
Which types of behaviors and signals are more informative for predicting shoppers’ impulsivity?
Which types of tasks elicit the discriminating human impulsivity behaviors?
Which types of feature sets can distinguish subscales of impulsivity?
2. Materials and Methods
2.1. Participants
For this experiment, 60 healthy individuals (30 females and 30 males) were hired by the European Immersive Neurotechnology’s Laboratory (LENI) of the Polytechnic University of Valencia (UPV) from outside of LENI. Three subjects were excluded because of the corruption of their recorded data, so the final sample had 57 subjects (27 females and 30 males with an average age of 25.12 and a standard deviation of 5.06 years). The experiment was conducted for 15 consecutive working days, and each participant spent an average of 45 min from preparation to the final stage. Informed consent was obtained from all subjects involved in the study, and the methods and experimental protocols were performed in accordance with the guidelines and regulations of the local ethics committee of UPV.
2.2. Research Design
2.2.1. Description of the Virtual Environments
To conduct this research, a virtual market that was 6 × 6 m2 and had three sections was designed. The first section, which covered most of the shelves, was dedicated to ordinary daily groceries such as milk, soda, and sauces with fake brands. The second section was a shelf of snacks, and the third was a shelf of sneakers. This virtual shop comprised 6 sets of joined shelves, which are marked with red numbers in Figure 1a. The total height of all the shelves was equal to 210 cm. The bottom shelf was 60 cm high, and it was located 30 cm above the ground. The middle and upper shelves were 55 cm high, and 10 cm was dedicated to the upper edge of the shelves (Figure 1b).
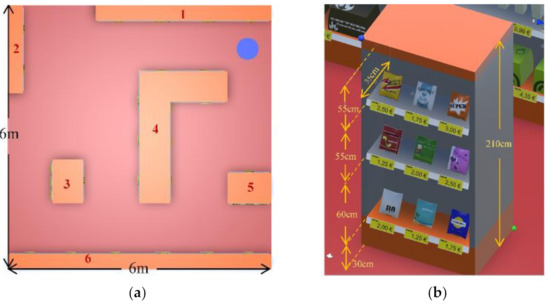
Figure 1.
(a) The positions of the 6 orange shelves and the blue circle on the 6 × 6 m2 floor plan of the virtual store. (b) The dimensions of the shelves in the virtual environment.
Participants could move inside the virtual environment with natural walking, since the dimensions of the virtual store were equal to that of the special tracking zone (Figure 2). The interaction was designed to be as natural as possible, and it consisted of picking, dropping, throwing, and buying. Additionally, the physical equations were used to try to simulate shadows and to make the movement of objects seem natural.
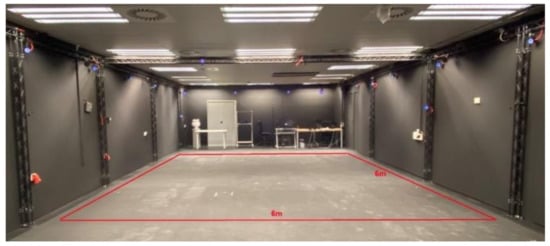
Figure 2.
The 6 × 6 m2 physical area of the virtual store for performing the experiments in the European Immersive Neurotechnology’s Laboratory (LENI) of the Polytechnic University of Valencia.
Several stages and tasks were designed to be performed, namely, pre-experiment contest and questionnaire, training task, calibration, exploration task, two planned tasks for buying snacks and a pair of sneakers, and post-experiment questionnaire.
2.2.2. The Training Task
Before the main tasks, the participants undertook a training task to become familiar with the interfaces. In this task, they learned how to interact with the objects, how to buy the objects, and how to understand which object they could not buy in the tasks of the experiment. To avoid any bias towards the contents and materials of the original tasks, the room was quite neutral, even the shape of the objects did not imply anything about the virtual store. In this task, participants could walk and interact with the objects. They could pick, drop, and throw all the objects, but they could buy only green objects (Figure 3). When they tried to buy a red object, an alarm sound was played in the integrated headphones in the HMD. When they bought green objects, a sound indicating accomplishment of the purchase played, and the object vanished.
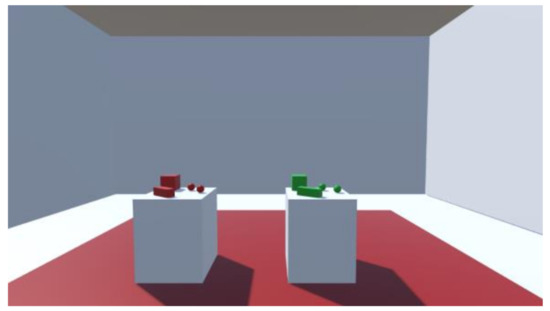
Figure 3.
A neutral room for training and preparation of the participants. The red objects can be manipulated but cannot be bought, and the green objects can be manipulated and bought.
2.2.3. The Exploration Task
At the beginning of this task, the HMD and headphones were readjusted on the participant’s head. Then, the integrated eye tracker in the HMD was calibrated. After calibration and reading the instructions about the duties and abilities during the task, the subjects started the task. They were instructed to navigate freely in the virtual store and interact with products with a time limit of 5 min. In this task, the participants were not allowed to buy the products. This task represents unplanned browsing behavior, in which the customer does not have a specific shopping list in his mind; the goal is to visit the shop. The tasks always started in the blue circle shown in Figure 4, and if the participant finished a task sooner than the planned time, he could go back to the blue circle. If participants ran out of time, they could not interact with the objects, and a message appeared in the virtual environment asking them to go back to the blue circle. The remaining time was shown on the virtual controller (Figure 4). After finishing the task, the participant in the blue circle answers a questionnaire embedded in the VR.
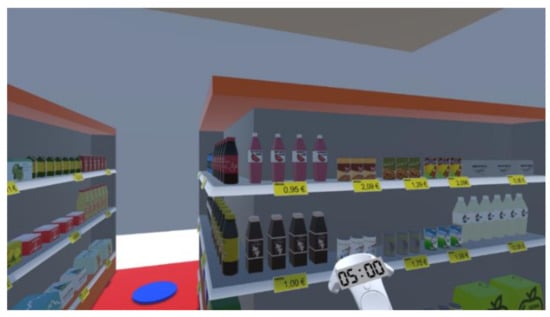
Figure 4.
The virtual store and the shelves are shown in the picture. The remaining time on the controller can be seen in the image.
2.2.4. The First Planned Task: Buying Snacks
This task simulates the behavior of the shoppers when they have a certain goal of shopping. They were asked to perform a forced search task in which they were to purchase some potato chips with a limited budget of EUR 5 given to them. Participants could purchase less than their maximum budgets. There was only one shelf containing the target products, which is shown in Figure 5. During the task, they could pick and read the details and drop all the products, but they could buy only snacks. After it was purchased, the product vanished, and they could not put it back.
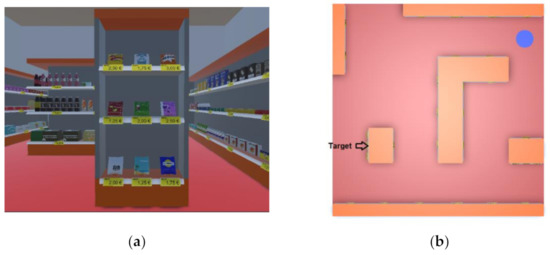
Figure 5.
(a) The virtual shelf containing the snacks, (b) the position of the target shelf in the virtual store.
2.2.5. The Second Planned Task: Buying Sneakers
Like the first planned task, participants were instructed to purchase a pair of sneakers with a limited budget of EUR 180. In this task, shoppers were told they could choose from different colors, types, and prices. Figure 6a shows the shelf containing the sneakers and their colors, prices, and locations, and Figure 6b shows the position of the target shelf in the virtual environment. The difference between the planned tasks is the type and the price of the products. The products in the first planned task did not require much time to think before taking a decision, but in the second planned task, it was assumed that the participant would think more before selecting a product.
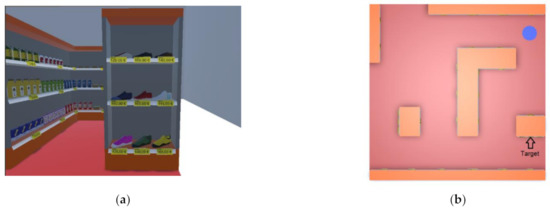
Figure 6.
(a) The virtual shelf containing the sneakers, (b) the position of the target shelf in the virtual store.
2.3. Apparatus and Signals
The virtual environment for the experiment was developed using the Unity 3D V2018.2.21f1 game engine [68] and immersively realized through HTC Vive Pro Head Mounted Display (HMD, HTC Corporation, Taoyuan City, Taiwan) [69]. Besides, the communication of the HMD and the four Base Stations in the corners of the special tracking zone were wireless, which facilitated the movement in the virtual shop. The participants could interact with the virtual objects using HTC Vive Pro Controllers (HTC Corporation, Taoyuan City, Taiwan).
During the experiment, sensors implemented in the HMD provided eye-tracking data with a nominal 120 Hz sample rate (practical in this experiment with mean 76.1 Hz and standard deviation of 8.4 Hz) with an accuracy of 0.5°–1.1° and head position data with a sampling rate equal to that of eye-tracking [70]. In addition, hand positions were provided by the sensors in the controllers. The Unity game engine recorded every event in the experiment, such as picking up and dropping the products and purchasing them.
2.4. Data Preprocessing
Data pre-processing was performed in two steps. In the first step, corrupted data were removed. In this phase, 3 participants were excluded. In the second step, features were extracted from the raw data. These analyses were done using Python 3.7 in the Jupyter environment.
Feature Extraction
Eye-tracking (ET) features extracted using simple kinematic definitions and data points were classified into fixation and saccades using the algorithm presented in [71]. Moreover, the following signals were defined. Navigation (NAV) is the projection of the head position in the 2D environment on the floor plan. Posture (POS) was 3D head and hand positions. All the interactions with the products such as picking, dropping, and purchasing were considered to be interaction (INT). Since the INT set had a low number of features, POS and INT features were considered in a single set, which was called POS & INT. To investigate the whole customer behavior, a feature set was created by putting all the ET, NAV, and POS & INT features together. This new feature set was named Human Behavior Tracking (HBT). After feature extraction, 33, 68, 157, and 258 features were extracted for ET, NAV, POS & INT, and HBT, respectively.
For all the features except INT, two main categories were defined. The first category, called general features, considered the whole experiment, and the second category, called zonal features, applied to areas of interest (AOI) and zones of interest (ZOI). In both categories, three sub-categories were defined: temporal, spatial, and kinematic, which are related to time, space, and movement, respectively. Hence, each set of features comprises six sub-categories: general–temporal, general–spatial, general–kinematic, zonal–temporal, zonal–spatial, and zonal–kinematic.
In terms of ZOIs, the floor plan was segmented into four ZOIs: Shelf, Adjacent, Near, and Far, based on the proximity to the shelves. As shown in Figure 7a–c, all the zones with the same color are in one ZOI and the rest of the areas fall into the Far zone. Besides, as it is presented in Figure 7d, in all the ZOIs except Far, the vertical dimension of the shop was divided into three levels, namely Up, Middle, and Down based on the levels of the shelves. By combining the ZOIs and levels, the space in the virtual shop was divided into AOIs, which are called Shelf_Down, Adjacent_Up, etc. Note that, in the Far zone, the whole vertical dimension is considered to be one level. This means that, in that ZOI, the entire space is considered to be one AOI, which is called “Far”.
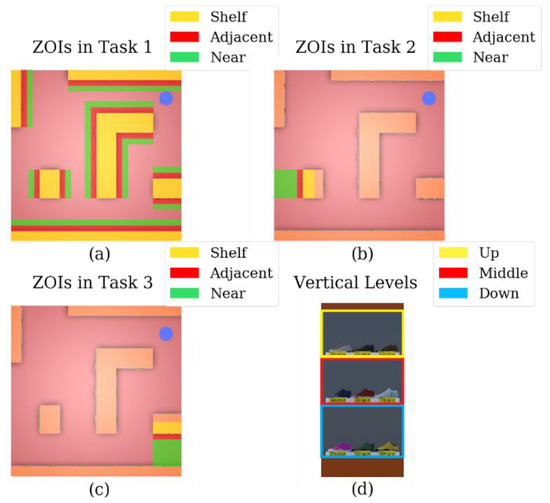
Figure 7.
(a) Segmentation of the virtual shop into several zones for (a) exploration (Task 1), (b) first planned task (Task 2), and (c) second planned task (Task 3). (d) Divisions in the vertical dimension for Shelf, Adjacent, and Near zones. In (a–c), the Far zone includes the store plan except for the areas that are selected for Shelf, Adjacent, and Near zones. In the Far zone, all the vertical dimensions are one level.
Using a genetic algorithm (GA) with a modified Fisher criterion as a cost function, the optimal widths of Adjacent and Near were set at 18 and 13 cm, respectively [19]. Note that the lengths of these two zones are fixed and equal to the lengths of the shelves. As an exception, in the planned tasks, the Near zone covers all the front space of the shelf after the Adjacent zone; only the width of Adjacent had to be determined. This width was also considered to be 18 cm, as it is found in the exploration task.
2.5. Characterization of Impulsivity
In this study, the goal was to classify shoppers based on their impulsivity. For this purpose, each participant completed the I-8 [54] questionnaire to indicate their impulsivity level. This model is defined by a 5-point Likert scale, where 5 means a high level of impulsivity. This questionnaire had 4 subscales to determine the levels of urgency, premeditation, perseverance, and risk-taking. The levels of urgency and sensation-seeking were in line with impulsivity, and the levels of perseverance and premeditation were inversely related to impulsivity. This means high scores in perseverance and premeditation imply a low level of impulsivity.
In this study, the shoppers were divided into two categories based on the median of total scores. The total scores were calculated by averaging the scores of the answers. Note that the scores for questions related to perseverance and premeditation were reversed by subtracting the score from 6.
2.6. Machine Learning
For classifying the shoppers based on their behavior inside the virtual market, a support vector machine (SVM) classifier and some other steps were used. They are described in the following sections.
2.6.1. Normalization
The features were normalized according to their maximum and minimum to be mapped in the interval of zero and one.
2.6.2. Feature Selection
When the number of features is high, the model is likely to become over-fitted on the training samples [72]. To avoid this issue, the dimensions of the feature sets are reduced in some steps. In the first step, the following criteria were applied to remove some features.
- The standard deviation of the feature vector is zero, or the normalized standard deviation to the mean is infinitesimal (σ/µ < 10−10);
- The feature is zero for over 80% of the subjects;
- The feature vector is highly correlated to another feature vector (Pearson correlation coefficient > 0.95).
In the second step, the features were reduced to a maximum of 50 using the area under the curve (AUC) filtering method [73]. This step did not apply to the sets of features with dimensions lower than 50, e.g., NAV.
In the last step, the features were reduced to a dimension between 5 and 10 by applying the backward elimination (BE) method. This step included the freedom to choose an optimal number between 5 and 10 features based on a cross-validation score. The classifier for performing BE was SVM.
2.6.3. Classification with Cross-Validation
The SVM classifier was chosen to model the behavior of the shoppers. Here, a cross-validation method, i.e., stratified K-folds cross-validation with 10 folds, was used. In this method, each subject could be used to test the accuracy of the model created with the rest of the observations. The folds helped to reduce the impact of diversity in the distributions of the testing and training data and tune the hyper-parameters, as summarized in Table 1. Besides, to reject the effects of variability, this procedure was repeated in 50 different runs. In the end, the average of the accuracy for all the repetitions was reported as the prediction accuracy. A pseudo-code for machine learning is summarized in Table 1.

Table 1.
Pseudo-code of the machine learning section.
3. Results
3.1. Impulsivity Self-Assessment
Applying the method outlined in the section on the characterization of impulsivity, the observations were divided into two significantly different groups based on their p-values in Table 2. Based on Table 2, the groups were balanced, and the centers for the populations in each group were different. The results for Cronbach’s alpha for all the scales and subscales except sensation-seeking were consistent for the sample.
Table 2.
Extracting the labels based on the questionnaires.
3.2. Recognition of Impulsivity
The machine learning results are presented in two sections: accuracy and feature selection.
3.2.1. Results for Accuracy
The results of machine learning for impulsivity and its subscales are reported in Table 3. Each scale has two columns consisting of the average of the accuracies and Cohen’s kappa coefficient, with their standard deviations in parentheses. The results are categorized based on each signal, and each signal is divided based on the tasks. Besides, for HBT data, the results of combinations of the tasks are reported in Table 4. In that table, to create the second row, the features of the two planned tasks are put together. In the same way, for the third row, all the tasks are combined. Moreover, the colors in these tables are chosen according to the kappa. Green represents the most accurate result, and red represents the least accurate result. Correspondingly, the higher the kappa, the closer the color is to green.
Table 3.
Accuracy of prediction of each scale and subscale.
Table 4.
Accuracy of prediction in each scale and subscale for a combination of tasks.
To recognize impulsivity, kappa quantities in Table 3 indicate that the best combination was the POS & INT signal and the exploration task with a kappa of 0.64. Additionally, the navigational pattern in this task could show a distinction between the different levels of impulsivity. Moreover, the exploration task could elicit impulsivity and provide a more precise classification overall. For its part, the ET signal did not provide an acceptable level of discrimination. Based on Table 4, combining the signals in HBT improved the kappa by more than 10%, but combining all the tasks did not improve kappa by a considerable amount (less than 3%). In addition, as Table 3 shows, the highest kappa achieved in the first and second planned tasks separately was 0.36, but combining the second and third tasks and using HBT data yielded a kappa of 0.56.
Considering the trait of urgency, Table 2 shows that the best signal was POS & INT in the second planned task with kappa equal to 0.44. According to Table 3, when the second planned task was performed, urgency could be predicted by any of the three signals. However, in the exploration task, none of the signals recognized this trait. Table 4 suggests that to recognize this trait, combining the signals and the tasks can improve the results by a considerable percentage (more than 18%).
In the case of premeditation, the kappa quantities in Table 3 show that ET and NAV signals failed to create any distinction in the levels of that trait. However, the POS & INT signal provided more acceptable results in the exploration task with kappa equal to 0.39. Based on Table 4, combining the signals and the tasks led to considerable improvement in kappa, such that premeditation could be predicted in almost all the tasks. Hence, to predict premeditation, Table 4 suggests considering all the signals together; otherwise, the results will be poor, according to Table 3.
For the trait of perseverance, Table 3 indicates that it could not be recognized by ET and NAV signals, and the best result belonged to the POS & INT signal in the second planned task, which was relatively weak (with a kappa equal to 0.38). On the other hand, Table 4 shows an improvement in kappa of more than 65% by combining the planned tasks and using all the signals together. Moreover, if the exploration task is also included in the prediction, the improvement in kappa is around 79%. This result suggests to use all three kinds of tasks and all the signals together to recognize perseverance.
Of all the dimensions in Table 3, sensation-seeking was the easiest trait to predict. According to the kappa amounts in that table, POS & INT and ET signals predicted the level of sensation-seeking successfully in almost all the tasks. However, the NAV signal produced weak results (less than 0.31 in kappa). Moreover, Table 4 shows that using both planned tasks and combining the signals improved the best result in Table 3 (25% improvement by yielding a kappa of 0.56). However, combining the exploration task with the other tasks did not provide any notable improvement (only 3%).
3.2.2. Results of Feature Selection
The results for feature selection are shown in Figure 8; Figure 9. These two figures represent the normalized number of the occurrences of features extracted from the signals in each category in 50 runs.
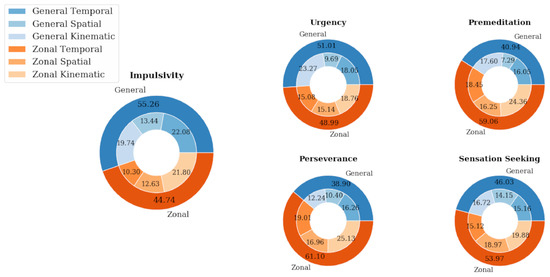
Figure 8.
Percentages of selected features in 50 runs according to the first category. The number of occurrences in each category is normalized by the total number of features in the corresponding category.
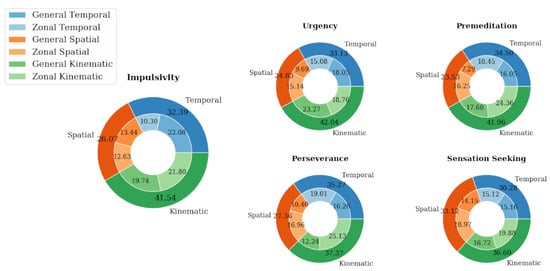
Figure 9.
Percentages of selected features in 50 runs according to the second category. The number of occurrences in each category is normalized by the total number of features in the corresponding category.
To recognize impulsivity, Figure 8 shows that general features, with a selection frequency of 55.26%, contributed more than zonal features. Additionally, this figure shows that among the general features, the temporal features were more important with 22.08% occurrences. The kinematic category was second in rank. On the other hand, Figure 9 shows that kinematic features in total were selected more, with 41.54% of all the selected features, and a bigger portion of them belonged to the zonal category. The kinematic category became dominant because the margin between the kinematic and temporal categories was slim in the general features.
For the urgency trait, the zonal and general features contributed almost equally—51.01 and 48.99%, according to Figure 8. In both categories, kinematic features dominated. Figure 9 also confirms that the kinematic category had the highest number of selections with 42.04% of the occurrences.
4. Discussion
4.1. Results Discussion
This study was conducted to investigate the possibility that impulsivity (based on the I-8 model) could be predicted using the behavior of consumers while they shopped. The results showed that POS & INT features were the best signal for predicting impulsivity with a kappa equal to 0.64 in the exploration task. That was the best result amongst all the investigated signals. The results also showed that impulsivity and body posture are strongly correlated. This is in line with previous studies that showed that body posture could affect impulsive buying [74].
Moreover, the exploration task was very informative for revealing impulsivity. That is logical, since impulsive purchases happen when the customer decides to buy a product suddenly—not when he has a target product or a purchase plan. On the other hand, general category and kinematic features were more selected for impulsivity recognition. This means that impulsivity changes the overall shopping behavior considering the whole shopping time.
For the trait of urgency, the planned task of buying sneakers was more informative. In that task, the shoppers were told to buy only one pair of sneakers. Those are purchased only occasionally, and they have relatively high prices. However, in the second task, the participants could choose more than one daily cheap product. It seems that purchasing sneakers put more emotional pressure on the shoppers, and this, in turn, elicited the trait of urgency, which is the tendency to act rashly in response to heightened effect. This impact could be recognized in all the signals recorded from the participants. This means that if the task is chosen carefully, urgency can be clearly recognized in ET, NAV, and POS & INT signals, with POS & INT more discriminative than the other two signals.
Premeditation was the hardest trait to predict. According to our findings, to recognize this trait, the combination of all the tasks and signals was required. The results show that premeditation had a low impact on the behavior of the person. However, this trait, which is related to having a plan before doing a task, was evoked more by the exploration task. It can be inferred that when there is a plan to make a purchase, all the customers act similarly, but when there is no prior purchase plan, individuals with a high level of premeditation face a new situation and act differently. Furthermore, this trait is correlated with zonal and kinematic features. It seems when shoppers are in the zone of interest and must take a decision, they act differently if their personality requires them to have a plan. Otherwise, this trait does not change the behavior in the rest of the task period significantly.
On the second level of difficulty of prediction, perseverance required all the signals and the tasks to be combined. However, the POS & INT signal was more informative than the others. Besides, the second and then the first planned task evoked perseverance more than the exploration task. Additionally, the combination of these two tasks could improve kappa by a considerable amount. This trait is related to following a plan to the end. Hence, planned tasks elicit this trait more, since an exploration task has no plan to accomplish. Moreover, zonal features contributed more toward recognizing this trait. This is because the person accomplished the plan in the zones of interest.
In this study, the easiest trait to predict was sensation-seeking, since it could be recognized in all the tasks and through two out of three signals, i.e., ET and POS & INT signals. Regarding the tasks, this result can be justified by the fact that there are risks and novel senses to be explored. On the other hand, this trait affects behavior more when the person is in the zones of interest, based on our findings.
By observing the study as a whole, HBT signals, including eye-tracking, body posture, navigation, and interaction can reveal impulsivity and very likely other personality traits. In addition, the results show that combining tasks improves the accuracy of the predictions. Based on our findings, the best signal for recognizing impulsivity and its subscales is POS & INT, with ET at the second level. In addition, the best type of features to extract was the kinematic category. Overall, it can be inferred that kinematic features in all the dimensions were selected more, which in turn, conveys that they were more informative. Moreover, regarding the zonal and general categorization for recognizing premeditation, perseverance, and sensation-seeking, zonal features were more informative. This result in impulsivity and urgency was the opposite. Hence, it cannot be inferred that since zonal features were more important in most of the subscales, impulsivity should follow the same pattern. That can be justified, because impulsive behavior can happen during the whole shopping journey—not just in choosing products impulsively but also in impulsive turns, changes in eye direction, etc. Urgency is also a trait that the person shows when feeling the shortage of time, which is related to the whole task. On the contrary, premeditation, perseverance, and sensation-seeking are more related to product selection, since if there is no product to select, there is no need for a prior plan, no task to be completed, and no risk to be taken, and product selection happens mostly in the areas and zones of interest. On the other hand, humans’ traits are very complex and are not linearly dependent on each other, even if they are highly correlated with each other. Hence, if we consider the nonlinear relationship between impulsivity and its subscales, we should not expect a direct relationship between them.
4.2. Limitations
Along with the achievements of this study, we faced some limitations. First, the number of subjects (60) was low because of cost limitations. This number restricted us to using simple models such as SVM, K nearest neighbor (KNN), and decision tree classifier (DTC), and we selected SVM as our machine learning solution. With a higher number of participants in the future, it will be plausible to use more sophisticated machine learning methods such as neural networks or deep learning methods to achieve more accurate results. Moreover, self-assessment methods for examining personality traits have limitations. In those methods, the person may be unable or unwilling to respond correctly. Besides, there are some technological limitations of the current performance of HMDs, such as vergence-accommodation conflict, which happens when the brain identifies a discrepancy between the distance of a virtual 3D object and the focusing distance needed for the eye to perceive the object [75], and the screen-door effect, which consists of observing the mesh between pixels in the near digital screens [76].
5. Conclusions and Future Research
The main achievement of this study is that using only noninvasive signals such as eye tracking or head and hand position, which can be easily be obtained through VR facilities, consumer impulsivity and its subscales can be predicted. This will help to tackle one of the emerging obstacles that future virtual retailers will face. Using these findings, in future virtual shops, retailers can provide a pleasant personalized shopping experience for their customers, which in turn, increases the enjoyment of shopping. This method can be extended to other personality traits, and it can be transferred to physical stores. In the future, this kind of research can be conducted with higher resolution devices to address the limitation of the screen-door effect. Moreover, the same methodology can be replicated in the real stores with real customers using augmented reality glasses and body tracker cameras. This would increase the number of participants and ecological validity. On the other hand, this methodology likely could be used to predict demographic features of customers such as age and gender. Considering that for shopping in virtual shops, it is not required to exit your home, it will be a great help for elderly and disabled individuals to find their target products in a shorter period, and this is feasible through personalizing the shopping experience. In the future, it is recommended to acquire data on traits through games or electrophysiological signals in the research environment and noninvasive signals such as HBT in commercial environments to cross-check the assessment results.
Author Contributions
Conceptualization, M.M., J.M.-M., J.K., J.G. and M.A.; methodology, M.M., J.M.-M. and J.K.; software, M.M.; validation, M.M., J.M.-M. and J.K.; formal analysis, M.M. and J.M.-M.; investigation, M.M., J.M.-M. and J.K.; resources, M.A.; data curation, M.M., J.M.-M. and J.K.; writing—original draft preparation, M.M., J.M.-M. and J.K.; writing—review and editing, M.M., J.M.-M., J.K., J.G., I.A.C.G. and M.A.; visualization, M.M., J.M.-M. and J.K.; supervision, J.M.-M., J.G. and M.A.; project administration, M.A.; funding acquisition, M.A. All authors have read and agreed to the published version of the manuscript.
Funding
This research was supported by “The European Commission (Project RHUMBO H2020-MSCA-ITN-2018-813234)”, “The Generalitat Valenciana funded project Rebrand with grant number PROMETEU/2019/105”, and “The European Regional Development Fund program of the Valencian Community 2014–2020 project Interfaces de realidad mixta aplicada a salud y toma de decisiones with grant number IDIFEDER/2018/029”.
Institutional Review Board Statement
The study obtained ethical approval by the Ethical Committee of the Polytechnic University of Valencia (Protocol code: P01_04_06_20).
Informed Consent Statement
Informed consent was obtained from all subjects involved in the study.
Data Availability Statement
The data presented in this study are available on request from the corresponding author. The data are not publicly available due to restrictions on privacy policy on sensitive data categories.
Conflicts of Interest
The authors declare no conflict of interest.
References
- Meißner, M.; Pfeiffer, J.; Peukert, C.; Dietrich, H.; Pfeiffer, T. How virtual reality affects consumer choice. J. Bus. Res. 2020, 117, 219–231. [Google Scholar] [CrossRef]
- Earnshaw, R.A. Virtual Reality Systems; Academic Press: Cambridge, MA, USA, 2014. [Google Scholar]
- Li, D.; Hu, X.; Zhang, G.; Duan, H. Hot-Redundancy CPCI Measurement and Control System Based on Probabilistic Neural Networks. In Advances in Neural Networks—ISNN 2016; Cheng, L., Liu, Q., Ronzhin, A., Eds.; Springer International Publishing: Cham, Switzerland, 2016; pp. 356–364. [Google Scholar]
- Xi, N.; Hamari, J. VR shopping: A review of literature. In Proceedings of the 25th Americas Conference on Information Systems (AMCIS), Cancun, Mexico, 15–17 August 2019; pp. 1–10. [Google Scholar]
- Mar, J.; Llinares, C.; Guixeres, J.; Alcañiz, M. Emotion Recognition in Immersive Virtual Reality: From Statistics to Affective Computing. Sensors 2020, 20, 5163. [Google Scholar] [CrossRef]
- Alcañiz, M.; Baños, R.; Botella, C.; Rey, B. The emma project: Emotions as a determinant of presence. Psychology J. 2003, 1, 141–150. [Google Scholar]
- Alcañiz, M.; Bigné, E.; Guixeres, J. Virtual reality in marketing: A framework, review, and research agenda. Front. Psychol. 2019, 10, 1–15. [Google Scholar] [CrossRef]
- Gold, L.N. Virtual Reality Now a Research Reality. Mark. Res. 1993, 5, 50–51. [Google Scholar]
- Hoffman, D.L.; Novak, T.P. A new marketing paradigm for electronic commerce. Inf. Soc. 1997, 13, 43–54. [Google Scholar] [CrossRef]
- Pantano, E.; Servidio, R. Modeling innovative points of sales through virtual and immersive technologies. J. Retail. Consum. Serv. 2012, 19, 279–286. [Google Scholar] [CrossRef]
- Waterlander, W.E.; Jiang, Y.; Steenhuis, I.H.M.; Ni Mhurchu, C. Using a 3D virtual supermarket to measure food purchase behavior: A validation study. J. Med. Internet Res. 2015, 17, e107. [Google Scholar] [CrossRef]
- Massara, F.; Liu, S.S.; Melara, R.D. Adapting to a retail environment: Modeling consumer-environment interactions. J. Bus. Res. 2010, 63, 673–681. [Google Scholar] [CrossRef]
- Van Herpen, E.; Pieters, R.; Zeelenberg, M. When demand accelerates demand: Trailing the bandwagon. J. Consum. Psychol. 2009, 19, 302–312. [Google Scholar] [CrossRef]
- Van Herpen, E.; van den Broek, E.; van Trijp, H.C.M.; Yu, T. Can a virtual supermarket bring realism into the lab? Comparing shopping behavior using virtual and pictorial store representations to behavior in a physical store. Appetite 2016, 107, 196–207. [Google Scholar] [CrossRef]
- Chicchi Giglioli, I.A.; Pravettoni, G.; Sutil Martín, D.L.; Parra, E.; Raya, M.A. A Novel Integrating Virtual Reality Approach for the Assessment of the Attachment Behavioral System. Front. Psychol. 2017, 8, 959. [Google Scholar] [CrossRef]
- Bigné, E.; Alcañiz, M.; Guixeres, J. Visual Attention in Virtual Reality Settings: An Abstract. In Finding New Ways to Engage and Satisfy Global Customers; Rossi, P., Krey, N., Eds.; Springer International Publishing: Cham, Switzerland, 2019; pp. 253–254. [Google Scholar]
- Ketoma, V.K.; Schäfer, P.; Meixner, G. Development and evaluation of a virtual reality grocery shopping application using a multi-kinect walking-in-place approach. Adv. Intell. Syst. Comput. 2018, 722, 368–374. [Google Scholar] [CrossRef]
- Meißner, M.; Pfeiffer, J.; Pfeiffer, T.; Oppewal, H. Combining virtual reality and mobile eye tracking to provide a naturalistic experimental environment for shopper research. J. Bus. Res. 2019, 100, 445–458. [Google Scholar] [CrossRef]
- Moghaddasi, M.; Khatri, J.; Llanes-Jurado, J.; Spinella, L.; Marín-Morales, J.; Guixeres, J.; Alcañiz, M. Segmentation of Areas of Interest Inside a Virtual Reality Store. In HCI International 2020—Posters; Stephanidis, C., Antona, M., Eds.; Springer International Publishing: Cham, Switzerland, 2020; pp. 92–98. [Google Scholar]
- Speicher, M.; Hell, P.; Daiber, F.; Simeone, A.; Krüger, A. A virtual reality shopping experience using the apartment metaphor. In Proceedings of the 2018 International Conference on Advanced Visual Interfaces, Castiglione della Pescaia, Italy, 29 May–1 June 2018. [Google Scholar] [CrossRef]
- Siegrist, M.; Ung, C.Y.; Zank, M.; Marinello, M.; Kunz, A.; Hartmann, C.; Menozzi, M. Consumers’ food selection behaviors in three-dimensional (3D) virtual reality. Food Res. Int. 2019, 117, 50–59. [Google Scholar] [CrossRef]
- Liang, H.N.; Lu, F.; Shi, Y.; Nanjappan, V.; Papangelis, K. Evaluating the effects of collaboration and competition in navigation tasks and spatial knowledge acquisition within virtual reality environments. Futur. Gener. Comput. Syst. 2019, 95, 855–866. [Google Scholar] [CrossRef]
- Khatri, J.; Moghaddasi, M.; Llanes-Jurado, J.; Spinella, L.; Marín-Morales, J.; Guixeres, J.; Alcañiz, M. Optimizing Virtual Reality Eye Tracking Fixation Algorithm Thresholds Based on Shopper Behavior and Age. In HCI International 2020—Posters; Stephanidis, C., Antona, M., Eds.; Springer International Publishing: Cham, Switzerland, 2020; pp. 64–69. [Google Scholar]
- Cipresso, P.; Giglioli, I.A.C.; Raya, M.A.; Riva, G. The past, present, and future of virtual and augmented reality research: A network and cluster analysis of the literature. Front. Psychol. 2018, 9, 1–20. [Google Scholar] [CrossRef]
- Lui, T.W.; Piccoli, G.; Ives, B. Marketing Strategies in Virtual Worlds. Data Base Adv. Inf. Syst. 2007, 38, 77–80. [Google Scholar] [CrossRef]
- Farah, M.F.; Ramadan, Z.B.; Harb, D.H. The examination of virtual reality at the intersection of consumer experience, shopping journey and physical retailing. J. Retail. Consum. Serv. 2019, 48, 136–143. [Google Scholar] [CrossRef]
- Bonetti, F.; Warnaby, G.; Quinn, L. Augmented Reality and Virtual Reality in Physical and Online Retailing: A Review, Synthesis and Research Agenda. In Augmented Reality and Virtual Reality: Empowering Human, Place and Business; Jung, T., Tom Dieck, M.C., Eds.; Springer International Publishing: Cham, Switzerland, 2018; pp. 119–132. ISBN 978-3-319-64027-3. [Google Scholar]
- Stone, M.; D’Onfro, J. The Inspiring Life Story of Alibaba Founder Jack Ma, Now the Richest Man in China. Business Insider 2014, 2. Available online: https://www.businessinsider.com/the-inspiring-life-story-of-alibaba-founder-jack-ma-2014-10 (accessed on 10 January 2021).
- Hollebeek, L.D.; Clark, M.K.; Andreassen, T.W.; Sigurdsson, V.; Smith, D. Virtual reality through the customer journey: Framework and propositions. J. Retail. Consum. Serv. 2020, 55, 102056. [Google Scholar] [CrossRef]
- Marín-Morales, J.; Higuera-Trujillo, J.L.; Greco, A.; Guixeres, J.; Llinares, C.; Gentili, C.; Scilingo, E.P.; Alcañiz, M.; Valenza, G. Real vs. immersive-virtual emotional experience: Analysis of psycho-physiological patterns in a free exploration of an art museum. PLoS ONE 2019, 14, e0223881. [Google Scholar] [CrossRef] [PubMed]
- Marín-Morales, J.; Higuera-Trujillo, J.L.; De-Juan-Ripoll, C.; Llinares, C.; Guixeres, J.; Iñarra, S.; Alcañiz, M. Navigation Comparison between a Real and a Virtual Museum: Time-dependent Differences using a Head Mounted Display. Interact. Comput. 2019, 31, 208–220. [Google Scholar] [CrossRef]
- Lehmann, K.S.; Ritz, J.P.; Maass, H.; Çakmak, H.K.; Kuehnapfel, U.G.; Germer, C.T.; Bretthauer, G.; Buhr, H.J. A prospective randomized study to test the transfer of basic psychomotor skills from virtual reality to physical reality in a comparable training setting. Ann. Surg. 2005, 241, 442–449. [Google Scholar] [CrossRef] [PubMed]
- Tian, P.; Wang, Y.; Lu, Y.; Zhang, Y.; Wang, X.; Wang, Y. Behavior analysis of indoor escape route-finding based on head-mounted vr and eye tracking. In Proceedings of the 2019 International Conference on Internet of Things (iThings) and IEEE Green Computing and Communications (GreenCom) and IEEE Cyber, Physical and Social Computing (CPSCom) and IEEE Smart Data (SmartData), Atlanta, GA, USA, 14–17 July 2019; pp. 422–427. [Google Scholar] [CrossRef]
- Fuentes-Hurtado, F.; Diego-Mas, J.A.; Naranjo, V.; Alcañiz, M. Finding the Importance of Facial Features in Social Trait Perception. In Intelligent Data Engineering and Automated Learning—IDEAL 2018; Yin, H., Camacho, D., Novais, P., Tallón-Ballesteros, A.J., Eds.; Springer International Publishing: Cham, Switzerland, 2018; pp. 35–45. [Google Scholar]
- Pfeiffer, J.; Pfeiffer, T.; Meißner, M.; Weiß, E. Eye-Tracking-Based Classification of Information Search Behavior Using Machine Learning: Evidence from Experiments in Physical Shops and Virtual Reality Shopping Environments. Inf. Syst. Res. 2020. [Google Scholar] [CrossRef]
- Lin, C.-H.; Chuang, S.-C. The Effect of Individual Differences on Adolescents’ Impulsive Buying Behavior. Adolescence 2005, 40, 551–558. [Google Scholar]
- Hussain, S.; Siddiqui, D.A. The Influence of Impulsive Personality Traits and Store Environment on Impulse Buying of Consumer in Karachi. Int. J. Bus. Adm. 2019, 10, 50. [Google Scholar] [CrossRef]
- Zaman, S.I.; Jalees, T.; Jiang, Y.; Kazmi, S.H.A. Testing and incorporating additional determinants of ethics in counterfeiting luxury research according to the theory of planned behavior. Psihologija 2018, 51, 163–196. [Google Scholar] [CrossRef]
- Miao, M.; Jalees, T.; Qabool, S.; Zaman, S.I. The effects of personality, culture and store stimuli on impulsive buying behavior: Evidence from emerging market of Pakistan. Asia Pacific J. Mark. Logist. 2019, 32, 188–204. [Google Scholar] [CrossRef]
- Akram, U.; Hui, P.; Kaleem Khan, M.; Tanveer, Y.; Mehmood, K.; Ahmad, W. How website quality affects online impulse buying: Moderating effects of sales promotion and credit card use. Asia Pacific J. Mark. Logist. 2018, 30, 235–256. [Google Scholar] [CrossRef]
- Kollat, D.T.; Willett, R.P. Customer impulse purchasing behavior. J. Mark. Res. 1967, 4, 21–31. [Google Scholar] [CrossRef]
- Shahjehan, A.; Qureshi, J.A. Personality and impulsive buying behaviors. A necessary condition analysis. Econ. Res. Istraz. 2019, 32, 1060–1072. [Google Scholar] [CrossRef]
- Singh, R.; Nayak, J.K. Effect of family environment on adolescent compulsive buying: Mediating role of self-esteem. Asia Pacific J. Mark. Logist. 2016, 28, 396–419. [Google Scholar] [CrossRef]
- Rook, D. W. The Buying Impulse. J. Consum. Res. 1987, 14, 189–199. [Google Scholar] [CrossRef]
- Rook, D.W.; Fisher, R.J. Normative Behavior Influences on Impulsive Buying Trait Aspects of Buying Impulsiveness. J. Consum. Res. 1995, 22, 305–313. [Google Scholar] [CrossRef]
- Parboteeah, D.V.; Valacich, J.S.; Wells, J.D. The influence of website characteristics on a consumer’s urge to buy impulsively. Inf. Syst. Res. 2009, 20, 60–78. [Google Scholar] [CrossRef]
- Zhang, X.; Prybutok, V.R.; Koh, C.E. The role of impulsiveness in a TAM-based online purchasing behavior model. Inf. Resour. Manag. J. 2006, 19, 54–68. [Google Scholar] [CrossRef]
- Wells, J.D.; Parboteeah, V.; Valacich, J.S. Online Impulse Buying: Understanding the Interplay between Consumer Impulsiveness and Website Quality. J. Assoc. Inf. Syst. 2011, 12, 32–56. [Google Scholar] [CrossRef]
- Whiteside, S.P.; Lynam, D.R. The Five Factor Model and impulsivity: Using a structural model of personality to understand impulsivity. Pers. Individ. Dif. 2001, 30, 669–689. [Google Scholar] [CrossRef]
- Buss, A.H.; Plomin, R. A Temperament Theory of Personality Development; Wiley & Sons: Hoboken, NJ, USA, 1975. [Google Scholar]
- Eysenck, S.B.G.; Pearson, P.R.; Easting, G.; Allsopp, J.F. Age norms for impulsiveness, venturesomeness and empathy in adults. Pers. Individ. Dif. 1985, 6, 613–619. [Google Scholar] [CrossRef]
- Dickman, S.J. Functional and Dysfunctional Impulsivity: Personality and Cognitive Correlates. J. Pers. Soc. Psychol. 1990, 58, 95–102. [Google Scholar] [CrossRef]
- Patton, J.H.; Stanford, M.; Barratt, E.S. Factor structure of the Barratt Impulsiveness Scale. J. Clin. Psychol. 1995, 51, 768–774. [Google Scholar]
- Kovaleva, A.; Beierlein, C.; Kemper, C.; Rammstedt, B. Die Skala Impulsives Verhalten-8 (I-8) [The Scale Impulsive Behaviour-8 (I-8)]. Zs. Soz. Items Skalen 2014, 8, 1–21. [Google Scholar] [CrossRef]
- Philipsen, R.; Brell, T.; Brost, W.; Eickels, T.; Ziefle, M. Running on empty—Users’ charging behavior of electric vehicles versus traditional refueling. Transp. Res. Part F Traffic Psychol. Behav. 2018, 59, 475–492. [Google Scholar] [CrossRef]
- Ahrends, C.; Bravo, F.; Kringelbach, M.L.; Vuust, P.; Rohrmeier, M.A. Pessimistic outcome expectancy does not explain ambiguity aversion in decision-making under uncertainty. Sci. Rep. 2019, 9, 1–11. [Google Scholar] [CrossRef]
- Lindheimerid, N.; Nicolai, J.; Moshagen, M. General rather than specific: Cognitive deficits in suppressing task irrelevant stimuli are associated with buying-shopping disorder. PLoS ONE 2020, 15, e0237093. [Google Scholar] [CrossRef]
- Fischer, S.; Anderson, K.G.; Smith, G.T. Coping with distress by eating or drinking: Role of trait urgency and expectancies. Psychol. Addict. Behav. 2004, 18, 269. [Google Scholar] [CrossRef]
- Pearson, M.R.; Murphy, E.M.; Doane, A.N. Impulsivity-like traits and risky driving behaviors among college students. Accid. Anal. Prev. 2013, 53, 142–148. [Google Scholar] [CrossRef]
- Riley, E.N.; Combs, J.L.; Jordan, C.E.; Smith, G.T. Negative Urgency and Lack of Perseverance: Identification of Differential Pathways of Onset and Maintenance Risk in the Longitudinal Prediction of Nonsuicidal Self-Injury. Behav. Ther. 2015, 46, 439–448. [Google Scholar] [CrossRef]
- Afolabi, I.T.; Oladipupo, O.; Worlu, R.E.; Akinyemi, I.O. A systematic review of consumer behaviour prediction studies. Covenant J. Bus. Soc. Sci. 2016, 7, 41–60. [Google Scholar]
- Jain, P.K.; Pamula, R. A systematic literature review on machine learning applications for consumer sentiment analysis using online reviews. arXiv 2020, arXiv:2008.10282. Available online: https://arxiv.org/abs/2008.10282 (accessed on 10 January 2021).
- Alcañiz Raya, M.; Marín-Morales, J.; Minissi, M.E.; Teruel Garcia, G.; Abad, L.; Chicchi Giglioli, I.A. Machine Learning and Virtual Reality on Body Movements’ Behaviors to Classify Children with Autism Spectrum Disorder. J. Clin. Med. 2020, 9, 1260. [Google Scholar] [CrossRef]
- Lopes, P.; Tian, N.; Boulic, R. Exploring Blink-Rate Behaviors for Cybersickness Detection in VR. In Proceedings of the 2020 IEEE Conference on Virtual Reality and 3D User Interfaces Abstracts and Workshops (VRW), Atlanta, GA, USA, 22–26 March 2020; pp. 795–796. [Google Scholar] [CrossRef]
- Sorensen, H. Inside the Mind of the Shopper: The Science of Retailing; FT Press: Upper Saddle River, NJ, USA, 2016. [Google Scholar]
- De-Juan-Ripoll, C.; Llanes-Jurado, J.; Giglioli, I.A.C.; Marín-Morales, J.; Alcañiz, M. An Immersive Virtual Reality Game for Predicting Risk Taking through the Use of Implicit Measures. Appl. Sci. 2021, 11, 825. [Google Scholar] [CrossRef]
- De-Juan-Ripoll, C.; Soler-Domínguez, J.L.; Chicchi Giglioli, I.A.; Contero, M.; Alcañiz, M. The Spheres & Shield Maze Task: A Virtual Reality Serious Game for the Assessment of Risk Taking in Decision Making. Cyberpsychol. Behav. Soc. Netw. 2020, 23, 773–781. [Google Scholar] [CrossRef]
- © 2021 Unity Technologies. Available online: https://unity.com/ (accessed on 10 January 2021).
- © 2021–2021 HTC Corporation. Available online: https://www.vive.com/ (accessed on 10 January 2021).
- VIVE Pro Eye Specs & User Guide. Available online: https://developer.vive.com/resources/vive-sense/hardware-guide/vive-pro-eye-specs-user-guide/ (accessed on 10 January 2021).
- Llanes-Jurado, J.; Marín-Morales, J.; Guixeres, J.; Alcañiz, M. Development and calibration of an eye-tracking fixation identification algorithm for immersive virtual reality. Sensors 2020, 20, 4956. [Google Scholar] [CrossRef]
- Dietterich, T. Overfitting and Undercomputing in Machine Learning. ACM Comput. Surv. 1995, 27, 326–327. [Google Scholar] [CrossRef]
- Fawcett, T. An introduction to ROC analysis. Pattern Recognit. Lett. 2006, 27, 861–874. [Google Scholar] [CrossRef]
- Yang, C.-M. Defensive Postures Decrease Consumption Desire and Purchase Intention. Asia Pac. Adv. Consum. Res. 2015, 11, 90–94. [Google Scholar]
- Bharadwaj, S.R.; Candy, T.R. Accommodative and vergence responses to conflicting blur and disparity stimuli during development. J. Vis. 2009, 9, 1–18. [Google Scholar] [CrossRef]
- Cho, J.; Kim, Y.; Jung, S.H.; Shin, H.; Kim, T. Screen Door Effect Mitigation and Its Quantitative Evaluation in VR Display. SID Symp. Dig. Tech. Pap. 2017, 48, 1154–1156. [Google Scholar] [CrossRef]


Publisher’s Note: MDPI stays neutral with regard to jurisdictional claims in published maps and institutional affiliations. |
© 2021 by the authors. Licensee MDPI, Basel, Switzerland. This article is an open access article distributed under the terms and conditions of the Creative Commons Attribution (CC BY) license (https://creativecommons.org/licenses/by/4.0/).