1. Introduction
Augmented reality (AR) is described as a sub-field of computer vision that allows the physical environment to be immersed in and overlaid with computer-generated information to create an interactive space. Its main principle is to replace parts of natural objects with virtual information in real time [
1,
2]. AR also intends to present users with virtual content while simultaneously keeping them in the real-world environment. In general, AR is defined as a system that includes the following characteristics [
3]:
Capability to combine the natural and virtual worlds;
Present a natural and virtual interactive environment in real-time;
Ability to view virtual information in three-dimensional spaces.
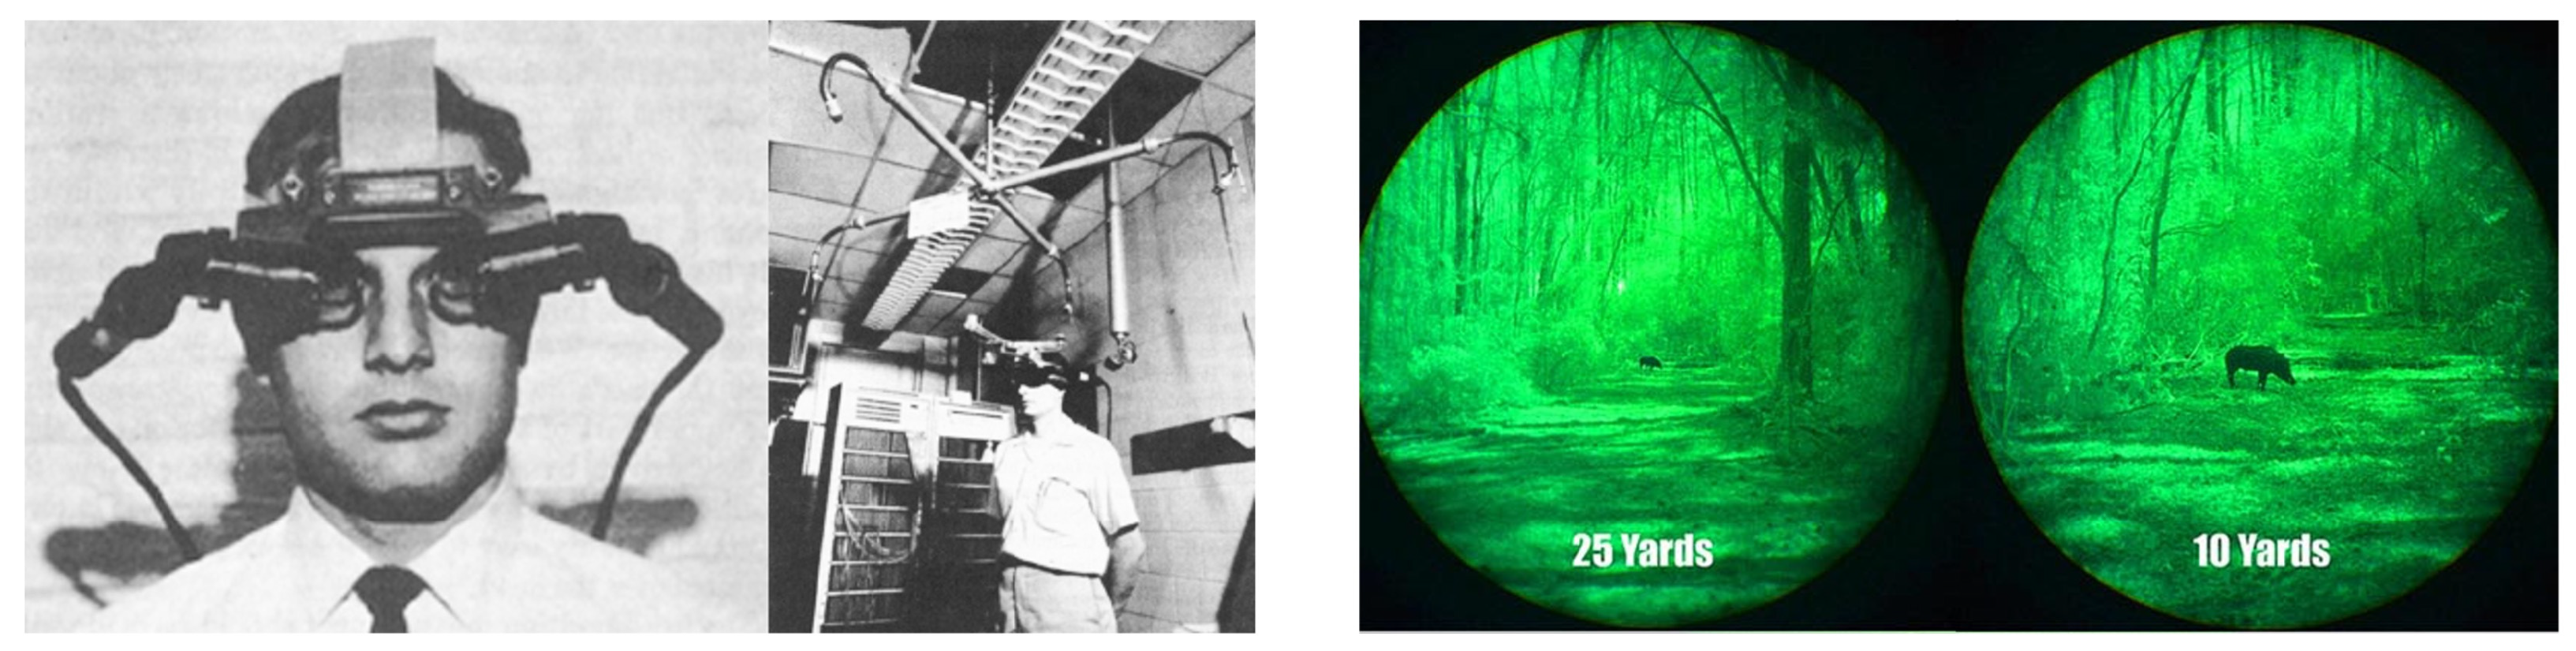
The idea of AR existed many years ago, and the first prototype of a workable AR device was introduced in the 1960s by Ivan Sutherland [
4], as shown in
Figure 1. This prototype is one of the first head-mount displays (HMD) that allowed users to view 3D computer-generated graphics via its display optics. Later, during the peak of the Vietnam War, the US Army introduced a night vision device (GEN 1,2,3-NVD). The GEN system was designed to be mounted to weapons [
5], allowing soldiers to view targets in levels of light approaching total darkness, together with range estimation (as shown in
Figure 1).
Virtual reality (VR) and mixed reality (MR) are frequently mentioned, but how do they relate to AR?
Figure 2 presents the MR continuum, which depicts MR as the merging of the virtual and natural worlds along with the digital information continuum. The VR environment is entirely generated by computer graphics, which disconnect users from the real world and transfer them to an artificial digital environment. These immersive experiences are usually applied to training, education and video games. AR lies between reality, or the natural world, and VR to integrate virtual information into the actual physical world’s live view. It provides a unique experience by merging the actual environment with digital information, allowing users to engage and absorb knowledge in a much more efficient manner [
6,
7].
While VR became more popular with investors during the 1970s and 1980s, AR was forgotten due to hardware limitations and the lack of potential application ideas. However, we do not need to wait long for AR to reappear again due to the significant growth of the technology in the early 1990s [
8,
9]. Boeing researcher Tom Caudell introduced the term “Augmented Reality” in his research on mounting cables in airplanes [
10]. In the late 1990s, the Columbia University Computer Science research group demonstrated the prototype of an interaction wearable device [
11]. Since the expansion of the smartphone market in the beginning of the 21st century, AR concepts have been gaining more public attention, increasing the number of supported technologies and research. Google was one of the first competitors to introduce to the public their own designed AR equipment, called “Google Glass” (
Figure 3a). The Google Glass is intended to be a mini wearable HMD that allows the users to experience AR via the glass optics. In 2016, Microsoft introduced the HoloLens [
12], which enables users to experience AR and interact with the virtual environment with their own hands (
Figure 3b). Apple went one step further in 2017 by re-configuring their iPhone processing chip and introducing the software development kit (SDK), “ARKit”, to enable AR experiences on mobile devices (
Figure 3c). Simultaneously, Google also launched their SDK, called “AR Core”, for their Android devices. The battle between the major companies is becoming more intense; Apple continues upgrading its hardware while Google optimises its SDK.
However, there are still many challenging issues that are waiting to be discovered and improved in AR related fields. One of the major difficulties is that there are several AR markers on the market, each with its own unique encoded information algorithm [
13,
14,
15,
16,
17], such as template (
Figure 4a), bar-code (
Figure 4b) or pictorial bar-code (
Figure 4c) markers. They usually require the users to modify their original material contents in some way, either partially or completely. Another problem is the marker identification process, which utilises the standard computer vision-based feature extraction approaches, such as scale-invariant feature transformations or histograms of oriented gradients [
18], for classification tasks. These mathematical methods are vulnerable to unanticipated real-world lighting [
19], marker orientation [
20] and unexpected noises [
21]. The deep learning (DL) using a convolutional neural network inspires optimism for overcoming the classic computer vision difficulties in the AR marker identification process [
22]. Later advances in the field of DL have attained human-level accuracy in object recognition [
23], as well as in real-time data processing [
24], making the notion of combining AR and DL more possible than ever. Another inspiration is that the Apple bionic computing processing unit is becoming more powerful (
Figure 4d). Since the introduction of the A11 chip into the iPhone X model, the new neural engine accelerator’s combination produces ML calculations that are nine times faster. This means that we can quickly implement a DL–AR-based application in this mobile platform. However, DL typically requires massive training data sets, and could be non-beneficial, which can reduce the accuracy rate [
25]. Another disadvantage of DL is the requirement of a substantial amount of time, as the data annotation processes are often done manually [
26].
2. Proposed Idea
We aim to use machine learning techniques to enhance augmented reality experiences by developing a robust deep learning vision-based application. The proposed method can classify any images as AR markers without the need for users to modify the contents. This process also requires a minimal amount of time to commercialise the marker as quickly as possible.
Figure 5 summarizes the proposed idea. We call the proposed system “Synthetic data annotation system for Augmented Reality Machine learning-based application” or SARM. To present our proposed system in more detail, we divide the practical implementation into three different modules:
Module 1—Synthetic data annotation is a critical step during the deep learning neural network training process (as shown in
Figure 6). The fundamental idea of this module is to use the available visual rendering software to apply domain-specific procedures to the raw data and produce new data in various formats and circumstances. We render the images as closely as possible to an accurate world perception with minimal effort. We believe that this new approach is faster than the manual data annotation, which may generate up to 20 training dataset pictures per second on a graphics rendering unit (as shown in
Table 1). It also provides us with an amazing chance to modify the training dataset more quickly for an extra training item or to increase the quality of the deep learning model.
Module 2—Deep neural network training provides the learning capability for the system to determine the potential marker from the scene. Many different convolutional neural networks (CNN), including image classification and object detection models such as AlexNet, ResNet, or YOLO (You Only Look Once), were successfully implemented and produce outstanding results. This uses a suitable deep learning model to train with the previous module’s dataset and evaluate the training and test outputs.
Module 3—Machine learning and augmented reality incorporation allows the system to combine object prediction and to project the 2D coordinates to the natural world 3D coordinates in the augmented reality scene (as shown in
Figure 7). The system then renders the virtual information, such as a 3D model, on the top of the predicted marker based on its identity.
In short, the proposed system contributes the following:
1—The capability to generate any dataset with any images with minimal effort. The users can easily and quickly use the system to create and modify any deep neural network datasets with their specific requirements.
2—The capability to identify different augmented reality markers without modifying the original content. The proposed system only uses a deep neural network to distinguish the differences between image targets; therefore, changing image content is no longer needed.
3—A superior augmented reality marker method that can be used in both research and commercial applications. The pre-trained deep neural network model can handle video sequences at a rate of about 25 frames per second, making it appropriate for augmented reality experiences on mobile/web platforms. We believe this is a viable low-cost platform with applications in a variety of fields, including education and gaming.
3. Synthetic Data Generation
Developing accurate object detection requires high-quality training data and can be a challenging task in a real-world environment, especially when developing a classifier where the data and environments are uncommon; one example is book images that are used as target markers for AR applications. Therefore, very little data exist that we can use for training the deep neural network model in this instance. In these rare scenarios, synthetic data appear to be a helpful method for generating high-quality and diverse training data in a minimal amount of time. To generate the synthetic dataset, we firstly need to collect all possible images used as the target markers in the AR application. Identification of all possible natural environment situations, such as lighting, orientation and backgrounds, is the most significant task and this helps to improve the quality of the training dataset. For example, if the application will be used primarily by students and teachers, then the backgrounds should be indoors, and the lighting should be warm and moderately bright. Once all of the necessary environmental components are identified, they can be imported into a game engine, such as Unity, to generate the image dataset used for deep neural network training and testing purposes, as shown in
Figure 8.
Image targets. We integrated approximately 22 different rectangular-shaped images in this study. Each of these images has a different design, and some of them have a very similar colour. This setup is believed to help us qualify how good the dataset is in terms of identifying the similarity objects. The images were from four different categories: (1) trading/business cards; (2) posters; (3) children’s educational books; and (4) food advertisements. The details of target markers are presented in
Table 2 and
Figure 9.
Virtual environments. The performance of the deep neural network model is often susceptible to the background, orientation and lighting conditions. Hence, the training dataset must include backgrounds and external conditions similar to what is expected in future application use. The following aspects are used during the proposed synthetic images generated procedure:
The number of distinct AR markers appearing in each scene is chosen at random from the pool of trainable classes.
The likelihood of seeing one or more AR markers in the same scene is set at 50%.
The AR marker’s scaling range is set randomly from 20% to 40% of the scene area.
The AR marker’s rotation angle is set randomly from 0 to 360 in respect of the scene z-axis.
A variety of lighting sources generated by the random camera views to present different real-world illumination effects.
These variations provide a wide range of real-life scenarios and external influences that might increase marker detection accuracy. The GPU acceleration allows us to generate over 40,000 high-definition pictures with bounding box coordinates in less than six hours. Human error in data labelling and noise can be minimised by applying this new approach.
Data labelling. YOLO is the deep neural network that we use in this study and is described in detail in
Section 4. In YOLO, the bounding box has four values, [object_id, x_centre, y_centre, width, height], as shown in
Figure 10. [object_id] represents the number corresponding to the object index in the class names list. [x_centre, y_centre] represents the centre point coordinate of the bounding box, which is normalised to between 0 and 1 by dividing by the width and height of the image. [width, height] represents the width and height of the bounding box, which is normalised to between 0 and 1 by dividing by the width and height of the image.
4. Object Detection
Object detection using a convolutional neural network can be categorised into two different types: region nomination and regression. Region nominations, such as R-CNN [
27], SPP-Net [
28], Fast R-CNN [
29], and Faster R-CNN [
30], use step-by-step detection strategy algorithms. They first extract the proposal regions from the image using selective search and then classify the image within the proposal regions. The output accuracies of these models are consistently above 80%. However, the frame per second (FPS) rate reduces dramatically. Only 7 FPS is possible for Faster R-CNN, which is one of the fastest models but is still far from the real-time FPS standard. On the other hand, the YOLO model can reach 45 FPS, which is suitable for real-time detection tasks, especially for AR applications. YOLO [
31] uses the regression method to predict the object bounding box and class name instead of using the proposed region method. However, due to the simpler network architecture, the detection accuracy reduces when the frame rate increases.
YOLOv3 deep neural network model. The main principle of YOLO is using the entire image as the input to the network and directly returning the bounding box coordinates and corresponding class name. YOLOv3 [
32] is the next generation of YOLOv2 [
33] and contains significant improvements. YOLOv2 uses Darknet-19 as its backbone and an additional 11 object detection layers. However, YOLOv2 struggles with detecting small objects, whereas YOLOv3 provides a state-of-the-art performance by using residual blocks, skip connections and upsampling, as shown in
Figure 11. It uses Darknet-53 as the backbone, which is reported to be more efficient than Darknet–19, ResNet-101 and ResNet-152 [
34].
The main difference between YOLOv3 and its ancestors is the prediction of three different scale levels. Each of the input images is downsampled by 32, 16 and 8, respectively. The detection is first made at the 82nd layer after the downsampling process of the original input from the previous 81 layers. The 81st layer has a stride of 32, meaning that if we have an image of 416 × 416, then the resultant feature map would be 13 × 13 × depth. Then the feature map from 79th layer upsampled by two to dimensions of 26 × 26 × depth is depth concatenated with the feature map from the 61st layer. The combination feature maps are subjected to a few convolutional layers before reaching the 94th layer, where the second detection occurs. The same procedure is executed again, where the feature map at the 94th layer is subjected to a few convolutional layers and depth concatenated with the feature map from the 36th layer. The final detection occurs at the 106th layer, yielding the feature map of 52 × 52 × depth. Detections at three different scale levels help to address the limitations around detecting small objects in YOLOv2. The 82nd prediction layer is responsible for detecting large-scale objects. The last prediction layer is responsible for detecting the small-scale objects, whereas the 94th prediction layer is suitable for medium-scale objects. The predictions are made by applying 1 × 1 detection kernels to the feature map, as shown in
Figure 12. At the tensor procedure level, the YOLOv3 network divides the input image into an S × S grid of cells. Each cell is responsible for predicting bounding boxes
B and class probabilities
C of the potential objects whose centres are inside the grid cell. Each bounding box has five attributes: four bounding box coordinates (
,
,
,
) and an object confidence score
. The confidence score represents the probability of a box containing an object and usually falls between 0 and 1.
In YOLOv3, the loss function
L can be calculated using the following equation:
where the
is the bounding box coordinate regression, which can be defined as follows:
where
cells,
N is the number of bounding boxes in each predicted cell with the corresponding coordinates (
,
,
,
), and
is the coordinate error weight. The
is used to calculate the loss of confidence of the existing object in the bounding box, which can be defined as follows:
where
c is the number of classes,
is the confidence error weight. The final
can be calculated using the following equation:
Mean average precision. In most computer vision-based deep neural networks, we use the mean average precision metric (mAP) to evaluate the trained model. Firstly, let us find out what precision means. The precision measures how accurate the model prediction can be by counting the number of correct predictions over the total predictions, described as follows:
where
is true positives, meaning that the positive predictions are correct.
represents false positives, meaning that the positive predictions are incorrect. The mAP, on the other hand, does not take the average of those precision values; it uses the Intersection Over Union metric (IOU). The IOU metric determines whether the prediction is correct. It measures overlap between the predicted bounding box and the ground truth bounding box over the union of their area, as described in
Figure 13:
In each case, we usually set up a default threshold value. If the IoU value is higher than the threshold value, the prediction is defined as
, otherwise
. The recall value is calculated in Equation (6) by using
,
and the false negatives
.
The average precision
can then be defined by finding the area under the precision-recall curve, as shown in the following equation:
The final
can be calculated as:
where
is the
value of the class
c and
n is the number of classes. The YOLO model also uses
or mean average precision 50. This metric calculates the
value from 50% to 90% of the
value and increases every iteration by 5%, then takes the average of all of them together.
Training parameters. The original YOLOv3 was evaluated on the Microsoft COCO (Common Objects in Context) dataset [
35]. We keep most of the training parameters as described in the original YOLO paper [
32]. However, we replaced the training data with our synthetic data during the training process, as described in
Section 3. We trained the network for 80 iterations using 80% of the dataset for training and the rest for validation. The batch size of 16 and sub-division of 8 matched the training hardware requirement for Nvidia RTX 2080 Super. However, we used Pytorch [
36] as the training framework instead of Darknet due to its Core ML conversion capability for implementing iOS applications. The full details of the training parameters are presented in
Table 3.
5. Augmented Reality Application Implementation
Our iOS application was built using Xcode and Swift 5.0 and developed for iOS 14.0 or above. The application was tested on the iPhone X and iPhone XR, but it should also work on other recent iPhone models that support ARKit 4.0 and have the Bionic A11 chip or later built-in. Our iOS application source code is openly available at
https://drive.google.com/file/d/1HPnggCnhE2gqcfh9Tiuuk2FxvMEu3qdw/view?usp=sharing, accessed on 24 June 2021.
Importing the pre-trained deep neural network model to XCode. The deep neural network we trained (as discussed in
Section 4) can be easily imported to XCode by converting to the Apple CoreML format using the Open Neural Network Exchange (ONNX). The ONNX is an open cross-platform deep learning model that helps developers move their trained models into different training frameworks. The converter then takes the pre-trained PyTorch model (.pth) as the input, and instead of running on the actual neural net, it will identify torch.onnx._export as the built-in PyTorch API to export to an ONNX formatted model. Exporting the ONNX format from PyTorch is essentially tracing the network, and the system internally runs the network on ’dummy data’ to generate the graph. For this reason, the system needs a blank image with a similar size to the expected input: convert -size 416 × 416 xc:white png24:dummy.jpg. The ONNX can then be converted to the CoreML model format by using the built-in convert-onnx-to-coreml package, as shown in the example below (
Listing 1):
Listing 1. Python code to convert Pytorch model to CoreML.
import sys
from onnx import onnx_pb
from onnx_coreml import~convert
model_in = “input.onnx”
model_out = “output.coreml”
model_file = open(model_in, ’rb’)
model_proto = onnx_pb.ModelProto()
model_proto.ParseFromString(model_file.read())
coreml_model = convert(model_proto, image_input_names=[’0’],
image_output_names=[’186’])
coreml_model.save(model_out)
The CoreML model then can be imported by dragging and dropping the model file into the XCode project. XCode will generate a new Swift class for the new imported model and we can use the model by creating an instance of this class.
iOS application structure. The class diagram in
Figure 14 presents the relationship between different Swift classes and how they fit and work together under the application system. The diagram is divided into three parts: (1) ViewController; (2) Yolo; and (3) AlteredImage. The ViewController class is the main controller of the application that holds the ARSCNView. This class is responsible for rendering the virtual objects and updating the application states. Every instruction is executed on the main UI thread as the system does not capture the camera’s input frame in this class. Hence, there is no main thread blocking issue due to the video feedback execution.
The Yolo class is where the actual deep neural network predicts the incoming frame from the camera. We set the prediction time interval to 0.03 s, which means that the system will start running the prediction process every 30 milliseconds if no prediction process is currently running. This set-up helps to reduce the system workload by classifying a single frame for every given interval of time instead of for all of the frames. Each predicted frame is converted to MLMultiArray and fed into the deep neural network model. The advantage of working directly with MLMultiArray’s memory is that this speeds up the CoreML prediction performance significantly. Every process within this class is run on the background thread to avoid blocking the main UI thread. After the bounding box of the input frame is found, the system starts searching for the closest rectangle in the 3D world that matches the predicted bounding box. The Intersection Over Union metric (IOU) is used to measure the similarity between the predicted bounding box and the rectangle in the natural scene. The IOU can be written as:
After finding the matched rectangle in the natural scene, the AlteredImage class will keep a copy of the rectangle as the reference image and create a 3D plane of the rectangle with its exact dimension in the real world. The virtual object is retrieved based on the predicted identification and rendered in the scene using SCNNode class. Each virtual object node is grouped under one root node, meaning all nodes are defined relative to the transformation or orientation of the same root node. We also set the reference image tracking time interval to 0.03 s so that the system will start searching for the saved reference image every 30 milliseconds, and it will begin the actual YOLO prediction process if the reference image cannot be found via the AlteredImageDelegate protocol. Hence, this reduces the workload for the neural engine. ARKit 4 itself does not read any 3D formats, it instead uses the rendering engine to read and render the 3D object onto the scene. The rendering engine only accepts four 3D model formats: (1) Collada’s Digital Asset Exchange .dae; (2) Pixar’s Zipped Universal Scene Description .usdz; (3) Native Scene Format .scn; and (4) Reality Composer Format .rcproject or .reality. However, we can also use the Reality Composer built-in convert tool to convert other 3D object formats to one of the above-supported formats.
6. Results
Synthetic dataset performance on YOLOv3. We conducted different experiments to evaluate our proposed method. All of the experiments used Python 3.8 to train the algorithm on the Linux system with Intel i7-9700F 3.0 GHZ CPU and Nvidia RTX 2080 Super (8 GB memory). We trained our synthetic data with two different YOLO models: YOLOv3 416 for 20 h and YOLOv3 tiny for 13 h. The training loss results are shown in
Figure 15, and the mean average precision values (mAP and mAP50) are presented in
Figure 16. The results indicate that the YOLOv3 model yields more than 80% in mAP and more than 55% in mAP50 when utilising our synthetic dataset.
Comparison with other dataset. We also compare our synthetic dataset with MS-COCO [
35], using the same YOLO family model, presented in
Table 4. MS-COCO is a famous dataset for testing the performance of many object detection models. However, the data are collected and labelled manually. We would like to find out the performance of the COCO dataset and our synthetic dataset when they are feeding into the same YOLO models. This experiment is believed to present a general picture of the difference in performance between two different types of dataset generation techniques. Our dataset produces higher performance values while maintaining the same detection time at 0.01 s, which is equivalent to a real-time detection standard. Significantly, the mAP and mAP50 values almost doubled when we used our dataset for deep neural network training. These results indicate that our proposed method is effective and can minimise outliers and noise that could cause a reduction in prediction performance.
Images prediction under different lighting conditions. The first experiment shows that the YOLOv3 416 and tiny are the most suitable models used for mobile devices. We compared their performance under the following natural lighting conditions:
The experiment outputs are shown in
Figure 17. The models can detect objects very well under good lighting conditions with an average precision of 80%. YOLOv3 416 could classify objects under poor lighting conditions; however, YOLOv3 tiny could not (
Figure 17b).
Augmented Reality Experiences on iOS Devices
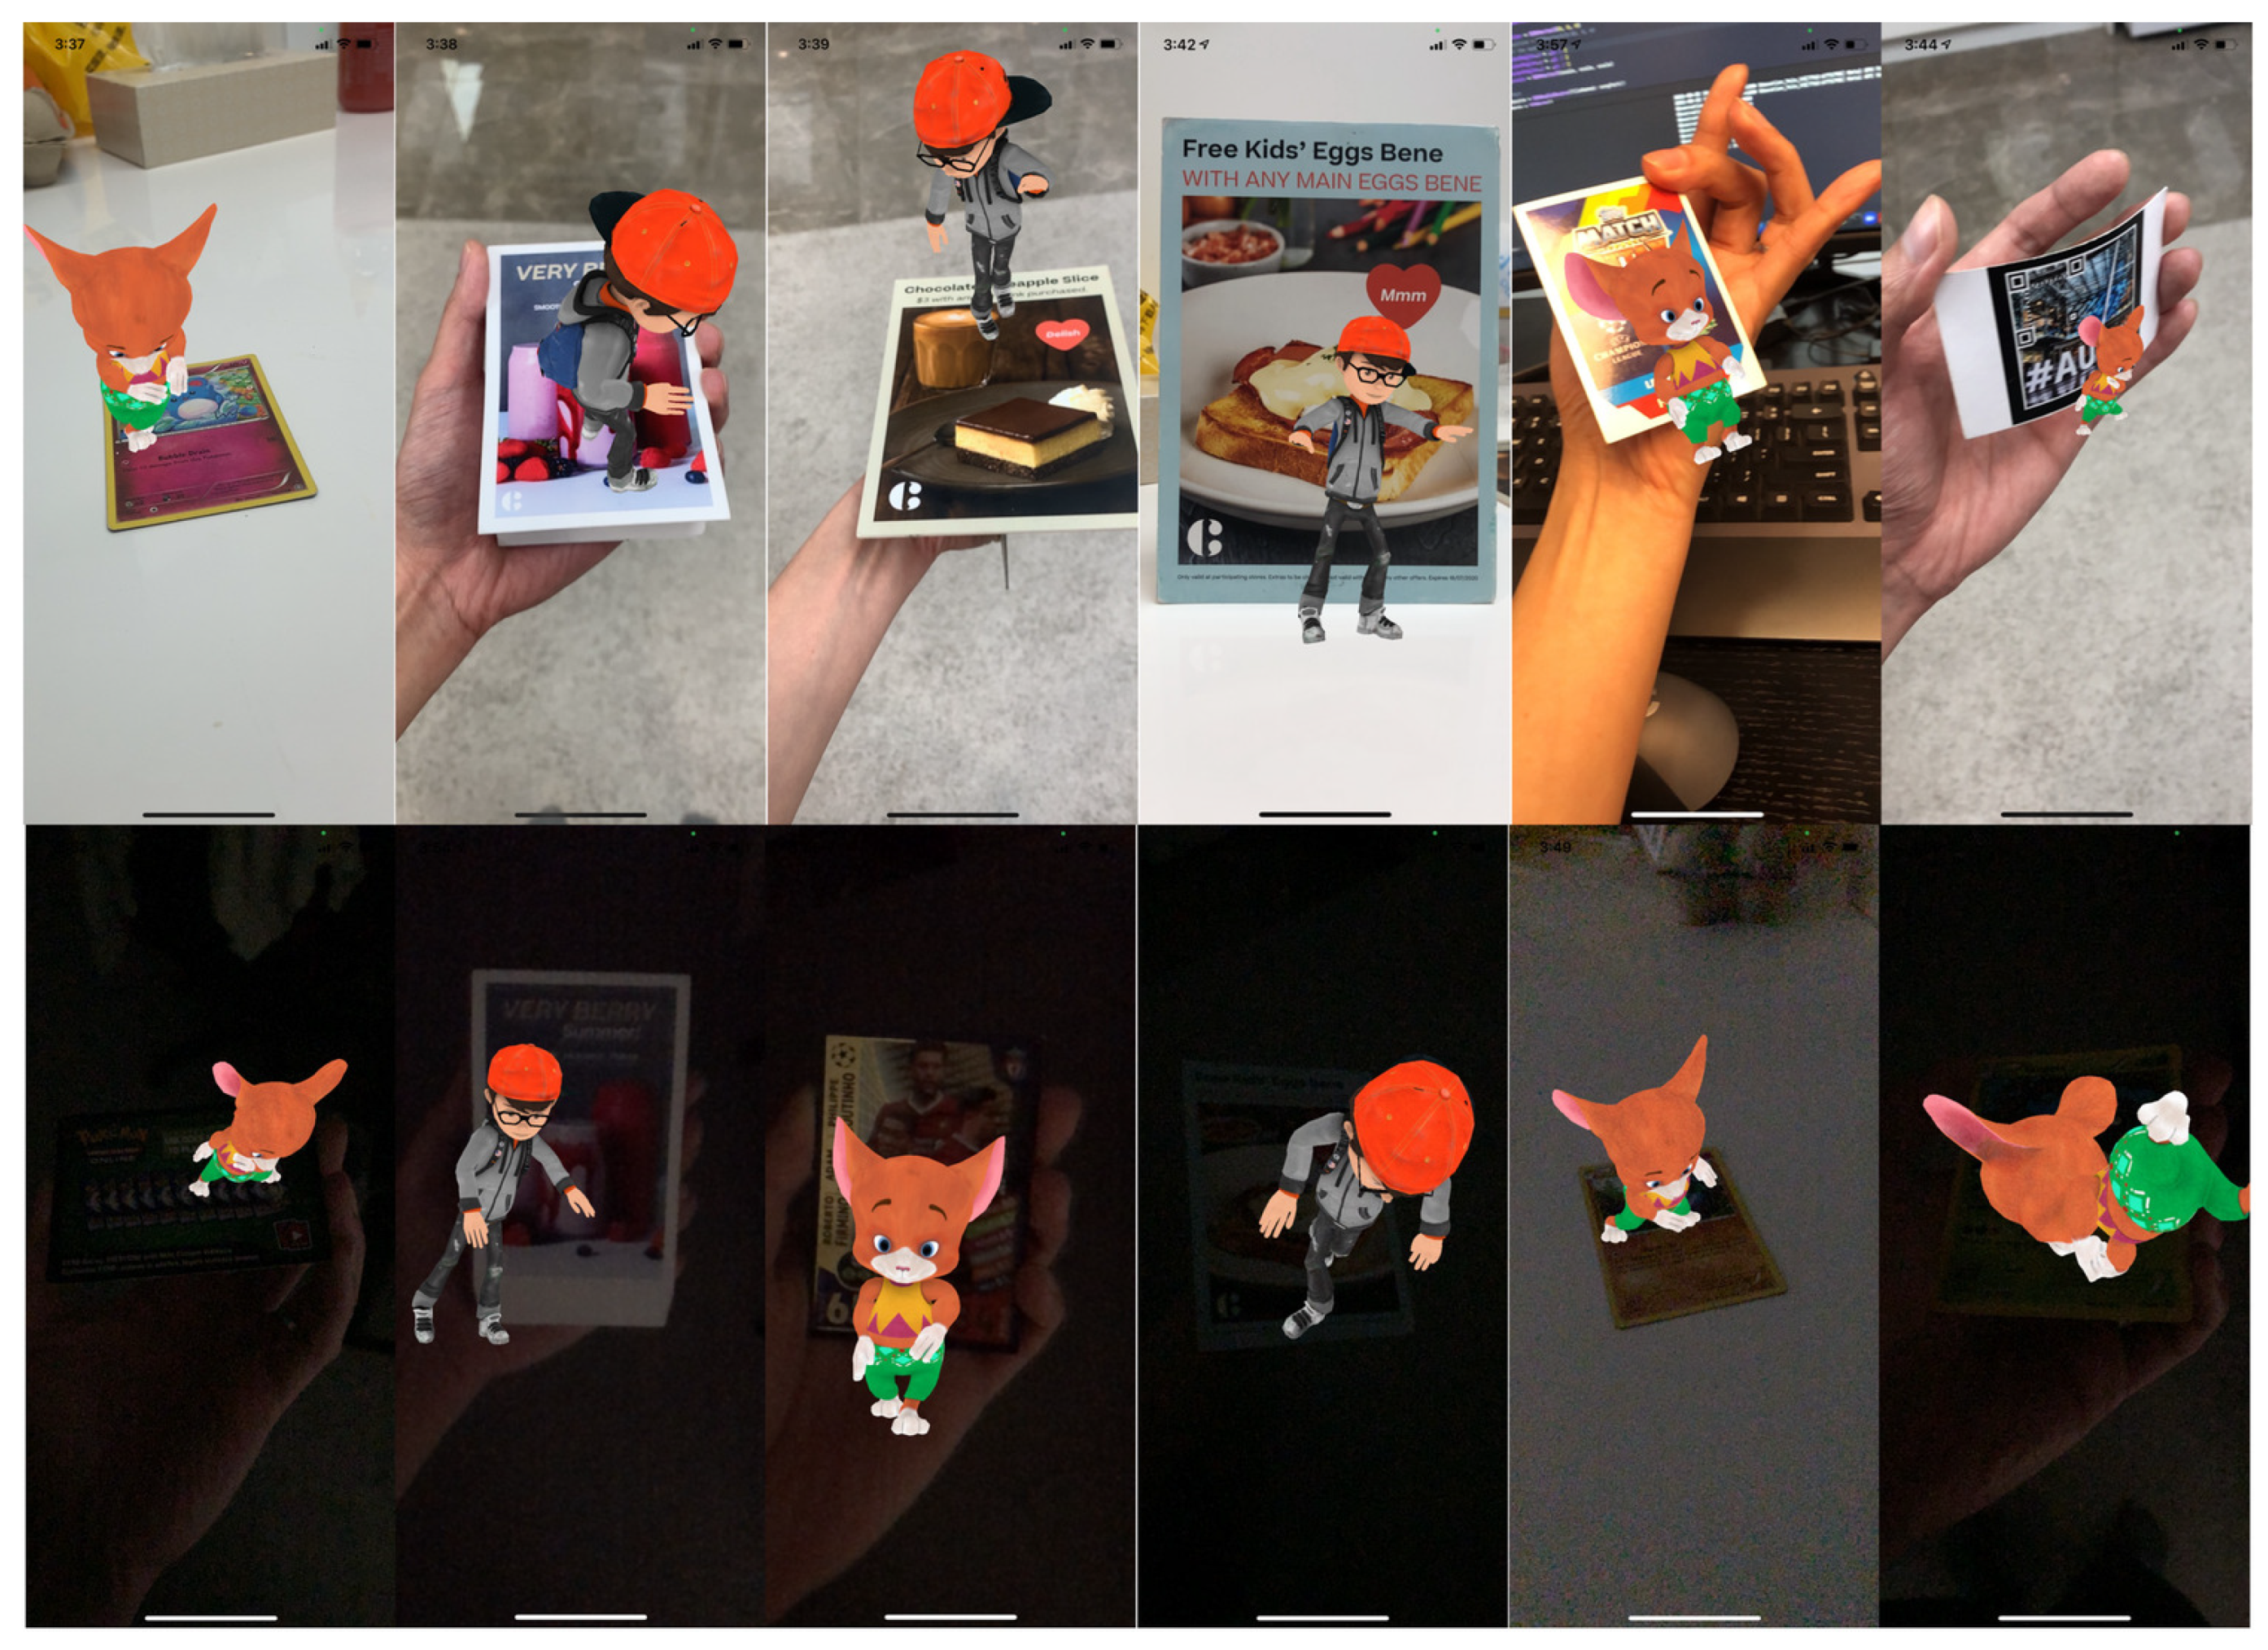
Augmented reality application. We successfully implemented the trained YOLOv3 and YOLOv3 tiny models using our proposed synthetic dataset on an iOS device (
Figure 18). We tested the application’s performance on the iPhone X model, which has 3 GB of RAM and the Apple-designed A11 Bionic chip. The results showed that the iOS application could detect the markers under different lighting conditions at an average rate of 60 frames per second (FPS). The added animations work efficiently at an average rate of above 50 FPS. However, due to the limitations of the hardware, the frame rate drops to 30 FPS after 30 min of running continuously. This is a known issue with current iOS devices where the neural engine (ANE) inside the CPU is responsible for machine learning tasks. The CPU will have thermal throttling after an extended time period using the ANE and forces the system to slow down CPU performance to protect the device’s components. Therefore, it could lead to low augmented reality experiences and detection accuracy rate.


