Article

Dynamic Performance of Soil–Tunnel System under Transverse Sinusoidal Excitations

1
Department of Geotechnical Engineering, Tongji University, Shanghai 200092, China
2
State Key Laboratory for Disaster Reduction in Civil Engineering, Tongji University, Shanghai 200092, China
3
Institute for Mechanics of Materials and Structures, Vienna University of Technology, A-1040 Vienna, Austria
*
Author to whom correspondence should be addressed.
Appl. Sci. 2021, 11(11), 5097; https://doi.org/10.3390/app11115097
Submission received: 28 April 2021 / Revised: 23 May 2021 / Accepted: 25 May 2021 / Published: 31 May 2021
(This article belongs to the Section Civil Engineering)

Abstract

:
Input of sinusoidal excitation with specified frequency is an optimal way to capture the mechanism of soil-tunnel interaction. Focusing on the relationship between the frequency of input sinusoidal motions and the dynamic response of a system, this study carried out a series of shaking table tests on both a free-field model and soil–tunnel model in the background of the tunnel in soft ground. To detect the detailed deformation of segmental linings, a refined lining ring of the model tunnel was developed, and the stiffness ratio between the soil and tunnel was verified. Seven sinusoidal excitations were designated to cover the fundamental frequency of the model ground, with the input of transverse direction. Effects of frequency of sinusoidal excitations on soil-tunnel interaction can be evaluated by the detailed responses of segmental linings, such as cross-sectional deformations, extension/closure of longitudinal joints, dynamic normal earth pressures, and dynamic strains of segments. Results shows that the differences of the acceleration responses, on the respects of waveform, phase, and peak, between the upper soil layer and the lower soil layer are obviously increasing with the input frequency increasing. The presence of the tunnel induces a relatively high effect on acceleration responses of the ground within excitation frequency varying from 9 to 17 Hz. The maximum responses of the tunnel are highly influenced by both the fundamental frequency of the model ground and lower frequency of excitations.

1. Introduction

The seismic performance of tunnels in soft ground has attracted the attention of researchers worldwide. Whether in analysis [1] or with the shake table test [2], the transverse response under dynamic action is of fundamental importance for revealing the facts other than long tunnel [3]. A record of ground motion from real earthquake is a complicated composition of random frequencies. Input of sinusoidal excitation with specified frequency is an optimal way to capture the mechanism of soil–tunnel interaction.
Cilingir and Madabhushi [4] studied the dynamic responses of a tunnel under sinusoidal excitations of frequencies from 40 to 60 Hz, by means of a centrifuge test and numerical analysis. In this investigation, uniformed tunnels with a square section and circular section were modeled at a scale of 1:50 and were imbedded in sandy ground. Accelerations on and around the tunnel lining, as well as in the sand, and dynamic earth pressures on the tunnel lining were recorded and analyzed. Chen and Shen [5] conducted dynamic centrifuge tests to study the influence of input frequency on the seismic behavior of a square tunnel in soft ground. The geometric scaling factor was 1:100. The frequencies of sinusoidal excitation ranged from 50 to 200 Hz. Only acceleration response and strain response of tunnels were obtained. Moghadam and Baziar [6] performed a series of shaking table tests on a circular subway tunnel. The maximum frequency of the shaking table was limited to 20 Hz in the case of harmonic waves, considering the shaking table’s capability. The tunnel was modeled by a uniformed tube in scale 1:32. The effect of the tunnel on the ground surface acceleration was studied, using the recorded acceleration data. The dynamic response of the tunnel was is presented here. The similarity ratios of tests mentioned above are too small; thus, the input frequency seriously deviates from the actual frequency of the prototype structures.
Segmental assembled rings as linings are widely applied to the construction of tunnel in soft ground. To model the seismic performance of assembled linings of shield tunnels, He and Koizumi [7] conducted a shaking table test on a 1:100 scaled tunnel located at alluvium ground. Transverse joints (that is longitudinal joint in this paper) of the tunnel were modeled by a longitudinal groove on a uniform tube to produce equivalent stiffness. As the model tunnel is basically not a segmented one, the deformation response of longitudinal joints cannot be captured. Zhang et al. [8] used a similar method to produce a grooved model tunnel but focused on the discrepant responses of shaft–tunnel junction, that is, opening or closure of ring joint. A large-scale shaking table test with geometry similarity ratio 1:8 was conducted [9] to investigate the seismic response of a tunnel embedded in compacted clay. The tunnel lining was modeled with an uniformed ring, on the basis of equivalent stiffness principle. However, static analysis [10] and experiments [11] proved that the existence of longitudinal joints will have an important impact on the mechanical behavior of segmental tunnel. The transverse deformation in a cross-section of segmental tunnel should be properly captured with refined model lining for the purpose of dynamic testing.
Focusing on the relationship between the frequency of input sinusoidal motions and the dynamic response of a system, this paper recounts a series of shaking table tests carried out on both a free-field model and soil–tunnel model. The geometrical scaling factor was set as 1:15 in the light of the diameter of prototype tunnel, 14.0 m. Seven sinusoidal excitations with frequencies from 2 to 17 Hz were designated to cover the fundamental frequency of the model ground. Accelerometers in the ground and on the model tunnel were instrumented to capture the dynamic characteristics of the models. Instead of uniformed tube ring used in previous investigations, a refined lining ring of the model tunnel was developed in order to detect the detailed deformation of segmental linings, such as relative displacements in diametral direction and longitudinal joints, as well as dynamic strains of segments. First, the fundamental frequency responses of two model grounds were investigated. Then responses of two grounds were analyzed and compared by accelerations of the model ground and lateral displacement of the laminar box under different excitation frequency. Finally, effects of input frequency on the tunnel were evaluated by dynamic earth pressures, as well as the detailed deformation. Besides this, the relationship between sinusoidal excitations and maximum tunnel responses was also concluded.

2. Test Design

2.1. Prototype of a Site

The stratigraphic parameters of prototype site in Shanghai are shown in Table 1. To simplify the experimental study, a uniform ground is assumed with an equivalent depth of 42.0 m. The average unit weight is 18.59 kN/m3, taken as a homogeneous soil. The equivalent shear wave velocity of the ground is 187.45 m/s in the way of weighted average method. Therefore, the fundamental frequency of the site is 1.116 Hz (0.896 s) by means of analytical formula for uniform ground.
The prototype of the assembled lining is from a road tunnel (as in Figure 1) to be constructed in the site. It consists of 10 segments manufactured with strength grade C60 reinforced concrete, including 7 standard-segments, 2 adjacent segments, and a key-block. The external diameter of the tunnel is 14.0 m. The thickness of a segment is 0.6 m, with width of 2.0 m. During assemblage of a lining ring, any two segments are fastened with 2 bolts of strength grade 6.8 (the yield strength of it is 480 MPa).

2.2. Similitude Ratios

To achieve the largest ratio between model and prototype would benefit the measurement in experiment. The similitude ratio usually depends on the capacity of shaking table and the laminar box to hold the model. The payload of a major table in The Multifunctional Shaking-Table Lab of Tongji University is 700 kN at its maximum acceleration, 1.5 g. The size of the table is 6.0 × 4.0 m. Therefore, the dimensions of laminar box in plane should not exceed it.
By considering the confinements from the capability of shaking table, dimensions of ground and tunnel to be modeled, as well as the selection of model materials, the geometric similarity ratio (model to prototype) of the site is determined as 1:15. Density and shear modulus of material are selected as the other two fundamental quantities. Similitude ratios of rests physical quantities can be decided in the light of similarity relations, as shown in Table 2, deduced by dimensional analysis method.

2.3. Model Ground

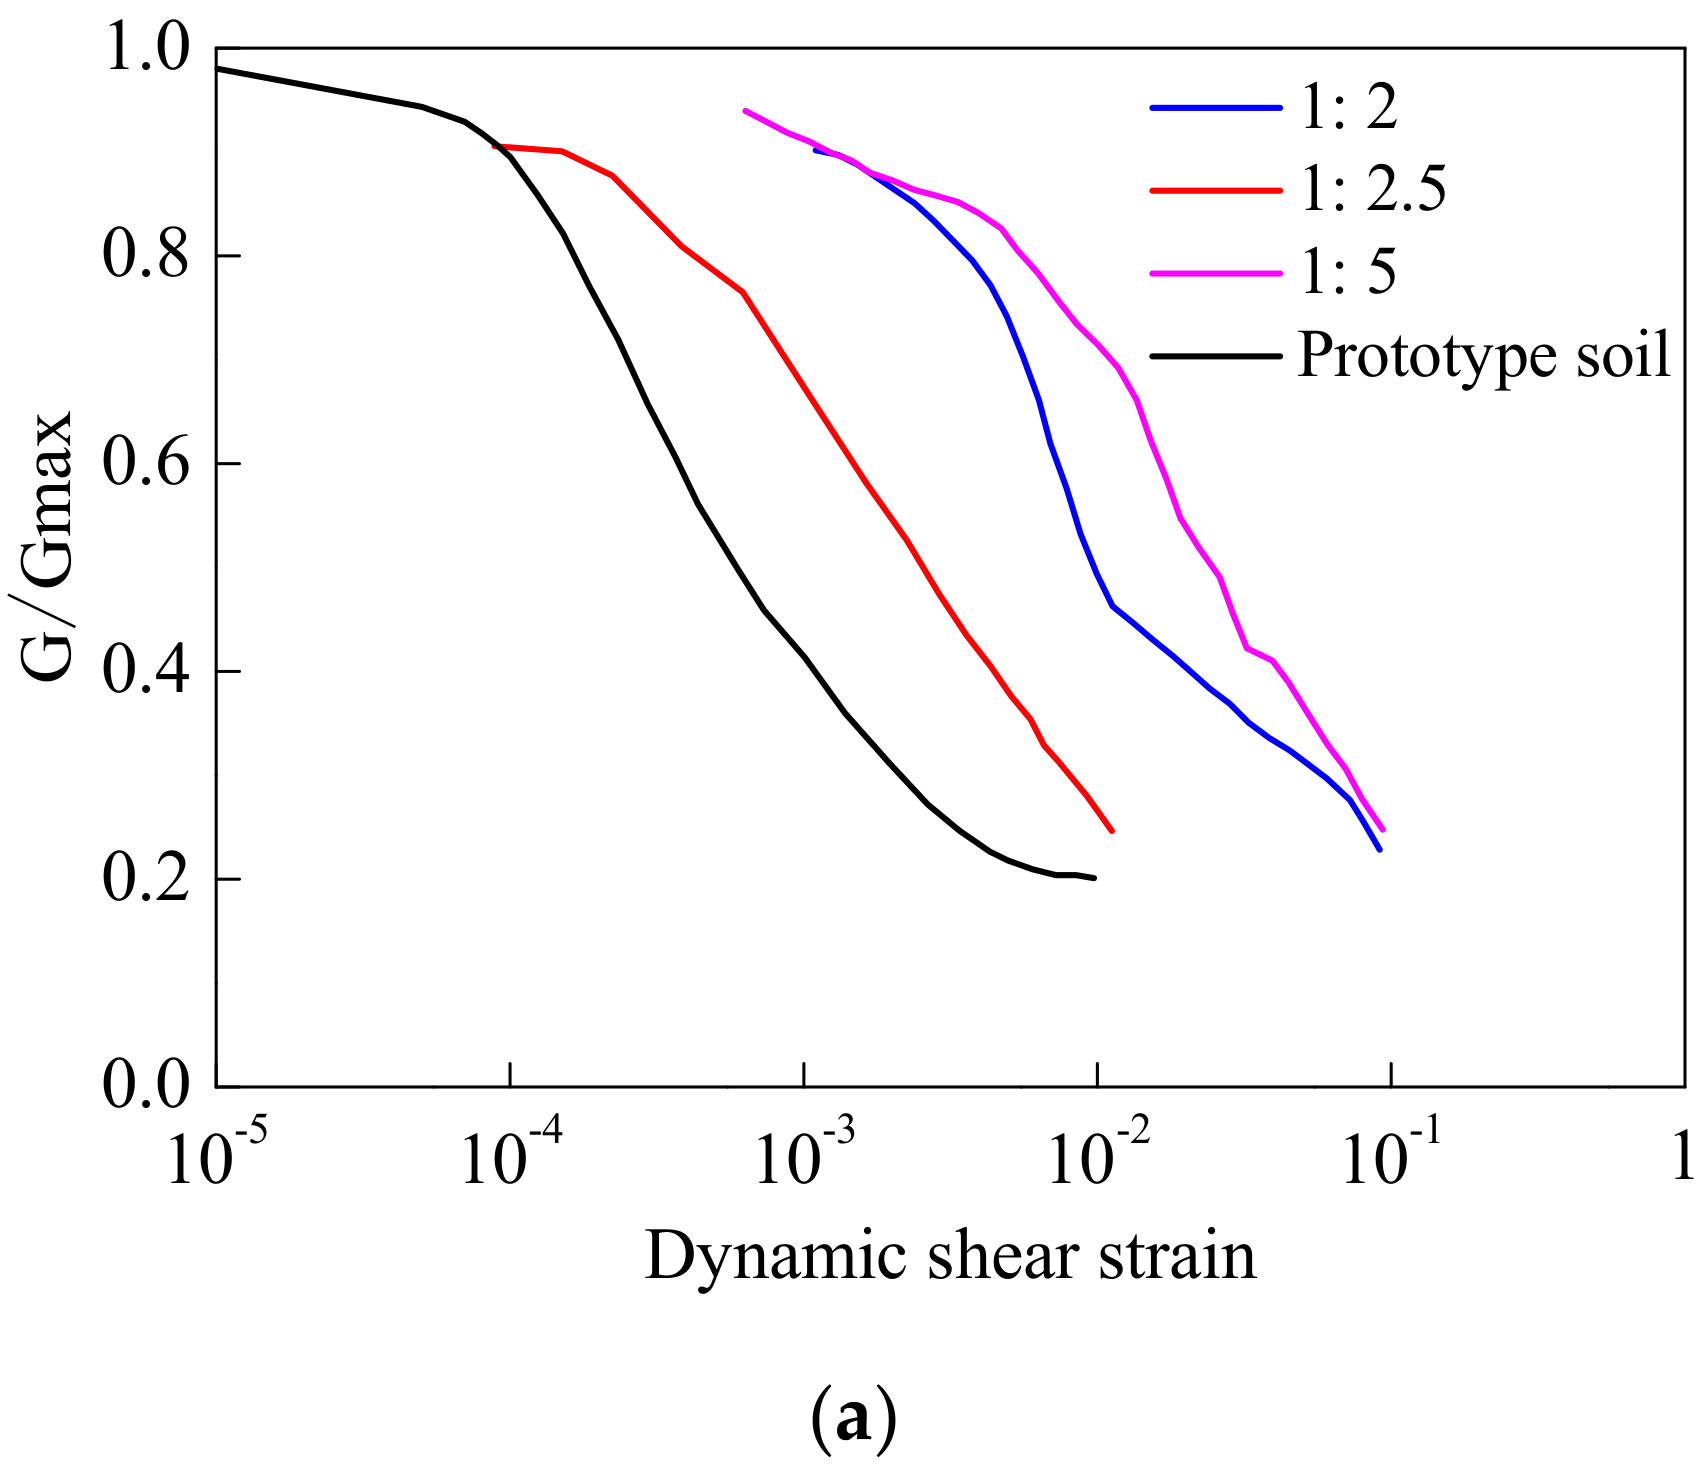
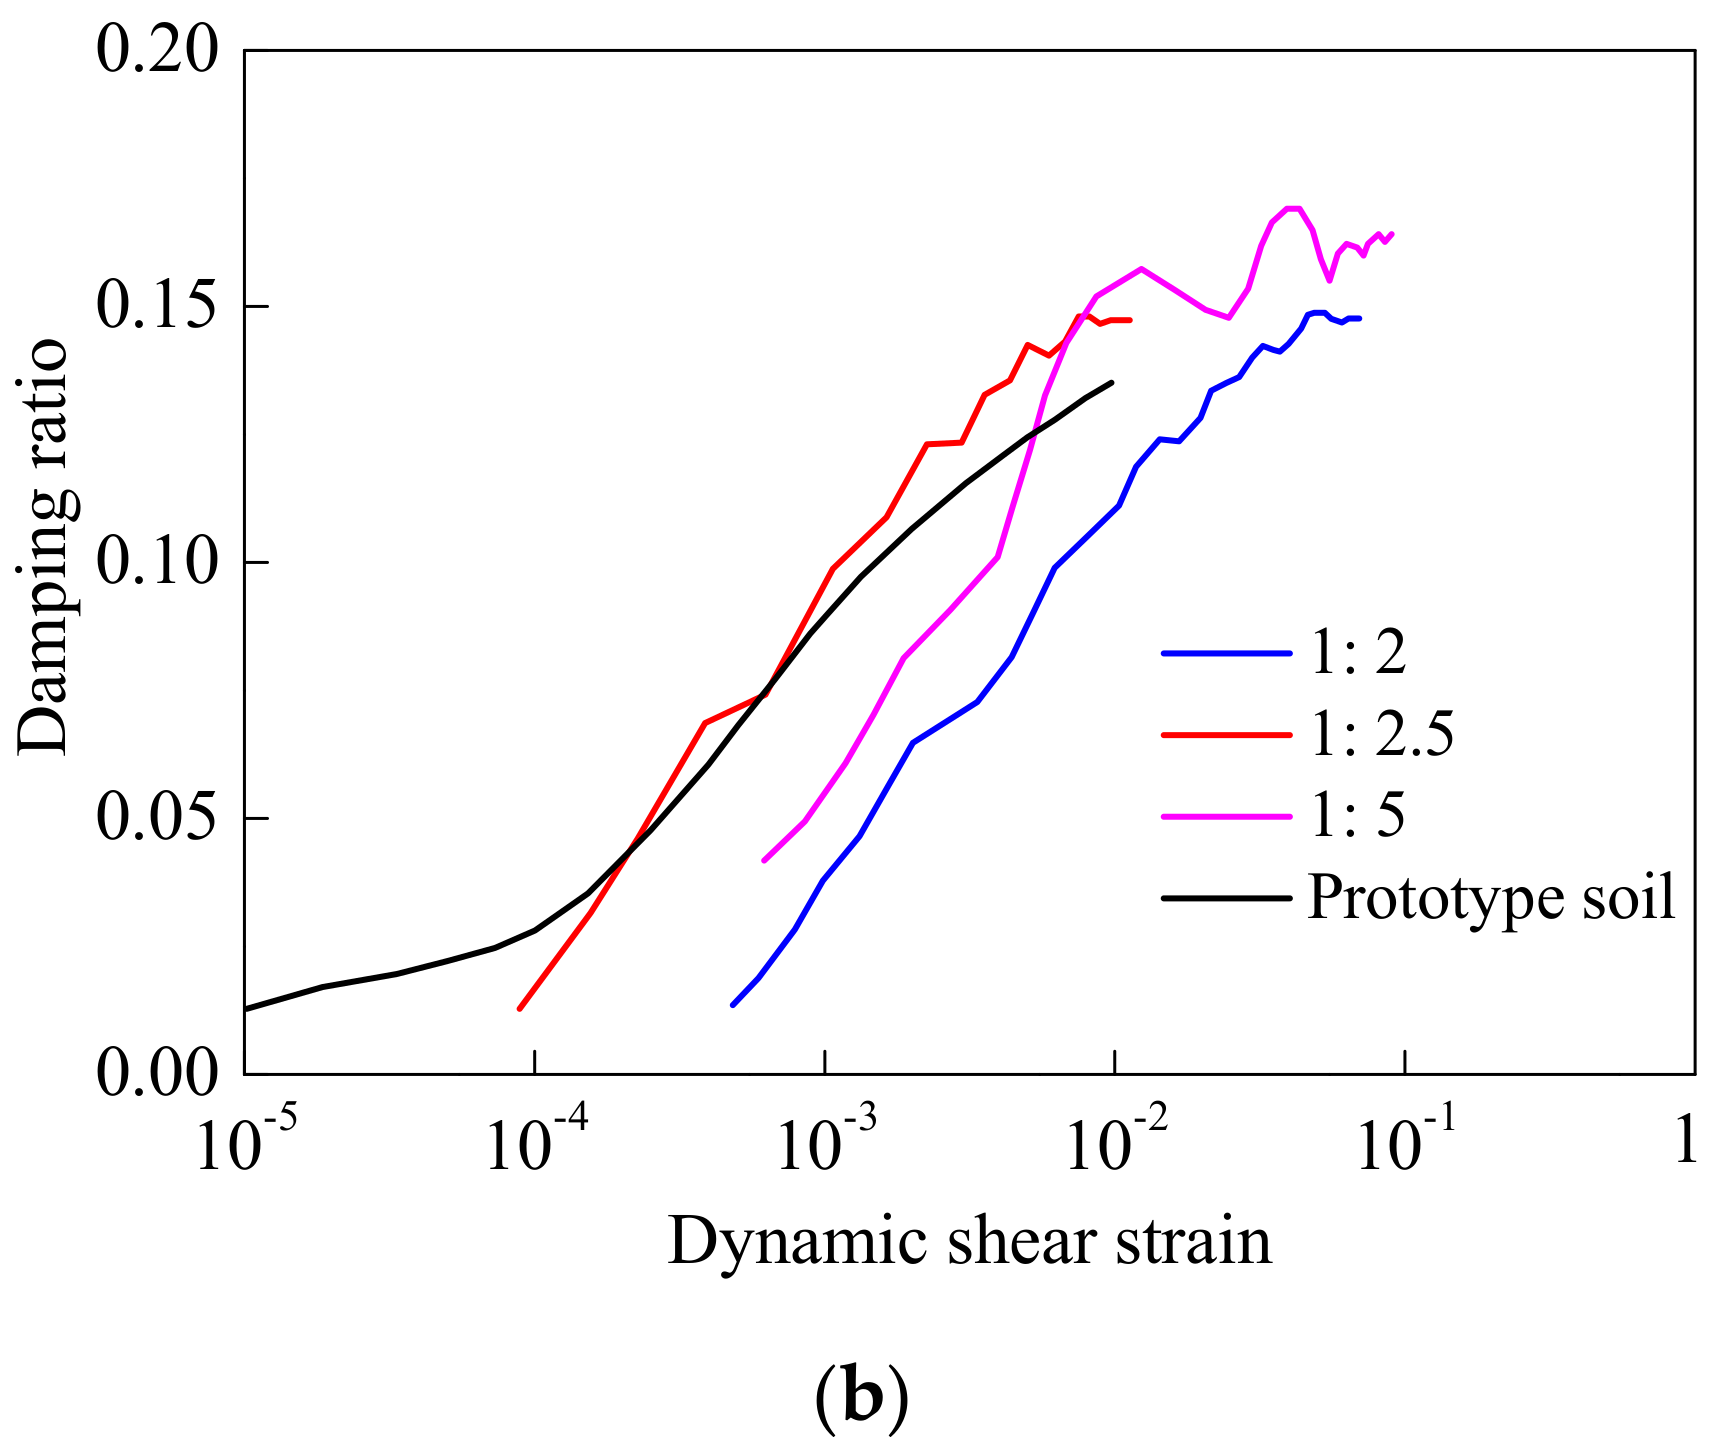
Apart from the depth of the ground, the other two fundamental quantities of the site to be decided are the density and shear modulus of soil used to constitute the model ground. Artificial soil made up of sawdust and dry sand was here used to accommodate model soil, with regards to the dynamic characteristics of ‘original soil’ of the site. The average particle size of dry sand is 0.3 mm [12]. More details concerning the model soil can be seen in Yan’s paper [12]. The black line in Figure 2 gives the target dimensionless parameters of shear modulus ratio (Figure 2a) and damping ratio (Figure 2b) of prototype soil, measured by dynamic tri-axial tests. The other lines give the testing results of the same parameters for artificial soils with various proportion of sand and sawdust. It can be seen that, when the mass ratio of sand to sawdust is 1:2.5, the artificial soil is of better correlation with the prototype soil, in regard to the aspects of the shear modulus ratio or damping ratio. The model ground is considered as a uniform ground with respect to the consistency with the fundamental frequency of layered soils.
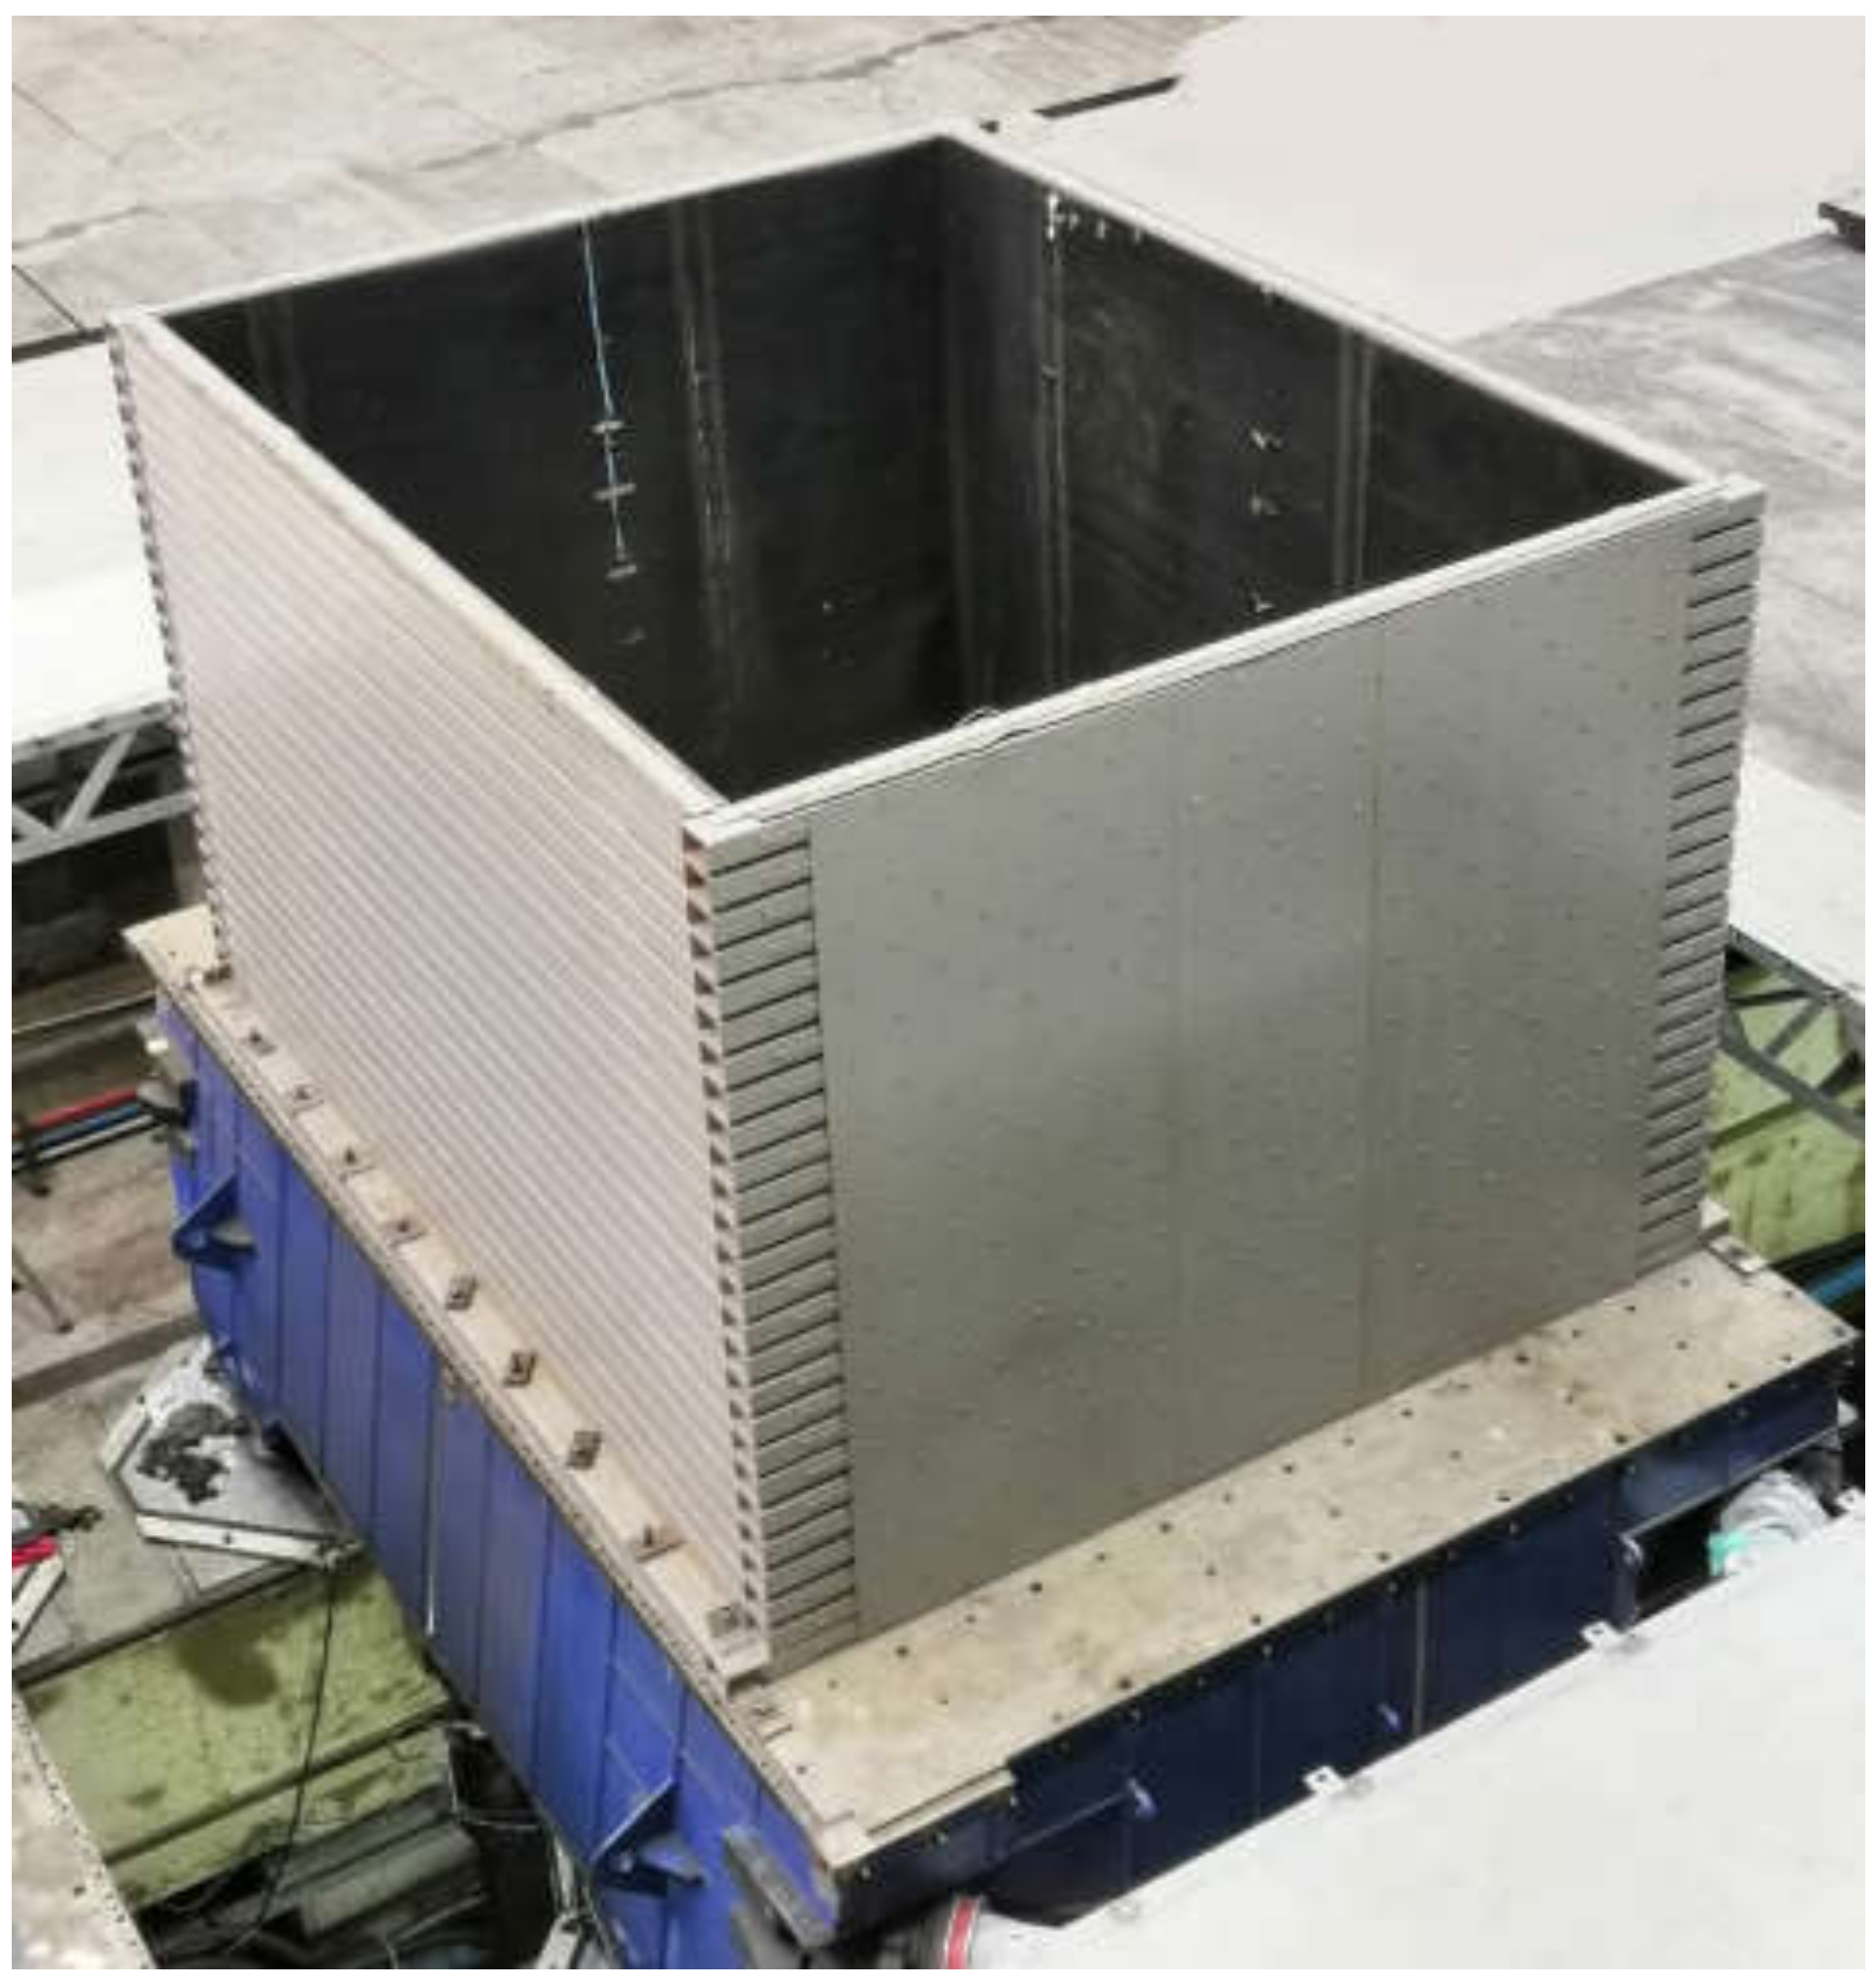
To produce shear free boundary, a laminar box was used to contain models in this test, as shown in Figure 3. The outer dimension of the shear-free box is 4.8 × 4.1 × 3.0 m (length × width × height), and the inner dimension is 4.5 × 3.5 × 3.0 m. With this volume of laminar box, the model ground produced with 1:2.5 artificial soil meets the requirements of the similarity ratio of maximum dynamic shear modulus and the bearing capacity of the shaking equipment.
The artificial soil was placed in the laminar box, layer by layer, with compaction, to the height of 2.8 m. The thickness of each layer is 0.2 m. The filling mass of the artificial soil is the same in each layer, aimed at a constant density of the model ground. Finally, the filling density could be guaranteed [13]. The design value of fundamental frequency of the uniform model ground is 4.4 Hz in the light of similitude in Table 2.

2.4. Refined Lining Ring of Model Tunnel

2.4.1. Stiffness Ratio of Prototype

It was found that the stiffness ratio of the lining ring with respect to the ground has an important role [14,15]. The stiffness ratio for the round tube was defined as follows:
F = E m 1 v 1 2 R 3 6 E 1 I 1 + v m
where E m and E 1 are Young’s modulus of the ground and the tunnel, respectively; v m and v 1 are Poisson’s ratio of the ground and the tunnel, respectively; R is radius of the tunnel; and I is moment of inertia of the tunnel lining (per unit width). Thickness of model tube was designed in the light of Equation (1), in the shaking table test from Moghadam and Baziar [6].
It should be notice that the stiffness of segmental tunnel is different from the uniform tube for the existence of longitudinal joints, and no formula can be straightly employed currently to calculate the stiffness of segmental tunnel.
Generally, the stiffness ratio, F , of soil to tunnel in prototype is calculated as follows:
F = K s o i l / K t u n n e l
where K s o i l is the shear stiffness of the prototype soil for the unit width column of ground with homogeneous soil.
K s o i l = G A L
G = ρ v 2
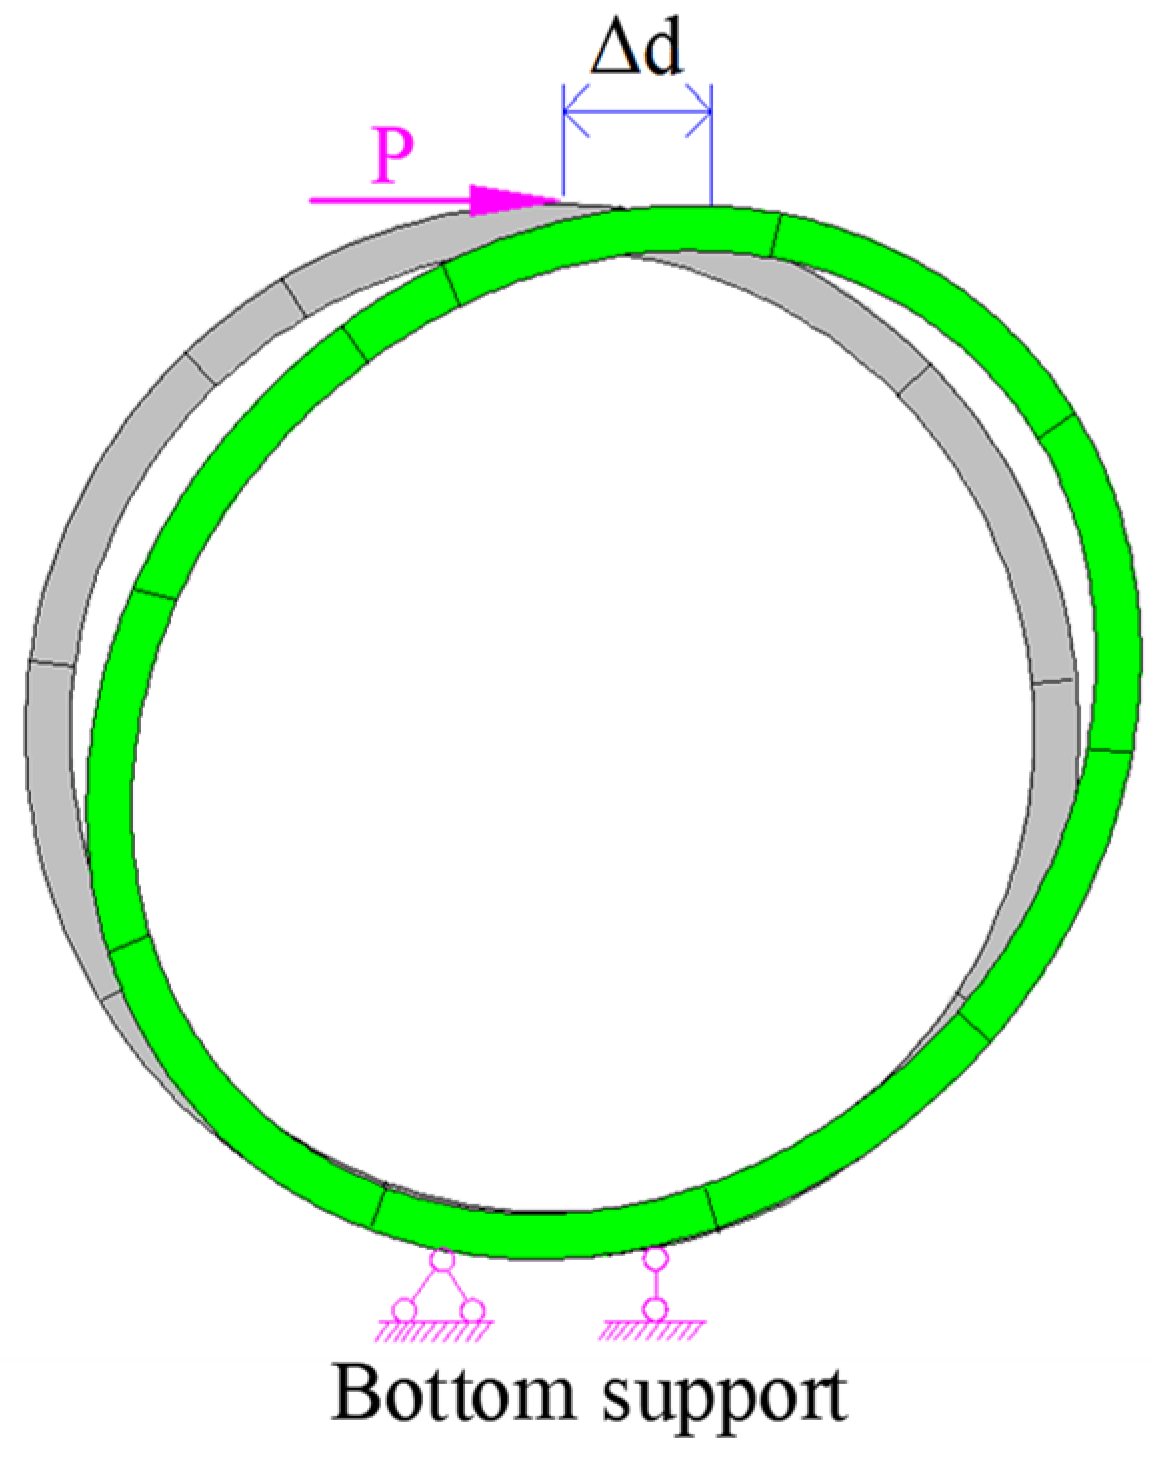
where G is the shear modulus of prototype soil, it is calculated from the average unit weight and the equivalent shear wave velocity of the site; A is the shearing area; L is the unit width; ρ is the average unit density; v is the equivalent shear wave velocity of the site; K s o i l = 914,083 N/mm. K t u n n e l is the transverse stiffness of the prototype tunnel, obtained by a numerical simulation here as previous literature [3]. The modeling method of a tunnel liner can refer to Zhang’s paper [16]. The load applying method of the model can refer to Bao’s paper [3]. A concentrated load is applied to the top of the model ring. The sketch of the numerical simulation model is shown in Figure 4. The bottom support of the numerical model is consistent with that of radial stiffness test of model tunnel. The transverse stiffness of the prototype tunnel can be evaluated thereafter, K t u n n e l = P / Δ d = 994 N/mm.

2.4.2. Stiffness of Model Tunnel

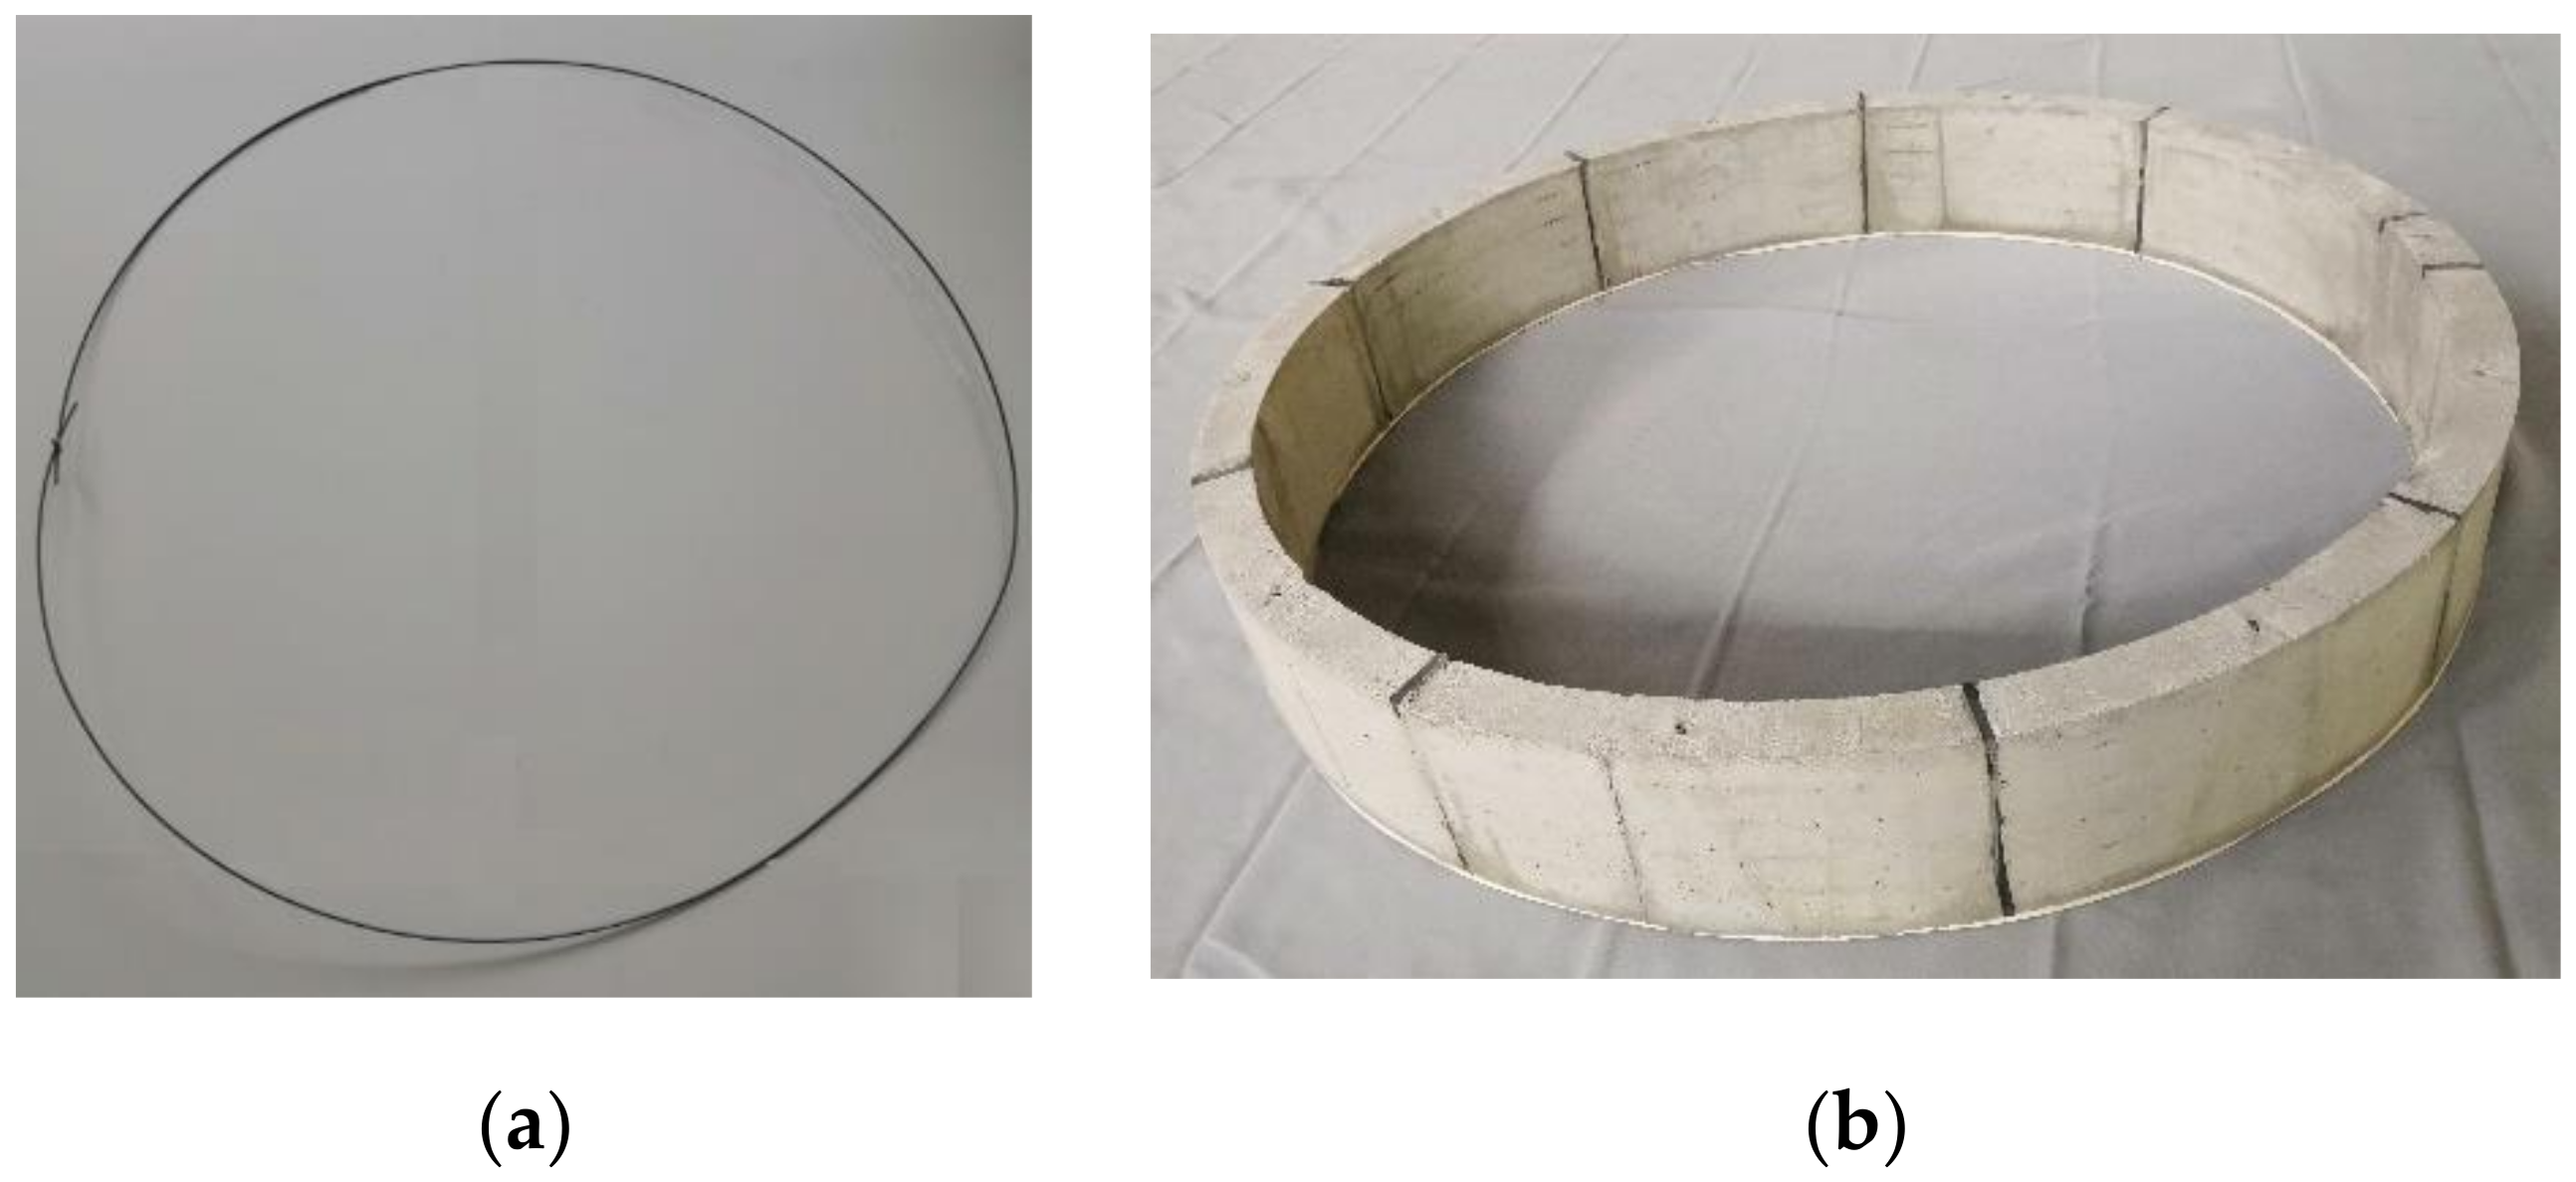
Following the geometric similitude rule, the diameter of model tunnel is 933 mm, and the thickness of a segment is 40 mm. Segments were poured by cement mortar. To get the targeted transverse stiffness of model lining, steel wires and rubber strips were applied to reproduce circumferential bolts and sealant of longitudinal joints, as Figure 5 displays. According to the principle of tensile stiffness equivalent, circumferential bolts were replaced by 3 steel wires with a diameter of 2.5 mm. The layout of the steel wires imbedded in the segmental linings corresponds with the position of the bolt holes in the prototype tunnel.
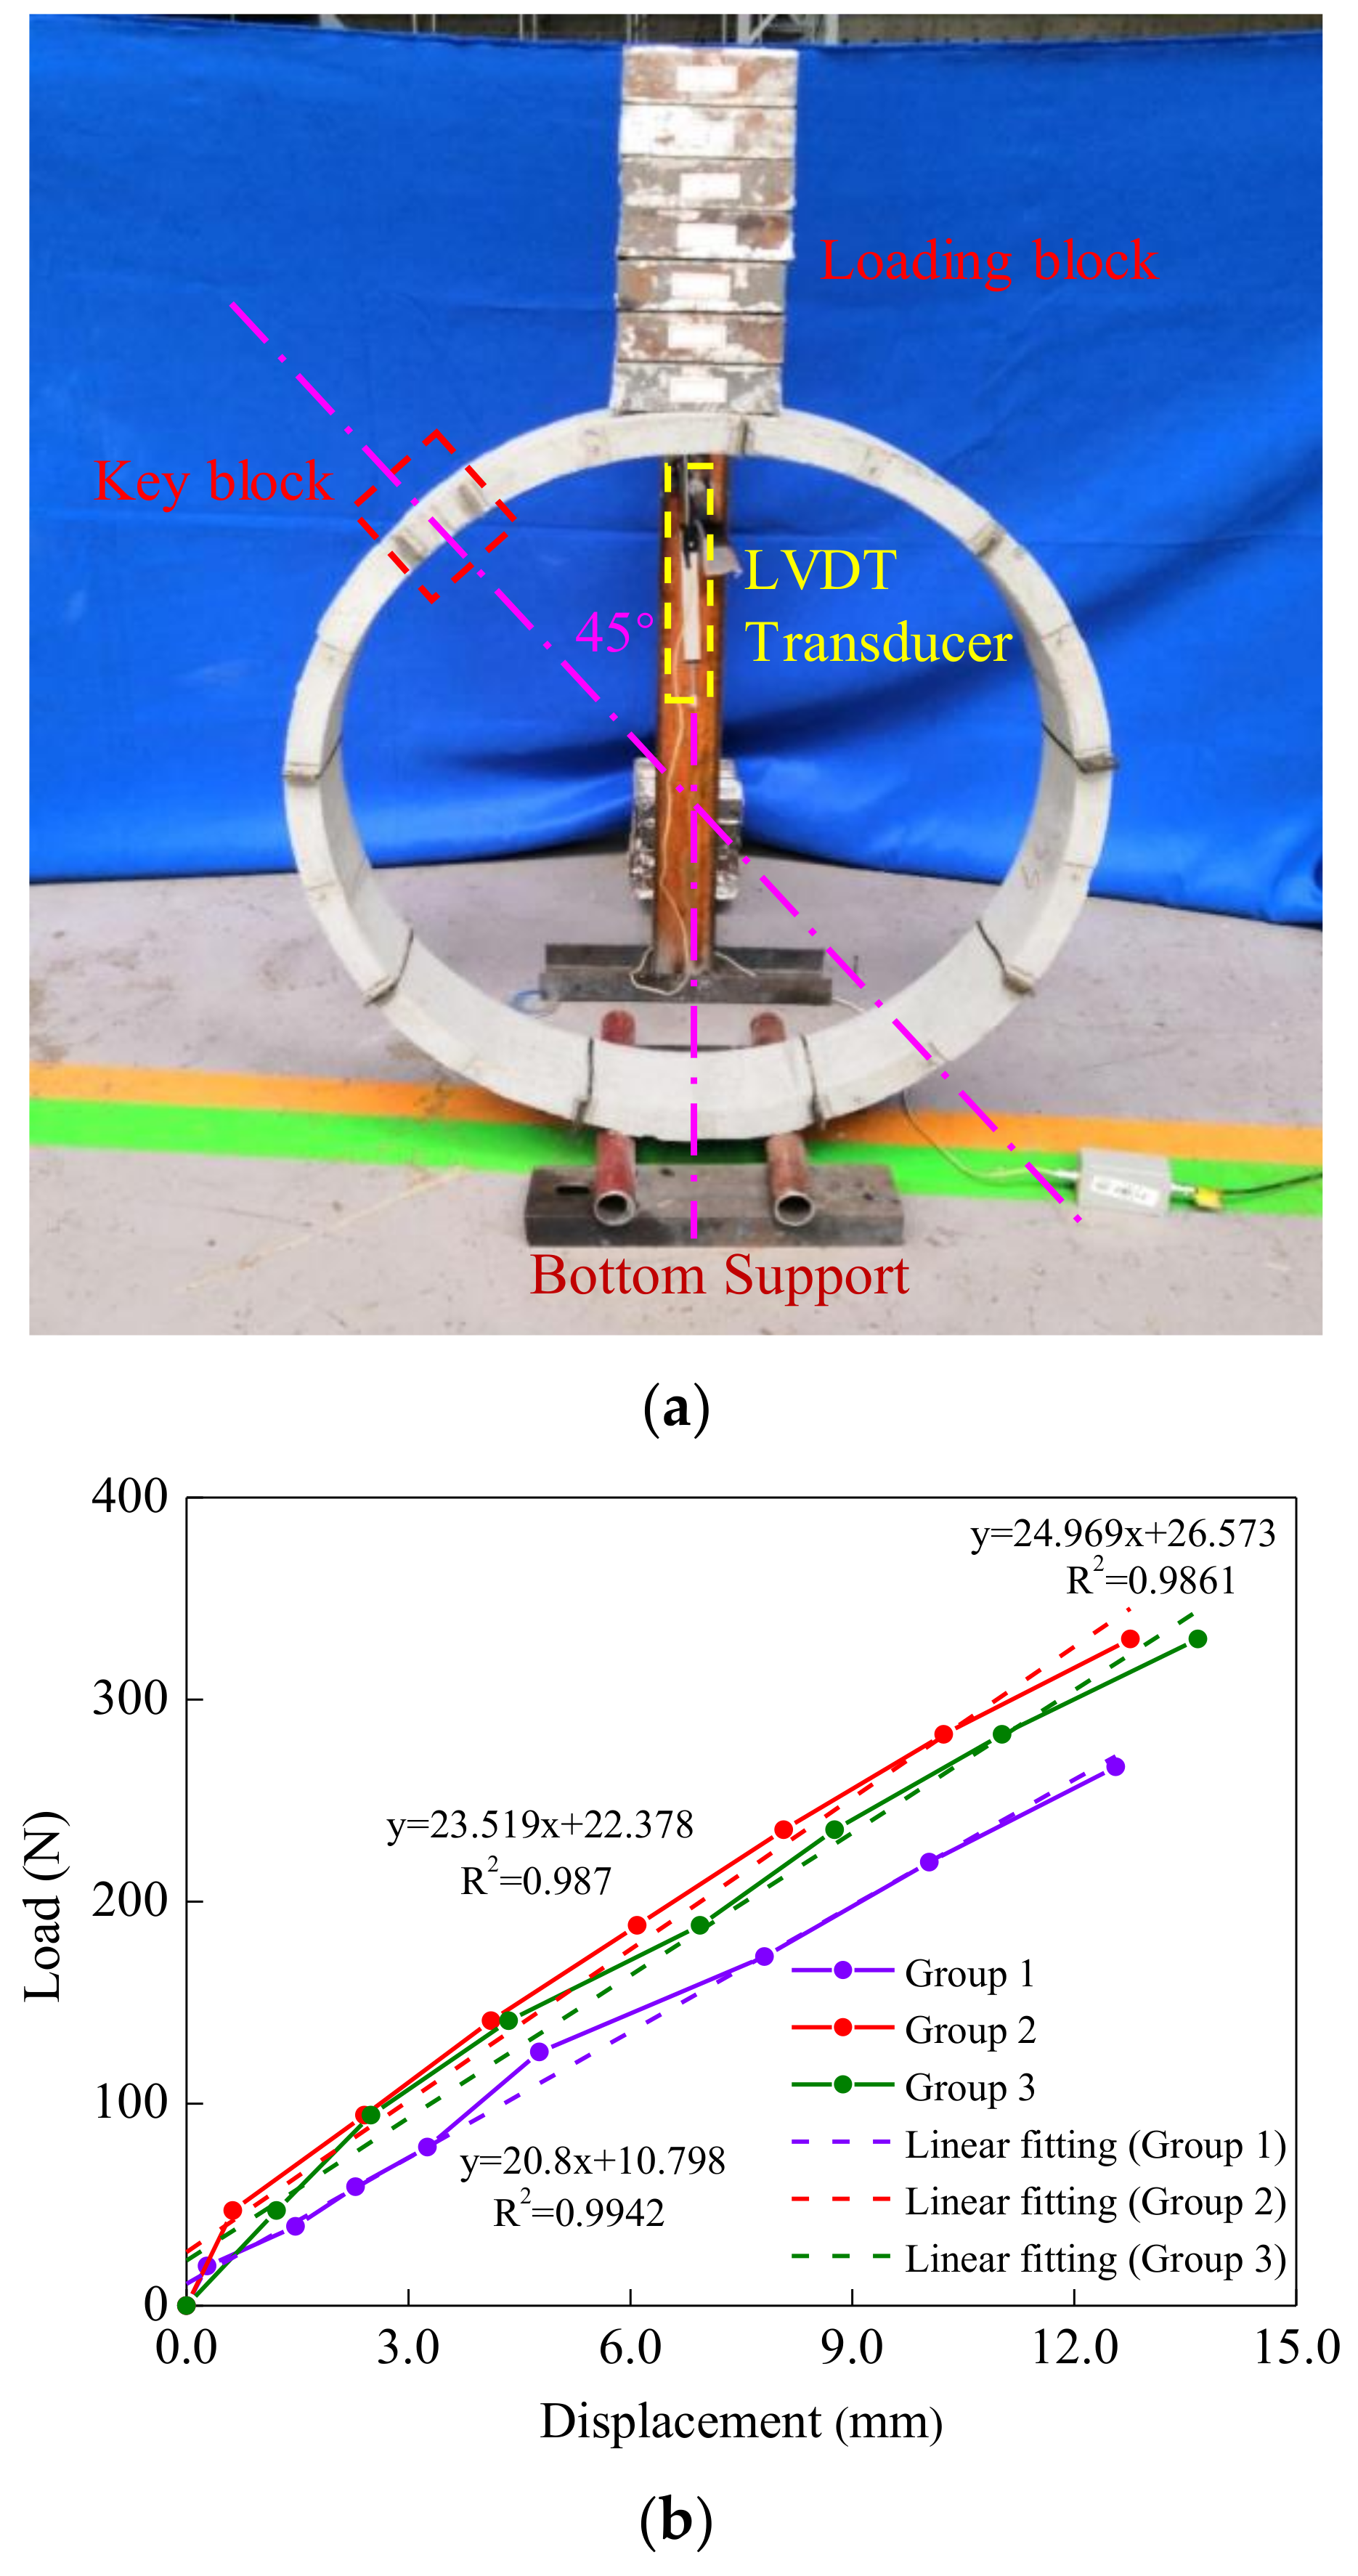
In this paper, the radial stiffness of the segmental lining is obtained by multi-stage loading test along a 45-degree direction of tunnel’s cross-section. The vertical displacement at the top of the segmental lining was observed by LVDT Transducer, as shown in Figure 6a [3]. In order to decrease the random errors, the final datum is the mean value of 3 group test data. Seven-stage loading was employed in the test. The weight of a loading block is 0.05 kN in each stage. The test results are shown in Figure 6b. According to the test results, the mean value of 3 group test data gives stiffness of the model tunnel as 23.10 N/mm. A numerical model was established to simulate the loading test. The parameters of joints in the numerical model can be calibrated by this loading test. According to the Figure 4, a horizontal concentrated load is applied to the top of the calibrated model. Finally, the transverse stiffness of the model lining can be obtained.

2.4.3. Similarity of Stiffness Ratio and Validation

Define the similarity of the stiffness ratio as follows:
S f = f / F
To get the targeted transverse stiffness of model lining, the stiffness of model tunnel should be consistent with that of prototype, that is, the similitude of stiffness should be S f = 1 . The stiffness ratio of the model ground with respect to the model tunnel, that is, the stiffness ratio of the model, is calculated as follows:
f   =   k soil / k tunnel
where k soil is the shear stiffness of soil column of the model ground in unit width; it is easy to calculate k soil = 2926 N/mm with the parameters of the model site and artificial soil. Moreover, k tunnel is the transverse stiffness of the model tunnel gotten from above test and numerical simulation.
Based on the results of the Table 3, the similarity of stiffness ratio is 1.01, and the difference of stiffness ratio between prototype and model is 0.97%, which confirm the validity and rationality of the model design.

2.5. Scheme of the Experiment

The purpose of this investigation is the soil–tunnel responses under sinusoidal excitations. There are several issues to be decided before testing. One is the preparation of models, and the other is the design of input cases. To contrast the dynamic responses of tunnel with that of uniform ground, both a free-field model (FF) and soil–tunnel model (ST) were prepared. The selection of input motions is a key issue in seismic design of engineering structures, and probabilistic variations in the ground motion are an important determinant of structural response [17,18].

2.5.1. Preparation of Free-Field Model

The response of FF model is that of the model ground. Following the pouring of the artificial soil, we positioned accelerometers in the ground and then attached displacement gauges on the edge of the laminar box, as indicated in Figure 7.
Accelerometers, which were labeled AZ1, AZ2, AZ3, AZ4, and AZ5, were arranged vertically at the center of the ground for monitoring the acceleration responses of the model soil with depth, in the same interval of 700 mm. There were 12 linear wire displacement gauges, which were labeled as LX1 till LX12 from bottom to top of the box along the vertical direction in Figure 7, aiming to observe the lateral deformation of the ground. They were deployed evenly on the external surface of the laminar box and were attached to standing pole through molybdenum wire.

2.5.2. Model Tunnel and Its Instrumentation

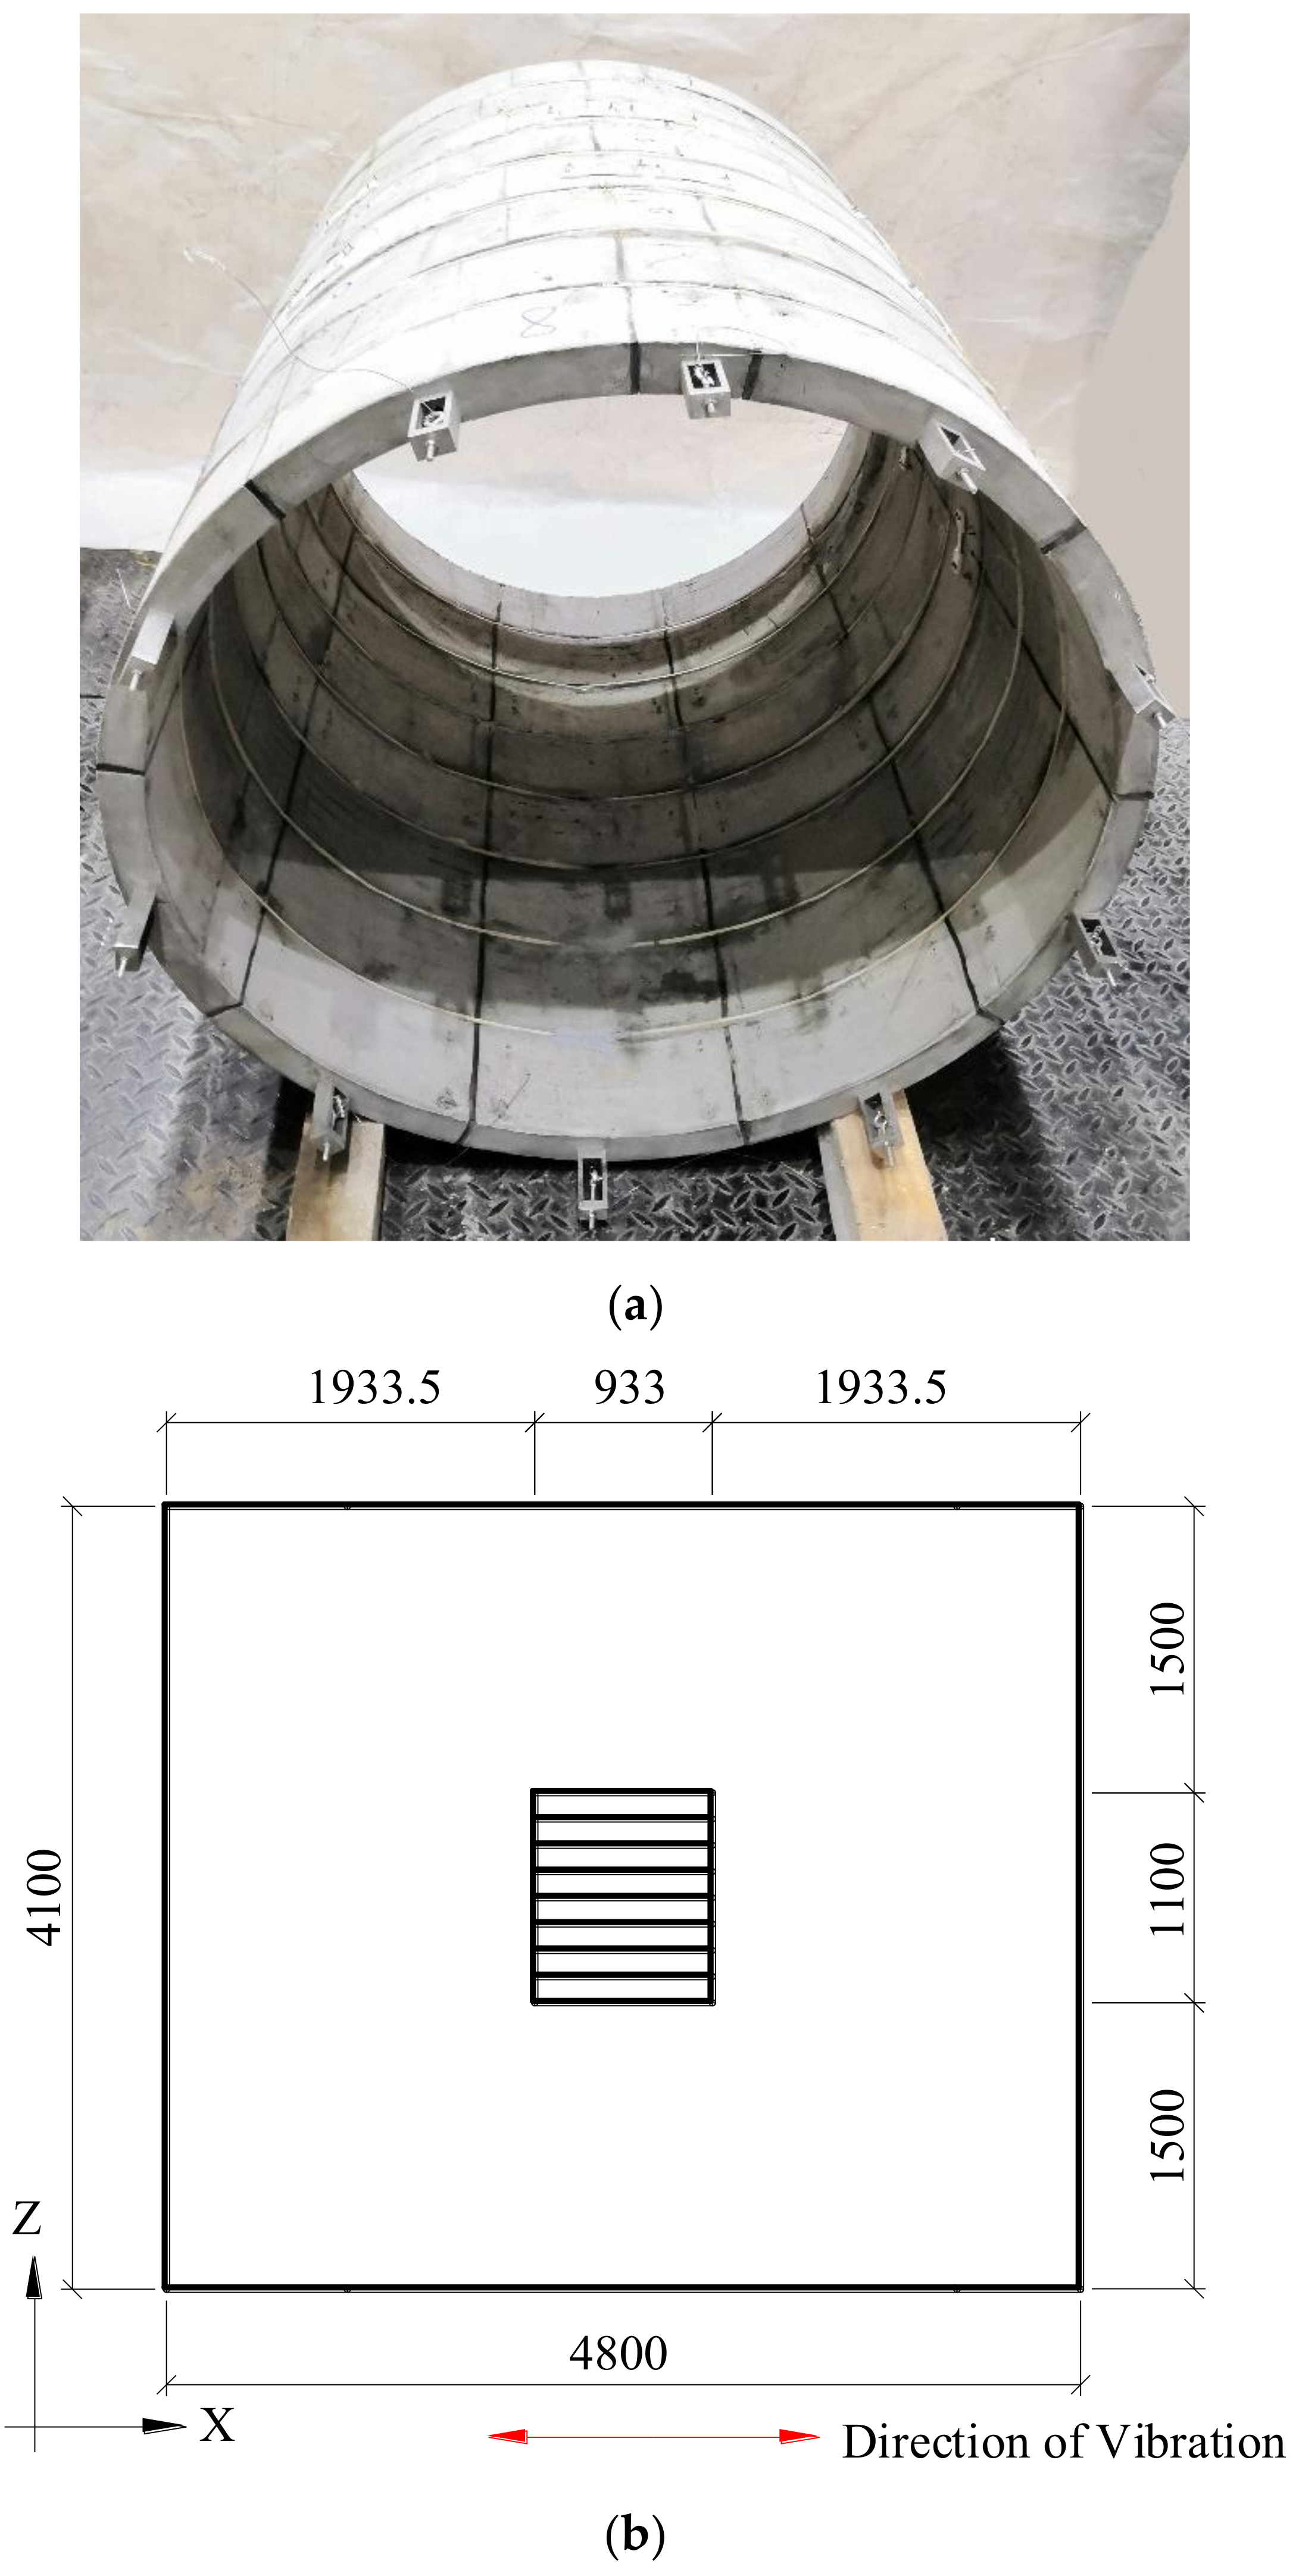
The model tunnel is composed of 8 rings of segmental lining. For the purpose of transverse response, straight joints were adopted between lining rings, as shown in Figure 8a. As with the circumferential bolts, the longitudinal bolts between rings were replaced by 10 steel wires with a diameter of 0.8 mm. It was assumed that each ring would react in the same way under transverse excitation. To eliminate the effect of boundary, only the middle 4 rings out of 8 rings were used as instrumented ones.
The assembled model tunnel was placed in the center of the ground in both plane as Figure 8b and elevation as Figure 7. The central axis of model tunnel is perpendicular to the long side of laminar box (direction of vibration). The vertical distance from the central axis of the model tunnel to the bottom of the laminar box is 1400 mm. The cover thickness of soil above the tunnel is one time of tunnel diameter, that is 933 mm. Both ends of the model tunnel are at an equal distance to the internal surface of the laminar box.
The arrangement of accelerometers in the soil of ST model is consistent with that of FF model, except the one labeled one (AZ3) was occupied by the tunnel.
Instrumentation on the tunnel is as Figure 9 indicated. There were 5 types of sensors attached to it. The parameters of these instruments are shown in Table 4. The sensors are shown in Figure 10. Two accelerometers, labeled A-top and A-bottom, were arranged at the top and bottom of the tunnel, respectively, detecting the acceleration response of the model tunnel. Pairs of displacement gauges to record the extension/closure of longitudinal joints were arranged on the internal and external side of each longitudinal joint respectively, labeled D1 till D10 and marked as ‘-IN’ and ‘-OUT’. Inductive displacement transducers were arranged to observe the cross-sectional deformations of the model tunnel, labeled BD1 till BD4, along diametral direction of tunnel’s cross-section at 0 degrees (horizontal), 45 degrees, 90 degrees (vertical), and 135 degrees, respectively. Earth pressure gauges were arranged on the external surface of the model tunnel, labeled P1 till P4, and P6 till P8. Strain gauges, labeled SW1 till SW4, were arranged on the external surface of the model tunnel to observe the dynamic deformation of segments.

2.5.3. Input Motions and Testing Cases

In order to study the relationship between dynamic responses of segmental tunnel and input motions conveniently, sinusoidal wave was introduced as the input motion in this paper. To analyze the frequency responses of the ground and observe the changes of the ground frequency responses after sinusoidal excitations, two white-noise cases were carried out before and after seven sinusoidal excitations cases, respectively. Target acceleration amplitude was fixed at 0.1 g for all the input cases applied to both the FF model and ST model.
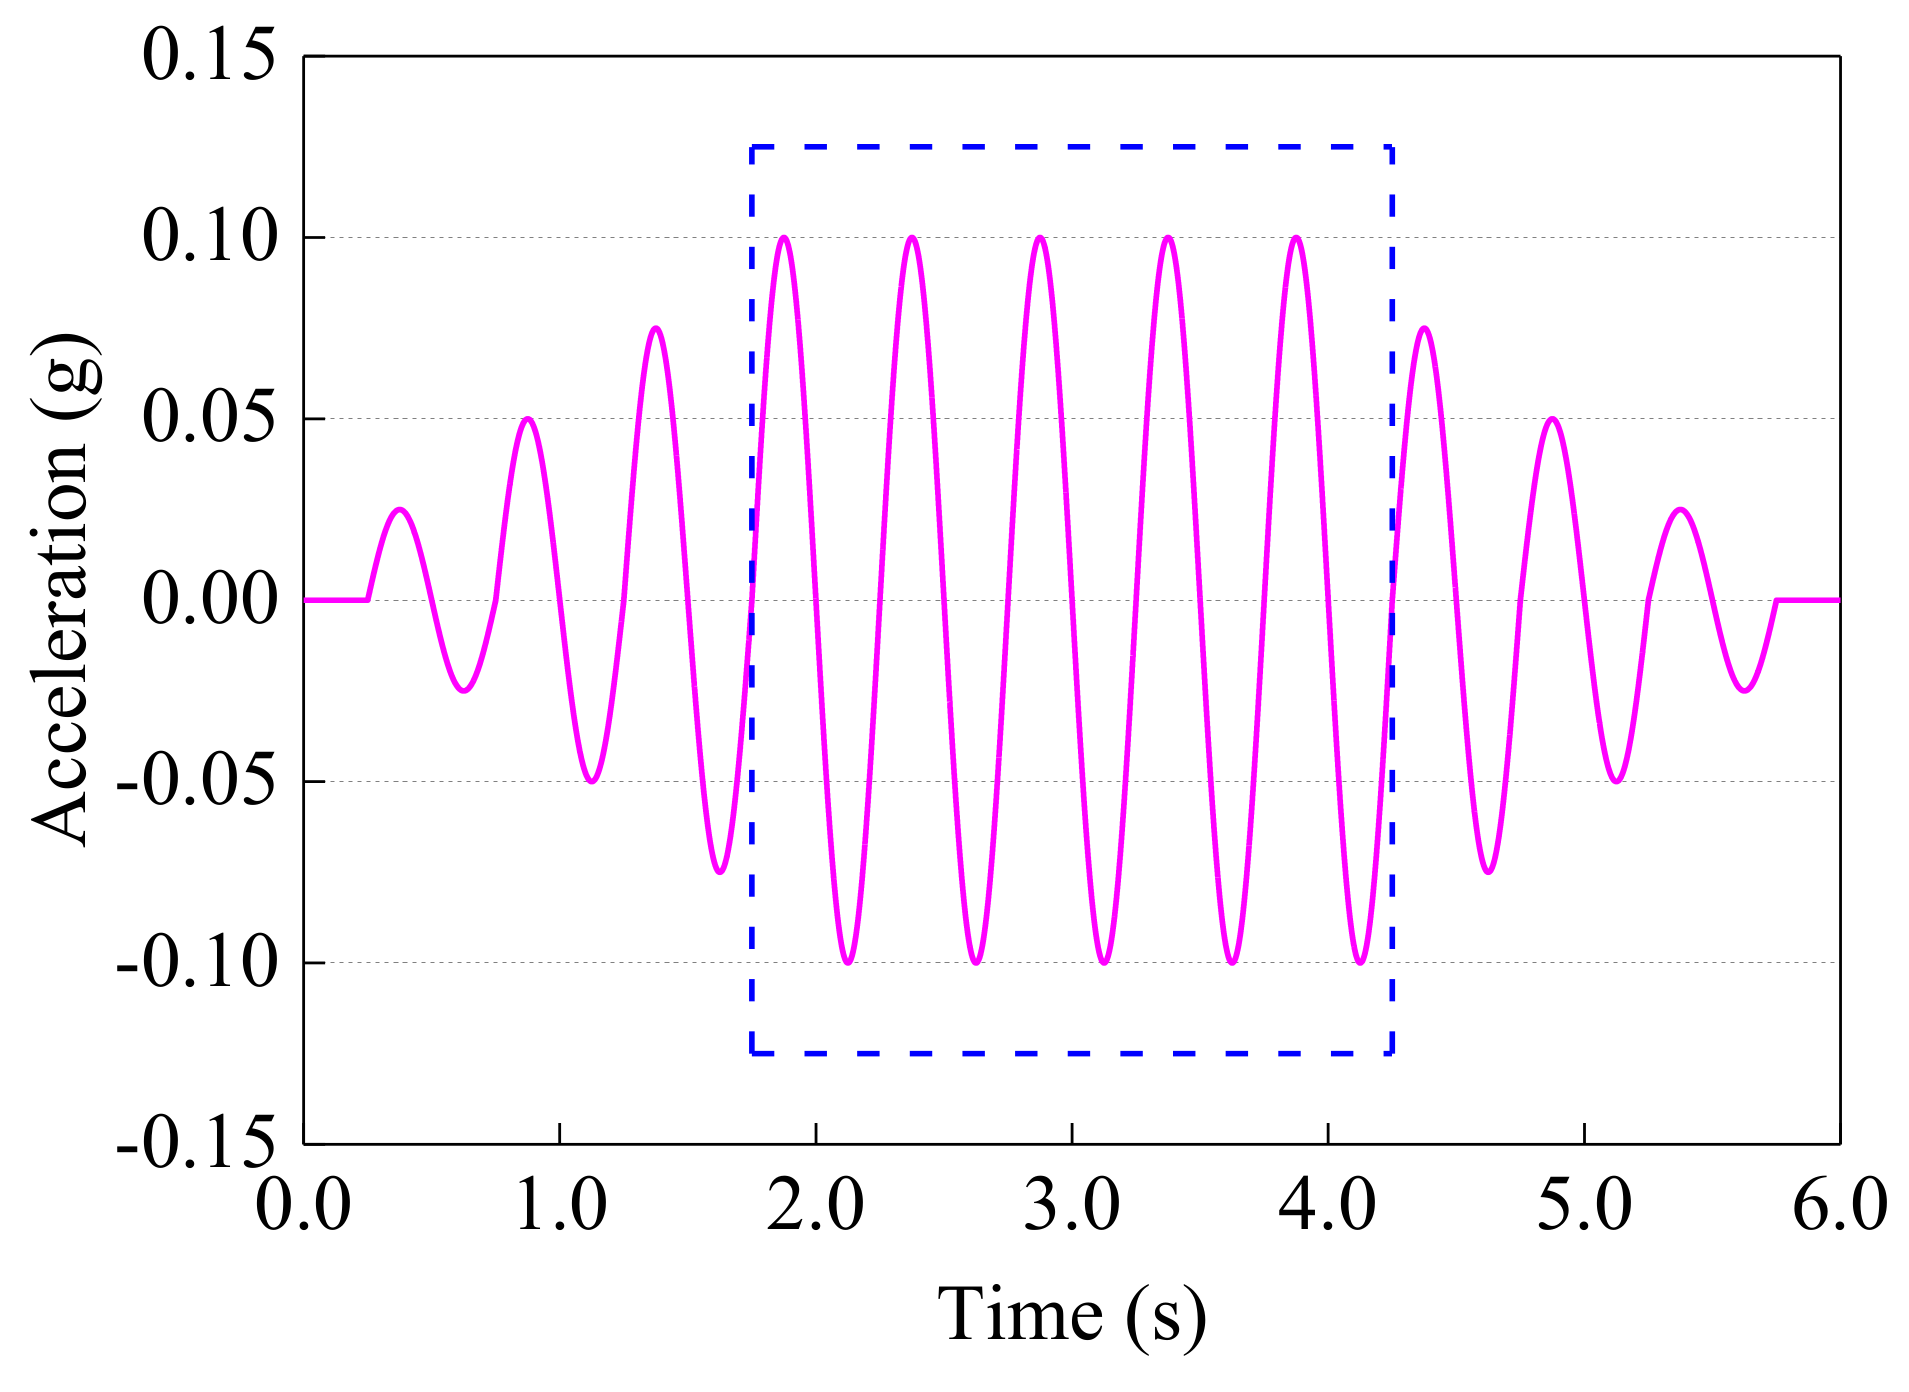
The testing cases are shown in Table 5. Seven sinusoidal excitations with frequencies from 2 to 17 Hz were designated to cover the fundamental frequency of the model ground, with the input of transverse direction. The testing cases of FF model test were input in order in Table 5, which is consistent with that of ST model test. Figure 11 shows the time history of sinusoidal excitation with a frequency of 2 Hz. The middle 5 cycles of input from 1.75 to 4.25 s are the expected targets.

3. Fundamental Frequency Responses of Two Model Grounds

The test results of FF model and ST model under white-noise cases are given in the Table 6. It is clear that, though the fundamental frequency of ST ground is a little higher than that of FF ground, the value is insignificant. In respect to the interaction between the soil and tunnel, the presence of the tunnel will not seriously affect the deformations of ground. It must be a result of the lower flexibility of the segmental lining, ratio 929 [19], as shown in Table 3.
Comparing the test results of WN-1 with WN-2 of each model, as can be seen from Table 6, (1) the fundamental frequency of both grounds decreases after sinusoidal inputs; and (2) the maximum relative difference of the fundamental frequencies is 0.81% for the FF ground and 1.20% for the ST model. These results show that the fundamental frequency of the model ground has not significantly changed after seven sinusoidal excitations cases. It implies that the behavior of the soil remains nearly constant under a given intensity of 0.1 g inputs.

4. Response of FF Ground under Sinusoidal Excitation

4.1. Acceleration along Depths

4.1.1. Time Histories

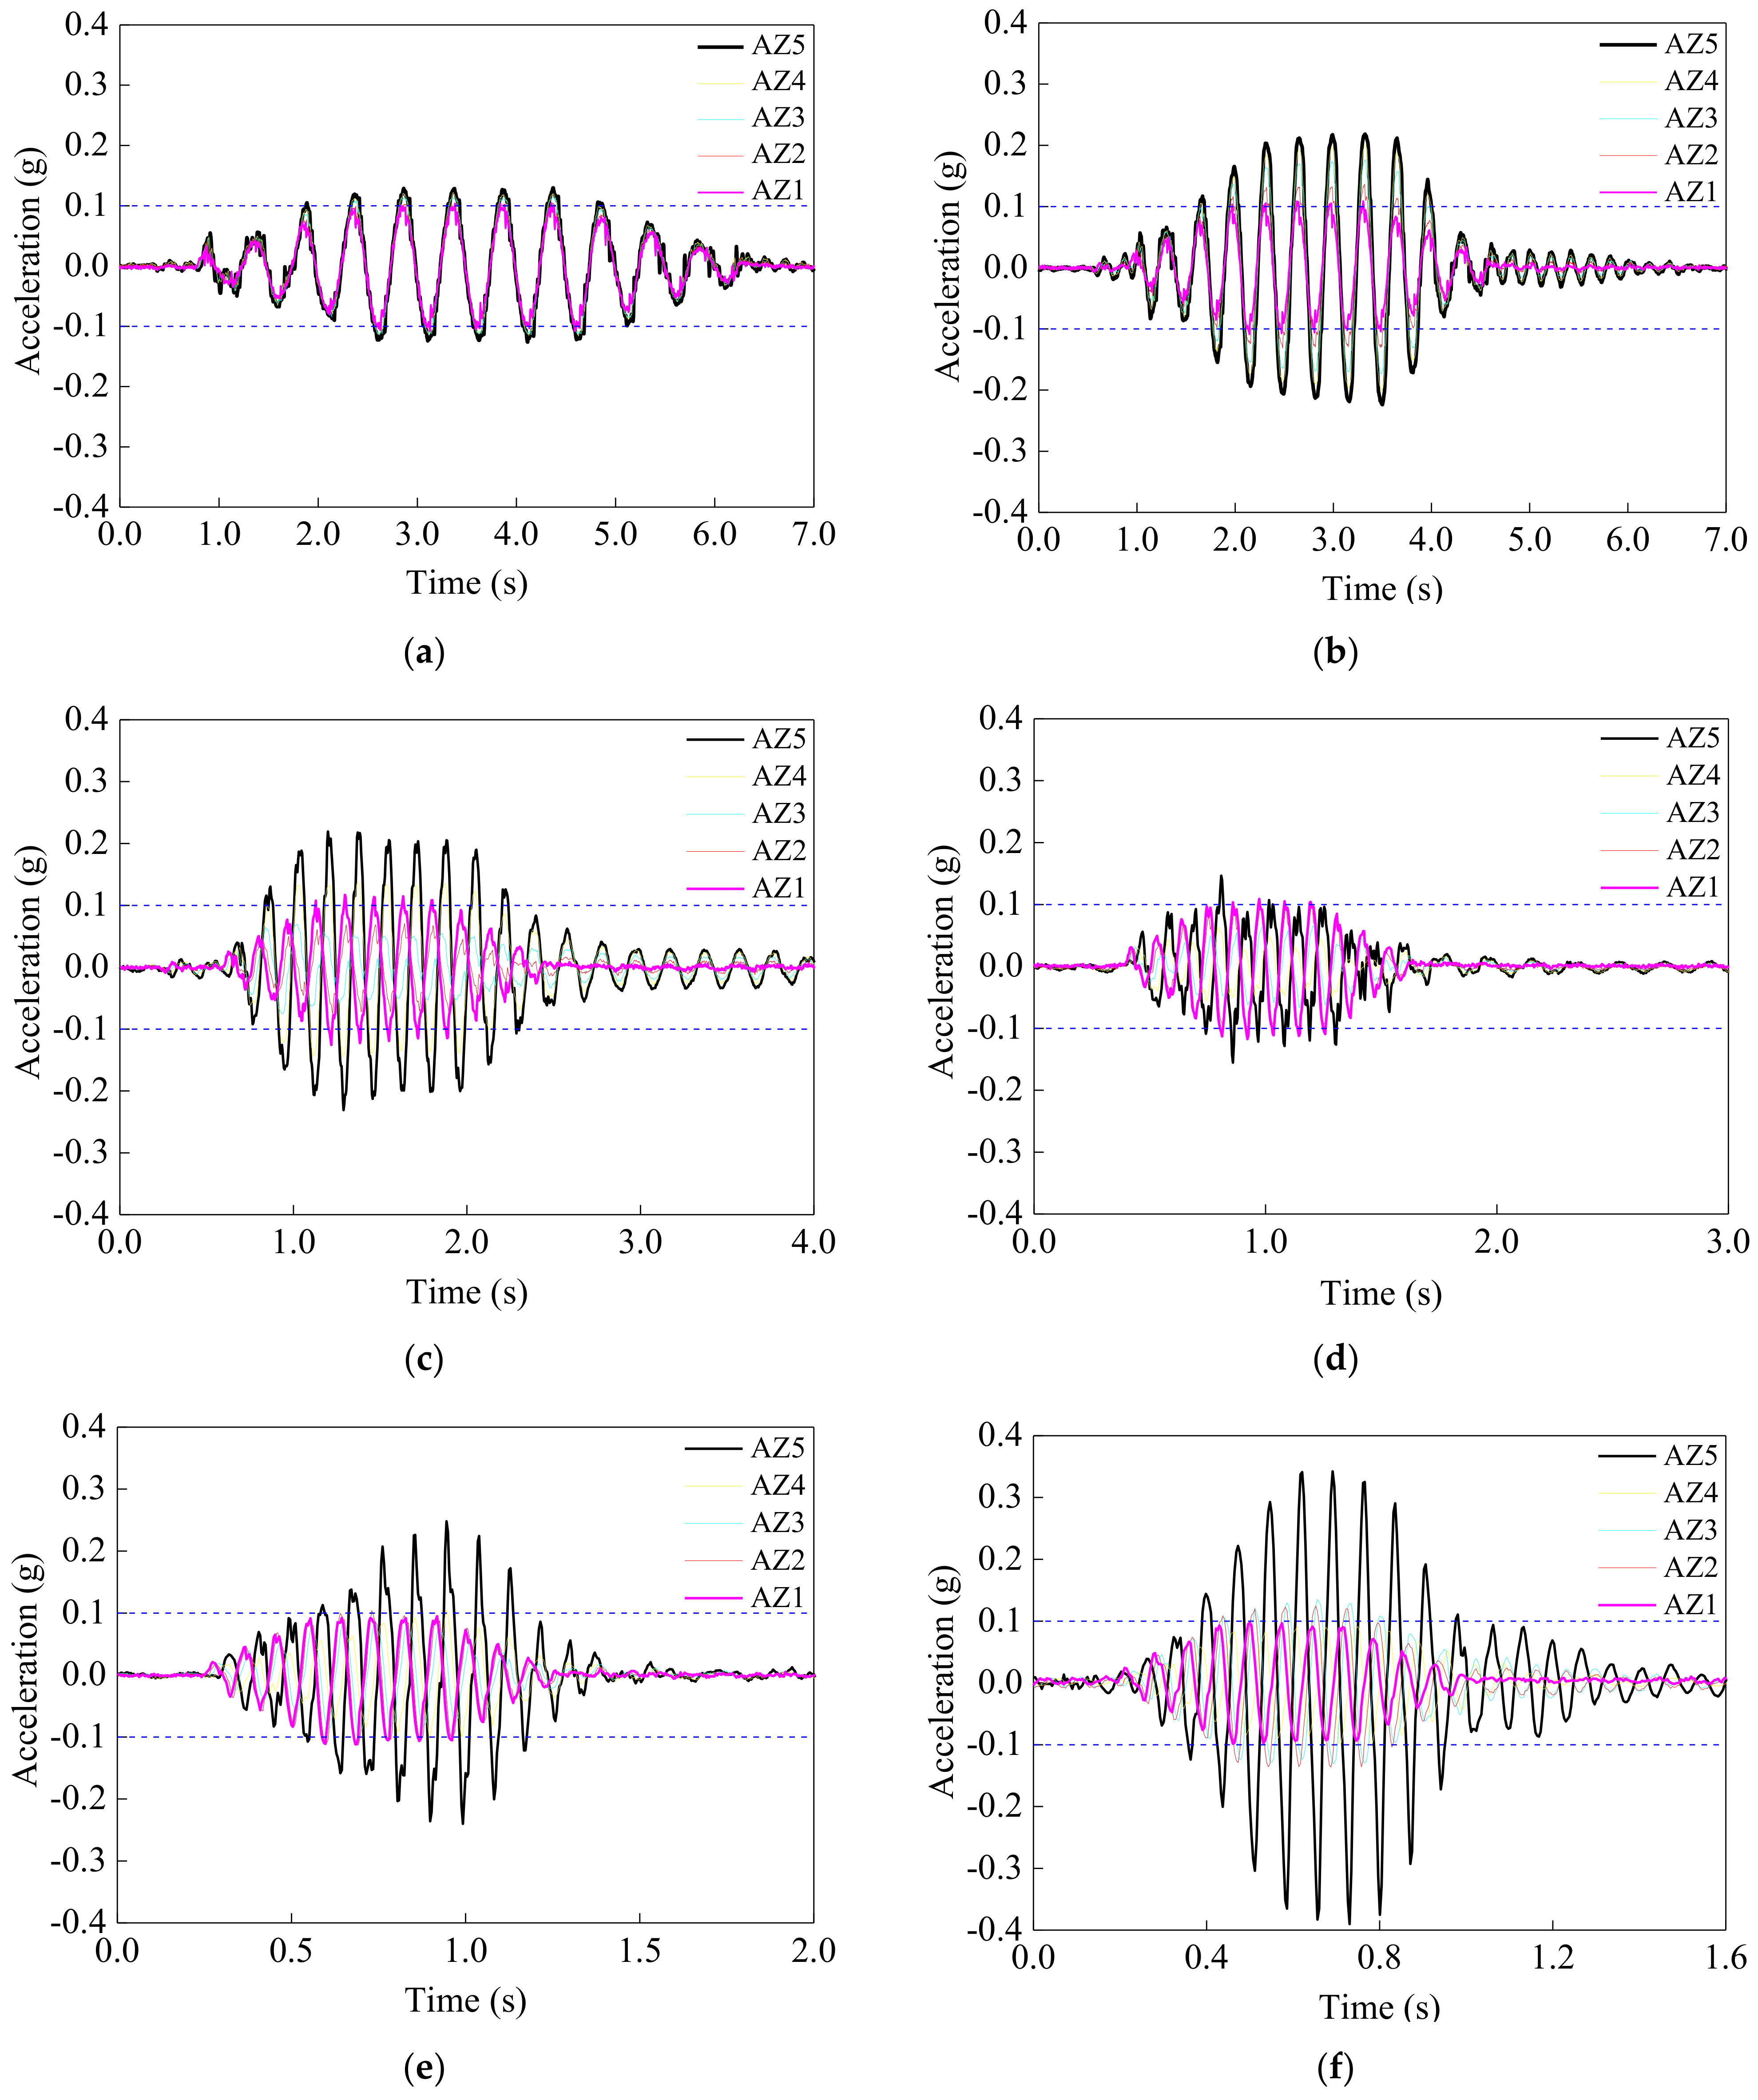
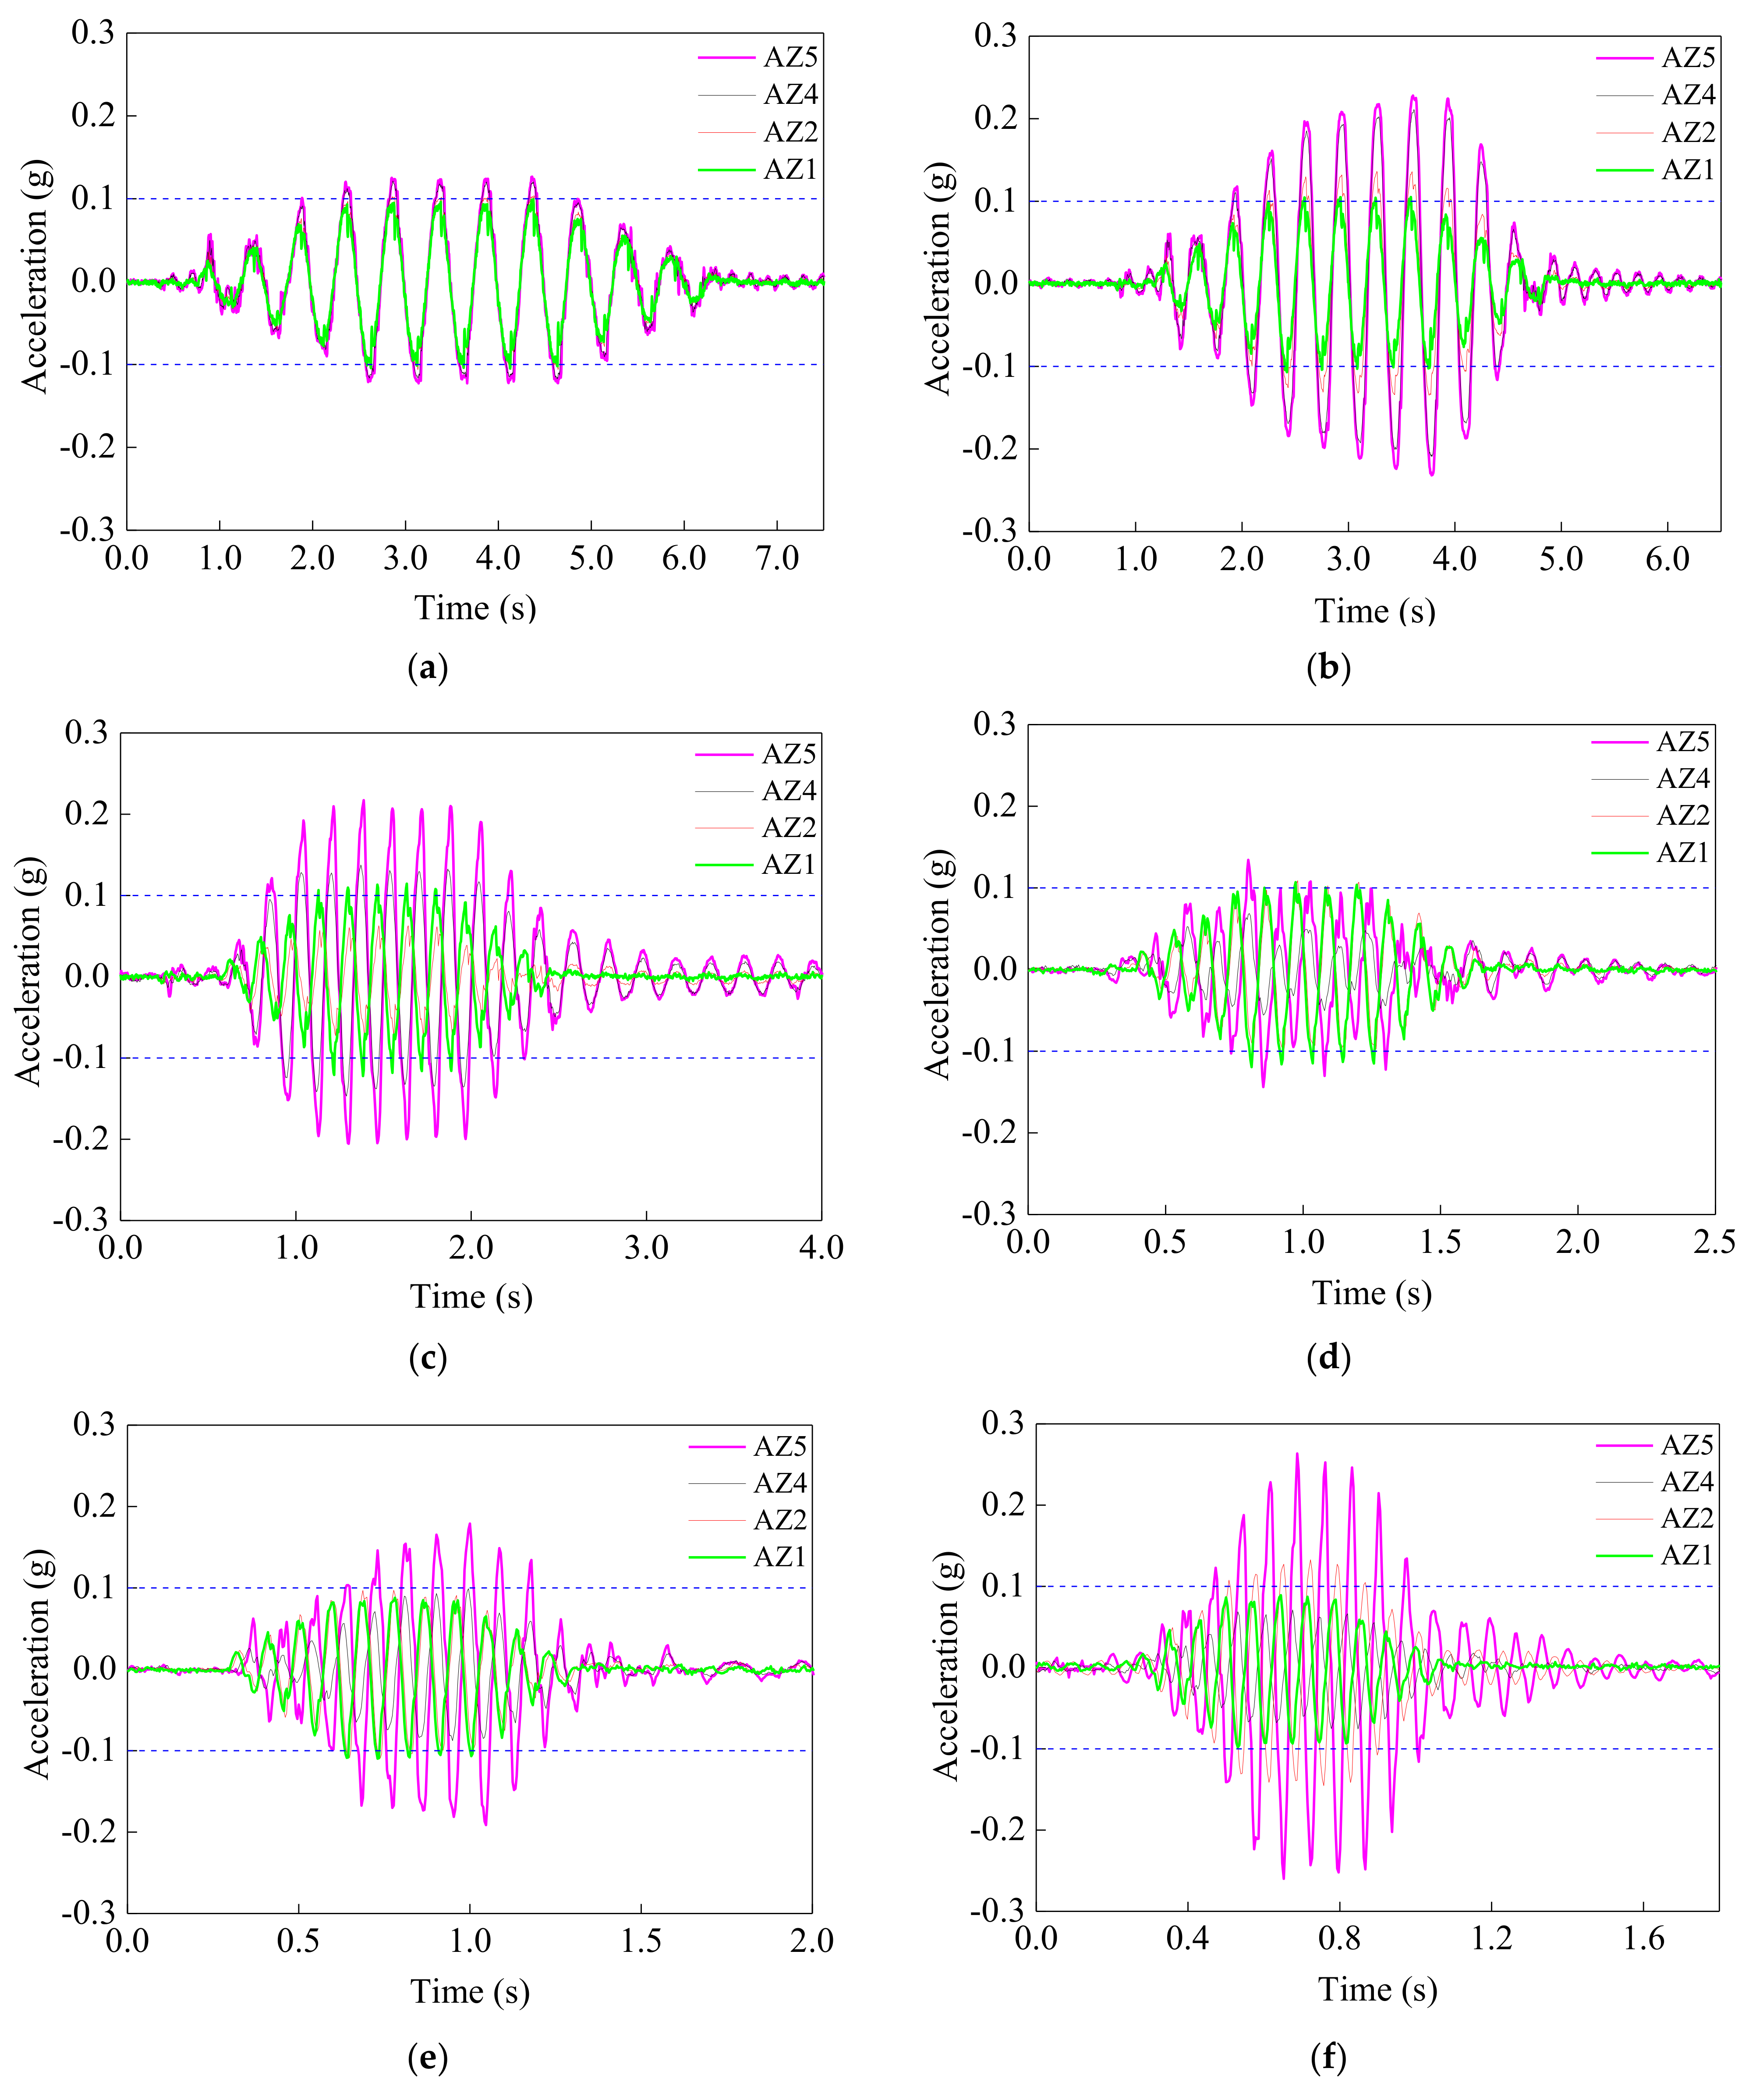
Time histories of acceleration responses with depths are shown in Figure 12 for the ground of FF model. One should be sure that only the middle five stationary cycles that correspond to the middle of five cycles of input are of significance. Based on the records of acceleration responses from the bottom to the top surface of the FF ground, the variation of waveform, phase, and peak of acceleration at elevated position can be addressed.
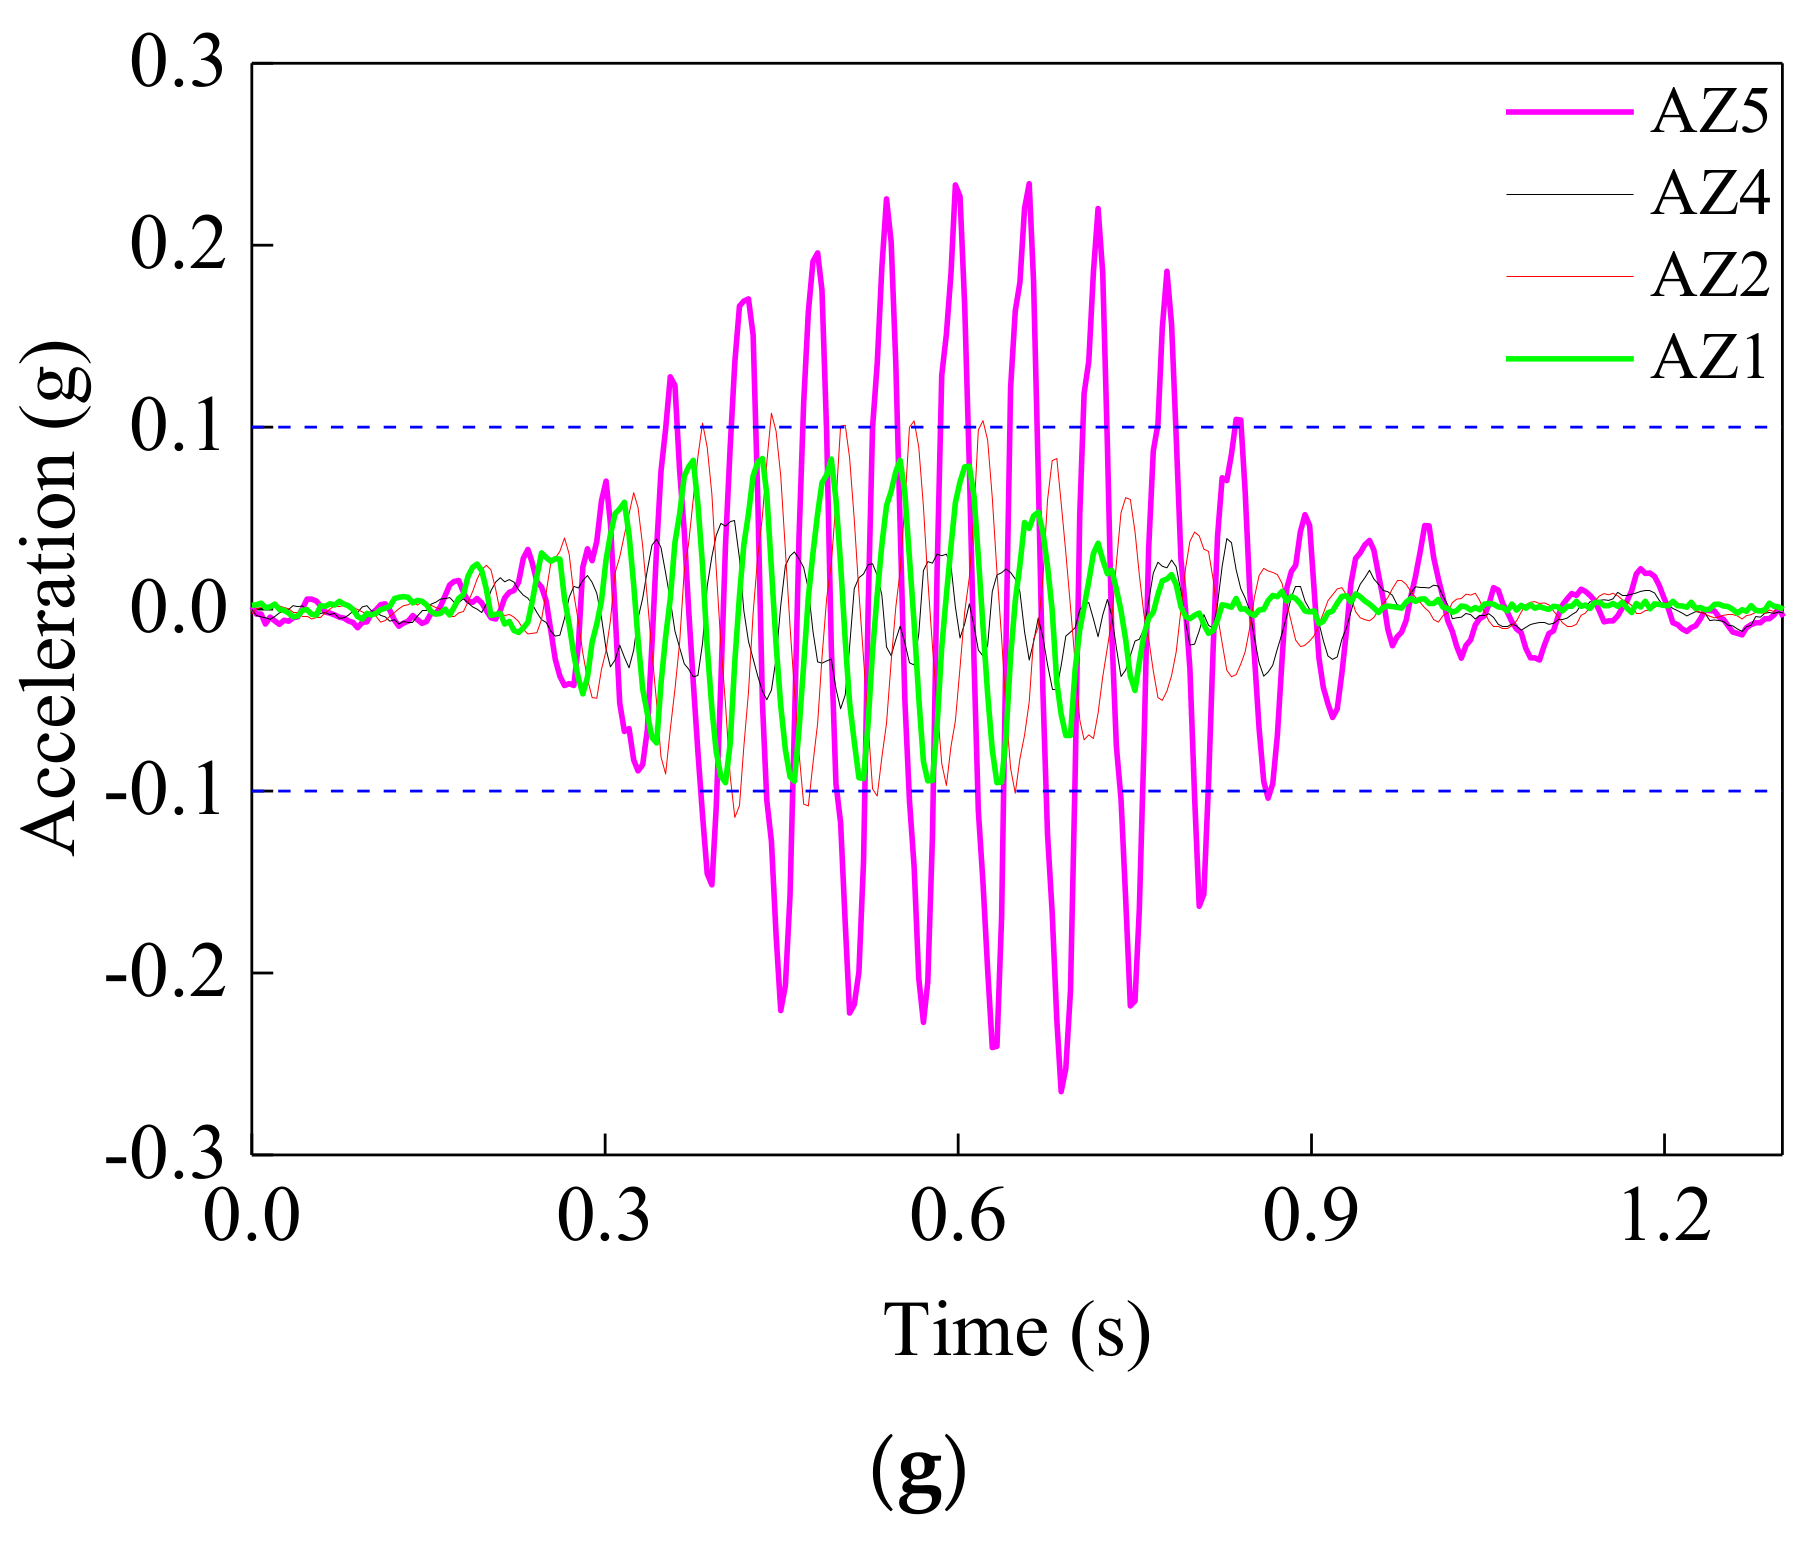
Basically, the waveform of acceleration responses at each monitoring position is approximately sine function as input. In the case of the Sin-2 (Figure 12a), the waveforms of acceleration response of the upper soil layer are in concordance with that of the lower soil layer. In the case of the Sin-3 (Figure 12b), the peak accelerations are showing obvious differences between the upper and lower soil layer. The acceleration responses attenuate slowly with time. In the case of the Sin-6 (Figure 12c), acceleration responses are showing obvious phase difference (shown in Figure 13), especially between the surface (AZ5) and bottom (AZ1) soil layer. The phase difference of response waveforms at a monitoring position is defined as the time lag with respect to that at the bottom of the ground (AZ1). In the case of the Sin-9, the waveforms of acceleration responses become irregular.
In the cases of the Sin-11, Sin-14, and Sin-17, acceleration responses are different, whether phases or amplitudes. In the case of the Sin-14, the acceleration responses also attenuate slowly with time. The accelerations responses attenuate gently with time shows that the seismic energy excited by the sinusoidal excitation attenuates slowly. This probably due to resonance effects. When the frequency of excitation approaches the first or second natural frequency of the model ground, the decay time becomes much longer.
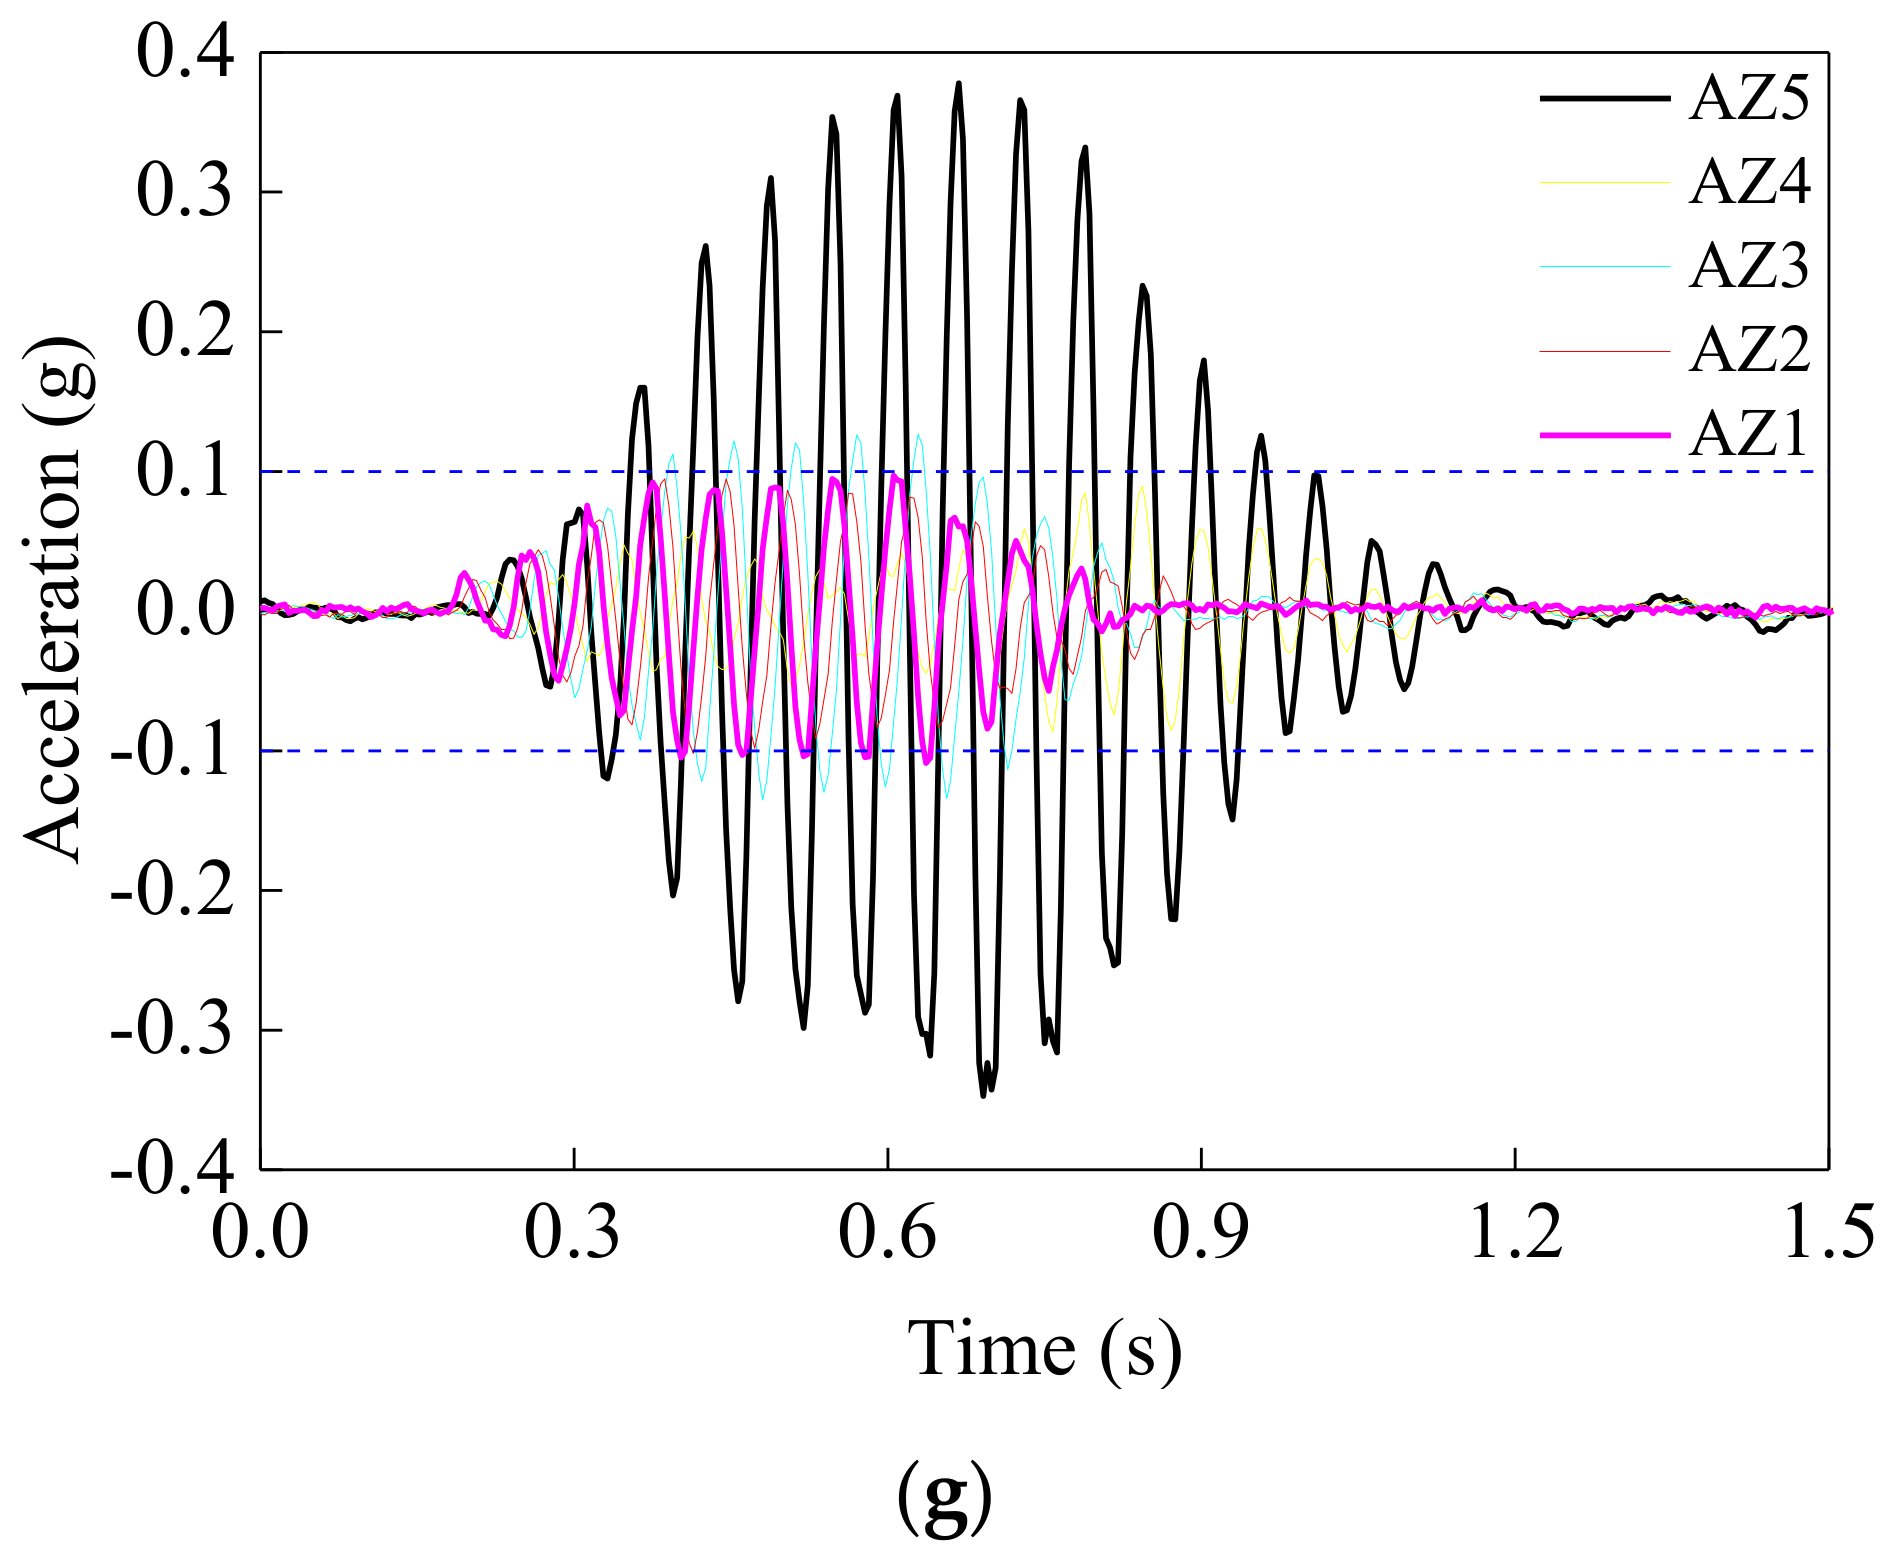
With the input frequency of 17 Hz, in case Sin-17 (Figure 12g), the phase difference reaches a maximum of 13/7π. Figure 13 gives the phase difference for all the cases. It can be seen that phase difference increases progressively with the input frequency increasing, but decreases with the depths. This is because the phase difference is proportional to the distance between the two stations, and inversely proportional to the wave period, which is consistent with that deduced by Olson and Rostoker [20].
To sum up, from the respect of waveform, phase, and peak, the differences of the acceleration responses between the upper soil layer and the lower soil layer obviously increase with the input frequency increasing.

4.1.2. Amplification Coefficients of Acceleration along Depth

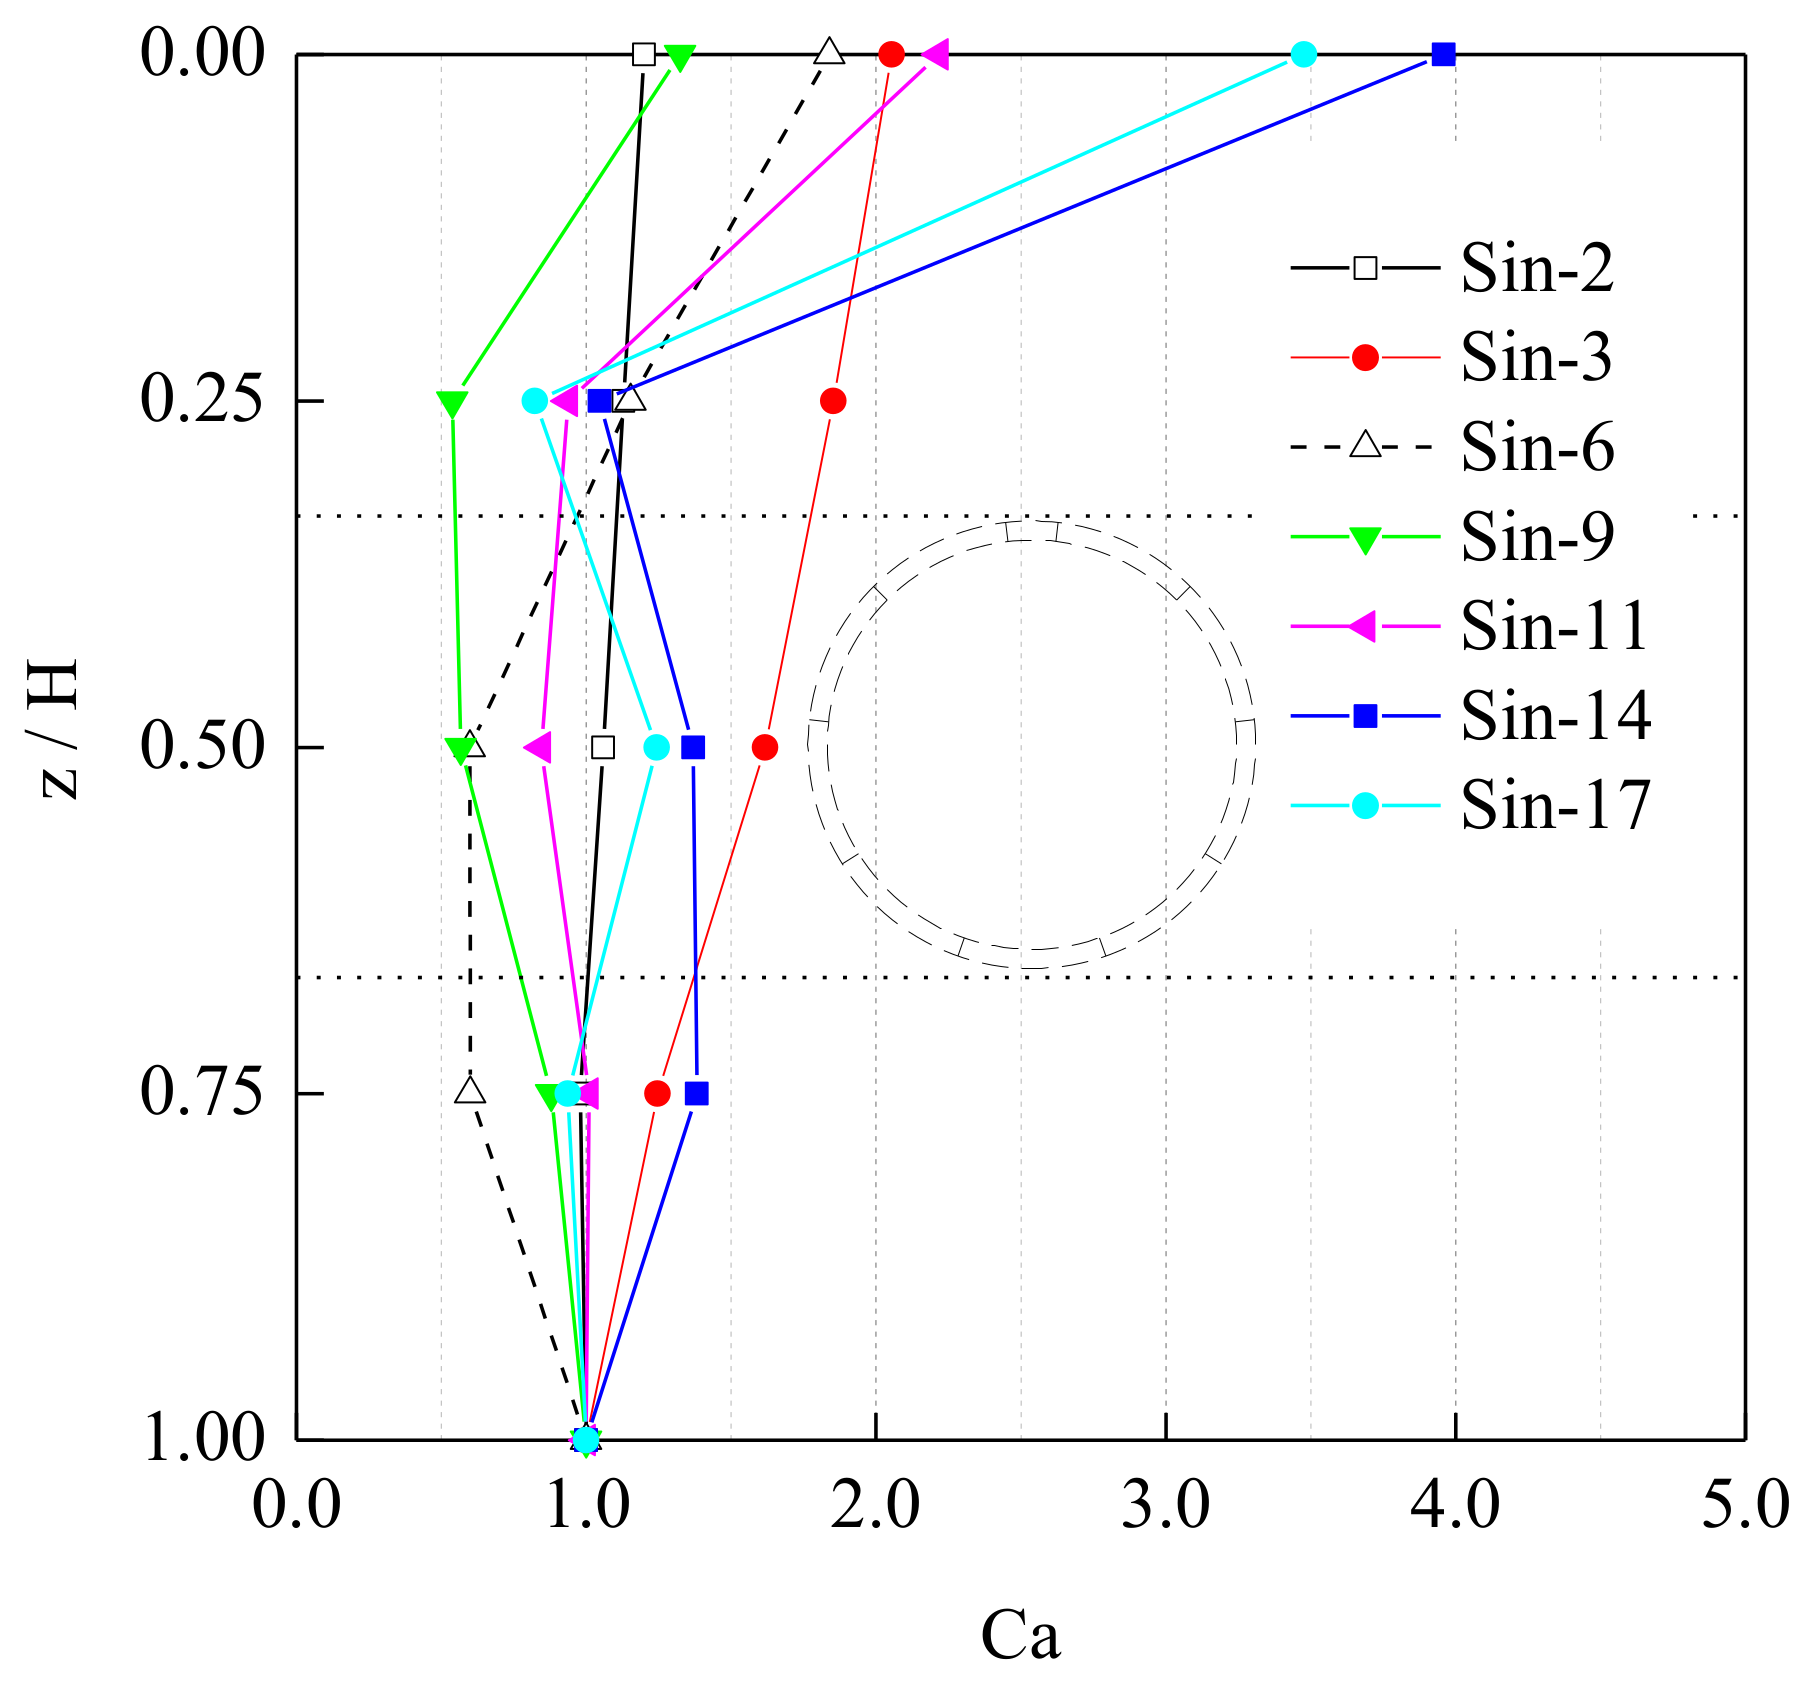
Variation of peak acceleration with depth can be qualified with the coefficient of acceleration amplification, C a . It is defined as the ratio of the peak acceleration at a monitoring position to that at the bottom of the ground.
C a = A z A 0
where A z is the peak acceleration at a monitoring position, and A 0 is the peak acceleration at the bottom. The variation of it along depths are shown in Figure 14.
In the cases of the Sin-2 and Sin-3, the acceleration amplification coefficients in the model soil increase along depths. In the cases of the Sin-6, Sin-9, and Sin-11, the amplification coefficients first decrease and then increase along depths, but amplification coefficients increase sharply in the surface soil layer. In the cases of the Sin-14 and Sin-17, the amplification coefficients first increase and then decrease and increase again along depths. The acceleration amplification effects of the surface soil layer are similar with the acceleration recordings of two downhole arrays, Treasure Island and La Cienega, instrumented by the Caltrans/CDMG project [21].
These results show that vibration transmission property of model soil may relatively decrease with the increase of input frequency in the middle soil layer. This is because the high-order vibration modes may be activated and show remarkable effects on the acceleration response of the model ground. Different combinations of modal amplitudes are activated under sinusoidal excitations of different frequency (concluded in Section 4.2). The propagation of seismic waves is also affected by many factors, including soil damping and the superposition effect of seismic wave. Therefore, the amplification mechanism is more complex in the surface soil layer, and acceleration amplification coefficients obviously increase under a higher excitation frequency.
To sum up, amplification effects of ground surface acceleration are obvious under a higher excitation frequency. Except for the surface soil layer, the soft ground has a damping effect on higher frequency excitations.

4.1.3. Response Spectrum

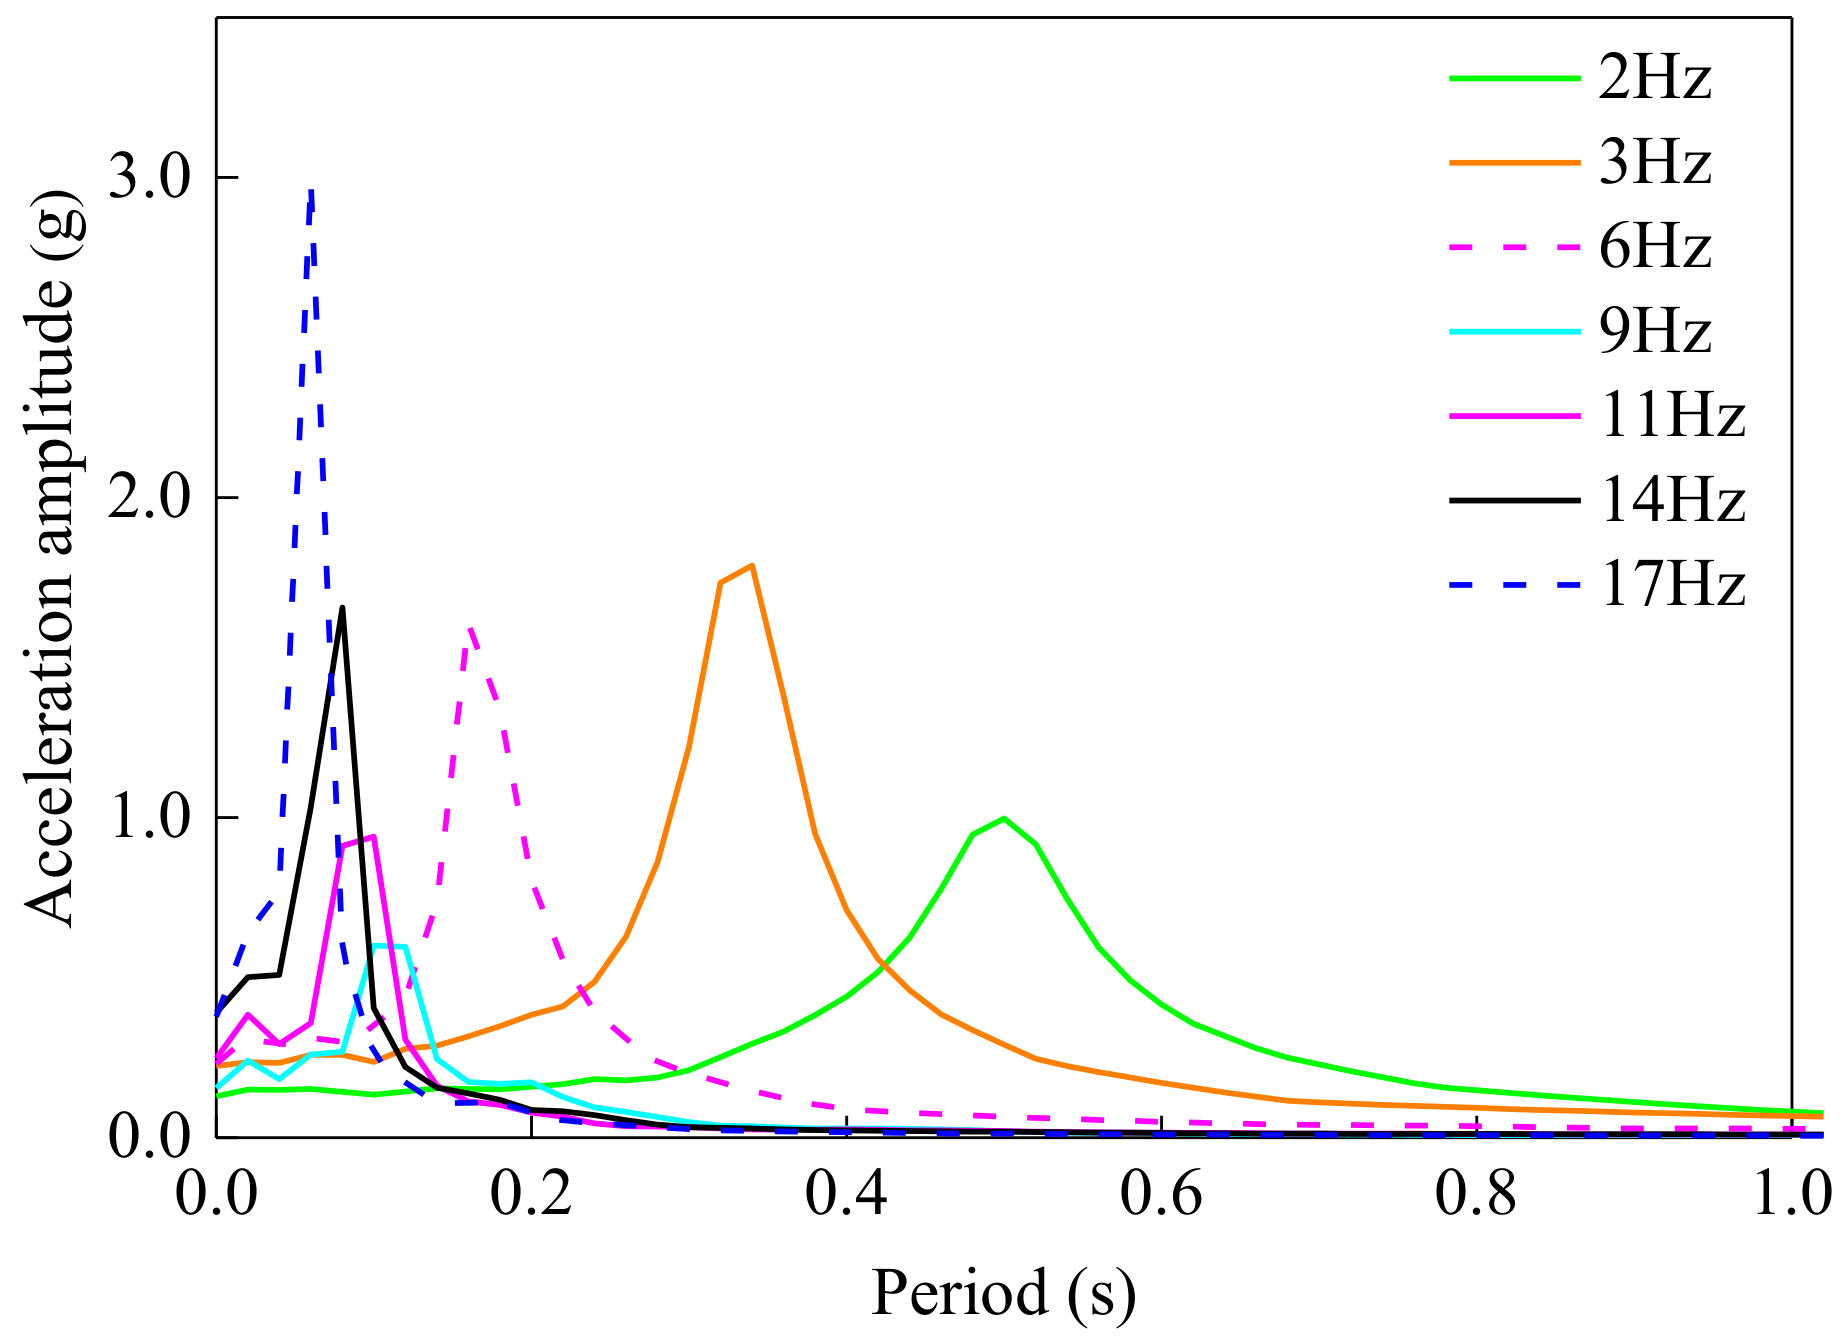
Response spectrums of ground surface accelerations for 5% damping are shown in Figure 15. Acceleration responses at a certain frequency band are mainly excited by a corresponding frequency excitation. This comparison reveals that the acceleration amplitudes are sensitive within the excitation frequency varying from 9 to 17 Hz, and the acceleration amplitude reaches the maximum in the case of Sin-17. These results are consistent with Newmark’s conclusions [22].

4.2. Deformation of the Ground

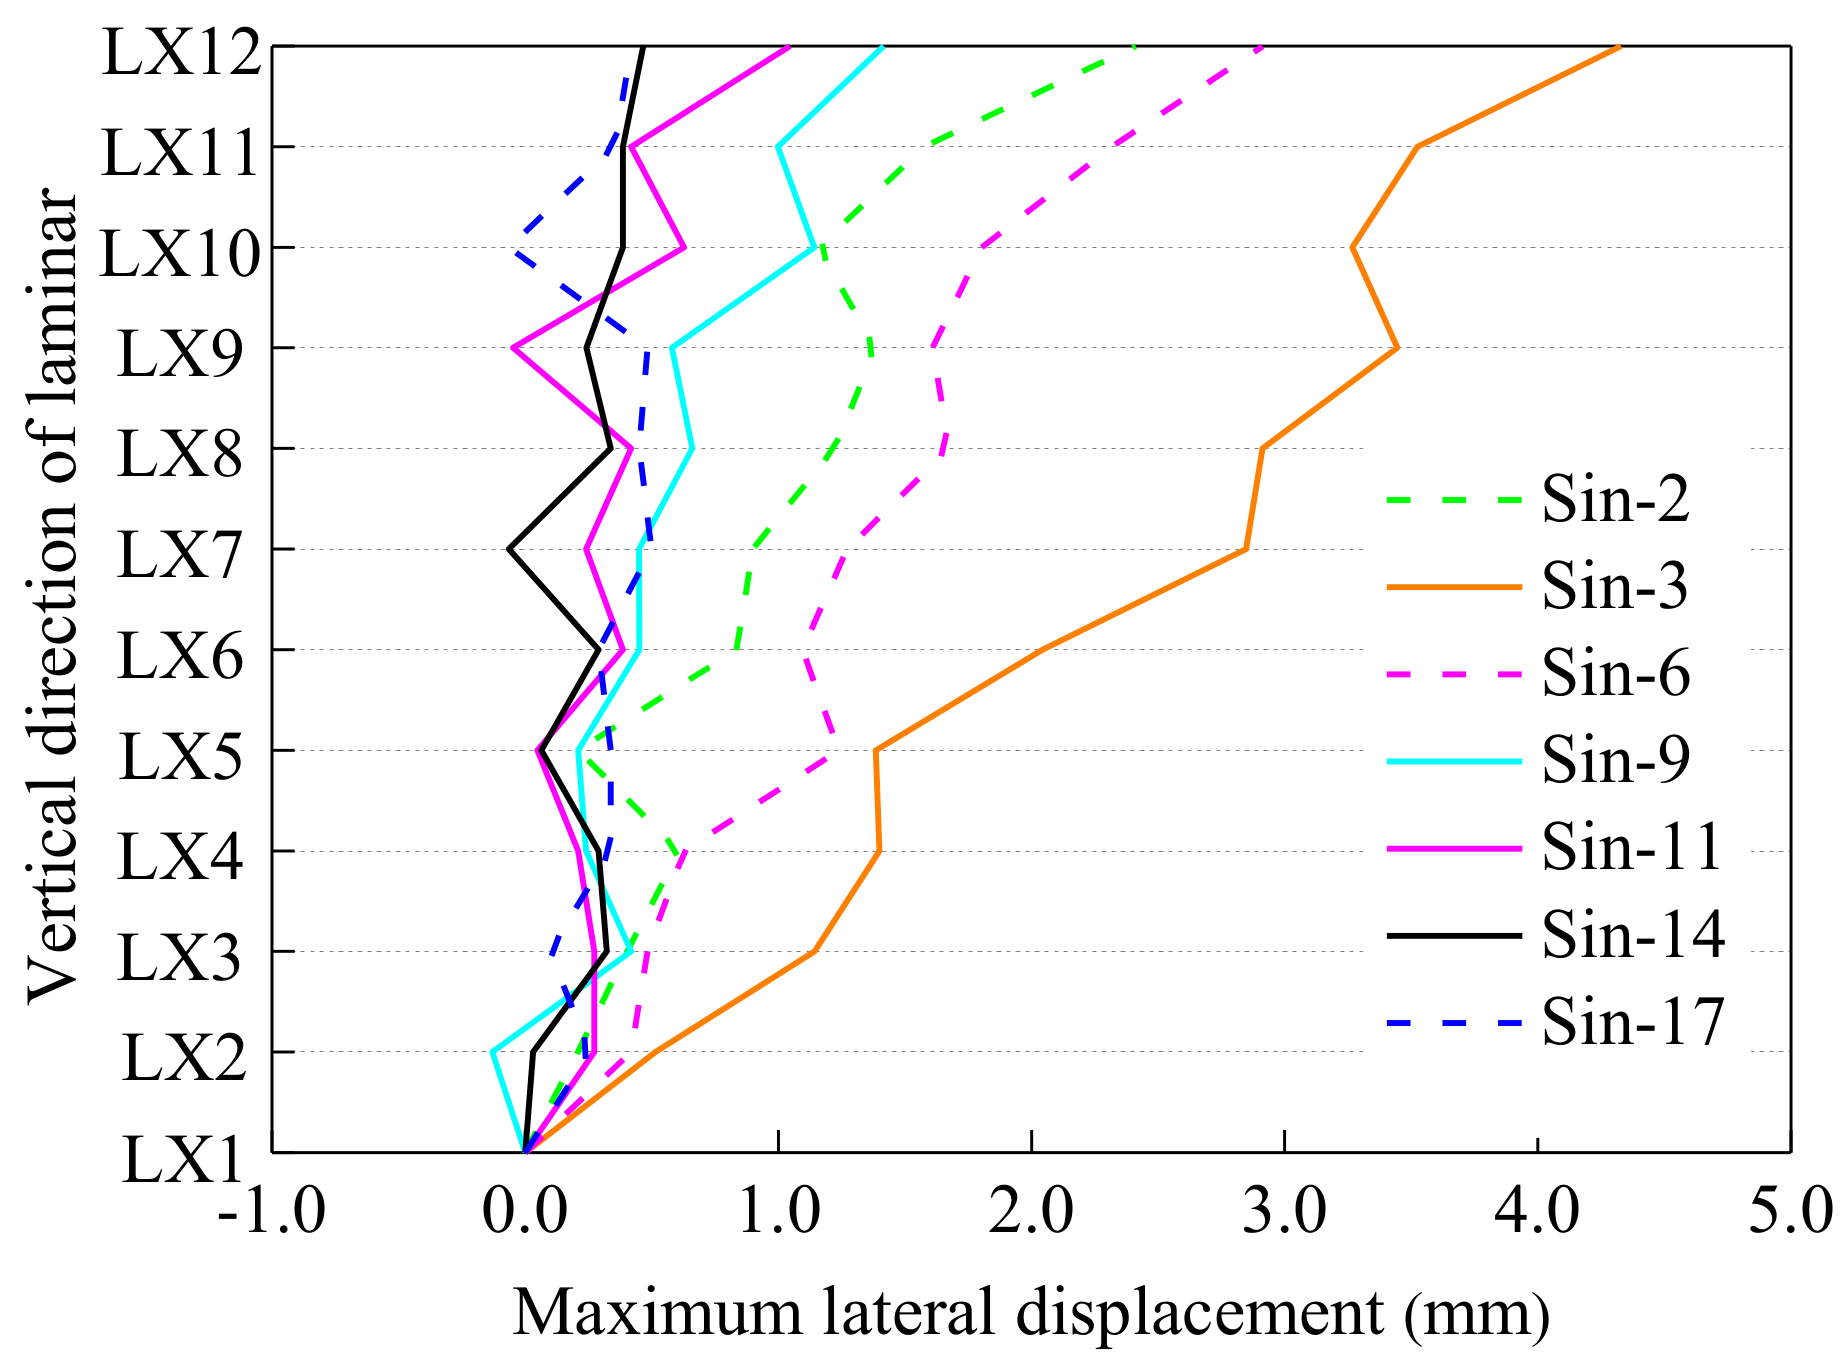
The deformation of the ground can be evaluated by lateral displacement of the laminar box. As shown in Figure 16, in the cases of Sin-2, Sin-3, and Sin-6, the maximum lateral deformation of the laminar box is relatively large. In the cases of Sin-9, Sin-11, Sin-14, and Sin-17, the maximum lateral displacement is more sensitive to the depth of the model soil. It is concluded that the deformation of ground shows shear-type deformation of first-order vibration modes when the frequency of excitation approaches the fundamental frequency of the model ground. The oscillation of the lateral displacement along depths is becoming active with the increase of input frequency. On the one hand, this is because there are resonance effects when the input frequency approaches the fundamental frequency of the ground. On the other hand, high-order vibration modes may distinctly affect the deformation of the ground.
The results mentioned above indicate that frequency characteristics of the input seismic waves affect the ground deformation. In order to analyze the modal contribution to the deformation response of the ground, modal amplitude responses of ground are analyzed by means of mode decomposition method under sinusoidal excitations of different frequency. The sum of vibration modes times each modal amplitude is the result of the displacement of the model ground; that is, the total displacement is decomposed by the modal contribution.
The modal participating mass ratios [23] for the first four modes of the model ground are listed in Table 7. The modal participating mass ratios can be expressed as follows:
γ n = 0 H m z φ n z d z 2 0 H m z φ n 2 z d z 0 H m z d z
where n is the mode order, φ n z is the lateral deformation of nth order mode of soil at the depth of z, m(z) is the mass distribution of the soil slice at the depth of z, and H is the height of soil column. The number of modes considered for the model ground is four since the total modal participating mass ratio is over 90% [24], as tabulated in Table 7.
According to the classical mode analysis method [23], the contribution of the nth order vibration mode to the node displacement u n z , t is written as follows:
u n z , t = φ n z q n z , t
where q n z , t is the modal amplitude of nth order at time of t.
For a homogeneous soil layer, the vibration mode can be expressed as follows [25]:
φ n z = cos 2 n 1 π 2 H z       n = 1 , 2 , 3 ,
The total displacement can be obtained by combining the contribution of vibration modes:
u z , t = u n z , t = φ n z q n z , t
where u z , t is the lateral deformation of soil column at depth z, and time t.
According to the above formulas, the experimental results of the linear wire displacement gauges deployed along the height of the model box are analyzed, and the amplitude responses of vibration modes can be obtained. The analysis results are shown in Table 8.
As can be seen from Table 8, the first-order modal amplitude is the largest under any excitation frequency, which shows that the first-order vibration mode plays a leading role. The modal amplitude decreases with the increase of mode order, and this is especially obvious under lower frequency excitations. On the other hand, the modal amplitude decreases with the increase of input frequency, and this is especially obvious in the lower mode order.
Based on the above analysis results, it can be concluded that the reasons for the response difference under sinusoidal excitations of different frequency are as follows: the modal amplitudes decrease with the increase of the input frequency, and the dominant role of first-order vibration mode gradually weak; that is, high-order vibration modes are playing a more important role in ground response. On the other hand, the change of the combination of modal amplitudes will affect the dynamic response of the ground. These would explain the mechanism of the response difference under sinusoidal excitations of different frequency.

5. Responses of Segmental Tunnel

5.1. Acceleration Responses of the ST Ground

5.1.1. Time Histories

Time histories of acceleration responses with depths are shown in Figure 17 for the ground of the ST model.
As shown in Figure 17, the waveforms of acceleration responses of ground in ST model are fundamentally in consistence with that of FF model. The phase difference between the upper (AZ5) and lower (AZ1) soil layer, with the input frequency of 17 Hz, reaches a maximum of 12/7π. It is also approximately in accordance with that of FF model.

5.1.2. Differences of Amplification of Acceleration along Depth

Percentage differences of acceleration responses along depths between the FF model and ST model are shown in Figure 18. The percentage difference in this paper is defined as the percentage difference of peak accelerations between the FF model and ST model. The percentage difference, η, is determined by the following formula:
η = | a S a F a F |
where a S and a F are peak acceleration for the ground of SF model and FF model, respectively.
Effect of model tunnel on acceleration response of ground can be learned from Figure 18. In the cases of the Sin-2, Sin-3, and Sin-6, the differences of acceleration response in model soil between the ST model and FF model are less than 6%. In the cases of the Sin-9 and Sin-11, except for the surface soil layer, the differences are less than 6.5%. In the cases of the Sin-14 and Sin-17, the maximum difference is 32%.
Effects of the tunnel on acceleration response of the ground: When the frequency of sinusoidal excitation is no more than 9 Hz, the differences of acceleration responses in model soil between the ST model and FF model are less than 10%, and when the frequency of sinusoidal excitation is more than 9 Hz, the differences tend to fluctuate more widely, as shown in Figure 18.
The presence of the tunnel induces a relatively high effect on acceleration responses of the ground within excitation frequency varying from 9 to 17 Hz. Similar findings have been made in the study from Smerzini [26]. However, this finding has not been verified by any experiments.

5.2. Acceleration Responses of Model Tunnel

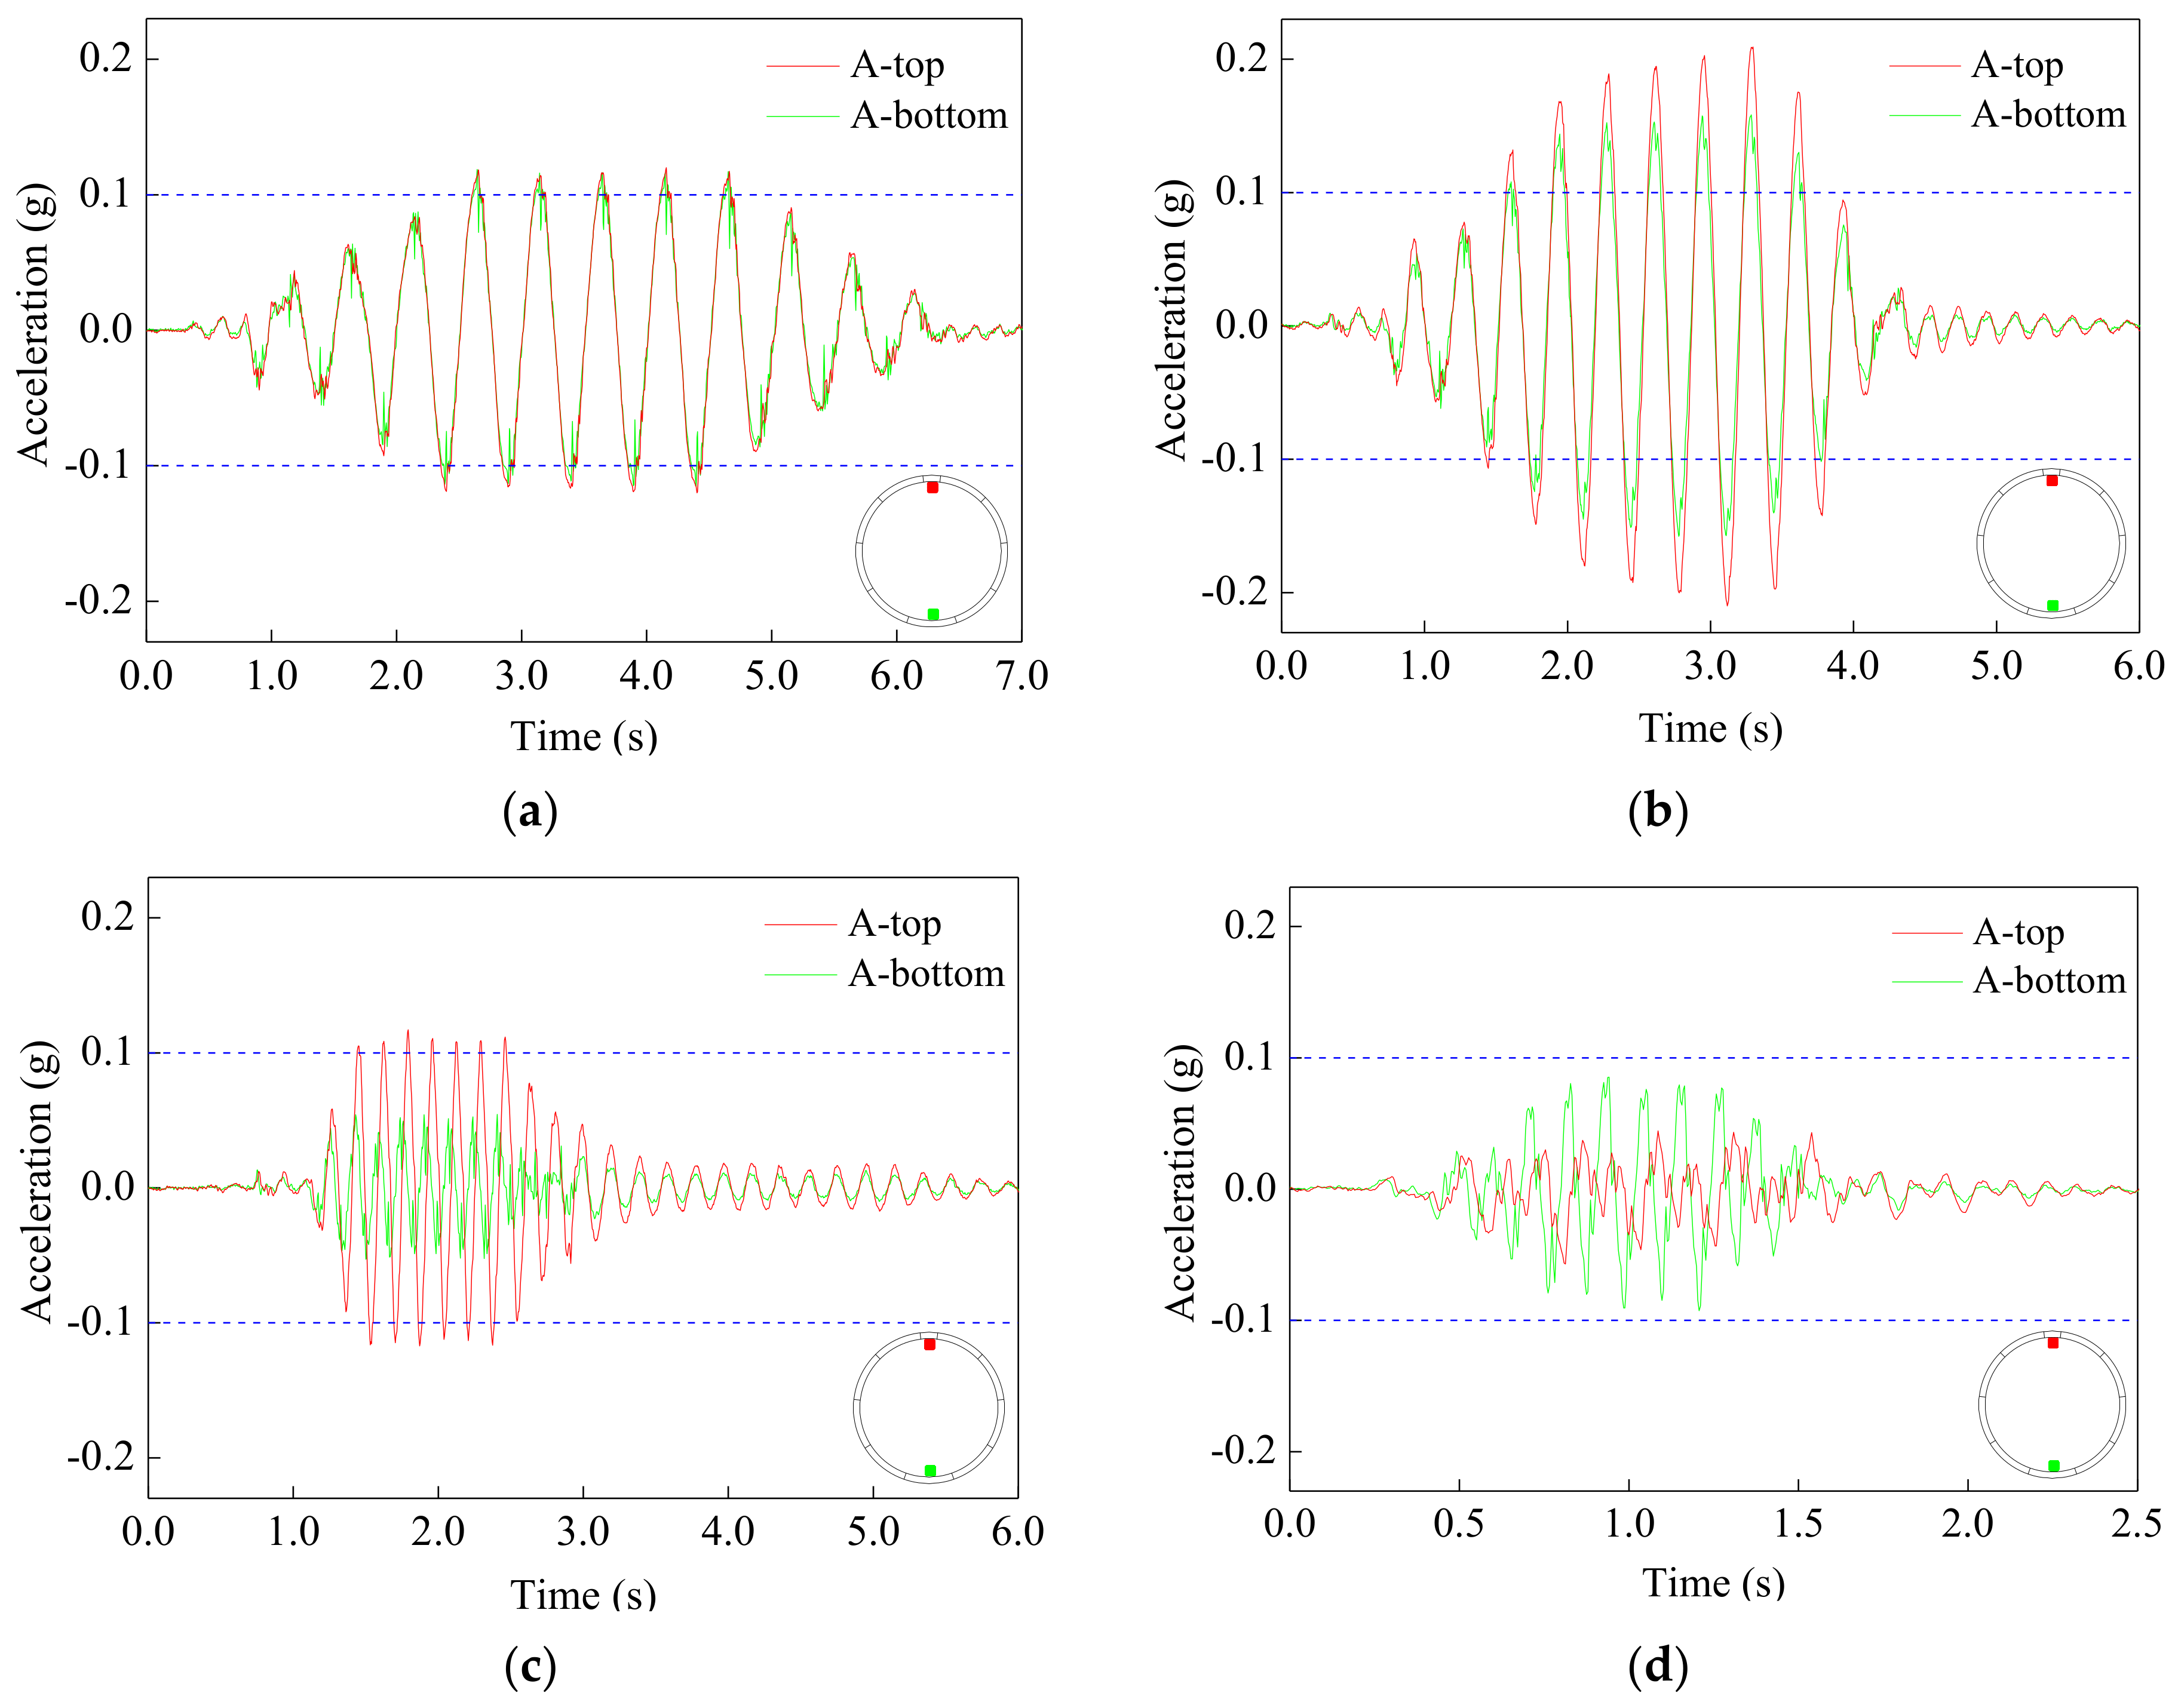
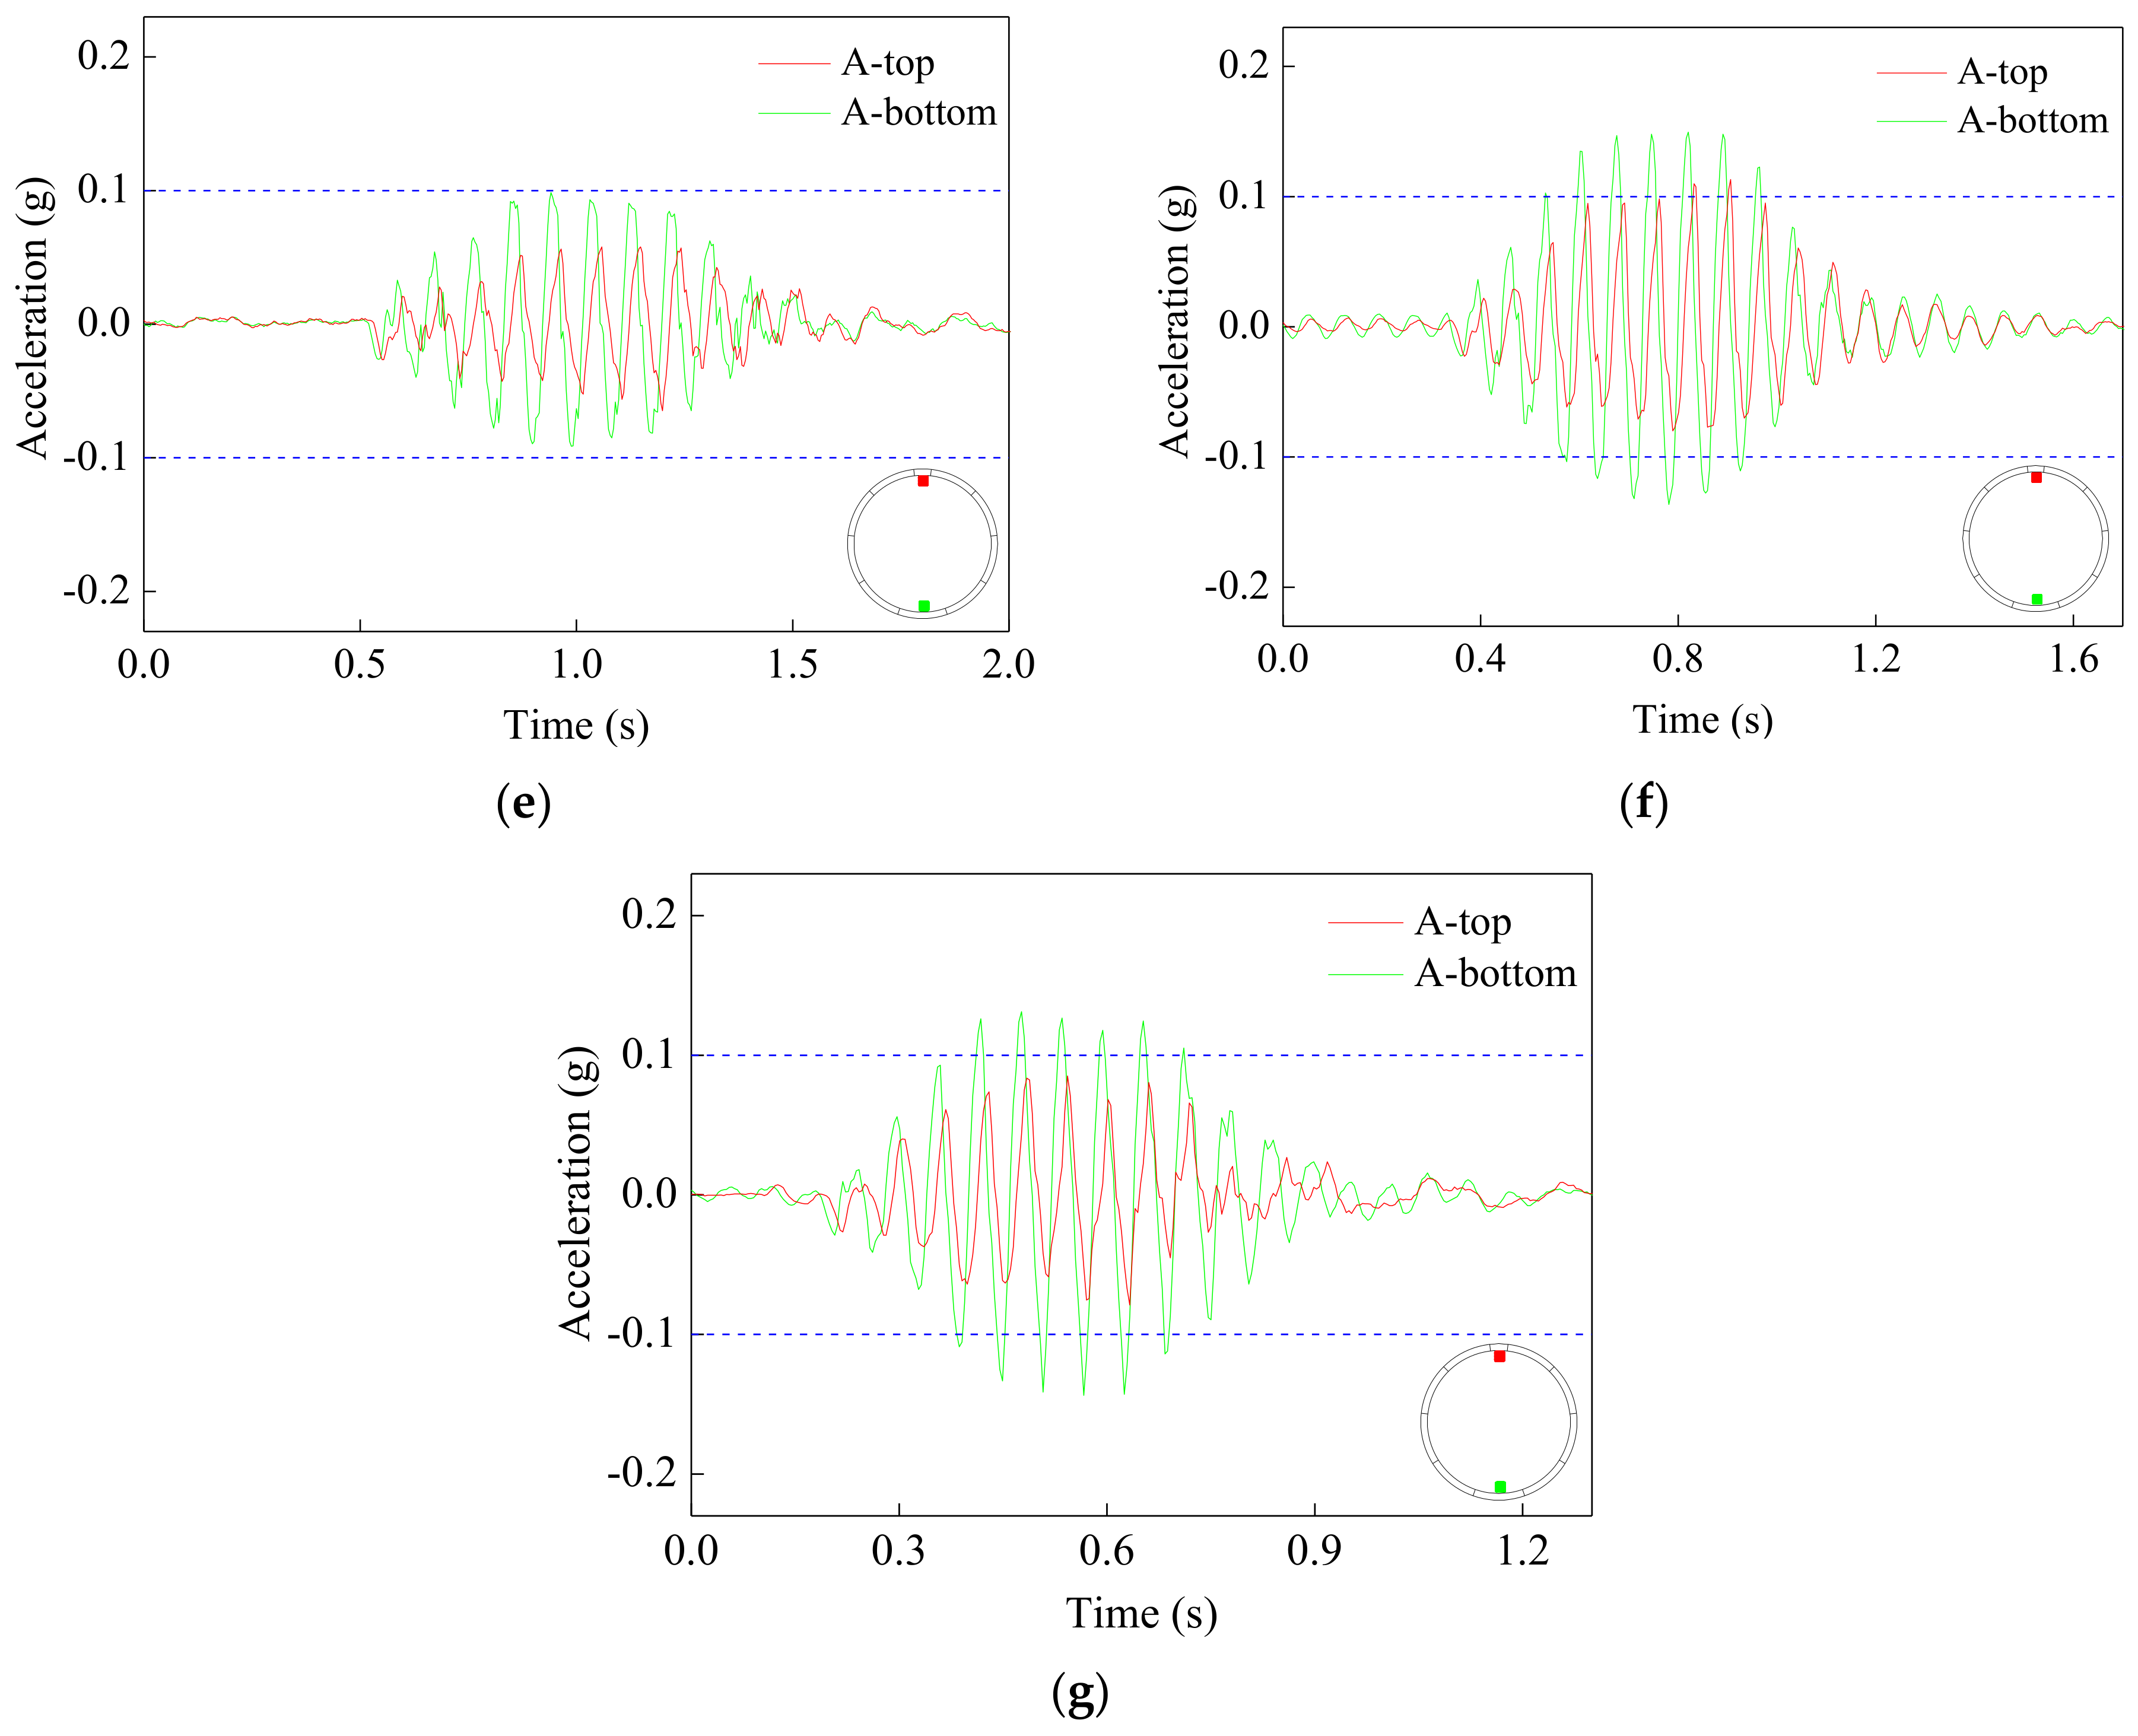
Time histories of acceleration responses at the top and bottom of the tunnel are shown in Figure 19.
In the case of the Sin-2, acceleration responses at the top and bottom of the tunnel are basically consistent, and the waveforms of acceleration responses are approximately sine function. In the case of the Sin-3, obvious differences between the top and the bottom of the tunnel are found in peak acceleration. In the case of the Sin-6, the phase difference is showing in acceleration responses between the top and the bottom of the tunnel. Compared with the input motions, the peak acceleration at the bottom of the tunnel decrease significantly. In the cases of the Sin-9, Sin-11, Sin-14, and Sin-17, the waveforms of acceleration responses are irregular, the phase difference also exists in acceleration responses between the top and the bottom of the tunnel. The peak acceleration at the bottom of the tunnel is greater than that at the top of the tunnel.
As shown in Table 9, phase difference increases first and then decreases with the input frequency increasing. Phase difference reaches a maximum of 1π with the input frequency of 9 Hz. However, the difference of peak acceleration reaches a maximum of 69.41% with the input frequency of 17 Hz.
From the respect of waveform, phase, and peak, these results indicate that the variation trend of acceleration at the top and bottom of the tunnel are basically similar with the acceleration distribution in model soil at the near depth, as can be drawn from Figure 13 and Figure 14. This is due to the fact that the response of underground structures is dominated by the seismic response of surrounding soil [27]. On the other hand, the model tunnel is placed in the middle soil layer. The variations of phase differences also reflect the propagation law of wave in the middle soil layer under a different frequency of excitation.

5.3. Cross-Sectional Deformations of Model Tunnel

Cross-sectional deformation can be represented with the measurements of displacements in diametral direction. Time histories of the cross-sectional deformation of the segmental tunnel are shown in Figure 20.
Compared with vertical direction (0 degrees, line BD1) and horizontal direction (90 degrees, line BD3) of tunnel’s cross-section, the diametral displacement of segmental tunnel is relatively large in the conjugate (45 degrees, line BD2 and 135 degrees, line BD4) direction of tunnel’s cross-section under earthquake. This result reveal that the segmental tunnel shows shear deformation under the transverse excitation. Underground structures behave as flexible members that follow free-field deformations, as concluded in Bobet’s paper [28]. This is also consistent with the distribution law of diametral displacement of shield tunnels during Yokohama earthquake in Japan [29]. The deformation responses of symmetrical monitoring positions show almost 180 degrees out-of-phase.
In the case of the Sin-2, response waveforms of cross-sectional deformation are approximately sine function. In the case of the Sin-3, the cross-sectional deformation response increases periodically with time. This is due to the superposition effect of seismic wave and resonance-induced oscillation. In the cases of the Sin-6, Sin-9, Sin-11, Sin-14, and Sin-17, the deformation response curves are irregular and present various waveforms. This is probably due to the fact that deformation responses may be obviously disturbed by high-order vibration modes of the ground.

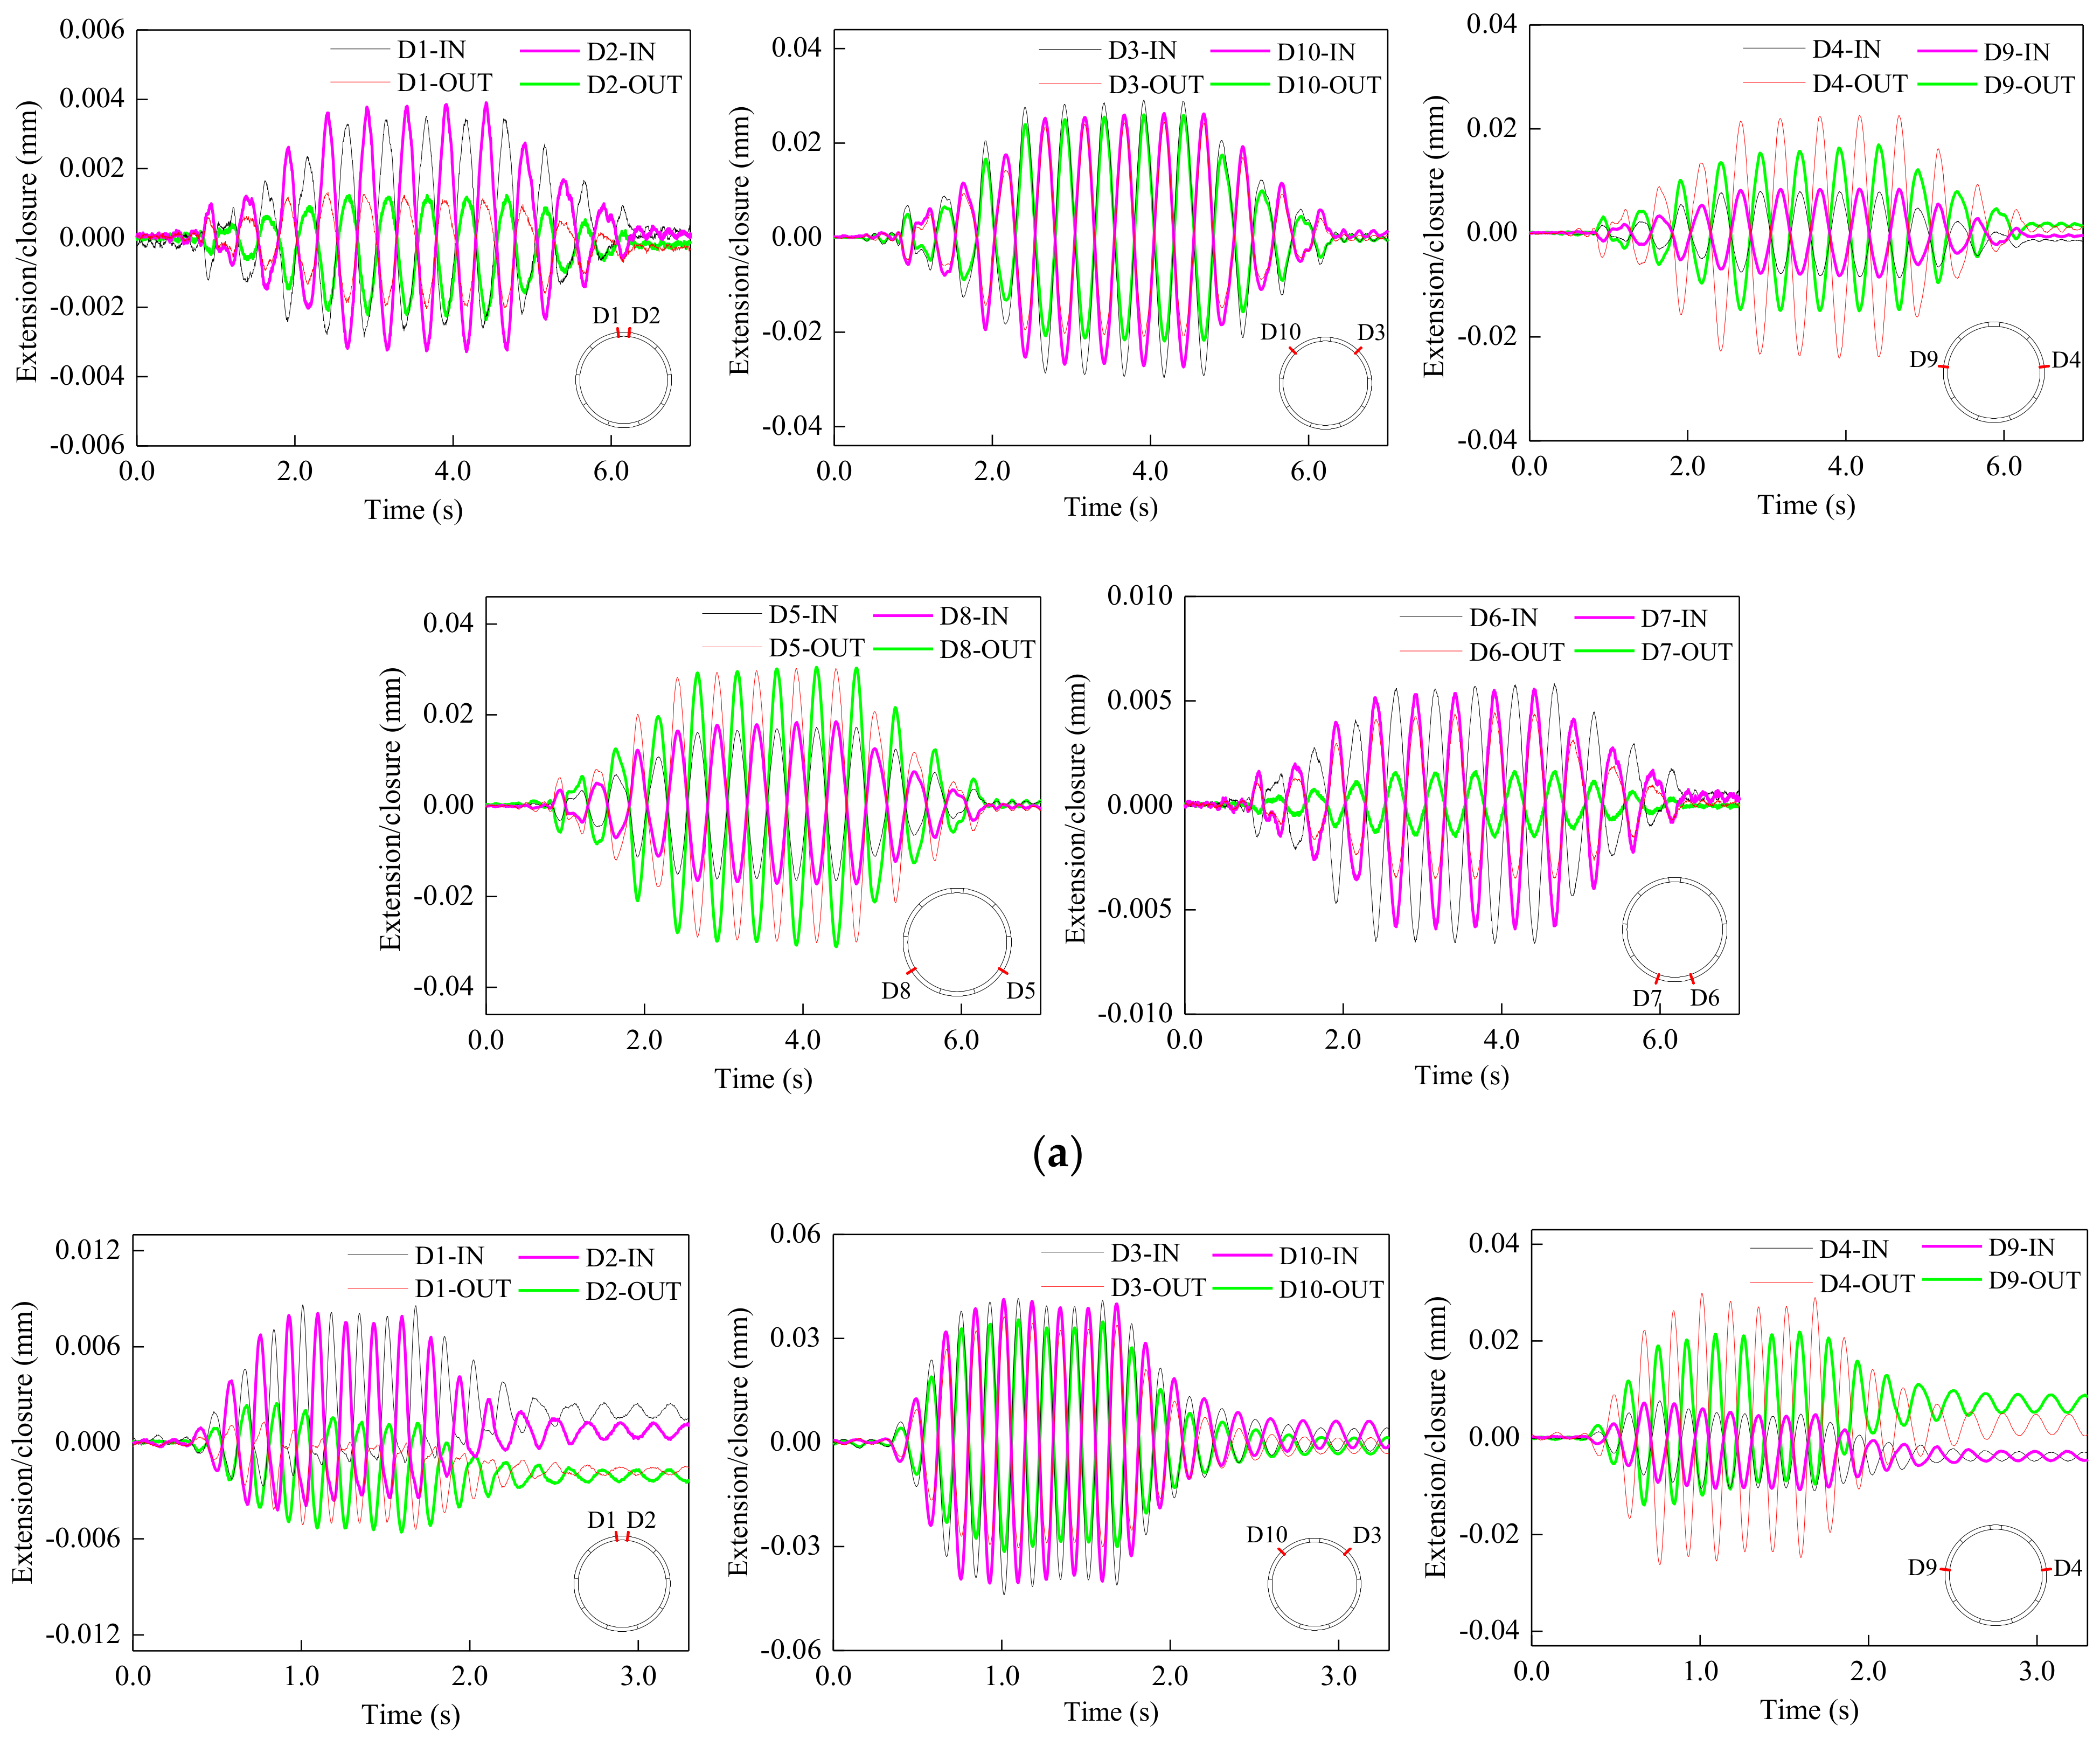
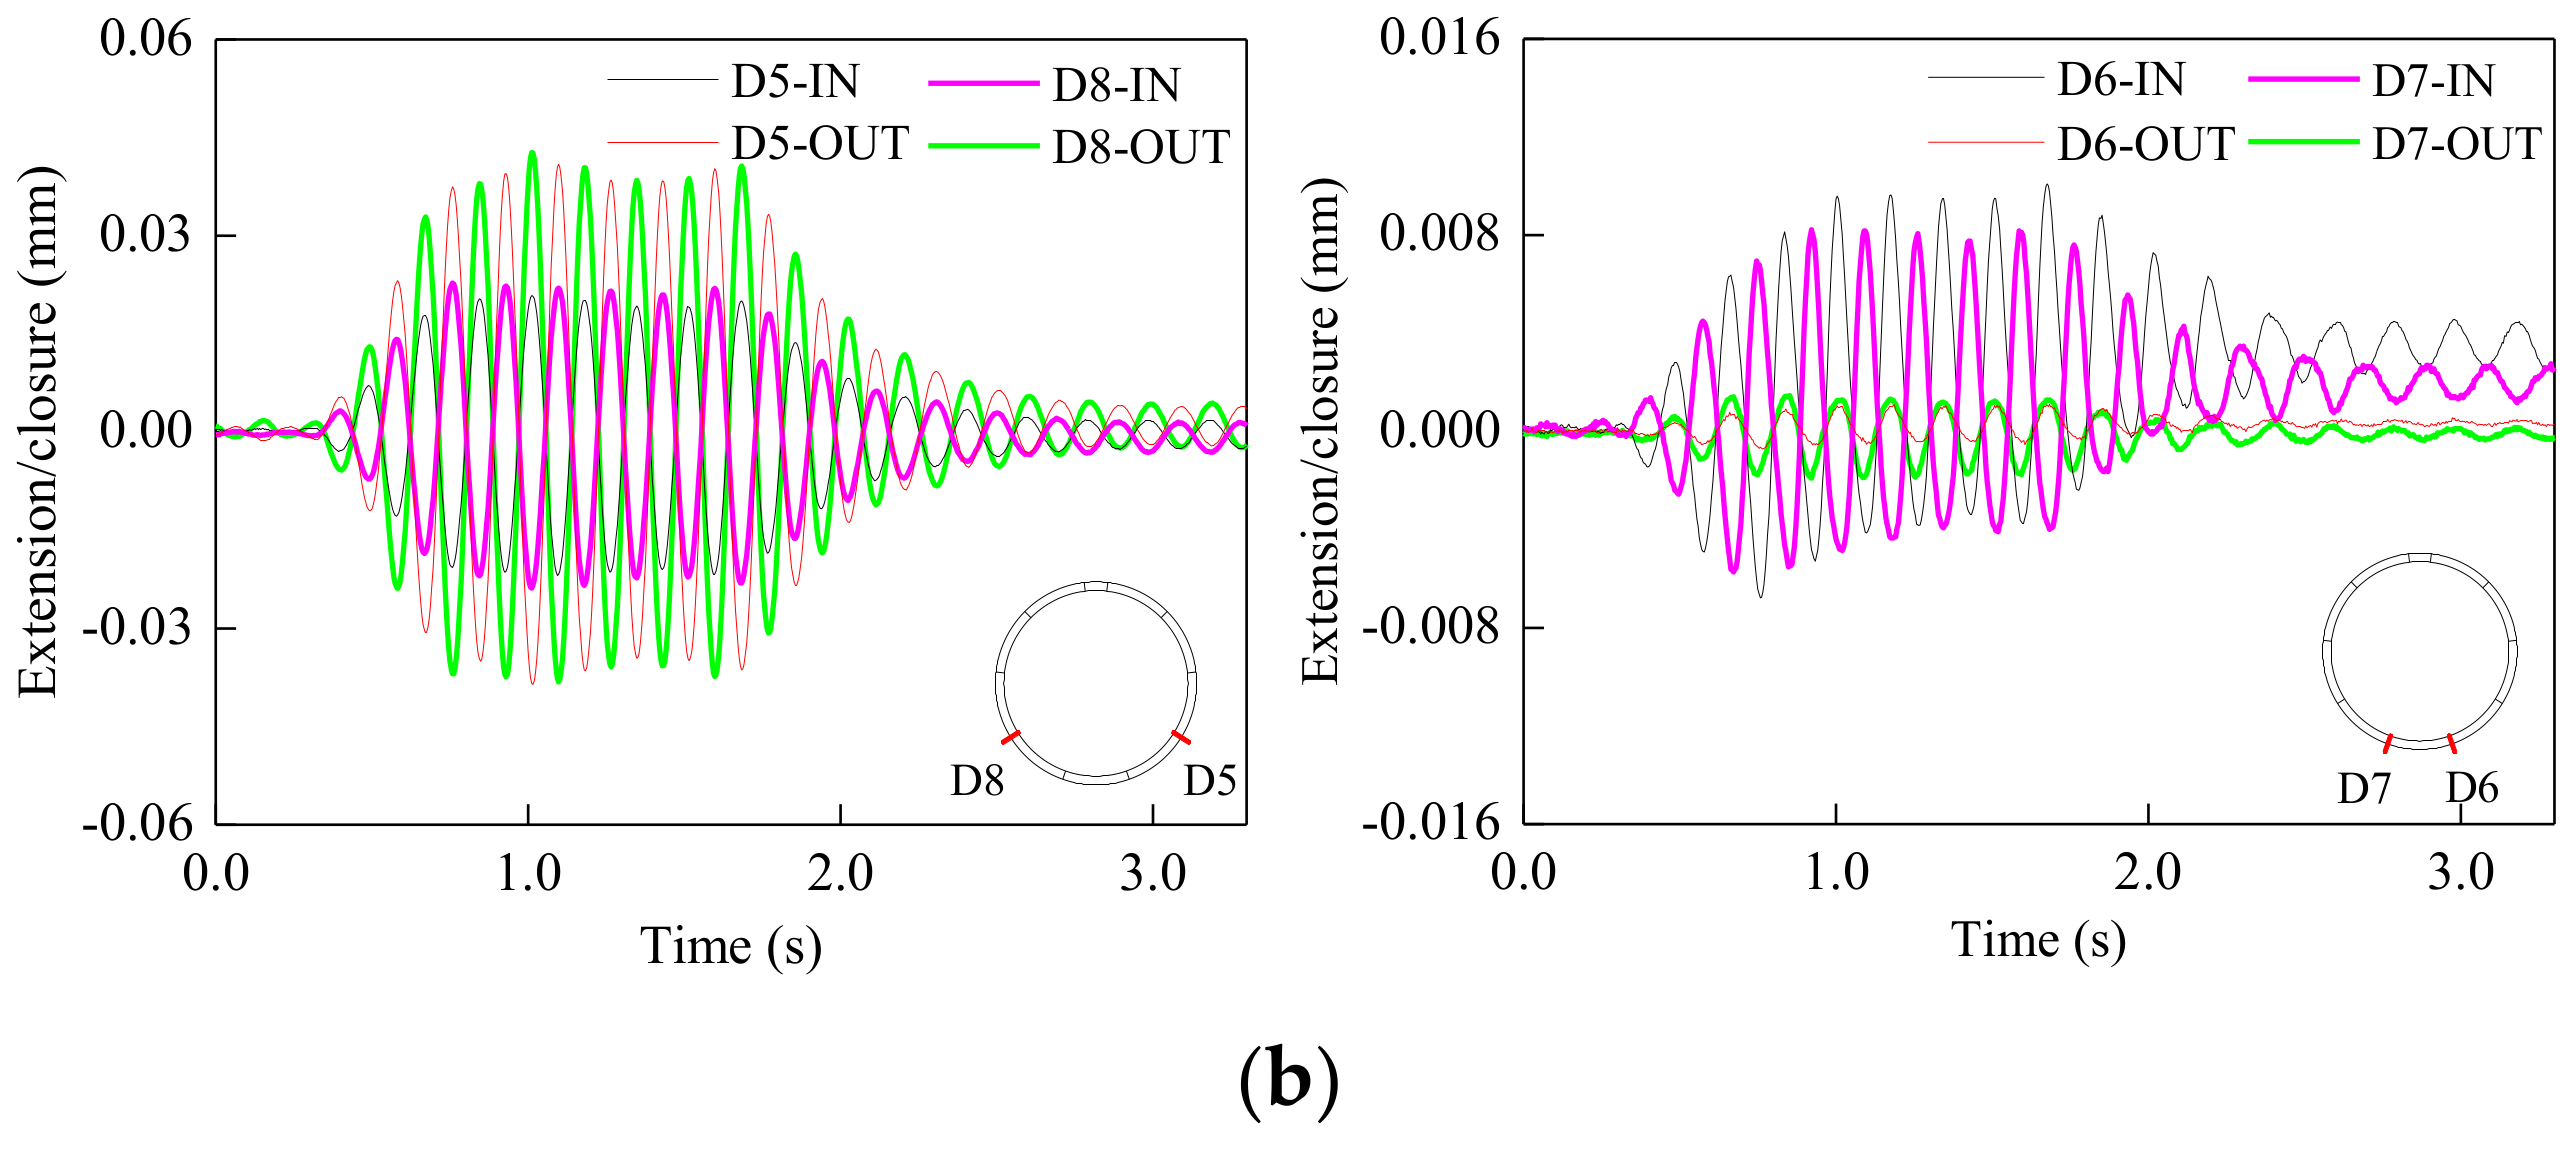
5.4. Extension/Closure of Longitudinal Joints of Model Tunnel

Time histories of extension/closure responses of longitudinal joints are shown in Figure 21.
The extension/closure of longitudinal joints are relatively large at 45°, 129°, 231°, and 315°, while the extension/closure responses of longitudinal joints are small near the top and bottom of the tunnel. The extension/closure responses of symmetrical monitoring positions show almost 180 degrees out-of-phase. Moreover, the extension/closure responses on the internal and external side of each longitudinal joint show almost 180 degrees out-of-phase.
In the case of the Sin-2, response waveforms of longitudinal joints are approximately sine function. In the cases of the Sin-3 and Sin-6, the response waveforms of longitudinal joints are irregular, and there exists residual deformation. In the cases of the Sin-9, Sin-11, Sin-14, and Sin-17, the response waveforms become more complex.
According to the distribution of residual deformations, it can be concluded that the model tunnel produces a slight ovaling deformation. The seismic settlement of model ground will occur under stronger earthquake interaction, consequently resulting in the permanent ovaling deformation of the segmental lining in the direction of gravity.
As the frequency of input motions approaches the fundamental frequency of the model ground, residual deformations of longitudinal joints are appearing, and the extension/closure deformations reach maximum. This is probably because the interaction between the soil and the tunnel is much stronger. The response waveforms become more complex with the increase of the excitation frequency, which may be influenced by high-order vibration modes.

5.5. Dynamic Normal Earth Pressures of Model Tunnel

Time histories of dynamic normal earth pressures on the external surface of the model tunnel are shown in Figure 22. Dynamic earth pressure in this paper is defined as an additional pressure caused by the earthquake. A positive value means that the total earth pressure increases compared with static earth pressure, and a negative value means that the total earth pressure decreases.
The dynamic normal earth pressures are relatively large in 45°, 135°, 225°, and 315°direction of tunnel’s cross-section, while reaches minimum at the top of tunnel. The earth pressure responses of symmetrical monitoring positions show almost 180 degrees out-of-phase. The distribution of dynamic earth pressure also reflects deformation characteristics of the tunnel. The deformations of the tunnel lead to changes in dynamic earth pressures around the tunnel, as concluded in Cilingir’s paper [4], therefore, the greater deformation comes greater changes in dynamic earth pressures, as can be learned from Figure 20.
In the cases of the Sin-2, Sin-3, and Sin-6, the response waveforms of dynamic normal earth pressures are irregular, and residual earth pressures exist at 45°, 135°, 225°, and 315° directions of the tunnel’s cross-section. In the cases of the Sin-9, Sin-11, Sin-14, and Sin-17, response waveforms of dynamic normal earth pressures are also irregular. The responses of dynamic earth pressures are relatively small, and the residual earth pressures can be neglected.
These results reflect that the interactions between the soil and tunnel is much stronger when the excitation frequency approaches the fundamental frequency of the model ground. The settlement of the model ground occurred, indicating that the ground became denser during the shaking process and resulted in the residual earth pressures. In contrast, the interactions are rather weak under a higher frequency excitation.

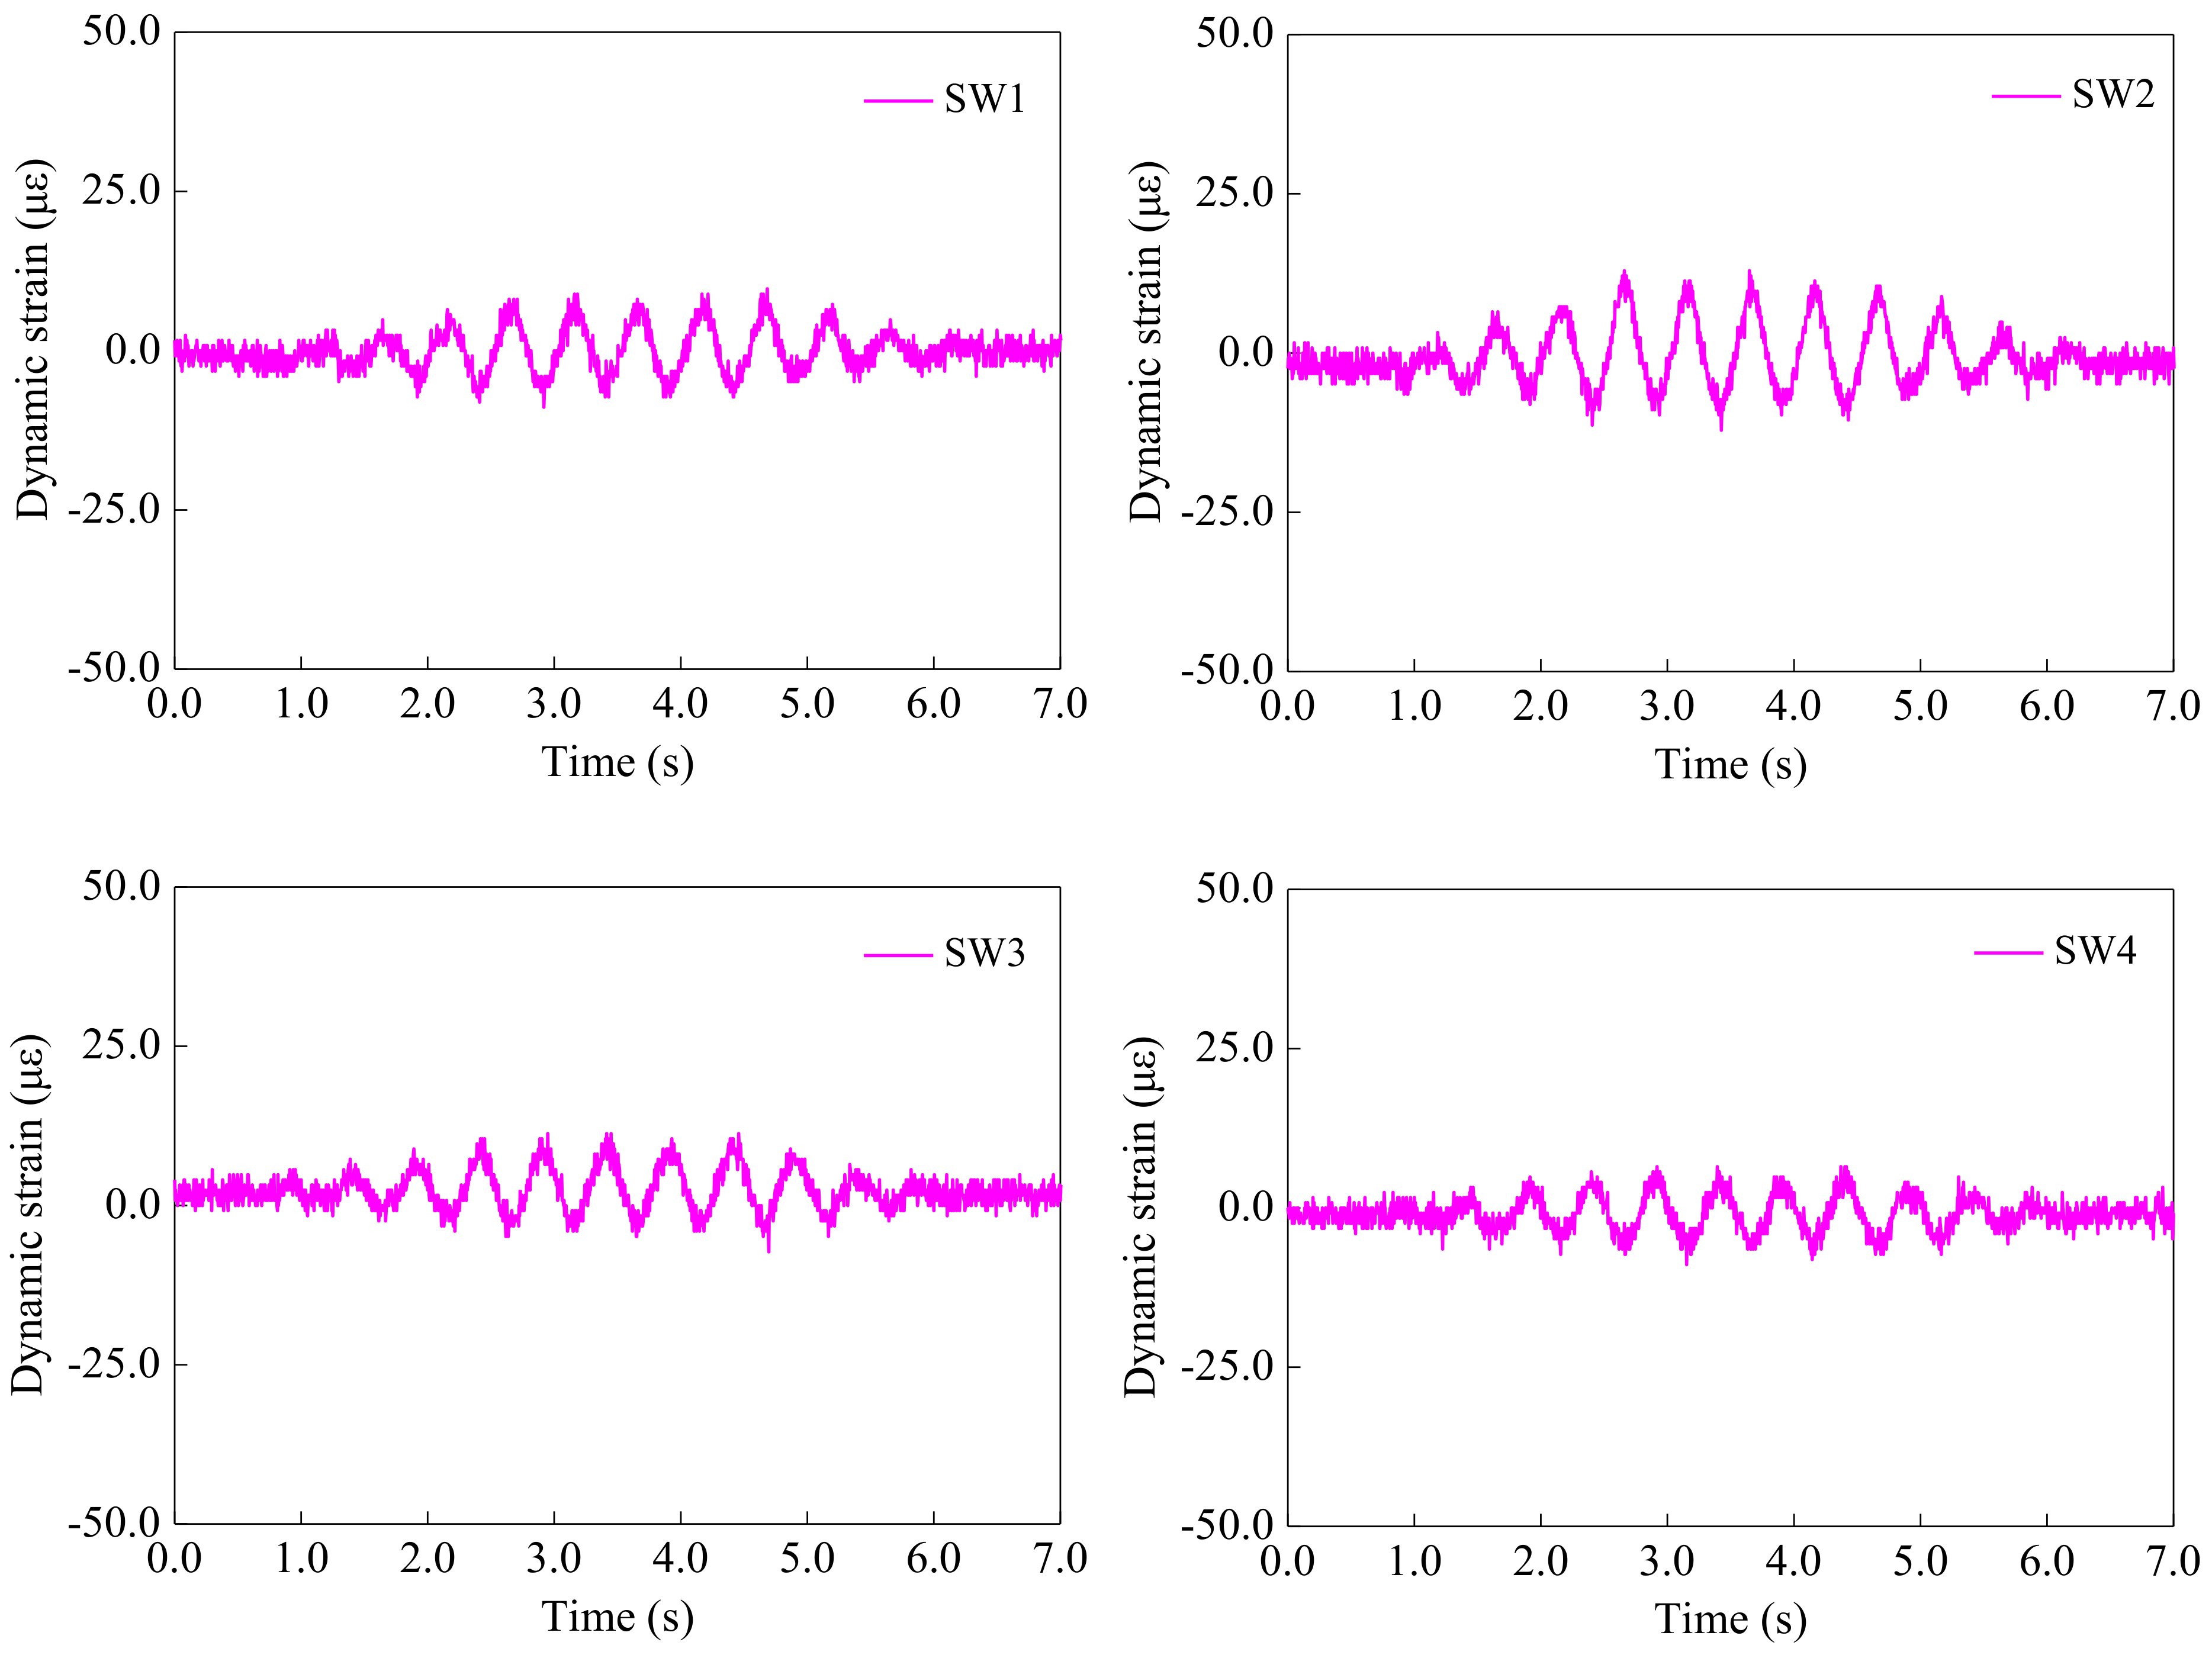
5.6. Dynamic Strain of Segments of Model Tunnel

Time histories of dynamic strain of segments are shown in Figure 23.
As can be seen from Figure 23 and Table 10, the dynamic strains of segments are much small in all monitoring positions. This indicates that the strains of segments are negligible, compared with the allowable deformation of the concrete segment. The strain curves are not smooth, which would suggest that the strains are so small that other sources of interference might be affecting the signal quality.
The peak dynamic strain of segments is about 26 με, as shown in Table 10. Figure 21 shows that the peak extension/closure strain of longitudinal joints is about 3000 με, and with about 115 times the peak dynamic strain of segments. The above research results confirm that the cross-sectional deformation of the tunnel is sensitively dependent on the extension/closure of the longitudinal joints rather than the deformation of segments under any frequency of excitation.

5.7. Relationship between Sinusoidal Excitations and Maximum Tunnel Responses

Amplification coefficient is defined as the ratio of maximum acceleration at the top to that of the bottom of the tunnel. As can be seen from Figure 24a, the maximum acceleration at the top of the tunnel first increases and then decreases with the increase of input frequency. In the case of the Sin-3, the acceleration reaches the peak value, 0.21 g. When the frequency of sinusoidal excitation is less than 6 Hz, acceleration at the top of the tunnel is amplified compared with that of the bottom of the tunnel. When the frequency of sinusoidal excitation is more than 6 Hz, acceleration at the top of the tunnel attenuates compared with that of the bottom of the tunnel, which is consistent with the variation of acceleration in model soil at the near depth. It also shows that the response of underground structures is dominated by the seismic response of surrounding soil [27].
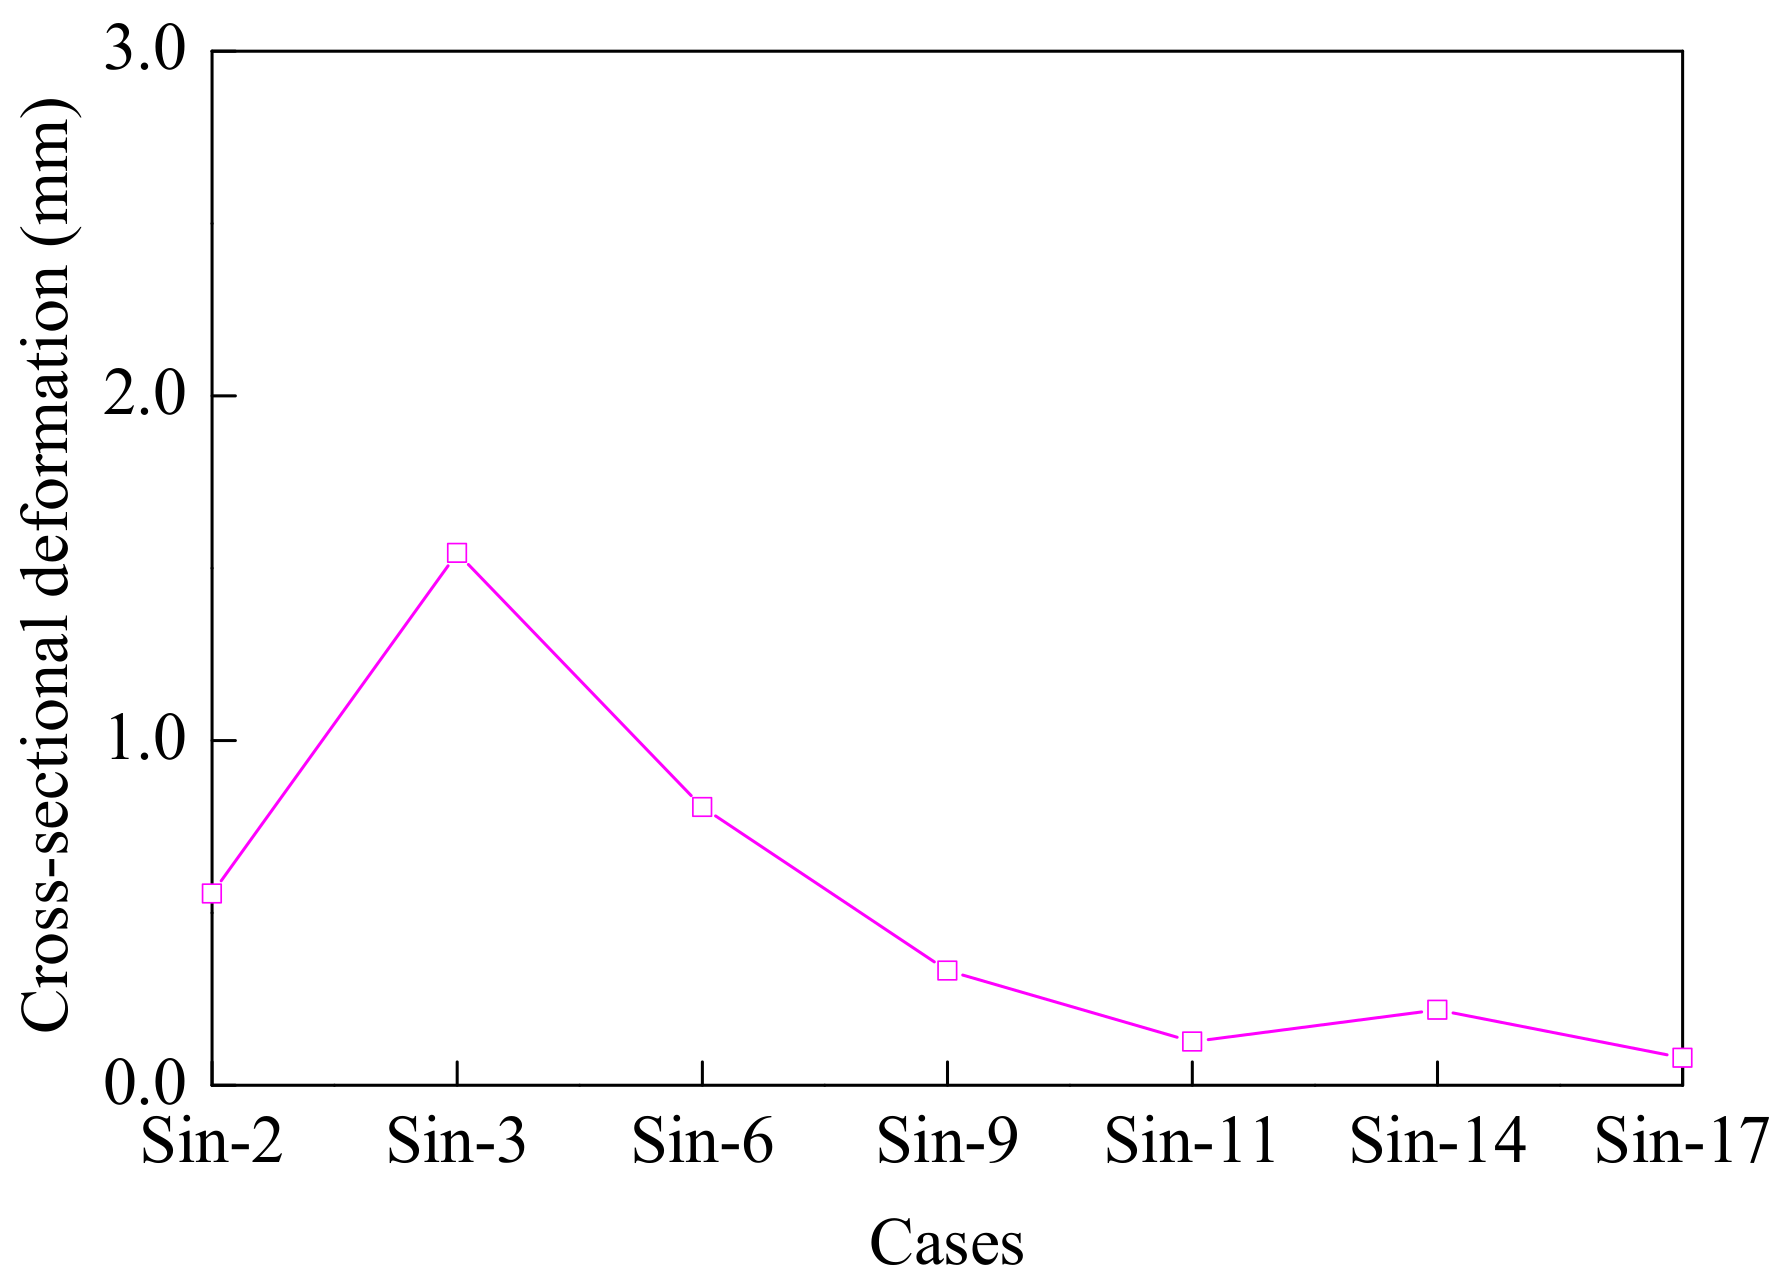
As can be seen from Figure 25, the maximum cross-sectional deformation of the tunnel first increases and then decreases with the increase of input frequency. In the case of the Sin-3, the cross-sectional deformation reaches a maximum of 1.54 mm, or the diameter change rate reaches a maximum of 1.7‰.
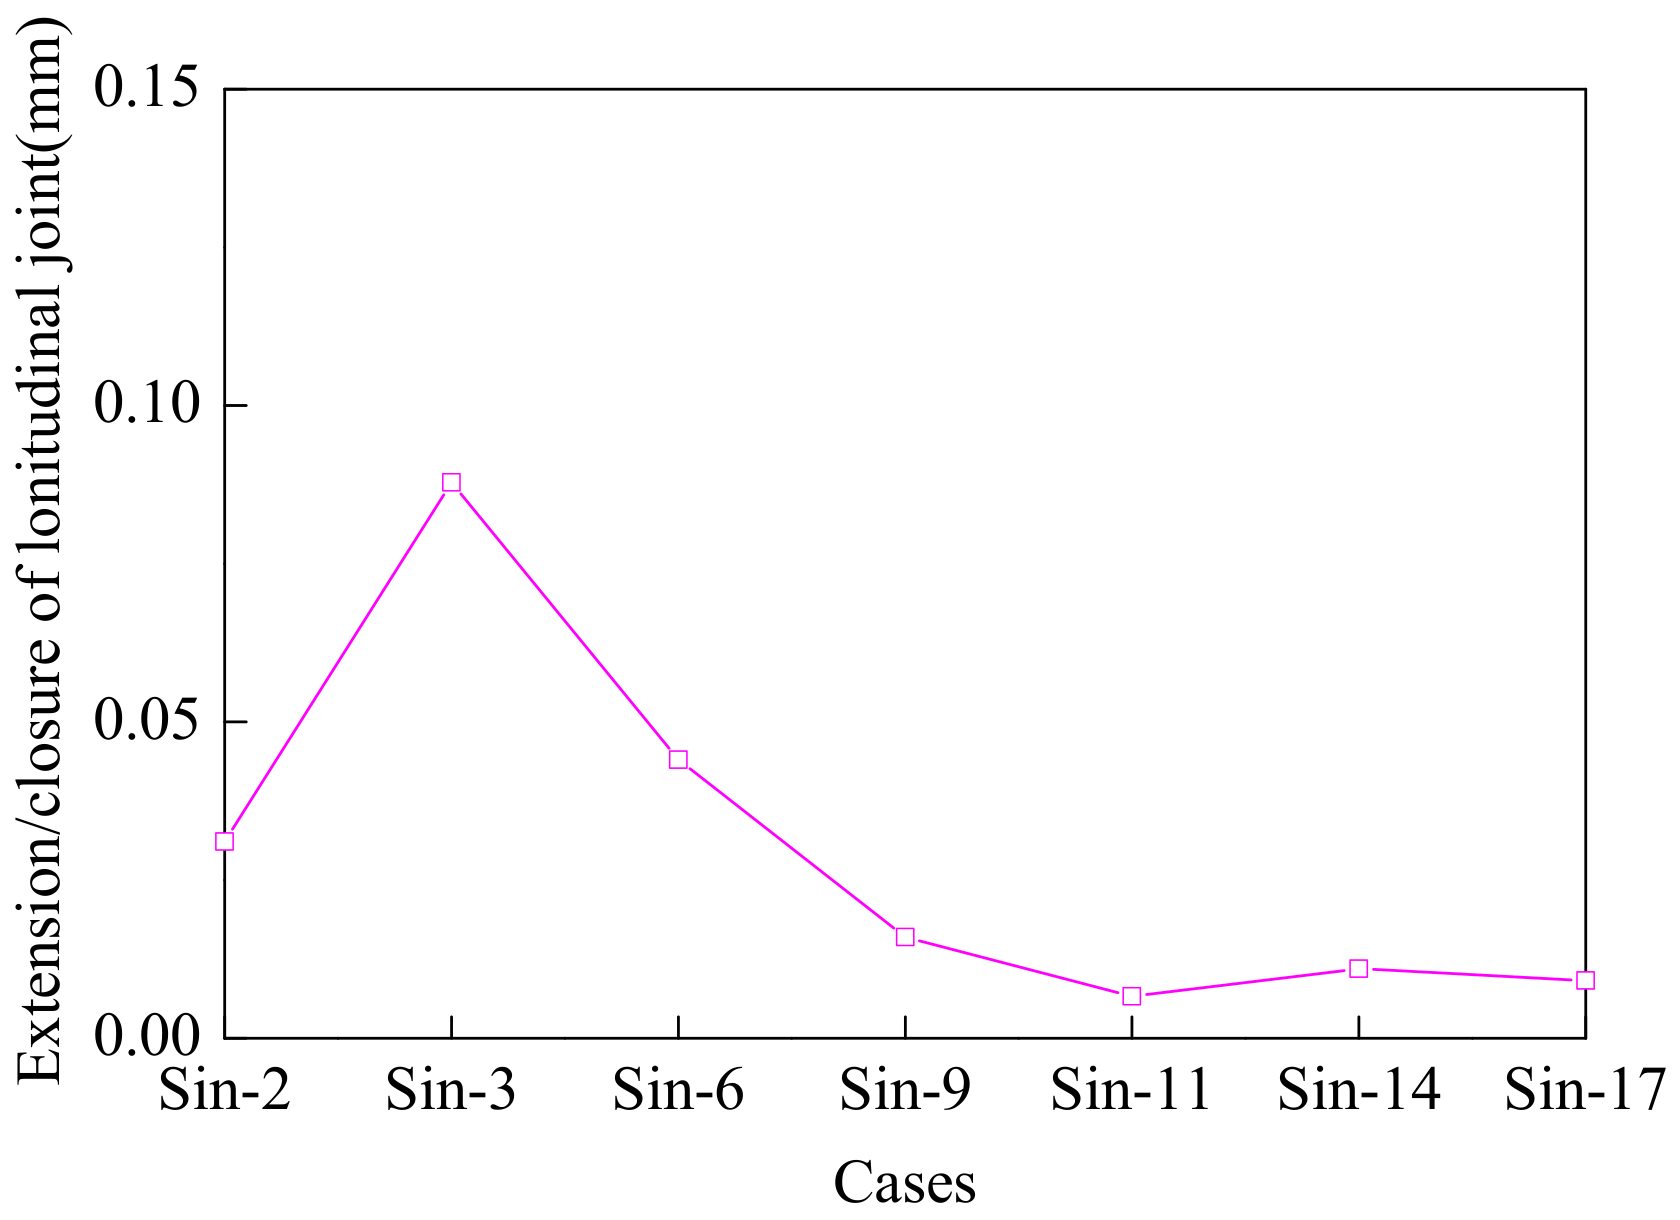
As can be seen from Figure 26, the maximum extension/closure of longitudinal joints first increases and then decreases with the increase of input frequency. In the case of the Sin-3, the extension/closure deformation reaches a maximum of 0.09 mm.
Maximum dynamic earth pressure is defined as the maximum additional pressure caused by the earthquake. As can be seen from Figure 27, the maximum dynamic normal earth pressure first increases and then decreases with the increase of input frequency. In the case of the Sin-3, the dynamic normal earth pressure reaches a maximum of 4.06 kPa.
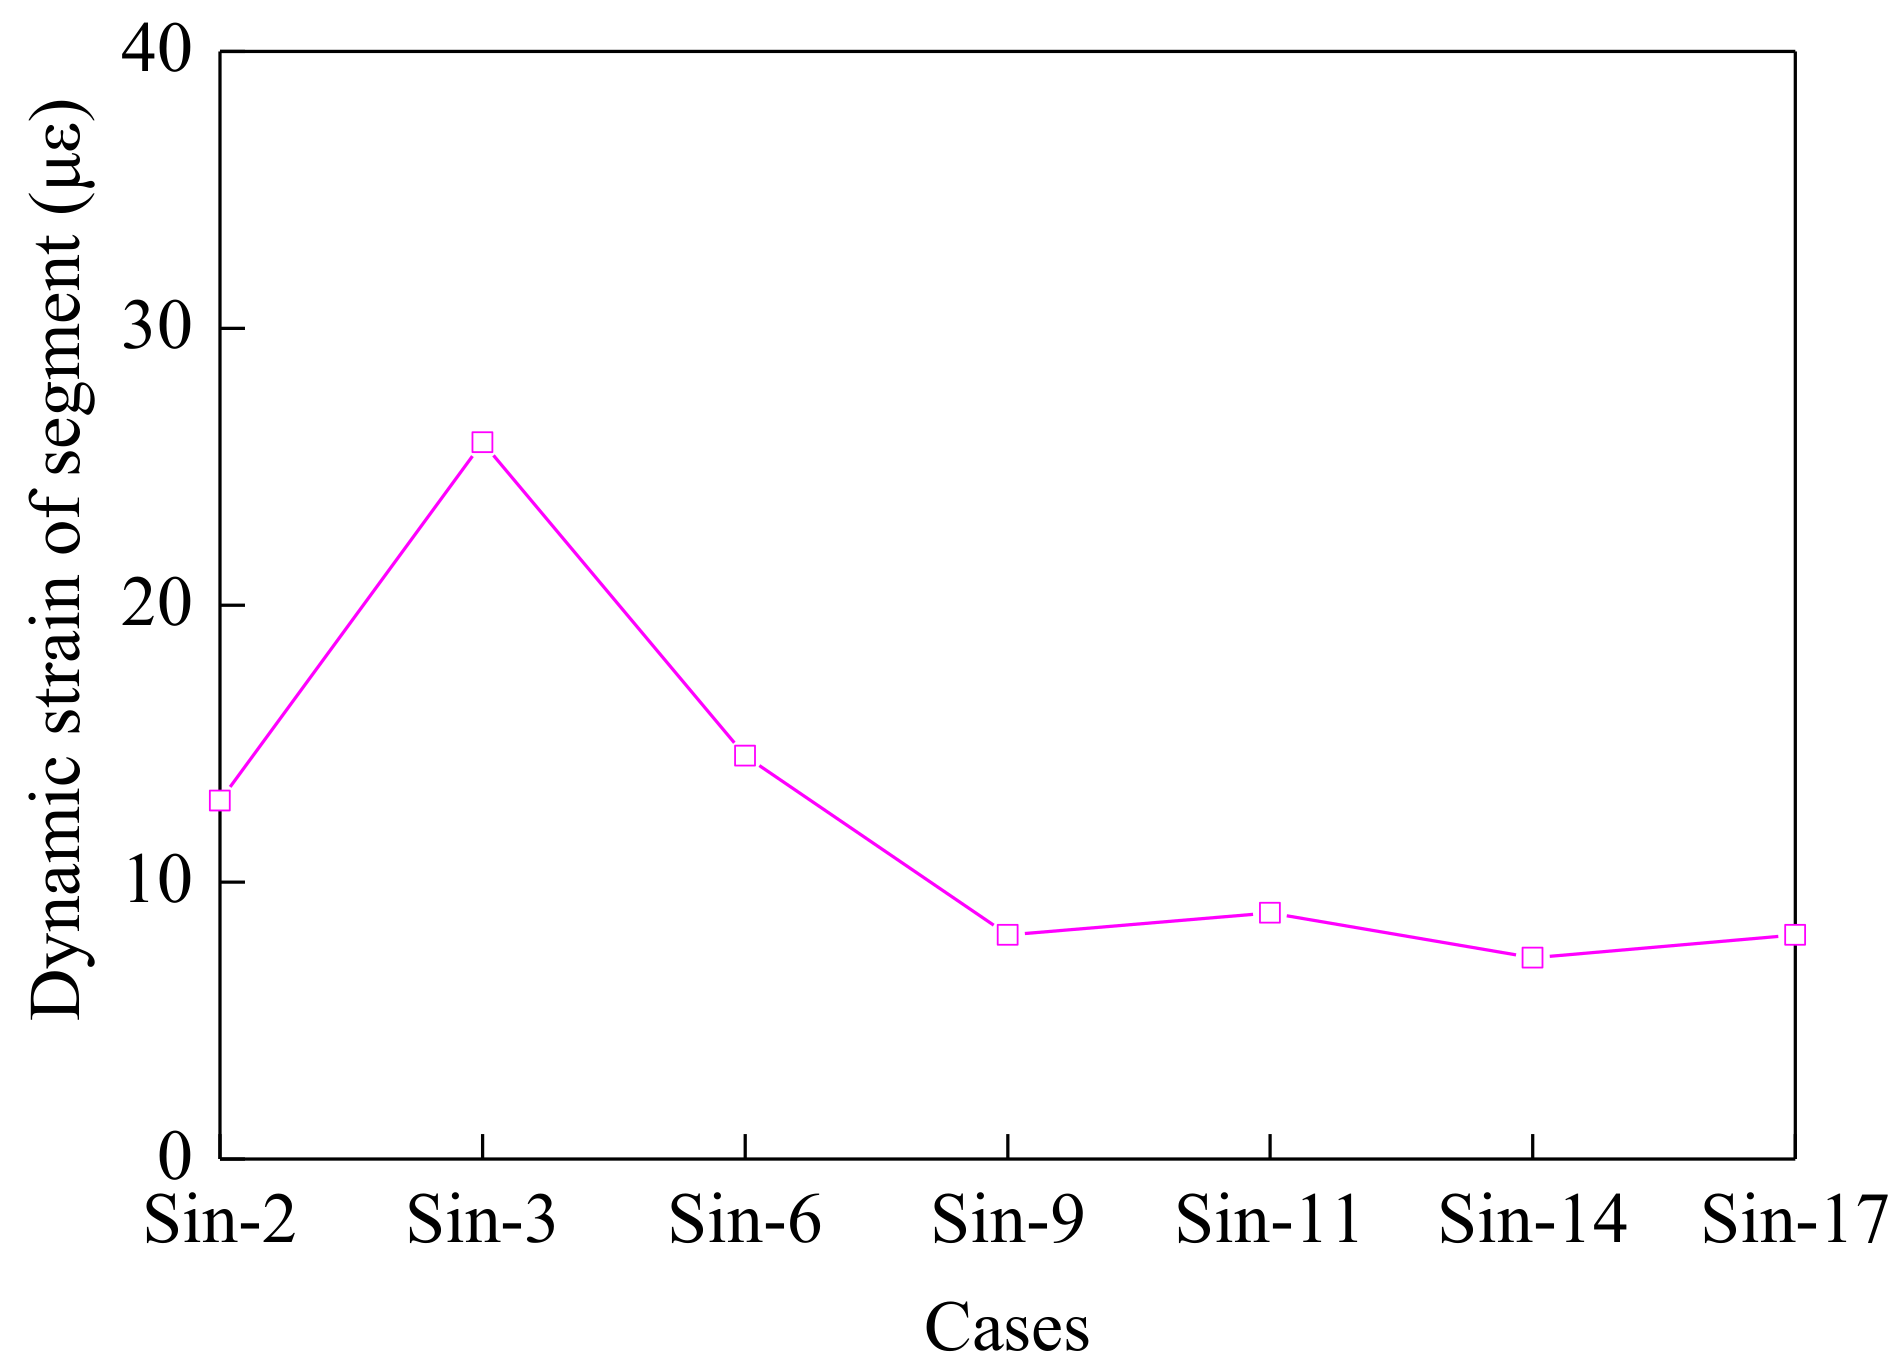
As can be seen from Figure 28, the maximum dynamic strain of segments first increases and then decreases with the increase of input frequency. In the case of the Sin-3, the dynamic strain of segments reaches the peak value, 25.88 με.
All the maximum responses of the tunnel aforementioned first increase and then decrease with the increase of input frequency. All the maximum responses of the tunnel reach the peak value when the frequency of excitation approaches but are lower than the fundamental frequency of the model ground. The maximum responses of the tunnel are highly dependent on frequency of input motion. Through comparison between the deformation of the ground (Section 4.2) and maximum tunnel responses (Figure 24 till Figure 28), it also illustrates that the larger deformation of ground induces higher tunnel responses under lower frequency excitation. These results show that the maximum responses of the tunnel are influenced by both the fundamental frequency of the model ground and lower frequency excitations.

6. Summary

Putting attention on the relationship between the frequency of input motions and mechanism of soil–tunnel interaction, this study conducted FF model tests and ST model tests under seven sinusoidal excitations. Focusing on the responses of the ground and the tunnel, the conclusions are presented as below:
(1) Comparing the FF model test and the ST model test, the influence of the tunnel on the fundamental frequency of the ground can be neglected.
(2) The low-order modal amplitude decreases gradually, and the dominant role of low-order vibration modes weakens gradually with the increase of frequency of input motions. The change of the combination of modal amplitudes will affect the dynamic responses of the soil–tunnel system.
(3) From the respect of waveform, phase, and peak, the differences of acceleration responses between the upper soil layer and the lower soil layer are obviously increasing with the increase of the input frequency. Except for the surface soil layer, the soft ground has damping effect on higher frequency excitations. Amplification effects of ground-surface acceleration are obvious under a higher excitation frequency. The presence of the tunnel induces a relatively high effect on acceleration responses of the ground within excitation frequency, varying from 9 to 17 Hz.
(4) The variation trend of acceleration at the top and bottom of the tunnel are basically similar with the acceleration distribution in model soil at the near depth. The peak values of tunnel cross-sectional deformation, extension/closure of longitudinal joints, and dynamic normal earth pressures all appear in the conjugate 45-degree direction of the tunnel’s cross-section. The response waveforms become more complex with the increase of sinusoidal frequency, and the waveforms of responses are closest to the sine function with the input frequency of 2 Hz. High-order vibration modes may distinctly affect the deformation of the ground under a higher frequency excitation. The maximum tunnel responses first increase and then decrease with the increase of sinusoidal frequency, and the maximum responses of the tunnel are influenced by both the fundamental frequency of the model ground and lower frequency excitations.
Compared with the prototype site, the simplified homogeneous ground has certain limitations, thus requiring further study.

Author Contributions

Conceptualization, Y.Y. (Yong Yuan) and S.Z.; methodology, Y.Y. (Yong Yuan), H.A.M. and S.Z.; validation, Y.Y. (Yong Yuan), S.Z., and Y.Y. (Yusheng Yang); investigation, S.Z.; resources, Y.Y. (Yong Yuan); writing—original draft preparation, S.Z.; writing—review and editing, Y.Y. (Yong Yuan); supervision, Y.Y. (Yong Yuan), H.A.M., and C.L. All authors have read and agreed to the published version of the manuscript.

Funding

This research was funded by the National Key Research and Development Plan of China (2017YFC1500703, 2018YFC1504305, and 2018YFC0809602), the National Natural Science Foundation of China (52061135112, 51908425, 41922059, 51678438, and 51778487), the Shanghai Committee of Science and Technology (18DZ1205103 and 18DZ1205106), and the support from the Fundamental Research Funds for the Central Universities of China.

Institutional Review Board Statement

Not applicable.

Informed Consent Statement

Not applicable.

Data Availability Statement

Not applicable.

Acknowledgments

The research was supported by the National Key Research and Development Plan of China (2017YFC1500703, 2018YFC1504305, and 2018YFC0809602), the National Natural Science Foundation of China (52061135112, 51908425, 41922059, 51678438, and 51778487), the Shanghai Committee of Science and Technology (18DZ1205103 and 18DZ1205106), and the support from the Fundamental Research Funds for the Central Universities of China. The above supports are greatly acknowledged.

Conflicts of Interest

The authors declare no conflict of interest.

References

  1. Bilotta, E.; Lanzano, G.; Russo, G.; Santucci, F.; Silvestri, F. Methods for the Seismic Analysis of Transverse Section of Circular Tunnels in Soft Ground; Workshop of ERTC12-Evaluation Committee for the Application of EC8 Special Session XIV ECSMGE, Madrid, Patron Editore; University of Naples Federico II: Bologna, Italy, 2007. [Google Scholar]
  2. Moss, R.E.S.; Crosariol, V.A. Scale Model Shake Table Testing of an Underground Tunnel Cross Section in Soft Clay. Earthq. Spectra 2013, 29, 1413–1440. [Google Scholar] [CrossRef]
  3. Bao, Z.; Yuan, Y.; Yu, H. Multi-scale physical model of shield tunnels applied in shaking table test. Soil Dyn. Earthq. Eng. 2017, 100, 465–479. [Google Scholar] [CrossRef]
  4. Cilingir, U.; Madabhushi, S.G. A model study on the effects of input motion on the seismic behaviour of tunnels. Soil Dyn. Earthq. Eng. 2011, 31, 452–462. [Google Scholar] [CrossRef]
  5. Chen, Z.; Shen, H. Dynamic centrifuge tests on isolation mechanism of tunnels subjected to seismic shaking. Tunn. Undergr. Space Technol. 2014, 42, 67–77. [Google Scholar] [CrossRef]
  6. Moghadam, M.R.; Baziar, M.H. Seismic ground motion amplification pattern induced by a subway tunnel: Shaking table testing and numerical simulation. Soil Dyn. Earthq. Eng. 2016, 83, 81–97. [Google Scholar] [CrossRef]
  7. He, C.; Koizumi, A. Dynamic behavior in transverse direction of shield tunnel with considering effect of segment joints. In Proceedings of the 12th World Conference on Earthquake Engineering, Auckland, New Zeland, 30 January–4 February 2000. [Google Scholar]
  8. Zhang, J.H.; Yuan, Y.; Yu, H.T. Shaking table tests on discrepant responses of shaft-tunnel junction in soft soil under trans-verse excitations. Soil Dyn. Earthq. Eng. 2019, 120, 345–359. [Google Scholar] [CrossRef]
  9. Zhou, H.; Wang, X.; He, C.; Huang, C. Seismic Response of a Tunnel Embedded in Compacted Clay through Large-Scale Shake Table Testing. Shock. Vib. 2018, 2018, 1–17. [Google Scholar] [CrossRef]
  10. Klappers, C.; Grübl, F.; Ostermeier, B. Structural analyses of segmental lining–Coupled beam and spring analyses versus 3D-FEM calculations with shell elements. Tunn. Undergr. Space Technol. 2006, 21, 254–255. [Google Scholar] [CrossRef]
  11. Ye, F.; Gou, C.-F.; Sun, H.-D.; Liu, Y.-P.; Xia, Y.-X.; Zhou, Z. Model test study on effective ratio of segment transverse bending rigidity of shield tunnel. Tunn. Undergr. Space Technol. 2014, 41, 193–205. [Google Scholar] [CrossRef]
  12. Yan, X.; Yu, H.T.; Yuan, Y.; Yuan, J.Y. Multi-point shaking table test of the free field under non-uniform earthquake excita-tion. Soils Found. 2015, 55, 985–1000. [Google Scholar] [CrossRef] [Green Version]
  13. Zhang, S.; Yuan, Y.; Li, C.; Yang, Y.; Yu, H.; Mang, H.A. Effects of interior structure as double deck lanes on seismic performance of segmental linings. Tunn. Undergr. Space Technol. 2020, 103, 103441. [Google Scholar] [CrossRef]
  14. John, S.; Zahrah, T. Aseismic design of underground structures. Tunn. Undergr. Space Technol. 1985, 2, 165–197. [Google Scholar] [CrossRef]
  15. Wang, J.N. Seismic Design of Tunnels: A Simple State-of-the-Art Design Approach; Parsons Brinckerhoff: New York, NY, USA, 1993. [Google Scholar]
  16. Zhang, J.; Meng, Q.; Tu, X.; Zhao, J.; Xiao, M.; Yuan, Y.; Papadrakakis, M.; Fragiadakis, M. Detailed simulation of the shaft ingate of a shield tunnel under seismic impact. In Proceedings of the COMPDYN 2017—6th International Conference on Computational Methods in Structural Dynamics and Earthquake Engineering, Rhodes Island, Greece, 15–17 June 2017; National Technical University of Athens: Athens, Greece, 2017; pp. 1032–1041. [Google Scholar]
  17. Chopra, A.K.; Kan, C. Effects of stiffness degradation on ductility requirements for multistory buildings. Earthq. Eng. Struct. Dyn. 1973, 2, 35–45. [Google Scholar] [CrossRef]
  18. Powell, G.; Row, D. Influence of Analysis and Design Assumptions on Computed Inelastic Response of Moderately Tall Frames; Earthquake Engineering Research Center, University of California: Berkeley, CA, USA, 1976. [Google Scholar]
  19. Peck, R.B.; Hendron, A.J.; Mohraz, B. State of the art of soft-ground tunneling. In Proceedings of the North American Rapid Excavation and Tunneling Conference, Chicago, IL, USA, 5–7 June 1972; Volume 1, pp. 259–286. [Google Scholar]
  20. Olson, J.V.; Rostoker, G. Longitudinal phase variations of Pc 4-5 micropulsations. J. Geophys. Res. Space Phys. 1978, 83, 2481. [Google Scholar] [CrossRef]
  21. Zhou, Y.; Tan, X.M.; Chen, J.; Pei, X.J.; Chen, Y.M. Observations and analyses of site amplification effects of deep liquefiable soil deposits by geotechnical downhole array. Chin. J. Geotech. Eng. 2017, 39, 1282–1291. (In Chinese) [Google Scholar]
  22. Newmark, N.M.; Blume, J.A.; Kapur, K.K. Seismic Design Spectra for Nuclear Power Plants. J. Power Div. 1973, 99, 287–303. [Google Scholar] [CrossRef]
  23. Chopra, A.K. Dynamics of Structures: Theory and Application to Earthquake Engineering, 3rd ed.; Prentice Hall/Pearson Education: Upper Saddle River, NJ, USA, 2007. [Google Scholar]
  24. Wilson, E.L. Three-Dimensional Static and Dynamic Analysis of Structures; Computers & Structures: Berkeley, CA, USA, 2002. [Google Scholar]
  25. Idriss, I.; Seed, H. Seismic response of horizontal soil layers. Am. Soc. Civil. Engr. J. Soil Mech. 1968, 4, 1003–1031. [Google Scholar]
  26. Smerzini, C.; Aviles, J.; Paolucci, R.; Sanchez-Sesma, F.J. Effect of underground cavities on surface earthquake ground mo-tion under SH wave propagation. Earthq. Eng. Struct. Dyn. 2009, 38, 1441–1460. [Google Scholar] [CrossRef]
  27. Hashash, Y.M.A.; Karina, K.; Koutsoftas, D.; O’Riordan, N. Seismic Design Considerations for Underground Box Structures. Earth Retent. Conf. 3 2010, 3, 620–637. [Google Scholar] [CrossRef]
  28. Bobet, A.; Fernandez, G.; Huo, H.; Ramirez, J. A practical iterative procedure to estimate seismic-induced deformations of shallow rectangular structures. Can. Geotech. J. 2008, 45, 923–938. [Google Scholar] [CrossRef]
  29. Takeuti, N.; Ootsuka, M. Seismic behavior of shield tunnel in a sudden change of ground. Tunn. Undergr. 1994, 25, 27–34. (In Japanese) [Google Scholar]
Figure 1. Cross-section of the prototype assembled lining.
Applsci 11 05097 g001
Figure 2. Dynamic characteristic curves of soils. (a) Dynamic shear modulus ratio versus shear strain.(b) Damping ratio versus shear strain.
Applsci 11 05097 g002aApplsci 11 05097 g002b
Figure 3. Installed laminar box.
Applsci 11 05097 g003
Figure 4. Sketch of the numerical simulation model.
Applsci 11 05097 g004
Figure 5. Model ring of segmental lining. (a) Steel wire. (b) Sealant in an assembled ring.
Applsci 11 05097 g005
Figure 6. The test of radial stiffness. (a) Loading. (b) Curves of load–displacement.
Applsci 11 05097 g006
Figure 7. Cross-sectional layout of sensors for the FF model (unit: mm).
Applsci 11 05097 g007
Figure 8. Soil–tunnel model (unit: mm). (a) Model tunnel. (b) Plane layout.
Applsci 11 05097 g008
Figure 9. Sensors on the model tunnel.
Applsci 11 05097 g009
Figure 10. Arranged sensors. (a) Accelerometer. (b) Displacement gauge. (c) Inductive displacement transduce. (d) Earth pressure gauge.
Applsci 11 05097 g010
Figure 11. Time history of input motion, with frequency of 2 Hz.
Applsci 11 05097 g011
Figure 12. Acceleration responses with depths in FF model. (a) Sin-2. (b) Sin-3. (c) Sin-6. (d) Sin-9. (e) Sin-11. (f) Sin-14. (g) Sin-17.
Applsci 11 05097 g012aApplsci 11 05097 g012b
Figure 13. Phase difference in FF model.
Applsci 11 05097 g013
Figure 14. Acceleration amplification coefficients along depths in FF model.
Applsci 11 05097 g014
Figure 15. Response spectrum of ground surface acceleration under different cases.
Applsci 11 05097 g015
Figure 16. Maximum lateral displacement of the laminar box along depths.
Applsci 11 05097 g016
Figure 17. Acceleration responses with depths in ST model. (a) Sin-2 (b) Sin-3. (c) Sin-6 (d) Sin-9. (e) Sin-11 (f) Sin-14. (g) Sin-17.
Applsci 11 05097 g017aApplsci 11 05097 g017b
Figure 18. Difference between FF model and ST model.
Applsci 11 05097 g018
Figure 19. Acceleration responses of segmental tunnel. (a) Sin-2. (b) Sin-3. (c) Sin-6. (d) Sin-9. (e) Sin-11. (f) Sin-14. (g) Sin-17.
Applsci 11 05097 g019aApplsci 11 05097 g019b
Figure 20. The cross-sectional deformation of segmental tunnel. (a) Sin-2 (BD1/BD3). (b) Sin-2 (BD2/BD4). (c) Sin-3 (BD2/BD4). (d) Sin-6 (BD2/BD4).
Applsci 11 05097 g020
Figure 21. Extension/closure of longitudinal joints. (a) Sin-2. (b) Sin-6.
Applsci 11 05097 g021aApplsci 11 05097 g021b
Figure 22. The dynamic soil pressure of segmental tunnel. (a) Sin-2. (b) Sin-3.
Applsci 11 05097 g022aApplsci 11 05097 g022b
Figure 23. The dynamic strain of segments, with frequency of 2 Hz.
Applsci 11 05097 g023
Figure 24. Maximum acceleration response at the top and bottom of the tunnel. (a) Maximum. (b) Amplification coefficient.
Applsci 11 05097 g024
Figure 25. Maximum cross-sectional deformations under different cases.
Applsci 11 05097 g025
Figure 26. Maximum extension/closure of longitudinal joint under different cases.
Applsci 11 05097 g026
Figure 27. Maximum dynamic earth pressures under different cases.
Applsci 11 05097 g027
Figure 28. Maximum dynamic strain of segments under different cases.
Applsci 11 05097 g028
Table 1. The stratigraphic parameters of Shanghai site.
NumberType of SoilThickness
(m)
Depth
(m)
Weight
(kN/m3)
Density
(kg/m3)
Shear Velocity
(m/s)
1Backfill1.81.817.01730137
2Yellow/gray-yellow silty clay7.29.018.11846.94140
3Gray muddy silty clay3.312.317.61795.92133
4Gray clay4.717.017.41775.51161
5Gray silty clay10.027.017.81816.33179
6Dark green silty clay2.829.819.62000.00311
7Yellow-gray sandy silt with clay9.439.219.01938.78289
8Gray silty fine sand2.842.018.91928.57346
Table 2. Similarity relations.
Physical QuantitiesSymbolDimensionsExpressionSimilarity Ratio (Model/Prototype)
Geometrical dimension l L S l 1/15
Density ρ M S ρ 1/2.7
Shear modulus G ML−1T−2 S G 1/39.2
Elastic modulus E ML−1T−2 S E = S G 1/39.2
Acceleration a LT−2 S a = S G S l 1 S ρ 1 1/1
Time t T S t = S l S ρ 1 / 2 S G 1 / 2 1/3.92
Frequency f T−1 S f = S l 1 S ρ 1 / 2 S G 1 / 2 3.92/1
Table 3. Parameters of soil and structure of prototype and model.
ParametersPrototypeModel
Shear stiffness of grounds (N/mm)914,0832926
Radial stiffness of linings (N/mm)702223.10
Transverse stiffness of linings (N/mm)9943.15
Stiffness ratio920929
Table 4. Instrument parameters.
TypesAccelerometer
(Tunnel)
Accelerometer
(Soil)
Displacement GaugeInductive Displacement TransducerEarth Pressure Gauge
Resolution0.1%<5%0.3%0.25%0.25%
Range±8 g±5 g0~0.6 mm0~10 mm0~30 kPa
Maximum sampling frequency570 Hz1000 Hz1000 Hz1000 Hz5000 Hz
Table 5. Testing cases.
Test IDInput MotionsFrequency (Hz)
WN-1White noise0–50
Sin-2Sinusoidal Wave2
Sin-3Sinusoidal Wave3
Sin-6Sinusoidal Wave6
Sin-9Sinusoidal Wave9
Sin-11Sinusoidal Wave11
Sin-14Sinusoidal Wave14
Sin-17Sinusoidal Wave17
WN-2White noise0–50
Table 6. Fundamental frequency of grounds.
ModelTest IDInput MotionsFundamental Frequency
(Hz)
Relative Difference
(%)
FFWN-1White noise4.990.81
WN-24.95
STWN-1White noise5.001.20
WN-24.94
Table 7. Modal participating mass ratios.
Mode OrderModal Participating Mass RatiosTotal Ratio
n = 181.1%95.0%
n = 29.0%
n = 33.2%
n = 41.7%
Table 8. Amplitude responses of vibration modes under different input frequency.
Modal Amplitude
(Absolute Peak Value)
Frequency of Sinusoidal Excitation
2 Hz3 Hz6 Hz9 Hz11 Hz14 Hz17 Hz
Mode order19.667.782.642.171.841.511.38
22.801.590.950.960.740.590.57
31.901.150.510.570.530.510.46
41.450.830.500.440.400.390.31
Table 9. Peak acceleration on tunnel.
CaseA-Top (g)A-Bottom (g)Difference (%)Phase Difference
Sin-20.1200.1190.831/64π
Sin-30.2100.15824.763/64π
Sin-60.1170.05453.853/5π
Sin-90.0570.093−63.16
Sin-110.0650.099−52.313/7π
Sin-140.1130.150−32.741/3π
Sin-170.0850.144−69.411/4π
Table 10. Peak dynamic strains of segments.
CasesLabelAbsolute Maximum (με)CasesLabelAbsolute Maximum (με)
Sin-2 HzSW19.70Sin-3 HzSW122.63
SW212.94SW225.88
SW311.30SW320.99
SW48.91SW413.76
Sin-6 HzSW112.12Sin-9 HzSW17.27
SW212.13SW27.28
SW310.49SW34.85
SW48.90SW48.09
Sin-11 HzSW18.89Sin-14 HzSW17.27
SW27.28SW25.66
SW35.65SW36.46
SW46.47SW44.86
Sin-17 HzSW16.46Sin-17 HzSW35.65
SW24.85SW48.09
Publisher’s Note: MDPI stays neutral with regard to jurisdictional claims in published maps and institutional affiliations.