Abstract
The population increase and the food demand increase the fight against climate change. Porcine production in Europe continues to increase, and Spain is the leading country in pig production. Manure management has a significant environmental impact that requires anaerobic digestion technologies for its mitigation. This technology helps produce biogas, a fuel that will reduce CO2 emissions. This study defines a distributed biogas generation model, determining the expected incomes from the development of this technology in small manure generation facilities (digestible organic waste). The development of this technology will contribute to reduce the demand for fossil energy and increase revenues by 22.7% regarding the expected revenues from the use of biogas for electricity generation.
1. Introduction
In the last decades, the world population has increased constantly, reaching 7.8 billion people in 2020, even though the growth rate has decreased by 1% yearly in the last few years [1]. Europe is the third most populated region on the planet, after Asia and Africa, also showing a constant population increase [2], and it is foreseen that this pattern will remain until 2050 [2]. Furthermore, the European society is quicky turning into an aged society [3] and mostly metropolitan, with 74.73% of its population living in large cities [4].
The population growth matches the need to reduce greenhouse gas emissions and, thus, help fight climate change. With a CO2 concentration in the atmosphere of 416 ppm [5] and a thermal anomaly in the atmosphere that reaches +0.99 °C [6], the use of renewable energy sources is a necessity, including the improvement of the efficiency, the capture, and the geological storage of CO2.
This shaping of the population makes it necessary to change the food chain production, for example, the production of meat from farm animals, ensuring access to a wide range of food. Spain is the country with the highest animal production in the European Union [7], with pigs being the most important group. In Spain, as well as in other countries, the tendency to farm livestock in the last years has led to the specialisation and concentration, which has meant a decrease in the number of farms but an increase in the average number of animals per farm [8,9]. This industrial model entails a series of environmental impacts, where manure is considered among the most relevant [10]. The management of this waste has an importance similar to any other phase of the commodity chain and is considered a principal factor of the success of the efficiency management [11]. In Spain, it is estimated that the production of this waste reaches 50 million tonnes annually [12].
Usually, manure is used as an organic fertilizer, but this can cause damage if overapplied (mostly N and P) in agriculture, which leads to the contamination of soil and water [13]. The environmental impacts related to pig breeding, such as climate change, acidification, and eutrophication, are mainly caused by inadequate treatment of manure [14,15,16]. The European Union Directive 91/676/EEC concerning the protection of waters against pollution caused by nitrates from agricultural sources has been the main driving force to develop and employ management methods by adopting appropriate fertilization plans adapted to the necessities of the soils and farming [17].
There is a wide range of treatment systems to process the different kinds of livestock manure [18], such as phase separation, ammonia absorption and extraction, thermal concentration (evaporation and drying), nitrification/denitrification, ammonium salt precipitation, and compost [19]. Anaerobic digestion is a livestock defecation treatment system [20] that involves the reduction of contaminating emissions (CH4, N2O, NH3, CO2) [21]. Anaerobic digestion prevents ammonia volatilization and removes volatile organic compounds [22,23], which makes it possible to prevent odor problems, water quality problems, and eutrophication [24]. It is well established in countries such as Germany, Austria, Denmark, Italy, and the Netherlands [25].
Through the degradation progress of the organic matter that takes place during anaerobic digestion, biogas is produced [26]. This gas, mainly formed by CH4 and CO2 in variable proportions [27], is considered a renewable energy source. Its attractiveness as an energy source is driven by the fact that its use reduces greenhouse gas emissions [28,29] by displacing the use of fossil-based natural gas. In Spain, the installed capacity is 234 MW [30], and a potential of 26,683 GWh of biogas is estimated, enough to cover 40% of household energy demand [31].
The anaerobic digestion technology is currently being used in large facilities due to its high investment and operational cost [32]: the current operational facilities where biogas is produced are landfills, water treatment plants, and some industrial sectors with a huge quantity of organic waste that needs to be treated. In the agro-industrial sector, the implementation of the anaerobic digestion technology must entail an economic profit compared to the traditional management of transport and manure application to available soils with an adequate amount of nutrients [33]. Improving the performance of low temperature anaerobic digestion is achieved by preheating the substrate, co-digestion with various local amendments, and advanced reactor design [34]; there are also other studies of carbon capture based on amines [35].
Without industrial references, this technology faces the technological challenge of developing a low-cost system that makes it possible to implement technology to generate distributed biogas.
This study is focused on analyzing the economic feasibility of biogas production on pig farms and its use for energy purposes in local environments. However, the methodology followed in the present case study may be applied in any European region. Distributed biogas aims to develop a novel economy model based on low-cost digesters and to use it not only to displace natural gas consumption, but also to reduce diffuse methane emissions and carbon dioxide as a consequence of traditional manure management; biogas distribution might be applied in any industrial sector with a moderate and diffuse organic waste production. The Emission Trading System in Europe is promoting sustainable technologies to decrease Green House Gases (GHGs) in several industrial sectors. The proposed case study is focused on the regions of Castile and León, one of the biggest pig production regions of Spain, with a production of 4 million heads (animals) in 2019 [36]. The economic model suggested a novel approach as a result of the internalization of the CO2 cost (Emission Trading System, ETS) in the distributed biogas production.
2. Materials and Methods
2.1. Castile and León and the Porcine Population
Castile and Leon have an area of 94,226 km2 and are located in the North-West of Spain. This region has the highest pig livestock census of Spain, after Aragón and Catalonia [37], and its pig livestock population is constantly increasing (15% in the last period observed: 2015–2019). This increase contrasts the inhabitant decrease during the same period. Currently, it is at 25 inhabitants per km2, which, in contrast to the average value of Spain (94 inhabitant/km2), is a clear sample of the depopulation risk of the region.
In the region studied, there are five provinces with a porcine census that covers 79% of the pig population of Castile and León. In Figure 1, the total census of porcine livestock is shown, along with the two types of livestock considered: pigs, and fattening pigs.
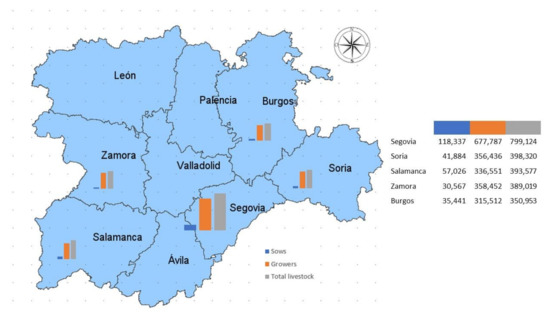
Figure 1.
Porcine livestock in the five regions studied.
To georeference the pig livestock farms of the five provinces studied, a Geographic Information System (GIS) was developed based on a free software: gvSIG (Valencia, Spain). With this software it is possible to access vectorial and rasterizing information and map servers that follow Open Geospatial Consortium (OGC) specifications (web map services). It is also an intuitive and easy to use program without prior knowledge [38].
In addition to georeferencing, the studied farms, and the map generation, it is also necessary to work and process the information in an Excel table. This software is ideal to import data as a table through its extension (.csv).
Starting from vector layers of the provinces and the municipalities studied in Castile and León, the following data were added to the attribute table: geographic coordinates of the farms, municipal population census, and biogas production per farm. In the process manager of the system there are different functionalities; one of them is the area of influence (buffer), which was used to generate and analyze the areas of influence of the selected municipalities and to determine the biogas production in the adjacent areas. In the process manager of the program there is also a fusion function, used to fuse areas of influence that overlap.
2.2. Pig Farm to Produce Manure
Due to its agro-industrial potential (agriculture and livestock), it is intended to quantify the biogas production from pig manure through a distributed biogas generation model, andthe municipalities selected are those with a minimum number of livestock. This number is not the same for the five provinces studied; two parameters were considered to select them: closeness to the energy-demanding municipality despite having a small livestock census, and a biogas production of 30% or more of what the largest farm in the province produces. The selected farms have two types of livestock: sows with piglets until weaning (0–6 kg) and feeder (50–100 kg). Every type of animal produces different quantities of defecation and, therefore, biogas production. The sows have a manure production of 5.1 m3/year, and the growers, 2.5 m3/year [33].
From an energetic point of view, the biogas will be appraised by municipalities with a population of over 5000 inhabitants. To determine the radius of influence to capture and energetically use the biogas generated in the distributed model, a study of the adequate radius has been carried out.
In Soria there are two municipalities with more than 5000 inhabitants (Almazán and Soria), presented in Figure 2 in dark yellow. The biogas production capacity for the two biggest radiuses considered in the study (30 and 50 km) constitutes less than 10% and up to 30% more of the biogas production in relation to the smallest radius. These increases are similar to the other provinces studied. However, the province of Burgos is considered an exception as its biogas production is increased drastically with a larger radius. Because these increases do not justify the radius increase and the expensive transport logistics, in the present study, a radius of 25 km is considered.
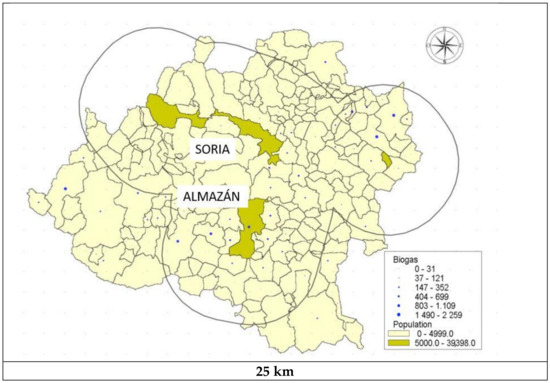
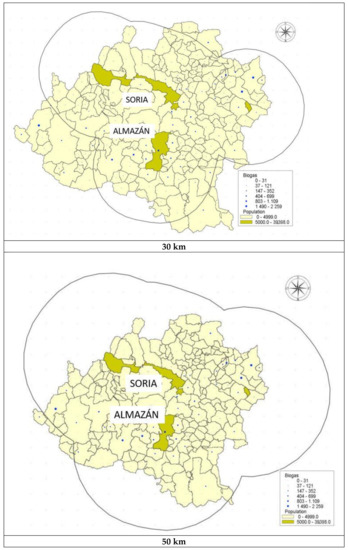
Figure 2.
Radius of influence of the distributed biogas generation model. Example: Soria.
Despite the existence of more municipalities with over 5000 inhabitants than the ones used in the study, some municipalities have been eliminated because they did not have a significant pig production in the area of influence under study. Therefore, the area of influence is limited to close municipalities that have more farms or that demand more energy.
3. Results
Georeferenzing of Biogas in Each Province Studied
The georeferenced data relating to the energy production capacity using pig manure are shown in Figure 3, where dark yellow shows the municipalities chosen, according to Table 1. Furthermore, the radius of influence considered is 25 km for each area studied, and the blue points represent the municipalities inside each radius with farms and biogas production.
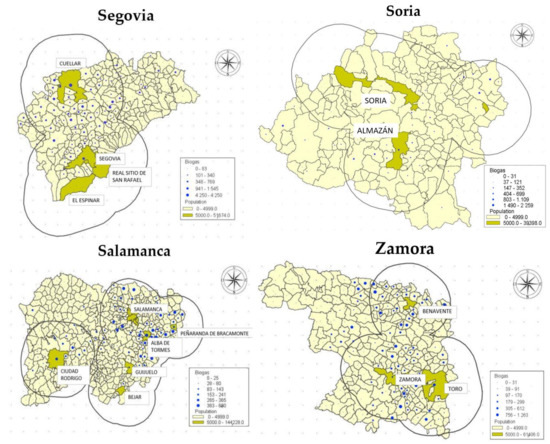
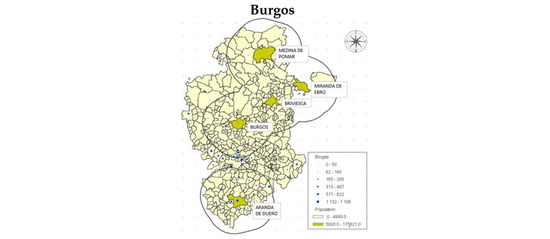
Figure 3.
Areas of influence of 25 km from the municipalities with higher energy demand.

Table 1.
Porcine livestock census of the studied municipalities.
Through Equations (1) and (2) it is possible to determine the total manure production (TPp, m3/year). For the pig manure production (PPc, m3/year), an average value of 1.6 m3 per animal was considered. The porcine census (Cc, number of pigs) of the municipalities in the established area of influence was considered (Table 1).
TPp = PPc · Cc
For the considered areas, 1,563,274 pig heads are established, which accounts for 36.85% of the pigs in Castile and León. The number of pigs considered in the study accounts for an annual manure production of 4,377,952 m3.
Production of biogas per animal (PPbiogas, m3/pig) was calculated considering average values of the organic matter content (OM, kg/m3) in the liquid manure (4–5%), liquid manure daily production, and average yield of biogas (Ybiogas, m3biogas/kg OM) reported for this kind of substrate, according to Equation (2). Mean values were obtained from [39].
PPbiogas = PPc · OM · Ybiogas
According to this calculation, biogas production averaged between 0.08 and 0.11 m3 per day and animal.
Considering the calorific power of the biogas (PCbiogas, kWh·m−3) in the range of 6 and 6.5 kWh/m3, for the calculations of the study a value of 6.3 kWh/m3 [39] is considered. Through Equation (3) it is possible to determine the daily biogas production of the area of influence (Pbiogas, kWh/day).
It is calculated with Equation (2) and reflected in Table 1. Inside the areas of influence, a total biogas production of 699,243 kWh/d was obtained.
To know the power and incidence of distributed biogas generation on the energy consumption in the area under study, the average electricity consumption of Spain is considered: electricity consumption in Spain per capital amounted to 1.56 MWh/inhabitant·year (2019) in the residential sector, with electricity being the first source of energy consumed in said sector, followed by natural gas with approximately half of the energy consumed in households [2]. In this case, the electricity demand in the municipalities under study ranged from 209% (Cuéllar) to 1.3% (Burgos). A 38% efficiency has been considered for the electricity generation of a motor-generator or turbine, with combined heat and power (CHP).
This is the average value of this kind of installed equipment in Europe [40]; the results are shown in detail in Table 2. The thermal energy needs of the biogas production systems (digesters) are covered since the average thermal efficiency of the equipment is 50–55%.
Table 2.
Energy demand and covered energy of the selected municipalities, considering the energy demand of the residential sector.
The value of the biogas distributed generation model is completed with the economic analysis, where the following benefits are obtained: (i) renewable and safe electrical energy and (ii) CO2 emissions reduction in a sector regulated by Directive 2003/87/CE.
To calculate the electrical energy cost, the average value of the cost of natural gas in Spain (without taxes) is considered, for the non-household consumers, and within the 10,000–100,000 GJ range of annual natural consumption, which in 2019 was 0.03 €/kWh, the value is slightly higher than the EU28 average (5.7% higher than the European average).
Considering the energy produced by m3 of biogas and defined in the previous section, it is possible to establish the energy potentially produced and its market value (Equation (4)), where Inc is defined as expected income (Inc, €/year), the biogas production (Pbiogas, kWh/d) considering the previous determined production and shown in Table 1, and 365 established days of operation. The price of natural gas of the household consumers was calculated as follows.
The energy production from biogas as primary energy can be quantified considering Equation (4); the result is a revenue of 8,627,396 € for the studied municipalities (Figure 4). The municipality of Cuéllar (Segovia) stands out; its production from the established model generates revenues of more than 2.4 × 10⁶ €/year. Meanwhile, regarding the municipality where the coming biogas production facility for the mixed farming will be located (LIFE SMART AgroMobility), the expected revenue from the implantation of this energy generation model will reach the value of 1,078,540 €/year.
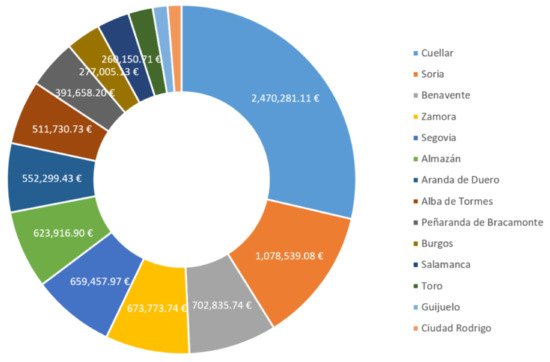
Figure 4.
Expected incomes from the production of energy from the proposed generation model.
Considering the natural gas emission factor (EF, tCO2/kWh)–fuel displaced by biogas in the current model–established at 0.182 kg CO2/kWh [41], it is possible to determine the amount of CO2 in tonnes that would be avoided (CO2-avoided, tCO2/year) by using the distributed biogas generation model (Equation (5)), taking into account the biogas generated energy (EBiogas, kWh/year). Furthermore, these emission reductions are calculated as income (CO2-income, €/year), for they replace fossil fuel by renewable fuel. In order to do this, the average value of the CO2 cost for the year 2021 is established (CO2-cost, €/tCO2), which is the beginning of the phase IV of the EU emissions trading market. During the first quarter of Phase IV, the average cost of the EU emissions trading system was 37.41 €/tCO2 [42].
CO2-avoided = FE · Ebiogas
CO2-income = CO2-avoided · CO2-cost
According to Equation (5), the total amount of CO2 emissions avoided is 52,339.54 tCO2/year, with figures up to 14,986.4 tCO2/year in the administrative territory of Cuellar and 6543.14 tCO2/year in the municipality of Soria.
Lastly, the expected income, as a consequence of the CO2 emissions-free electricity generation, is calculated. The proposed generation model as a whole would reach 1,958,022.16 €, which is an additional 22.7% with regard to the electricity generation income (Equation (5)). Again, the administrative territory of Cuéllar is the one with the highest revenue (560,640 €/year), while Soria would reach 244,778.76 €/year when avoiding CO2 emissions. Table 3 shows the detailed values for each municipality.
Table 3.
Avoided CO2 tonnes and expected incomes.
In order to test the reliability of the study, different scenarios have been considered, in which the parameters considered are:
- Scope and growth of the pig herd; a parameter that evaluates the variation and impact of the distributed biogas generation model versus the availability of organic matter.
- Biogas production, based on the lower heating value (kWh/m3), considering the variation of the biogas capacity and the organic matter content (0.05 and 0.15 m3/animal) (LIFE SMART AgroMobility).
- Natural gas cost evolution to generate electricity (big consumers), considering the historic prices during the 2015–2020 period.
- CO2 cost evolution in the first quarter of phase IV of the EU emissions trading system.
According to these parameters, five points have been selected for the sensitivity analysis: (i) considering the expected value (MED) and the basis of the calculus presented in this section, and (ii) the maximum (MAX) and minimum (MIN) value for each parameter range. Finally, the extreme values of the analysis are based on (iv) a 25% increase for the maximum value and (v) a 75% increase for the minimum value.
According to Figure 5, the parameter with the highest incidence and variability is the price of CO2, with a greater slope compared to the parameter of the number of livestock included in the study. Lastly, the parameters of the natural gas price variation and biogas energy production capacity have similar and lower slopes than the parameters considered above; this is due to a low range of natural gas price variation during the period considered (2015–2019) and the maturity of biogas electricity production technology, which reduces the range of maximum and minimum production (kWh/m3 biogas).
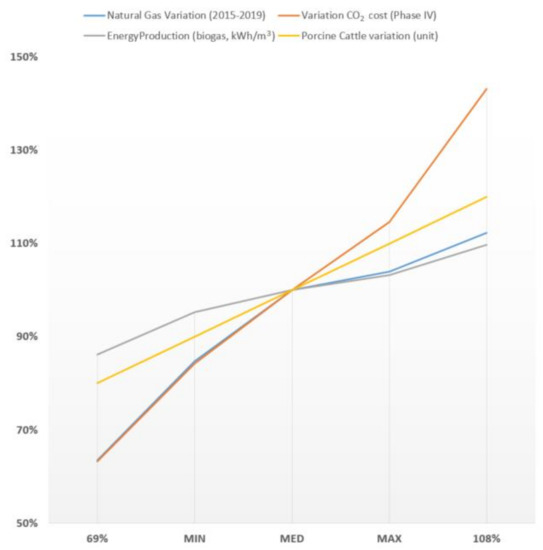
Figure 5.
Sensitivity analysis for the different parameters studied.
4. Conclusions
The foreseeable population increase in the European Union will continue to put pressure on the primary sector (agriculture and livestock) in order to continue to provide food for the population. This increase in the number of pigs is clear in regions such as Castile and León.
Manure generation, which is considered to have one of the major environmental impacts regarding animal stall farms, may involve a model of distributed biogas generation and its use as primary energy for electricity generation, such as the one proposed in this study. The production capacity of electricity means, in some cases, a complete sustainable production in municipalities such as Cuéllar (Segovia), as well as other municipalities with a bigger population that will also see their CO2 emissions reduced due to the use of biogas.
The reduction of CO2 emissions could result in additional incomes to the electricity generation model, amounting to 22.70% in the expected case. Furthermore, the sensitivity analysis indicates that this parameter is the one with the greatest impact on the economic model; if a tightening of CO2 emission conditions in the power generation sector is expected in the coming years, the CO2 cost may approach the maximum values considered in this study. This will increase the interest of this model in the future. This primary energy, in addition to being renewable, offers high load factors and, therefore, a guarantee of supply compared to other intermittent renewable technologies (wind, photovoltaic).
The impact of the model proposed here will be higher if, in addition to the electricity generation, the biogas is used in the installation of the co-generation and the use of heat in a district-heating system to be used in the households of the considered municipalities.
The georeferencing of the pig herd at the municipality level makes it possible to establish the details of use of this waste for energy purposes, minimizing transport costs. In this case, the considered radius of 25 km is the adequate for four out of the five provinces under study; only the Burgos region increases its production capacity in a radius of influence of 30 km. Considering the established conditions in the present distributed biogas production model, 68% of the demanded electricity production in the municipalities with more than 5000 inhabitants could be covered.
The distributed biogas generation model could be completed with a model to use digestate and produce biofertilizer, which would transform the present study into an example of a circular economy, tightening the agro-industrial and energy relationship. Results achieved in the present study can be applied to any livestock industry where organic waste can be considered a useful resource to generate energy. Moreover, the ETS has demonstrated its capacity to increase the interest in sustainable solutions to reduce GHG emissions in regulated industries, such as the electricity production sector. Thus, the outcomes of the present study might be suitable for policy makers in other non-European regions that aims to reduce GHG emissions.
In the coming studies it will be necessary to evaluate the investment cost (CAPEX) and operational cost (OPEX) of the small and low-cost anaerobic digestion facilities to complete the economic study started in this study. Moreover, the model could be completed with the potential transformation of biogas into biomethane and its use to generate electricity and to be used as a fuel in the transport sector. Previous studies show that anaerobic digestion not only produces biogas but also reduces waste and GHG emissions, and that to transform biogas into biomethane there are more than one type of CO2 capture technology available.
Author Contributions
C.R.: investigation, Conceptualization, methodology and supervision; L.S.-M.: investigation, writing—original draft preparation; I.d.G.: formal analysis, validation; P.M.: resources, methodology and supervision; B.L.: investigation, writing—review and editing, project administration and funding acquisition. All authors have read and agreed to the published version of the manuscript.
Funding
This research was funded by LIFE SMART AgroMobility, grant number LIFE19-CCM-ES-001206 and, the APC was funded by the same project.
Institutional Review Board Statement
Not applicable.
Informed Consent Statement
Not applicable.
Data Availability Statement
Not applicable.
Acknowledgments
This work is supported by the LIFE SMART AgroMobility project (LIFE19-CCM-ES-001206) financed by the European Union, part of the LIFE program. The authors of this work would like to thank Rocío Sánchez Ramos for her contribution as a translator, proof-reader, and editor of the text.
Conflicts of Interest
The authors declare no conflict of interest.
References
- Worldometer. World Population Clock: 7.8 Billion People (2021). Available online: https://www.worldometers.info/ (accessed on 26 February 2021).
- Statistics. Eurostat 2021. Available online: https://ec.europa.eu/info/statistics_en (accessed on 26 February 2021).
- European Commission. Demographic Trends in EU Regions. Available online: https://ec.europa.eu/regional_policy/en/newsroom/news/2019/01/31-01-2019-demographic-trends-in-eu-regions (accessed on 26 February 2021).
- The World Bank. Urban Population (% of Total Population)–European Union. Available online: https://data.worldbank.org/indicator/SP.URB.TOTL.IN.ZS?locations=EU (accessed on 26 February 2021).
- National Oceanic and Atmospheric Administration. Global Monitoring Laboratory–Carbon Cycle Greenhouse Gases. Available online: https://www.esrl.noaa.gov/gmd/ccgg/trends/monthly.html (accessed on 31 March 2021).
- NASA Climate Change. Available online: https://climate.nasa.gov/ (accessed on 31 March 2021).
- Statistics Explained. Agricultural Production–Livestock and Meat. Available online: https://ec.europa.eu/eurostat/statistics-explained/index.php?title=Agricultural_production_-_livestock_and_meat&oldid=470510 (accessed on 26 February 2021).
- Hegg, R. Manure management in North America: Management and future trends. In Libro de Actas del I Congreso Español de Gestión Integral de Deyecciones Ganaderas; Magrí, A., Prenafeta-Boldú, F.X., Flotats, X., Eds.; Fira de Barcelona: Barcelona, Spain, 2008; pp. 3–10. [Google Scholar]
- Food and Agriculture Organization of the United Nations. Livestock Primary. Available online: http://faostat.fao.org/site/569/default.aspx (accessed on 29 March 2021).
- Zengwei, Y.; Pan, X.; Chen, T.; Zhang, Y.; Jiang, S.; Sheng, H.; Zhang, L. Evaluating environmental impacts of pig slurry treatment technologies with a life-cycle perspective. J. Clean. Prod. 2018, 188, 840–850. [Google Scholar] [CrossRef]
- Martinez, J.; Burton, C. Manure management and treatment in Europe: A review on environmental, technological and policy perspectives. In Libro de Actas del I Congreso Español de Gestión Integral de Deyecciones Ganaderas; Magrí, A., Prenafeta-Boldú, F.X., Flotats, X., Eds.; Fira de Barcelona: Barcelona, Spain, 2008; pp. 257–272. [Google Scholar]
- de Gregorio, M. Biomasa en España. Generación de Valor Añadido y Análisis Prospectivo; Fedea: Madrid, Spain, 2020. [Google Scholar]
- Bernet, N.; Béline, F. Challenges and innovations on biological treatment of livestock effluents. Bioresour. Technol. 2009, 100, 5431–5436. [Google Scholar] [CrossRef] [PubMed]
- Brockmann, D.; Hanhoun, M.; Negri, O.; Helias, A. Environmental assessment of nutrient recycling from biological pig slurry treatment-impact of fertilizer substitution and field emissions. Bioresour. Technol. 2014, 163, 270–279. [Google Scholar] [CrossRef] [PubMed]
- Lopez-Ridaura, S.; Werf, H.; Paillat, J.M.; Le Bris, B. Environmental evaluation of transfer and treatment of excess pig slurry by life cycle assessment. J. Environ. Manag. 2009, 90, 1296–1304. [Google Scholar] [CrossRef] [PubMed]
- Prapaspongsa, T.; Christensen, P.; Schmidt, J.H.; Thrane, M. LCA of comprehensive pig manure management incorporating integrated technology systems. J. Clean. Prod. 2010, 18, 1413–1422. [Google Scholar] [CrossRef]
- European Commission. Directive 91/676/EEC of 12 December 1991 Concerning the Protection of Waters against Pollution Caused by Nitrates from Agricultural Sources; European Commission: Brussels, Belgium, 1991. [Google Scholar]
- Palese, A.M.; Persiani, A.; D’Adamo, C.; Pergola, M.; Pastore, V.; Sileo, R.; Ippolito, G.; Lombardi, M.A.; Celano, G. Composting as Manure Disposal Strategy in Small/Medium-Size Livestock Farms: Some Demonstrations with Operative Indications. Sustainability 2020, 12, 3315. [Google Scholar] [CrossRef]
- Flotats, X.; Bonmatí, A.; Fernández, B.; Magrí, A. Manure treatment technologies: On-farm versus centralized strategies. NE Spain as case study. Bioresour. Technol. 2009, 100, 5519–5526. [Google Scholar] [CrossRef] [PubMed]
- Rico, C.; Montes, J.A.; Rico, J.L. Evaluation of different types of anaerobic seed sludge for the high rate anaerobic digestion of pig slurry in UASB reactors. Bioresour. Technol. 2017, 238, 147–156. [Google Scholar] [CrossRef] [PubMed]
- Fangueiro, D.; Hjorth, M.; Gioelli, F. Acidification of animal slurry-a review. J. Environ. Manag. 2015, 149, 46–56. [Google Scholar] [CrossRef] [PubMed]
- Lymperatou, A.; Rasmussen, N.B.; Gavala, H.N.; Skiadas, I.V. Improving the Anaerobic Digestion of Swine Manure through an Optimized Ammonia Treatment: Process Performance, Digestate and Techno-Economic Aspects. Energies 2021, 14, 787. [Google Scholar] [CrossRef]
- Djelal, H.; Tahrani, L.; Fathallah, S. Treatment process and toxicities assessment of wastewater issued from ananerobic digestion of household wastes. Environ. Sci. Pollut. Res. 2014, 21, 2437–2447. [Google Scholar] [CrossRef] [PubMed]
- Nasir, I.M.; Ghazi, T.I.M.; Omar, R. Anaerobic digestion technology in livestock manure treatment for biogas production: A review. Eng Life Sci 2012, 12, 258–269. [Google Scholar] [CrossRef]
- Eurobser, E.R. Biogas barometer 2017. Available online: https://www.eurobserv-er.org/category/all-biogas-barometers/ (accessed on 31 January 2021).
- Mao, C.; Feng, Y.; Wang, X.; Ren, G. Review on research achievements of biogas from anaerobic digestión. Renew. Sustain. Energy Rev. 2015, 45, 540–555. [Google Scholar] [CrossRef]
- Yentekakis, I.V.; Goula, G. Biogas management: Advanced utilization for production of renewable energy and added value chemicals. Front. Environ. Sci. 2017, 5, 1–7. [Google Scholar] [CrossRef]
- Xu, J.; Adair, C.W.; Deshusses, M.A. Performance evaluation of a full-scale innovative swine waste-to-energy system. Bioresour. Technol. 2016, 216, 494–502. [Google Scholar] [CrossRef] [PubMed]
- Clemens, J.; Trimborn, M.; Weiland, P.; Amon, B. Mitigation of greenhouse gas emissions by anaerobic digestion of cattle slurry. Agric. Ecosyst. Environ. 2006, 112, 171–177. [Google Scholar] [CrossRef]
- Ministerio para la Transición Ecológica y el Reto Demográfico. Hoja de Ruta de Biogás. Available online: https://energia.gob.es/es-es/Participacion/Paginas/DetalleParticipacionPublica.aspx?k=315 (accessed on 15 March 2021).
- Rural Bioenergy. Use of the Biogas Potential in Spain. Available online: https://ruralbioenergy.com/en/2019/04/use-of-the-biogas-potential-in-spain/ (accessed on 15 March 2021).
- USGS, Science for a Changing World. Landfill Leachate Released to Wastewater Treatment Plants and other Environmental Pathways Contains a Mixture of Contaminants Including Pharmaceuticals. Available online: https://www.usgs.gov/ecosystems/environmental-health/science/landfill-leachate-released-wastewater-treatment-plants-and?qt-science_center_objects=0#qt-science_center_objects (accessed on 16 March 2021).
- Campos, E.; Illa, J.; Magrí, A.; Sole-Mauri, F.; Flotats, X. Guía de los Tratamientos de las Deyecciones Ganaderas. In Proceedings of the Generalitat de Catalunya, Barcelona, Spain, 2 April 2004; p. 10. [Google Scholar]
- Yin, N.; An, C.J.; Zhao, K.; An, Y.K.; An, S. Handling of Amine-Based Wastewater Produced During Carbon Capture. J. Environ. Inform. Lett. 2019, 2, 57–69. [Google Scholar] [CrossRef]
- Yao, Y.; Huang, G.; An, C.; Chen, X.; Zhang, P.; Xin, X.; Agnew, J. Anaerobic digestion of livestock manure in cold regions: Technological advancements and global impacts. Renew. Sustain. Energy Rev. 2019, 119. [Google Scholar] [CrossRef]
- Censo de Ganado Porcino en Castilla y León. Available online: https://www.leonoticias.com/campo/censo-ganado-porcino-castilla-leon-20200411124032-in.html (accessed on 16 March 2021).
- Statistics. Eurostat. Cabaña Española de Porcino de Las Distintas Comunidades Autónomas en España. Available online: https://es.statista.com/estadisticas/525960/cabana-espanola-de-porcino-por-cc-aa-en-espana/ (accessed on 16 March 2021).
- Anguix, A.; Díaz, L. gvSIG: A GIS desktop solution for an open SDI. J. Geogr. Reg. Plan. 2008, 1, 41–48. [Google Scholar]
- Dieter, D.; Steinhauser, A. Biogas from Waste and Renewable Resources: An Introduction; Wiley-VCH: Weinheim, Germany, 2008. [Google Scholar] [CrossRef]
- Decorte, M.; Sainz Arnau, A.; Dekker, H.; Pfluger, S.; Giacomazzi, M. Annual Report 2020; European Biogas Association: Brussels, Belgium, 2021. [Google Scholar]
- Factores de Emisión, Registro de Huella de Carbono, Compensación y Proyectos de Absorción de Dióxido de Carbono. Available online: https://www.miteco.gob.es/es/cambio-climatico/temas/mitigacion-politicas-y-medidas/factores_emision_tcm30-479095.pdf (accessed on 22 March 2021).
- SendeCO2. Precios CO2. Available online: https://www.miteco.gob.es/es/cambio-climatico/temas/mitigacion-politicas-y-medidas/factores_emision_tcm30-479095.pdf (accessed on 22 March 2021).


Publisher’s Note: MDPI stays neutral with regard to jurisdictional claims in published maps and institutional affiliations. |
© 2021 by the authors. Licensee MDPI, Basel, Switzerland. This article is an open access article distributed under the terms and conditions of the Creative Commons Attribution (CC BY) license (https://creativecommons.org/licenses/by/4.0/).