
Characteristics of Polycarbonate Soft Segment-Based Thermoplastic Polyurethane


 ,
,
Abstract
:
1. Introduction
2. Materials and Methods
2.1. Materials
2.2. Poly (TMC) Glycol Synthesis
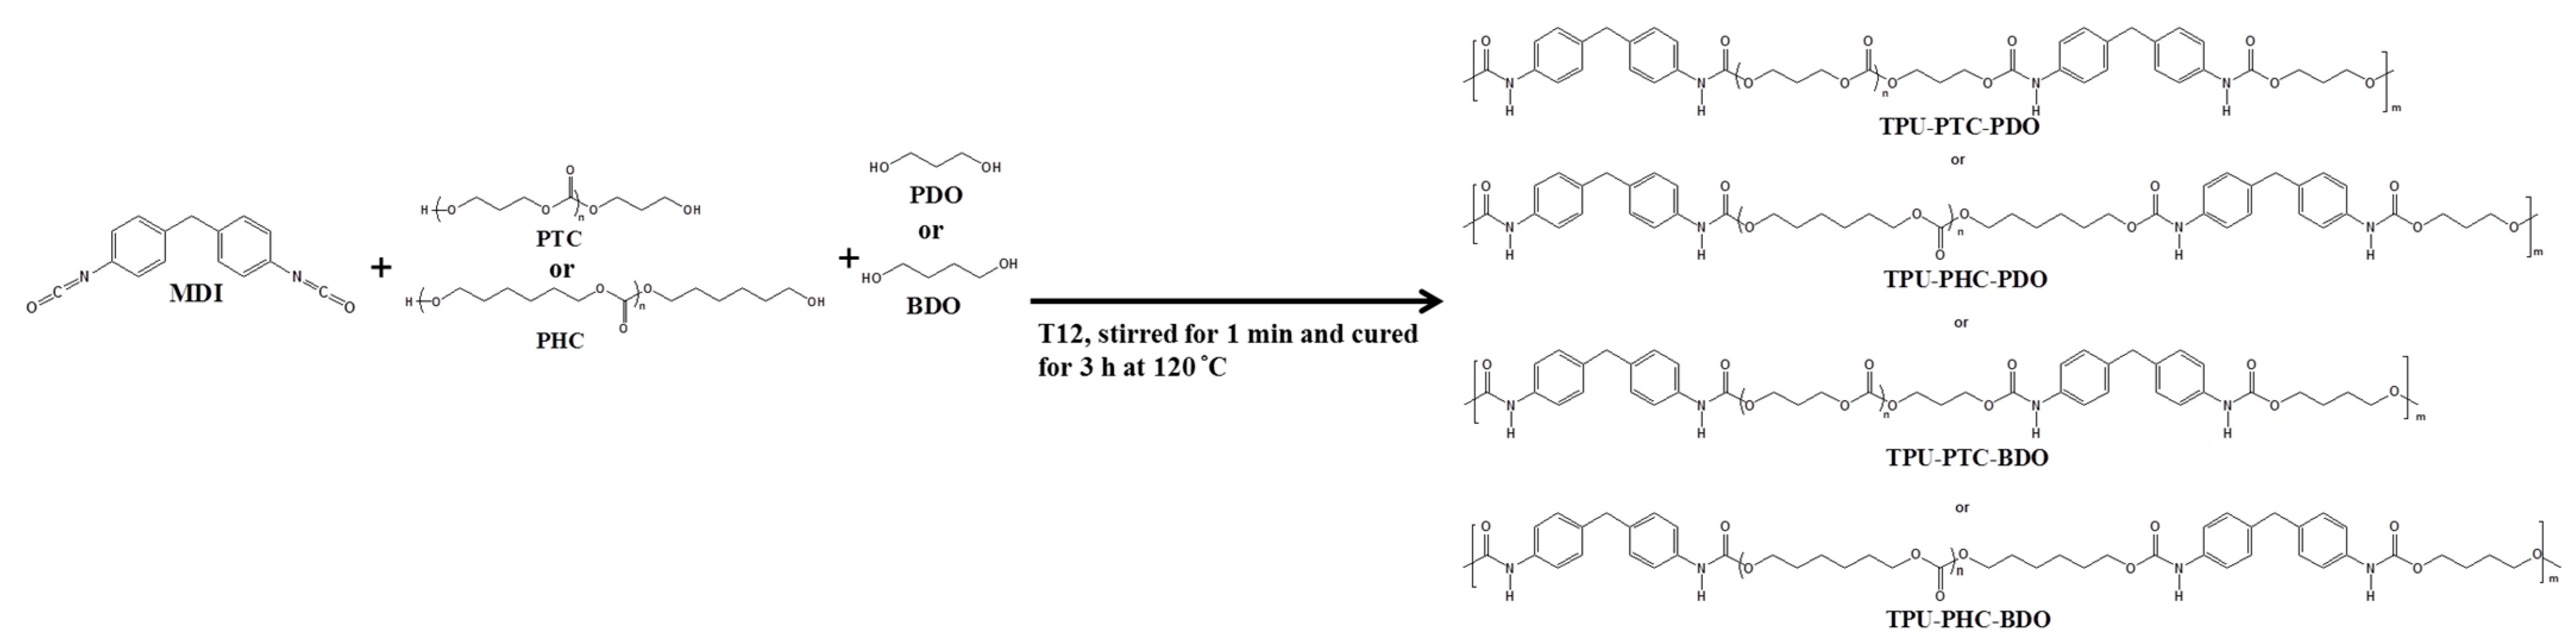
2.3. TPU Synthesis
2.4. Instruments
2.4.1. Fourier Transform Infrared Spectroscopy
2.4.2. 1H Nuclear Magnetic Resonance
2.4.3. Gel Permeation Chromatography
2.4.4. Thermogravimetric Analysis
2.4.5. Differential Scanning Calorimetry
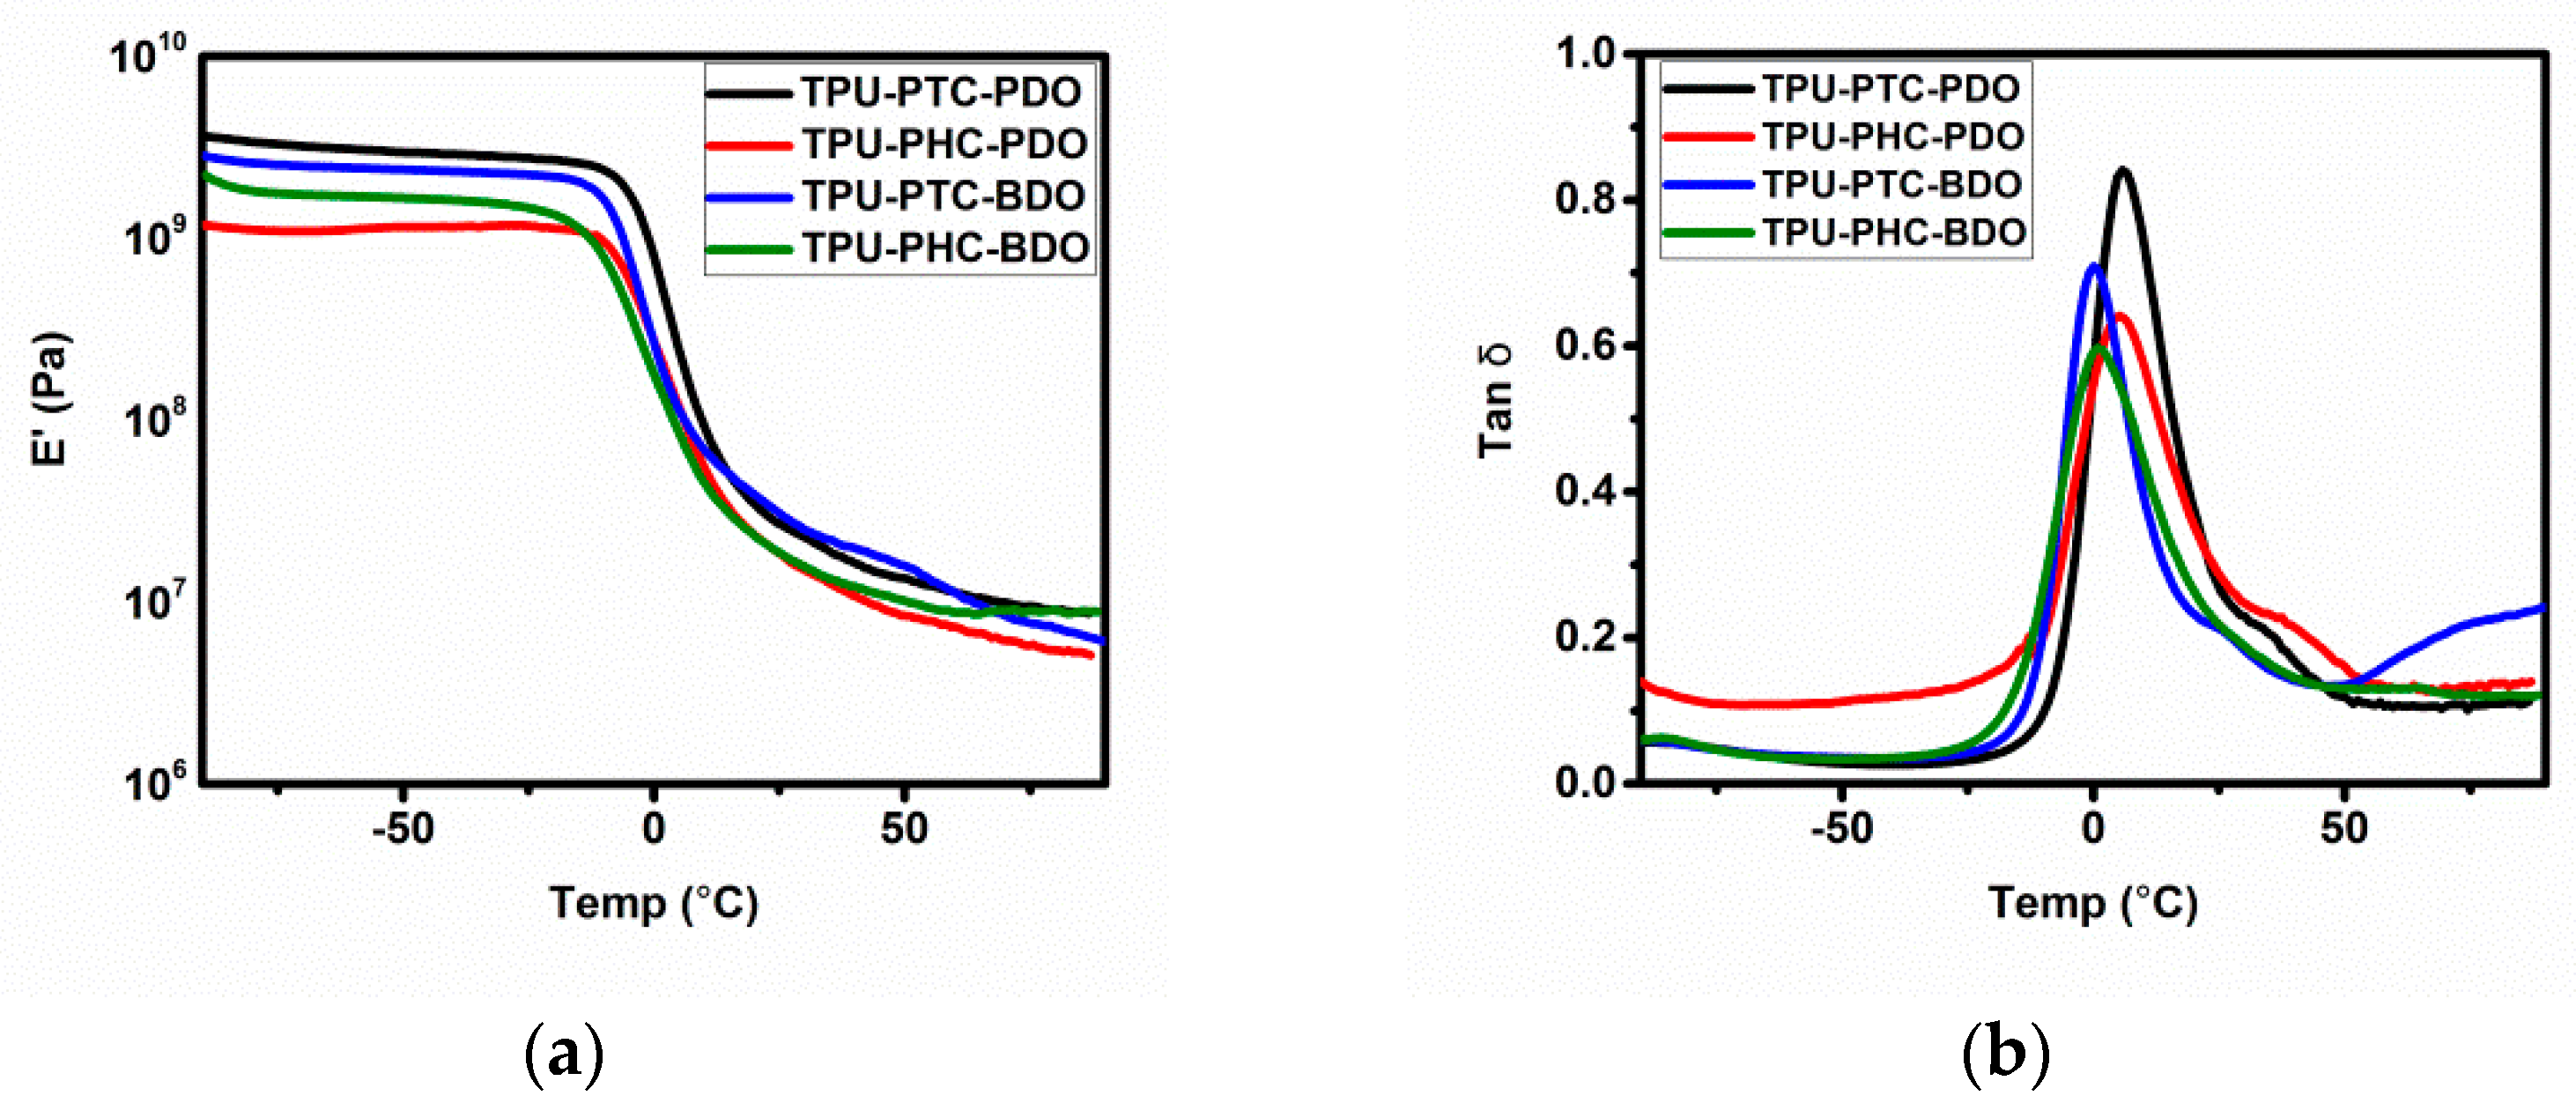
2.4.6. Dynamic Mechanical Analysis (DMA)
2.4.7. Tensile Testing Machine
2.4.8. Parallel-Plate Rheometer
3. Results and Discussion
3.1. FT-IR Structure Elucidation
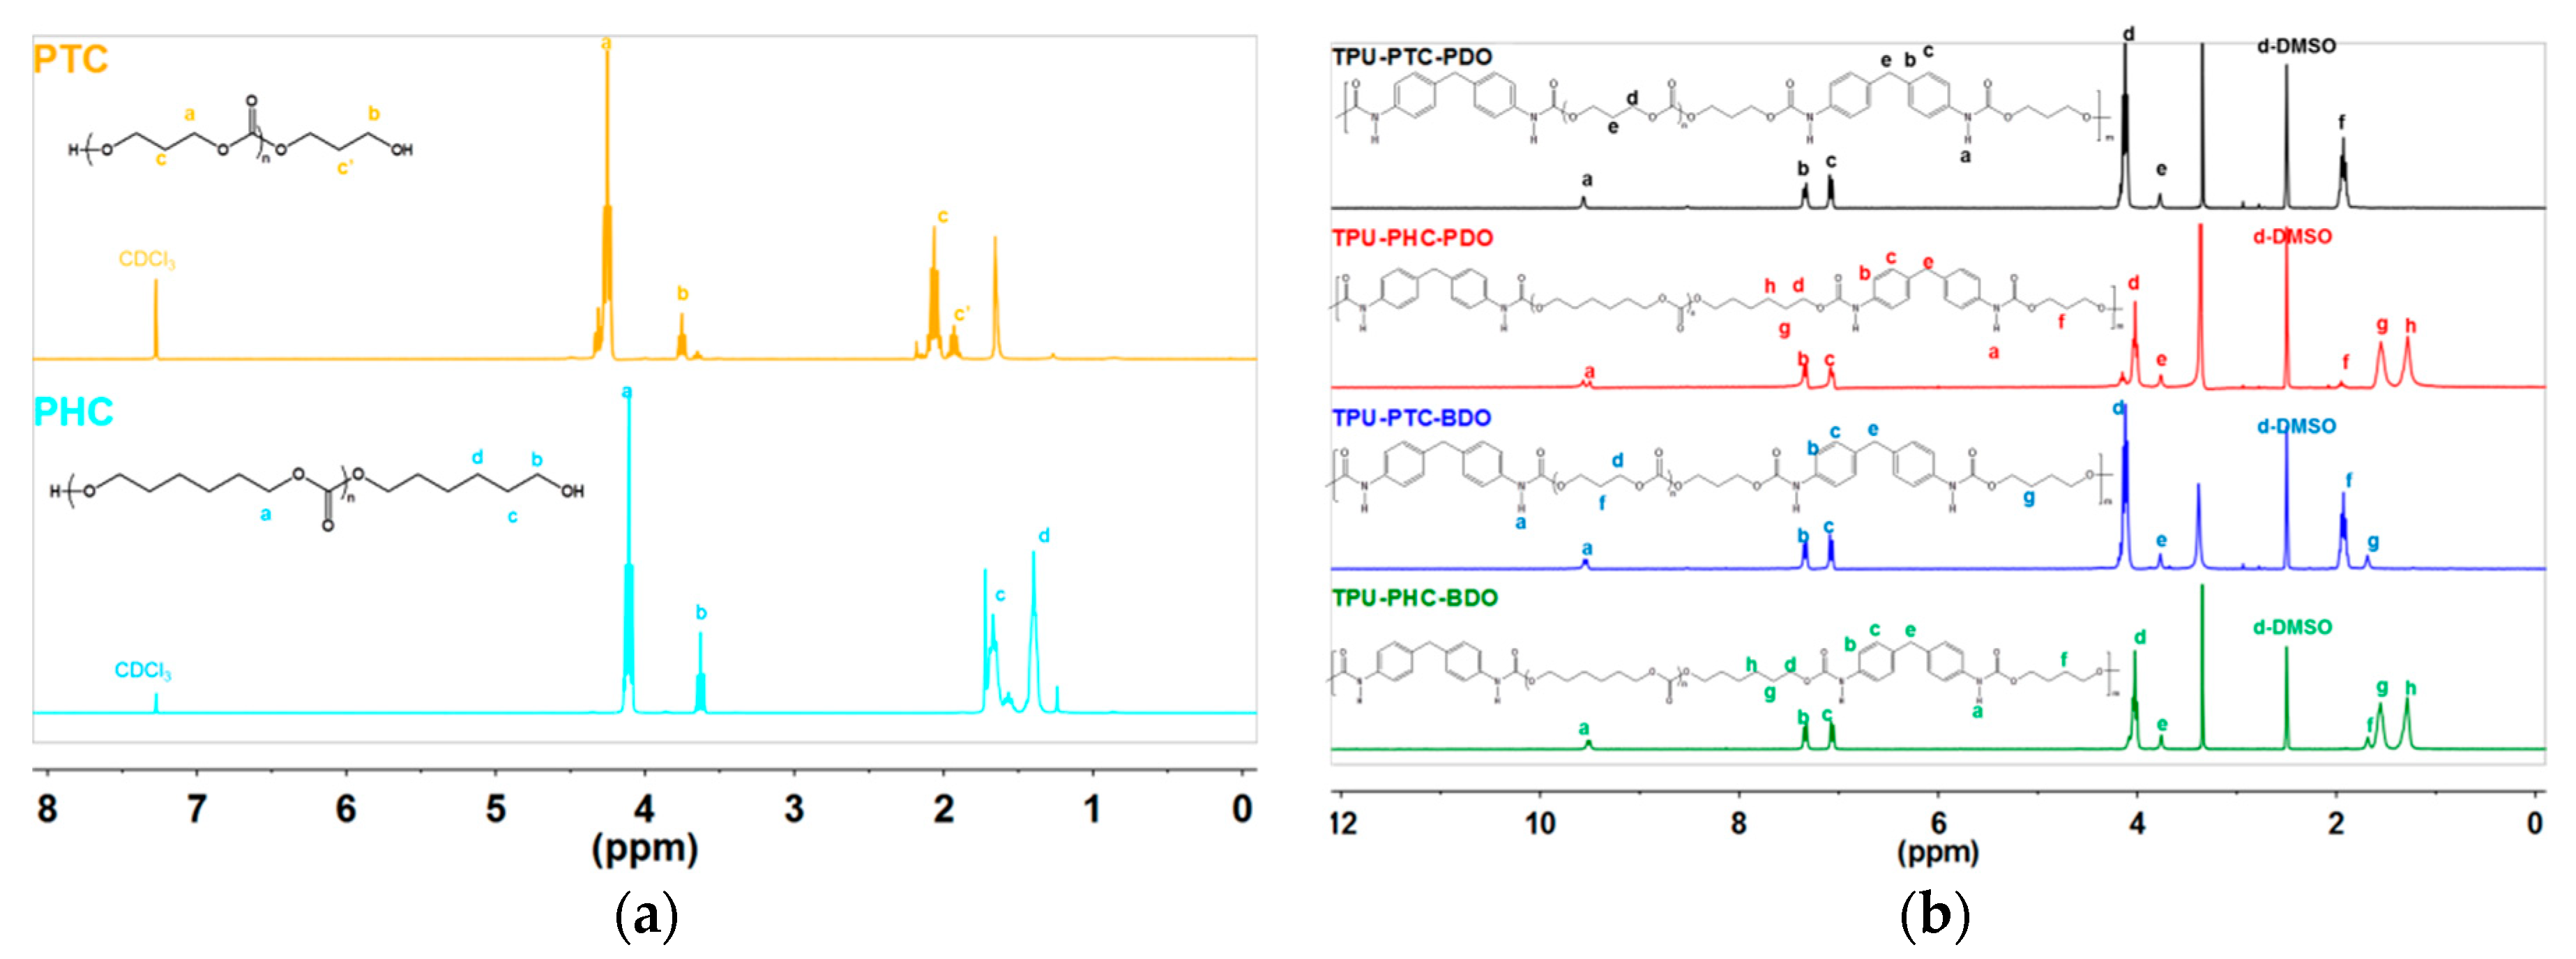
3.2. 1H NMR Resonance Structure Elucidation
3.3. Gel Permeation Chromatography Analysis
3.4. Decomposition Properties
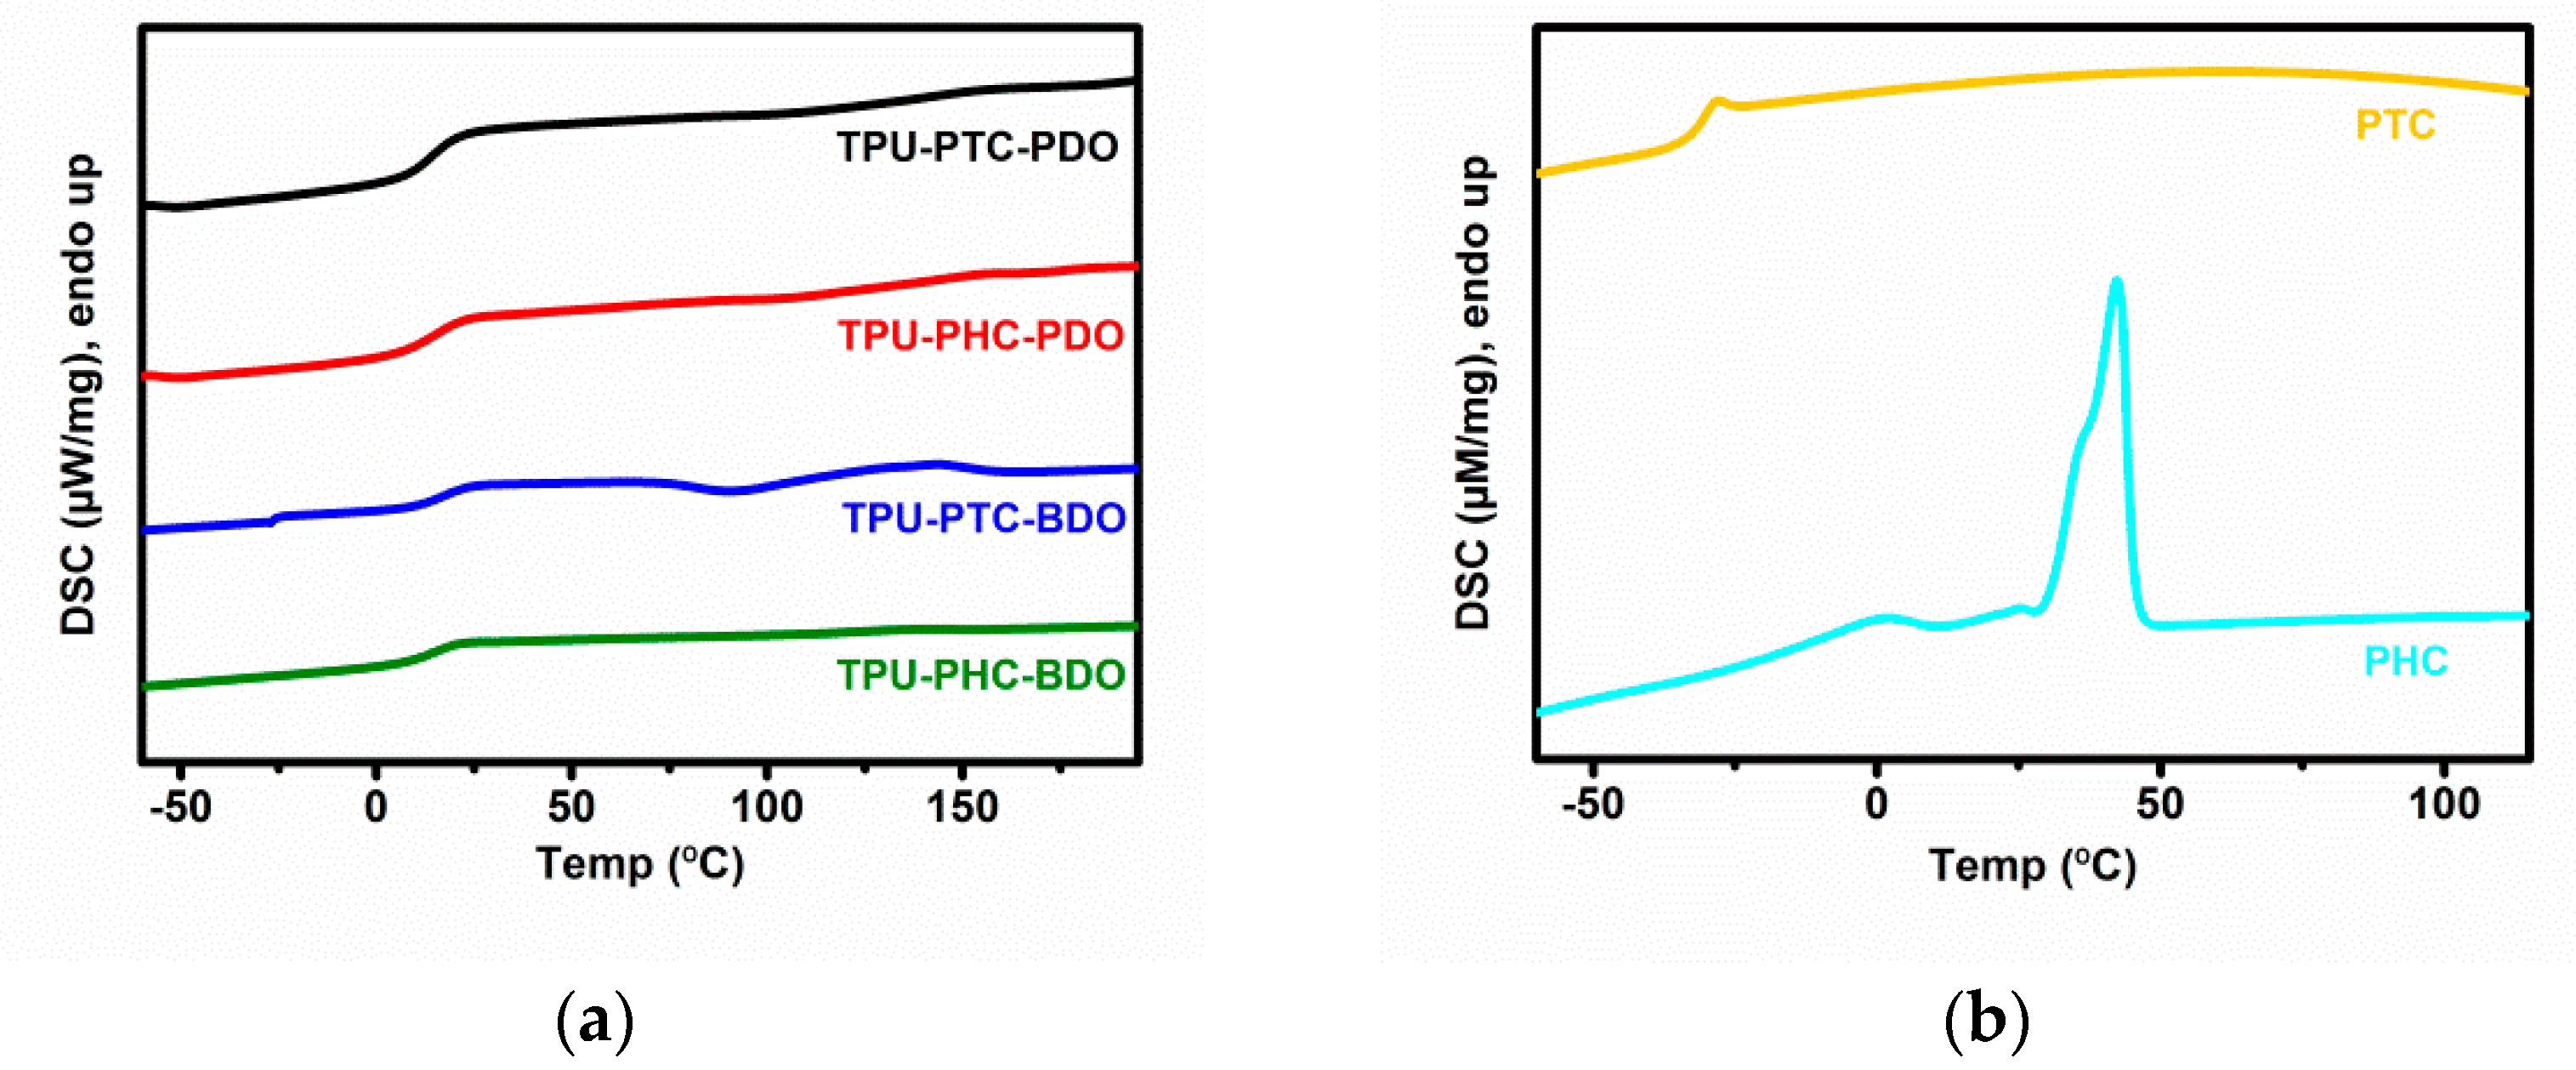
3.5. Phase Transition Regions
3.6. Tensile Strength
3.7. Rheology Testing of Complex Viscosity
4. Conclusions
Supplementary Materials
Author Contributions
Funding
Institutional Review Board Statement
Informed Consent Statement
Data Availability Statement
Conflicts of Interest
References
- Liang, H.; Liu, L.; Lu, J.; Chen, M.; Zhang, C. Castor Oil-Based Cationic Waterborne Polyurethane Dispersions: Storage Stability, Thermo-Physical Properties and Antibacterial Properties. Ind. Crop. Prod. 2018, 117, 169–178. [Google Scholar] [CrossRef]
- Feng, Z.; Wang, D.; Zheng, Y.; Zhao, L.; Xu, T.; Guo, Z.; Hussain, M.I.; Zeng, J.; Lou, L.; Sun, Y.; et al. A Novel Waterborne Polyurethane with Biodegradability and High Flexibility for 3D Printing. Biofabrication 2020, 12, 035015. [Google Scholar] [CrossRef] [PubMed]
- Liang, H.; Feng, Y.; Lu, J.; Liu, L.; Yang, Z.; Luo, Y.; Zhang, Y.; Zhang, C. Bio-Based Cationic Waterborne Polyurethanes Dispersions Prepared from Different Vegetable Oils. Ind. Crop. Prod. 2018, 122, 448–455. [Google Scholar] [CrossRef]
- Bullermann, J.; Friebel, S.; Salthammer, T.; Spohnholz, R. Novel Polyurethane Dispersions Based on Renewable Raw Materials—Stability Studies by Variations of DMPA Content and Degree of Neutralisation. Prog. Org. Coat. 2013, 76, 609–615. [Google Scholar] [CrossRef]
- Ji, X.; Wang, H.; Ma, X.; Hou, C.; Ma, G. Progress in Polydimethylsiloxane-Modified Waterborne Polyurethanes. RSC Adv. 2017, 7, 34086–34095. [Google Scholar] [CrossRef] [Green Version]
- Xiao, Y.; Fu, X.; Zhang, Y.; Liu, Z.; Jiang, L.; Lei, J. Preparation of Waterborne Polyurethanes Based on the Organic Solvent-Free Process. Green Chem. 2016, 18, 412–416. [Google Scholar] [CrossRef]
- Feng, Y.; Liang, H.; Yang, Z.; Yuan, T.; Luo, Y.; Li, P.; Yang, Z.; Zhang, C. A Solvent-Free and Scalable Method To Prepare Soybean-Oil-Based Polyols by Thiol–Ene Photo-Click Reaction and Biobased Polyurethanes Therefrom. ACS Sustain. Chem. Eng. 2017, 5, 7365–7373. [Google Scholar] [CrossRef]
- Lu, X.; Fang, C.; Sheng, X.; Zhang, L.; Qu, J. One-Step and Solvent-Free Synthesis of Polyethylene Glycol-Based Polyurethane As Solid–Solid Phase Change Materials for Solar Thermal Energy Storage. Ind. Eng. Chem. Res. 2019, 58, 3024–3032. [Google Scholar] [CrossRef]
- Nagy, L.; Nagy, T.; Kuki, Á.; Purgel, M.; Zsuga, M.; Kéki, S. Kinetics of Uncatalyzed Reactions of 2,4′- and 4,4′-Diphenylmethane-Diisocyanate with Primary and Secondary Alcohols. Int. J. Chem. Kinet. 2017, 49, 643–655. [Google Scholar] [CrossRef]
- Joshi, M.; Adak, B.; Butola, B.S. Polyurethane Nanocomposite Based Gas Barrier Films, Membranes and Coatings: A Review on Synthesis, Characterization and Potential Applications. Prog. Mater. Sci. 2018, 97, 230–282. [Google Scholar] [CrossRef]
- Zhang, L.; Huang, J. Effects of Hard-Segment Compositions on Properties of Polyurethane–Nitrolignin Films. J. Appl. Polym. Sci. 2001, 81, 3251–3259. [Google Scholar] [CrossRef]
- Petrović, Z.S.; Ferguson, J. Polyurethane Elastomers. Prog. Polym. Sci. 1991, 16, 695–836. [Google Scholar] [CrossRef]
- Kang, S.-Y.; Ji, Z.; Tseng, L.-F.; Turner, S.A.; Villanueva, D.A.; Johnson, R.; Albano, A.; Langer, R. Design and Synthesis of Waterborne Polyurethanes. Adv. Mater. 2018, 30, 1706237. [Google Scholar] [CrossRef] [PubMed]
- Wang, J.; Zhang, H.; Miao, Y.; Qiao, L.; Wang, X.; Wang, F. Waterborne Polyurethanes from CO 2 Based Polyols with Comprehensive Hydrolysis/Oxidation Resistance. Green Chem. 2016, 18, 524–530. [Google Scholar] [CrossRef]
- Chang, M.-T.; Lee, J.-Y.; Rwei, S.-P.; Wu, W.-Y.; Chiang, W.-Y.; Chang, S.-M.; Pan, Y.-H. Effects of NCO/OH Ratios and Polyols during Polymerization of Water-Based Polyurethanes on Polyurethane Modified Polylactide Fabrics. Fibers Polym. 2017, 18, 203–211. [Google Scholar] [CrossRef]
- Jofre-Reche, J.A.; Fuensanta, M.; Yáñez-Pacios, A.; Colera, M.; Rodriguez, F.; Iglesias, I.; Costa, V.; Martín-Martínez, J.M. Improvement in Adhesion, Abrasion Resistance, and Aging of Polyurethane Coatings Prepared with Polycarbonate Diol for Internal Pipelines. J. Mater. Civ. Eng. 2017, 29, 06017009. [Google Scholar] [CrossRef]
- Golling, F.E.; Pires, R.; Hecking, A.; Weikard, J.; Richter, F.; Danielmeier, K.; Dijkstra, D. Polyurethanes for Coatings and Adhesives—Chemistry and Applications. Polym. Int. 2019, 68, 848–855. [Google Scholar] [CrossRef]
- Zhang, H.; Chen, Y.; Zhang, Y.; Sun, X.; Ye, H.; Li, W. Synthesis and Characterization of Polyurethane Elastomers. J. Elastomers Plast. 2008, 40, 161–177. [Google Scholar] [CrossRef]
- Zhang, H.; Fang, W.-Z.; Li, Y.-M.; Tao, W.-Q. Experimental Study of the Thermal Conductivity of Polyurethane Foams. Appl. Therm. Eng. 2017, 115, 528–538. [Google Scholar] [CrossRef]
- Foks, J.; Janik, H.; Russo, R.; Winiecki, S. Morphology and Thermal Properties of Polyurethanes Prepared under Different Conditions. Eur. Polym. J. 1989, 25, 31–37. [Google Scholar] [CrossRef]
- Jiang, L.; Ren, Z.; Zhao, W.; Liu, W.; Liu, H.; Zhu, C. Synthesis and Structure/Properties Characterizations of Four Polyurethane Model Hard Segments. R. Soc. Open Sci. 2018, 5, 180536. [Google Scholar] [CrossRef] [Green Version]
- Brodin, A.; Jacobsson, P. Dipolar Interaction and Molecular Ordering in Liquid Propylene Carbonate: Anomalous Dielectric Susceptibility and Raman Non-Coincidence Effect. J. Mol. Liq. 2011, 164, 17–21. [Google Scholar] [CrossRef]
- Schneider, U.; Lunkenheimer, P.; Brand, R.; Loidl, A. Broadband Dielectric Spectroscopy on Glass-Forming Propylene Carbonate. Phys. Rev. E 1999, 59, 6924–6936. [Google Scholar] [CrossRef] [PubMed] [Green Version]
- DiCosimo, R.; Drysdale, N.E.; Sunkara, H.B. Process to Make Poly(Trimethylene Carbonate) Glycol. U.S. Patent 8252885, 28 August 2012. [Google Scholar]
- Mattia, J.; Painter, P. A Comparison of Hydrogen Bonding and Order in a Polyurethane and Poly(Urethane−urea) and Their Blends with Poly(Ethylene Glycol). Macromolecules 2007, 40, 1546–1554. [Google Scholar] [CrossRef]
- Kumagai, S.; Motokucho, S.; Yabuki, R.; Anzai, A.; Kameda, T.; Watanabe, A.; Nakatani, H.; Yoshioka, T. Effects of Hard- and Soft-Segment Composition on Pyrolysis Characteristics of MDI, BD, and PTMG-Based Polyurethane Elastomers. J. Anal. Appl. Pyrolysis 2017, 126, 337–345. [Google Scholar] [CrossRef]
- Lin, W.; Qu, J.-P. Enhancing Impact Toughness of Renewable Poly(Lactic Acid)/Thermoplastic Polyurethane Blends via Constructing Cocontinuous-like Phase Morphology Assisted by Ethylene–Methyl Acrylate–Glycidyl Methacrylate Copolymer. Ind. Eng. Chem. Res. 2019, 58, 10894–10907. [Google Scholar] [CrossRef]
- Tien, Y.I.; Wei, K.H. High-Tensile-Property Layered Silicates/Polyurethane Nanocomposites by Using Reactive Silicates as Pseudo Chain Extenders. Macromolecules 2001, 34, 9045–9052. [Google Scholar] [CrossRef]
- Velankar, S.; Cooper, S.L. Microphase Separation and Rheological Properties of Polyurethane Melts. 2. Effect of Block Incompatibility on the Microstructure. Macromolecules 2000, 33, 382–394. [Google Scholar] [CrossRef]
- Zhang, Y.; Liang, R.; Xu, J.; Shen, L.; Gao, J.; Wang, X.; Wang, N.; Shou, D.; Hu, Y. Efficient Induction of Antimicrobial Activity with Vancomycin Nanoparticle-Loaded Poly(Trimethylene Carbonate) Localized Drug Delivery System. Int. J. Nanomed. 2017, 12, 1201–1214. [Google Scholar] [CrossRef] [PubMed] [Green Version]
- Shen, Z.; Zhang, J.; Zhu, W.; Zheng, L.; Li, C.; Xiao, Y.; Liu, J.; Wu, S.; Zhang, B. A Solvent-Free Route to Non-Isocyanate Poly(Carbonate Urethane) with High Molecular Weight and Competitive Mechanical Properties. Eur. Polym. J. 2018, 107, 258–266. [Google Scholar] [CrossRef]
- Niemczyk, A.; Piegat, A.; Sonseca Olalla, Á.; El Fray, M. New Approach to Evaluate Microphase Separation in Segmented Polyurethanes Containing Carbonate Macrodiol. Eur. Polym. J. 2017, 93, 182–191. [Google Scholar] [CrossRef]
- Jofre-Reche, J.A.; García-Pacios, V.; Costa, V.; Colera, M.; Martín-Martínez, J.M. Role of the Interactions between Carbonate Groups on the Phase Separation and Properties of Waterborne Polyurethane Dispersions Prepared with Copolymers of Polycarbonate Diol. Prog. Org. Coat. 2015, 88, 199–211. [Google Scholar] [CrossRef]
- Fuensanta, M.; Jofre-Reche, J.A.; Rodríguez-Llansola, F.; Costa, V.; Iglesias, J.I.; Martín-Martínez, J.M. Structural Characterization of Polyurethane Ureas and Waterborne Polyurethane Urea Dispersions Made with Mixtures of Polyester Polyol and Polycarbonate Diol. Prog. Org. Coat. 2017, 112, 141–152. [Google Scholar] [CrossRef]
- Yilgor, I.; Yilgor, E. Structure-Morphology-Property Behavior of Segmented Thermoplastic Polyurethanes and Polyureas Prepared without Chain Extenders. Polym. Rev. 2007, 47, 487–510. [Google Scholar] [CrossRef]
- Bao, J.; Shi, G.; Tao, C.; Wang, C.; Zhu, C.; Cheng, L.; Qian, G.; Chen, C. Polycarbonate-Based Polyurethane as a Polymer Electrolyte Matrix for All-Solid-State Lithium Batteries. J. Power Sources 2018, 389, 84–92. [Google Scholar] [CrossRef] [Green Version]
- Hyun, H.; Kim, M.S.; Khang, G.; Lee, H.B. Ring-Opening Polymerization of Trimethylene Carbonate by Poly(Ethylene Glycol) in the Presence of HCl·Et2O as a Monomer Activator. J. Polym. Sci. Part A Polym. Chem. 2006, 44, 4235–4241. [Google Scholar] [CrossRef]
- Feula, A.; Tang, X.; Giannakopoulos, I.; Chippindale, A.M.; Hamley, I.W.; Greco, F.; Buckley, C.P.; Siviour, C.R.; Hayes, W. An Adhesive Elastomeric Supramolecular Polyurethane Healable at Body Temperature. Chem. Sci. 2016, 7, 4291–4300. [Google Scholar] [CrossRef] [PubMed] [Green Version]
- Kuran, W.; Sobczak, M.; Listos, T.; Debek, C.; Florjanczyk, Z. New Route to Oligocarbonate Diols Suitable for the Synthesis of Polyurethane Elastomers. Polymer 2000, 41, 8531–8541. [Google Scholar] [CrossRef]
- García-Pacios, V.; Iwata, Y.; Colera, M.; Miguel Martín-Martínez, J. Influence of the Solids Content on the Properties of Waterborne Polyurethane Dispersions Obtained with Polycarbonate of Hexanediol. Int. J. Adhes. Adhes. 2011, 31, 787–794. [Google Scholar] [CrossRef]
- Orgilέs-Calpena, E.; Arán-Aís, F.; Torró-Palau, A.M.; Orgilέs-Barceló, C. Sustainable Polyurethane Adhesives Derived from Carbon Dioxide. Polym. Renew. Resour. 2016, 7, 1–12. [Google Scholar] [CrossRef]
- Ma, L.; Song, L.; Wang, H.; Fan, L.; Liu, B. Synthesis and Characterization of Poly(Propylene Carbonate) Glycol-Based Waterborne Polyurethane with a High Solid Content. Prog. Org. Coat. 2018, 122, 38–44. [Google Scholar] [CrossRef]
- Cipriani, E.; Zanetti, M.; Brunella, V.; Costa, L.; Bracco, P. Thermoplastic Polyurethanes with Polycarbonate Soft Phase: Effect of Thermal Treatment on Phase Morphology. Polym. Degrad. Stab. 2012, 97, 1794–1800. [Google Scholar] [CrossRef]
- Hesketh, T.R.; Bogart, J.W.C.V.; Cooper, S.L. Differential Scanning Calorimetry Analysis of Morphological Changes in Segmented Elastomers. Polym. Eng. Sci. 1980, 20, 190–197. [Google Scholar] [CrossRef]
- Lin, M.-F.; Shu, Y.-C.; Tsen, W.-C.; Chuang, F.-S. Differential Scanning Calorimetry Analysis of Silicon-Containing and Phosphorus-Containing Segmented Polyurethane. I—Thermal Behaviors and Morphology. J. Appl. Polym. Sci. 2001, 81, 3489–3501. [Google Scholar] [CrossRef]
- Shu, Y.-C.; Lin, M.-F.; Tsen, W.-C.; Chuang, F.-S. Differential Scanning Calorimetry Analysis of Silicon-Containing and Phosphorus-Containing Segmented Polyurethane. II Annealing Effect. J. Appl. Polym. Sci. 2001, 81, 3502–3513. [Google Scholar] [CrossRef]
- Ma, Z.; Hong, Y.; Nelson, D.M.; Pichamuthu, J.E.; Leeson, C.E.; Wagner, W.R. Biodegradable Polyurethane Ureas with Variable Polyester or Polycarbonate Soft Segments: Effects of Crystallinity, Molecular Weight, and Composition on Mechanical Properties. Biomacromolecules 2011, 12, 3265–3274. [Google Scholar] [CrossRef] [Green Version]
- Andronova, N.; Albertsson, A.-C. Resilient Bioresorbable Copolymers Based on Trimethylene Carbonate, l-Lactide, and 1,5-Dioxepan-2-One. Biomacromolecules 2006, 7, 1489–1495. [Google Scholar] [CrossRef]
- Eckstein, A.; Suhm, J.; Friedrich, C.; Maier, R.-D.; Sassmannshausen, J.; Bochmann, M.; Mülhaupt, R. Determination of Plateau Moduli and Entanglement Molecular Weights of Isotactic, Syndiotactic, and Atactic Polypropylenes Synthesized with Metallocene Catalysts. Macromolecules 1998, 31, 1335–1340. [Google Scholar] [CrossRef]
- Kim, B.K.; Lee, S.Y.; Xu, M. Polyurethanes Having Shape Memory Effects. Polymer 1996, 37, 5781–5793. [Google Scholar] [CrossRef]
- Li, Y.; Chen, J.; Cai, P.; Wen, Z. An Electrochemically Neutralized Energy-Assisted Low-Cost Acid-Alkaline Electrolyzer for Energy-Saving Electrolysis Hydrogen Generation. J. Mater. Chem. A 2018, 6, 4948–4954. [Google Scholar] [CrossRef]
- Wang, F.; Chen, S.; Wu, Q.; Zhang, R.; Sun, P. Strain-Induced Structural and Dynamic Changes in Segmented Polyurethane Elastomers. Polymer 2019, 163, 154–161. [Google Scholar] [CrossRef]
- Christenson, E.M.; Anderson, J.M.; Hiltner, A.; Baer, E. Relationship between Nanoscale Deformation Processes and Elastic Behavior of Polyurethane Elastomers. Polymer 2005, 46, 11744–11754. [Google Scholar] [CrossRef]
- Cui, X.; Li, W.; Yan, D. Investigation on Odd-Odd Nylons Based on Undecanedioic Acid: 1. Synthesis and Characterization. Polym. Int. 2004, 53, 1729–1734. [Google Scholar] [CrossRef]
- Cui, X.; Liu, Z.; Yan, D. Synthesis and Characterization of Novel Even–Odd Nylons Based on Undecanedioic Acid. Eur. Polym. J. 2004, 40, 1111–1118. [Google Scholar] [CrossRef]


| TPU-X-Y | Mole Ratio = [A]:[B]:[C] a |
|---|---|
| TPU-PTC-BDO | 2:1:1 |
| TPU-PHC-BDO | 2:1:1 |
| TPU-PTC-PDO | 2:1:1 |
| TPU-PHC-PDO | 2:1:1 |
| TPU-X-Y | 1740 cm−1 Intensity (%) | 1700 cm−1 Intensity (%) |
|---|---|---|
| TPU-PTC-PDO | 67.5 | 32.5 |
| TPU-PHC-PDO | 47.2 | 52.8 |
| TPU-PTC-BDO | 73.5 | 26.5 |
| TPU-PHC-BDO | 54.2 | 45.8 |
| TPU-X-Y | Mn (g/mole) | Mw (g/mole) | PDI |
|---|---|---|---|
| TPU-PTC-BDO | 77,000 | 137,000 | 1.78 |
| TPU-PHC-BDO | 75,000 | 139,000 | 1.85 |
| TPU-PTC-PDO | 120,000 | 226,000 | 1.88 |
| TPU-PHC-PDO | 107,000 | 204,000 | 1.91 |
| Polyol or TPU-X-Y | Tdi a (°C) | Td 5wt% b (°C) | Tmax c (°C) | Ts1 d (°C) | Ts2 d (°C) |
|---|---|---|---|---|---|
| PTC | 182.2 | 212.0 | 251.7 | - | - |
| PHC | 205.0 | 242.0 | 367.1 | - | - |
| TPU-PTC-PDO | 224.3 | 243.5 | 263.9 | 322.8 | 438.8 |
| TPU-PHC-PDO | 260.5 | 293.5 | 350.8 | 444.8 | - |
| TPU-PTC-BDO | 247.7 | 270.4 | 298.1 | 344.5 | 441.0 |
| TPU-PHC-BDO | 261.8 | 294.1 | 343.9 | 448.3 | - |
| TPU-X-Y | Tgs (°C) |
|---|---|
| TPU-PTC-PDO | 5.73 |
| TPU-PHC-PDO | 5.15 |
| TPU-PTC-BDO | 1.08 |
| TPU-PHC-BDO | 0.81 |
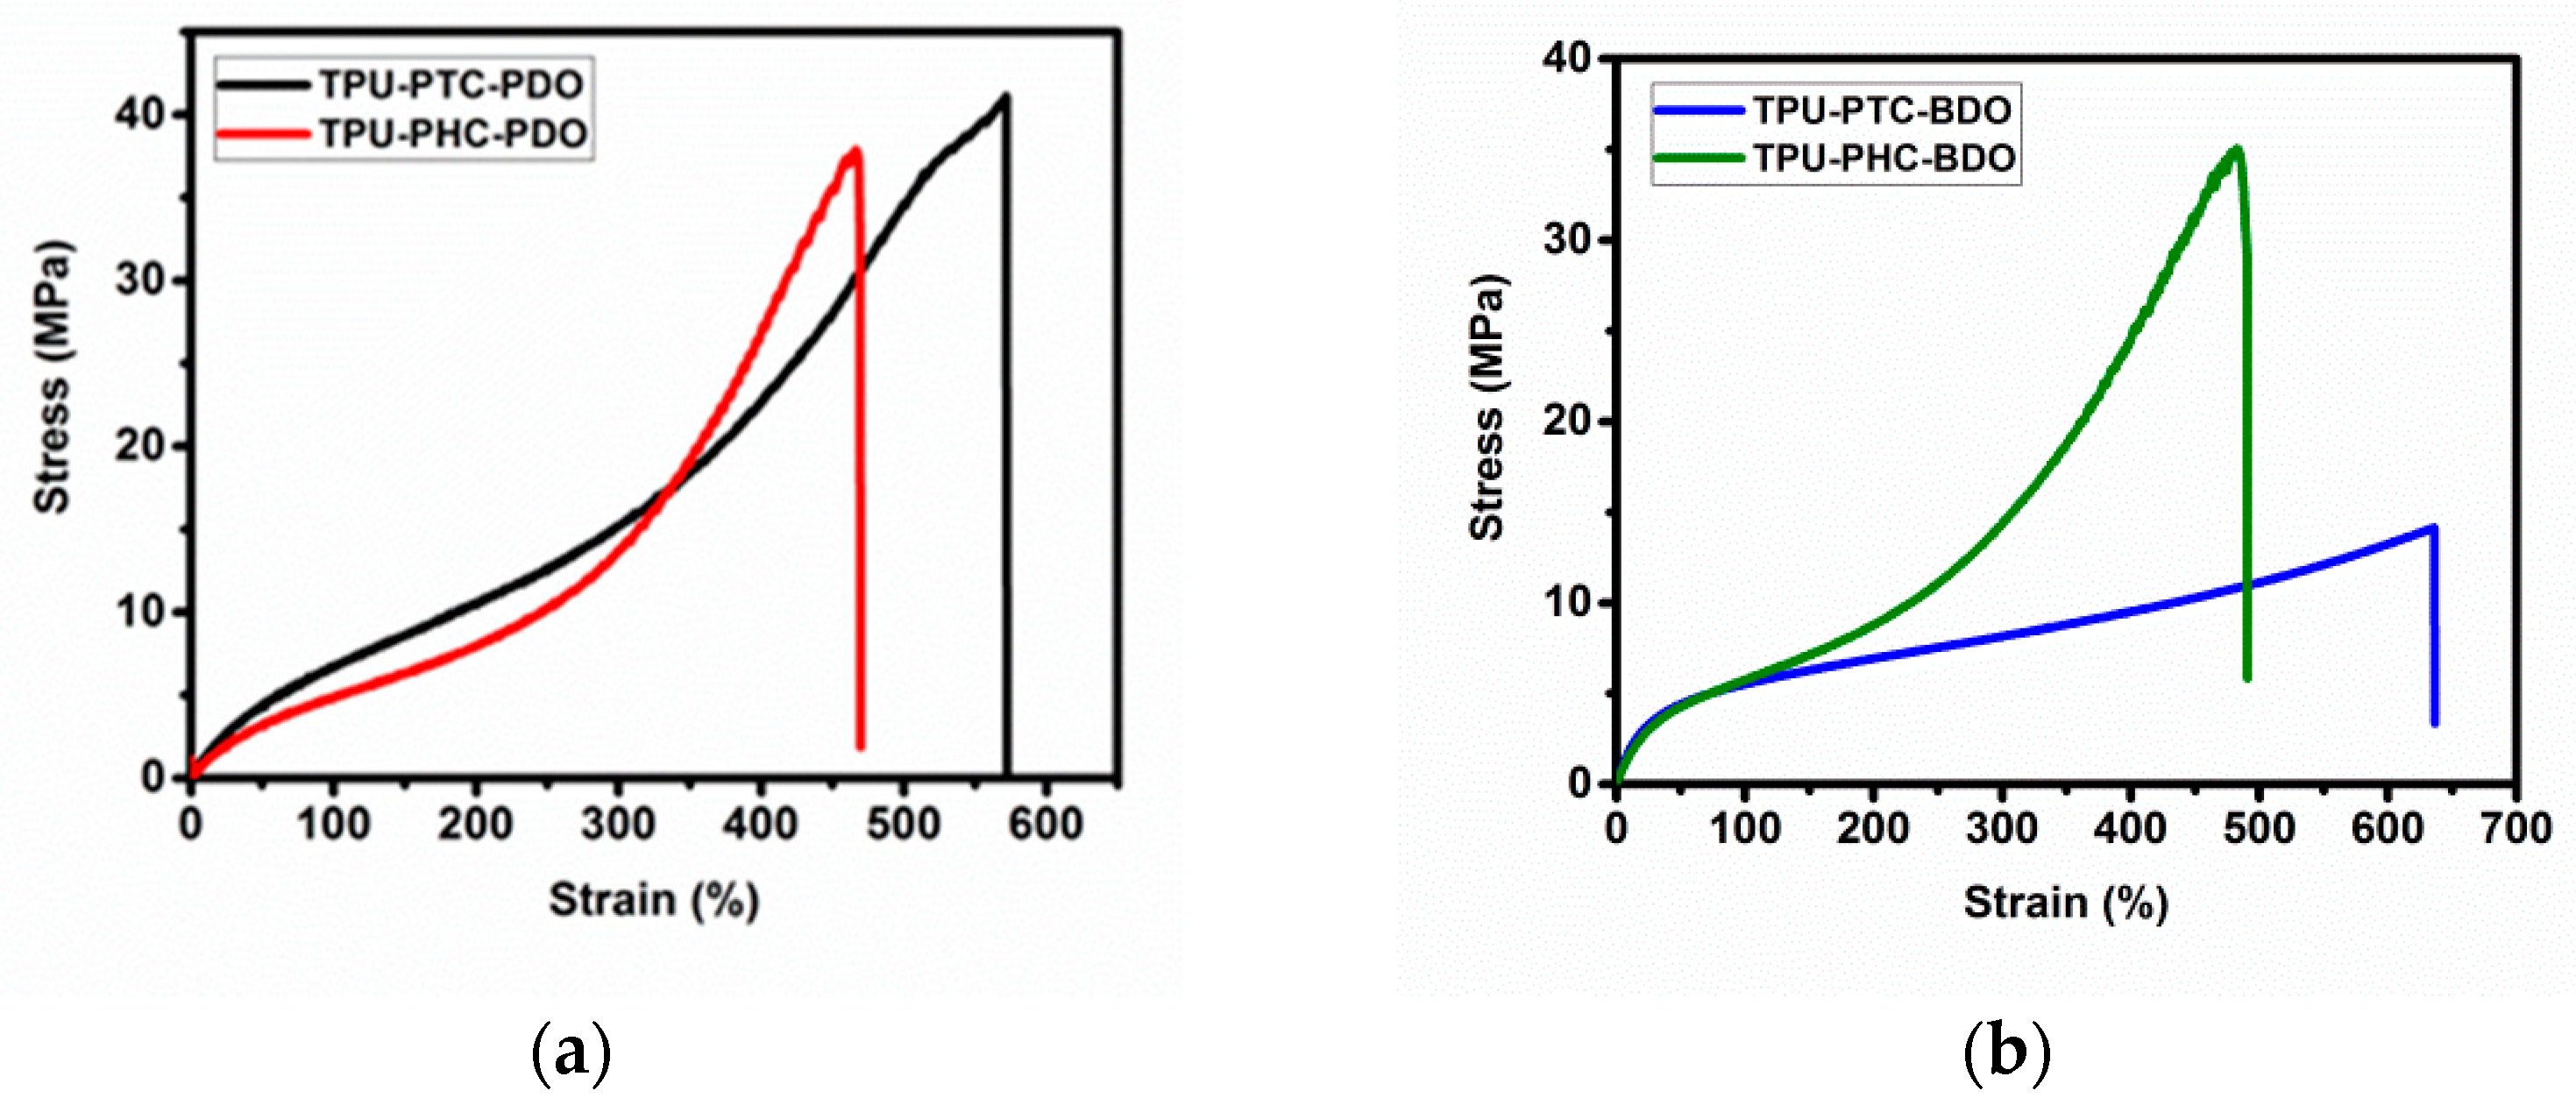
| TPU-X-Y | Elongation at Break (%) | Modulus at 100% Deformation (MPa) | Modulus at 300% Deformation (MPa) | Tensile Strength (MPa) |
|---|---|---|---|---|
| TPU-PTC-PDO | 571.6 ± 27.2 | 6.73 ± 0.12 | 15.18 ± 0.19 | 41.1 ± 10.8 |
| TPU-PHC-PDO | 466.6 ± 11.8 | 4.92 ± 0.03 | 13.68 ± 0.03 | 37.9 ± 16.9 |
| TPU-PTC-BDO | 613.3 ± 25.5 | 5.62 ± 0.07 | 8.19 ± 0.03 | 13.4 ± 0.8 |
| TPU-PHC-BDO | 482.2 ± 21.7 | 5.86 ± 0.18 | 14.30 ± 0.27 | 37.9 ± 10.8 |
| TPU-X-Y | Tdi (°C) | Tensile Strength (MPa) | Complex Viscosity (Pa·s) at 180 °C at 1 rad/s |
|---|---|---|---|
| TPU-PTC-PDO | 224.3 | 41.1 ± 10.8 | 2.51 × 10³ |
| TPU-PHC-PDO | 260.5 | 37.9 ± 16.9 | 1.45 × 10⁴ |
| TPU-PTC-BDO | 247.7 | 13.4 ± 0.8 | 1.49 × 10³ |
| TPU-PHC-BDO | 261.8 | 37.9 ± 10.8 | 1.24 × 10⁴ |
Publisher’s Note: MDPI stays neutral with regard to jurisdictional claims in published maps and institutional affiliations. |
© 2021 by the authors. Licensee MDPI, Basel, Switzerland. This article is an open access article distributed under the terms and conditions of the Creative Commons Attribution (CC BY) license (https://creativecommons.org/licenses/by/4.0/).
Share and Cite
Wu, C.-H.; Chen, C.-W.; Chen, P.-H.; Chen, Y.-S.; Chuan, F.-S.; Rwei, S.-P. Characteristics of Polycarbonate Soft Segment-Based Thermoplastic Polyurethane. Appl. Sci. 2021, 11, 5359. https://doi.org/10.3390/app11125359
Wu C-H, Chen C-W, Chen P-H, Chen Y-S, Chuan F-S, Rwei S-P. Characteristics of Polycarbonate Soft Segment-Based Thermoplastic Polyurethane. Applied Sciences. 2021; 11(12):5359. https://doi.org/10.3390/app11125359
Chicago/Turabian StyleWu, Chien-Hui, Chin-Wen Chen, Po-Han Chen, Yi-Shin Chen, Fu-Sheng Chuan, and Syang-Peng Rwei. 2021. "Characteristics of Polycarbonate Soft Segment-Based Thermoplastic Polyurethane" Applied Sciences 11, no. 12: 5359. https://doi.org/10.3390/app11125359