Article

Spherical Polydopamine-Modified Carbon-Felt Cathode with an Active Indole Structure for Efficient Hydrogen Peroxide Electroproduction

1
Tianjin Key Lab Composite & Functional Materials, School of Materials Science and Engineering, Tianjin University, Tianjin 300350, China
2
State Key Laboratory for Chemical Engineering, School of Chemical Engineering and Technology, Tianjin University, Tianjin 300350, China
3
Key Laboratory of Fluid, Power Machinery Ministry of Education, Xihua University, Chengdu 610039, China
*
Author to whom correspondence should be addressed.
Appl. Sci. 2021, 11(12), 5371; https://doi.org/10.3390/app11125371
Submission received: 8 May 2021 / Revised: 29 May 2021 / Accepted: 1 June 2021 / Published: 9 June 2021

Abstract

:
As one of the most promising methods for H2O2 production, H2O2 electroproduction has received increasingly more attention. In this study, a spherical particle polydopamine (pDA) modified carbon felt (noted as ht-pDA/ACF) for H2O2 production was fabricated. At a constant potential of 2.0 V and pH of 1.0, the H2O2 production of the ht-pDA/ACF cathode reached 220 mg/L after 6 h of electrolyzing, compared to the 30 mg/L H2O2 production of raw carbon felt. Firstly, the spherical pDA exposes more active sites that are favorable to the 2e ORR compared to pDA film. Secondly, the ring cleavage and re-cyclization of indole structure in the pDA during electrolyzing could form the radicals that act as the intermediate to the H2O2 formation. This research exhibits a low-cost method to modify carbon materials for effective H2O2 electroproduction. The ht-pDA/ACF cathode is promising for green H2O2 production and wastewater treatment.

1. Introduction

Hydrogen peroxide (H2O2), a valuable environmentally friendly and clean oxidant that emits only water as a byproduct, has received increasing demands in the areas of chemical synthesis, pulp bleaching, pharmaceutical industry, wastewater treatment and so on [1]. Currently, most H2O2 in the world is produced indirectly via the anthraquinone auto-oxidation process (AOP) with Pd catalysts, which has high H2O2 yield and efficiency but still suffers from a complicated multistep reaction process, large consumption of organic solvents, high energy demands and the generation of organic byproduct waste [2]. Furthermore, the transport, storage and handling of concentrated H2O2 cause an extra safety risk, making the in situ H2O2 synthesis highly desirable. Thus, an efficient and inexpensive in situ green H2O2 synthesis route is urgently needed to overcome the disadvantages of AOP. Nowadays, the attractive alternatives are H2O2 direct synthesis from H2 and O2 [3] and H2O2 electroproduction through an oxygen reduction reaction (ORR) [4]. However, the contact of H2 and O2 during the H2O2 direct synthesis process has the potential risk of explosion over a wide composition range (5-95 vol%) and hinders the practical application [4]. Hence, the H2O2 electrosynthesis through the 2e ORR becomes the most promising approach, since it can simultaneously achieve efficient and safe H2O2 production under mild conditions. Furthermore, the H2O2 produced in acid electrolyte with a specific pH and concentration could be directly used in many industry applications for water treatment and pulp bleaching, which leads to more favorable H2O2 electroproduction.
Generally, the ORR involves a multielectron transfer process in which O2 can be reduced to produce H2O via the four-electron (4e) pathway (Equations (1) and (2)) or to form H2O2 via the two-electron (2e) pathway (Equations (3) and (4)) [5]. The final product of the 4e pathway ORR is H2O, which is undesirable for H2O2 production. Moreover, the sluggish kinetics and high overpotential for the 2e ORR severely impede the energy efficiency of H2O2 electrosynthesis. Therefore, it is necessary to develop a catalyst with high selectivity and activity toward the 2e ORR [6].
O 2 + 2 H 2 O + 4 e 4 O H ( a l k a l i n e ) ,     E ° = 0.4   V
O 2 + 4 H + + 4 e 4 H 2 O ( a c i d ) ,     E ° = 1.23   V
O 2 + H 2 O + 2 e O H + H O 2 ( a l k a l i n e ) ,     E ° = 0.06   V
O 2 + 2 H + + 2 e H 2 O 2 ( a c i d ) ,     E ° = 0.7   V
Many scientists and researchers have made efforts to find the proper catalyst. To date, the most efficient catalysts for the 2e ORR are noble-metal-based materials (e.g., Pd-Au [7], Pt-Hg [8] and Pd-Hg [9]), which require a small overpotential and possess high H2O2 selectivity (up to 98%). However, the scarcity of noble metals significantly raises the costs and limits the large-scale application. Carbon-based materials, because of their high earth abundance, electronic conductivity and chemical stability, have shown great prospect as candidates for H2O2 electrosynthesis. Moreover, the activity and selectivity of carbon-based materials can be improved by adjusting the electronic and geometric structures, such as introducing nanomaterials (e.g., graphene [10], carbon nanotube [11] and carbon nitride [12]) and doping heteroatoms (e.g., O [13], N [14], S [15], etc.). However, such modifications usually suffer from complicated procedures or harsh pH condition, and thus, impede the intensive application to produce H2O2. Therefore, there are more spaces for the improvement of highly efficient catalytic materials for H2O2 production.
Here, we proposed a way to fabricate a spherical morphology polydopamine (pDA) modified carbon felt via the hydrothermal process (noted as ht-pDA/ACF). The ht-pDA/ACF cathode exhibited high electrocatalytic activity and further H2O2 production via the two-electron ORR in acid electrolyte. The results showed that the indole structure of ht-pDA/ACF played an important role in H2O2 production during the electrolysis. This research will provide a new way to prepare carbon-based electrocatalyst for H2O2 production in acid condition, which has potential applications in the industry.

2. Experiment

2.1. Materials and Reagents

All chemicals in this study were of analytical grade and used as received. Sulfuric acid (anhydrous, ≥99.9%) were purchased from Yuanli Chemical Co., Ltd. (Tianjin, China). Dopamine was supplied by Bomei Biotechnology Co., Ltd. (Hefei, China). All water in the experiment was deionized water. Carbon felt (CF, spectral purity) was offered by HI-TECH Graphite Company (Tianjin, China). Oxygen (≥99%) was supplied by acorn Electronic Technology Co., Ltd. (Zhuhai, China).

2.2. Preparation of ht-pDA/ACF and ao-pDA/ACF

The modification of dopamine to CF was shown in Figure 1. Firstly, CF was cleaned carefully by immersing it into concentrated HNO3 for 6 h and washed with water and ethanol several times to get acid-treated carbon felt (ACF). For preparing dopamine modified CF by hydrothermal process (noted as ht-pDA/ACF), typically, 70 mg dopamine is dissolved in 10 mL water at first. Next, CF (1 cm × 1 cm) was immersed in the solution and then stirred and sonicated for 10 min each to form a homogeneous system. The solution and ACF were transferred into a Teflon autoclave and heated at 180 °C for 6 h. After cooling down to room temperature, the ht-pDA/ACF was washed with water and dried at 60 °C in an oven overnight.
For comparison, we also prepared dopamine modified CF by air autoxidation (noted as ao-pDA/ACF). After dissolving 70 mg dopamine in 10mL water, ACF was immersed in the solution and then stirred for 6 h. The ao-pDA/ACF was also washed with water and dried at 60 °C in an oven overnight.

2.3. Electrocatalytic ORR for H2O2 Synthesis at the ht-pDA/ACF Cathode

Electrochemical measurements were performed and recorded by an electrochemical workstation (Autolab PGSTAT302N) at the ambient atmosphere. Cyclic voltammetry (CV) was measured in O2-saturated electrolytes with 0.05 M H2SO4 (pH = 1) at different rates in a three-electrode cell system. The ht-pDA/ACF, a platinum plate (1 cm × 1 cm) and an Ag/AgCl electrode were used as the working, counter and reference electrodes, respectively. The direction of scan was from 1.0 V to 0 V vs. Ag/AgCl.
The H2O2 yield on the ht-pDA/ACF cathode was measured by potentiostatic electrolysis under a two-electrode system in a single-compartment cell. The working electrode and counter electrode were the same as those of CV. The electrolyte was 15 mL of H2SO4 solution (pH = 1), and O2 was purged for at least 30 min before electrolysis. The voltage of electrolysis was 2.0 V and O2 was continuously supplied until the end of the reaction. At a certain time interval, 20 μL of the electrolyte solution was taken out for testing the H2O2 concentration. The H2O2 concentration was measured on a TU-1901 ultraviolet-visible (UV-visible) spectroscope at 275 nm by the traditional Ce(SO4)2 titration method. The basic principle is that the yellow Ce4+ solution will be reduced by H2O2 to colorless Ce3+ (2Ce4+ + H2O2→2Ce3+ + 2H+ + O2). Thus, the change of Ce4+ concentration can be measured, and the H2O2 production can be calculated.

2.4. Characterization

Surface morphology was characterized by a Hitachi S4800 scanning electron microscope (SEM). Surface functional groups were analyzed by a Tensor-27 Fourier transform infrared spectrometer (FTIR). Raman spectrum analysis was carried out by a HORIBA LabRAM HR evolution spectrometer. Chemical bonding states of carbon (C), oxygen (O) and nitrogen (N) were studied by X-ray photoelectron spectroscopy (XPS) with an ESCALAB-250Xi spectrometer. Contact angles were measured by a JGW-360A contact angle meter.

3. Results and Discussion

3.1. Cyclic Voltammetry Test

To evaluate the electrochemical activity and selectivity of ht-pDA/ACF, CV was firstly tested in an undivided cell from 0 V vs. Ag/AgCl to 1.0 V vs. Ag/AgCl. The CV curves of CF, acid-treated CF and ht-pDA/ACF at a scan rate of 10 mV/s are shown in Figure 2a. As we can see, the responding current is obviously enhanced after dopamine modifying, from 0.13 μA to 4.2 μA, suggesting an improvement of electrocatalytic activity for ht-pDA/ACF. Moreover, a pair of redox peaks appear on the curve of acid-treated CF at the 0.52 V vs. Ag/AgCl and 0.37 V vs. Ag/AgCl (Figure 2a, the red line 2), while the line of raw CF shows no obvious peak (Figure 2a, the black line 1). Similarly, the CV curve of ht-pDA/ACF shows a couple of well-defined peaks at 0.35 V vs. Ag/AgCl and 0.62 V vs. Ag/AgCl (Figure 2a, the blue line 3), which could be attributed to the 2e ORR and its reverse reaction occurred on the surface of the ht-pDA/ACF cathode [16]. Additionally, the covered areas and the 2e ORR peak current of CV curves of CF, ACF and ht-pDA/ACF cathode gradually increase, indicating the increasing electrons and mass transferability in the reaction [17]. The results prove that the activity of the ht-pDA/ACF cathode for the 2e ORR significant improved compared with raw CF and acid-treated CF, implying that ht-pDA/ACF could be a promising alternative for the 2e ORR and that pDA plays an important role during the reaction.
We also investigated the change of CV curves of the ht-pDA/ACF cathode at different scan rates, as shown in Figure 2b. The CV curve of the ht-pDA/ACF cathode at a scan rate of 1 mV/s shows two indistinctive reductive peaks with similar intensity at 0.38V vs. Ag/AgCl and 0.44V vs. Ag/AgCl (Figure 2b, the black line 4), which represent the 4e ORR and 2e ORR, respectively [16,18]. As the scan rate rises to 5 mV/s (Figure 2b, the red line 5), both peaks become more negative, which is due to the reaction polarization effect at a higher scan rate, and the intensity of the peak at 0.41 V vs. Ag/AgCl for H2O2 production is obviously stronger than that at 0.26 V vs. Ag/AgCl for the 4e ORR. Moreover, the peak that originated from the 4e ORR disappears when the scan rate reaches 10 mV/s (Figure 2b, the blue line 6), whereas the peak attributed to the 2e ORR appears clearly at 0.35 V vs. Ag/AgCl, suggesting that the 2e ORR is more favorable during the reaction when ht-pDA/ACF was used as the cathode [18]. Such results imply that the ht-pDA/ACF cathode could have good selectivity and activity for H2O2 production. When the scan rate continues rising to 50 mV/s and 100 mV/s (Figure 2b, the green line 7 and the pink line 8), the peak of the 2e ORR also blurred and disappeared gradually as the peak of the 4e ORR does.

3.2. H2O2 Production

To further assess the performance of ht-pDA/ACF cathode, we set an undivided cell to practically produce H2O2 at a voltage of 2.0 V. For comparison, we also prepared the ao-pDA/ACF cathode by air autoxidation and analyzed the difference between the two as follows. The H2O2 production of CF cathode reached 30 mg/L in the first hour and remained stable in the other 5 h (Figure 3a). However, the H2O2 production of the ACF cathode increased to 99 mg/L in 6 h, which could be attributed to the oxygen-containing group introduced by acid treatment. After modification, the H2O2 production of the ht-pDA/ACF cathode and ao-pDA/ACF cathode both increased compared to that of the CF and ACF cathode. As shown in Figure 3a, the curve of the ht-pDA/ACF cathode showed linear growth to 201 mg/L in the first 4 h, after which the growth rate slowed down and the H2O2 production remained at 220 mg/L after 6 h of reaction, which is over seven times higher than that of the CF and are comparable or even favorable to many carbon-based catalysts (Table S1). A similar H2O2-increasing trend was found in the line for ao-pDA/ACF, but the amount of H2O2 was lower than the ht-pDA/ACF, which stood at 155 mg/L. The above outcome suggests that pDA modification by either hydrothermal process or air autoxidation has a positive influence on the 2e ORR to produce H2O2. Meanwhile, the H2O2 production discrepancy between the ao-pDA/ACF cathode and ht-pDA/ACF cathode also implies that there are some differences between the two preparing routes during polymerization.
We also tested the performance of ht-pDA/ACF under different cell conditions and the results are displayed in Figure 3b and Figures S1–S3. It is clear that when the voltage increases, the yield of H2O2 production improved from 220 mg/L at 2.0 V to 348 mg/L at 2.4 V, which suggests that the higher voltage has a positive influence on the reaction. The reason is that 2.0 V was low and can hardly support the H2O2 synthesis reaction, whereas a higher potential could provide more energy to run the 2e ORR for H2O2 production. The corresponding results of the H2O2 concentration in the electrolyte with different pH values at a potential of 2.0 V (Figure S1) showed that the H2O2 concentration remained stable regardless of whether an acid or alkaline electrolyte were used, implying that the ht-pDA/ACF cathode has good adaptability in different harsh reaction environments. The effect of the amount of dopamine and reaction time in the hydrothermal process for H2O2 electrocatalysis synthesis was also investigated. As shown in Figures S2 and S3, the best condition for electrode modification is 70 mg dopamine for a 6-h hydrothermal reaction.

3.3. UV-Visible Spectra

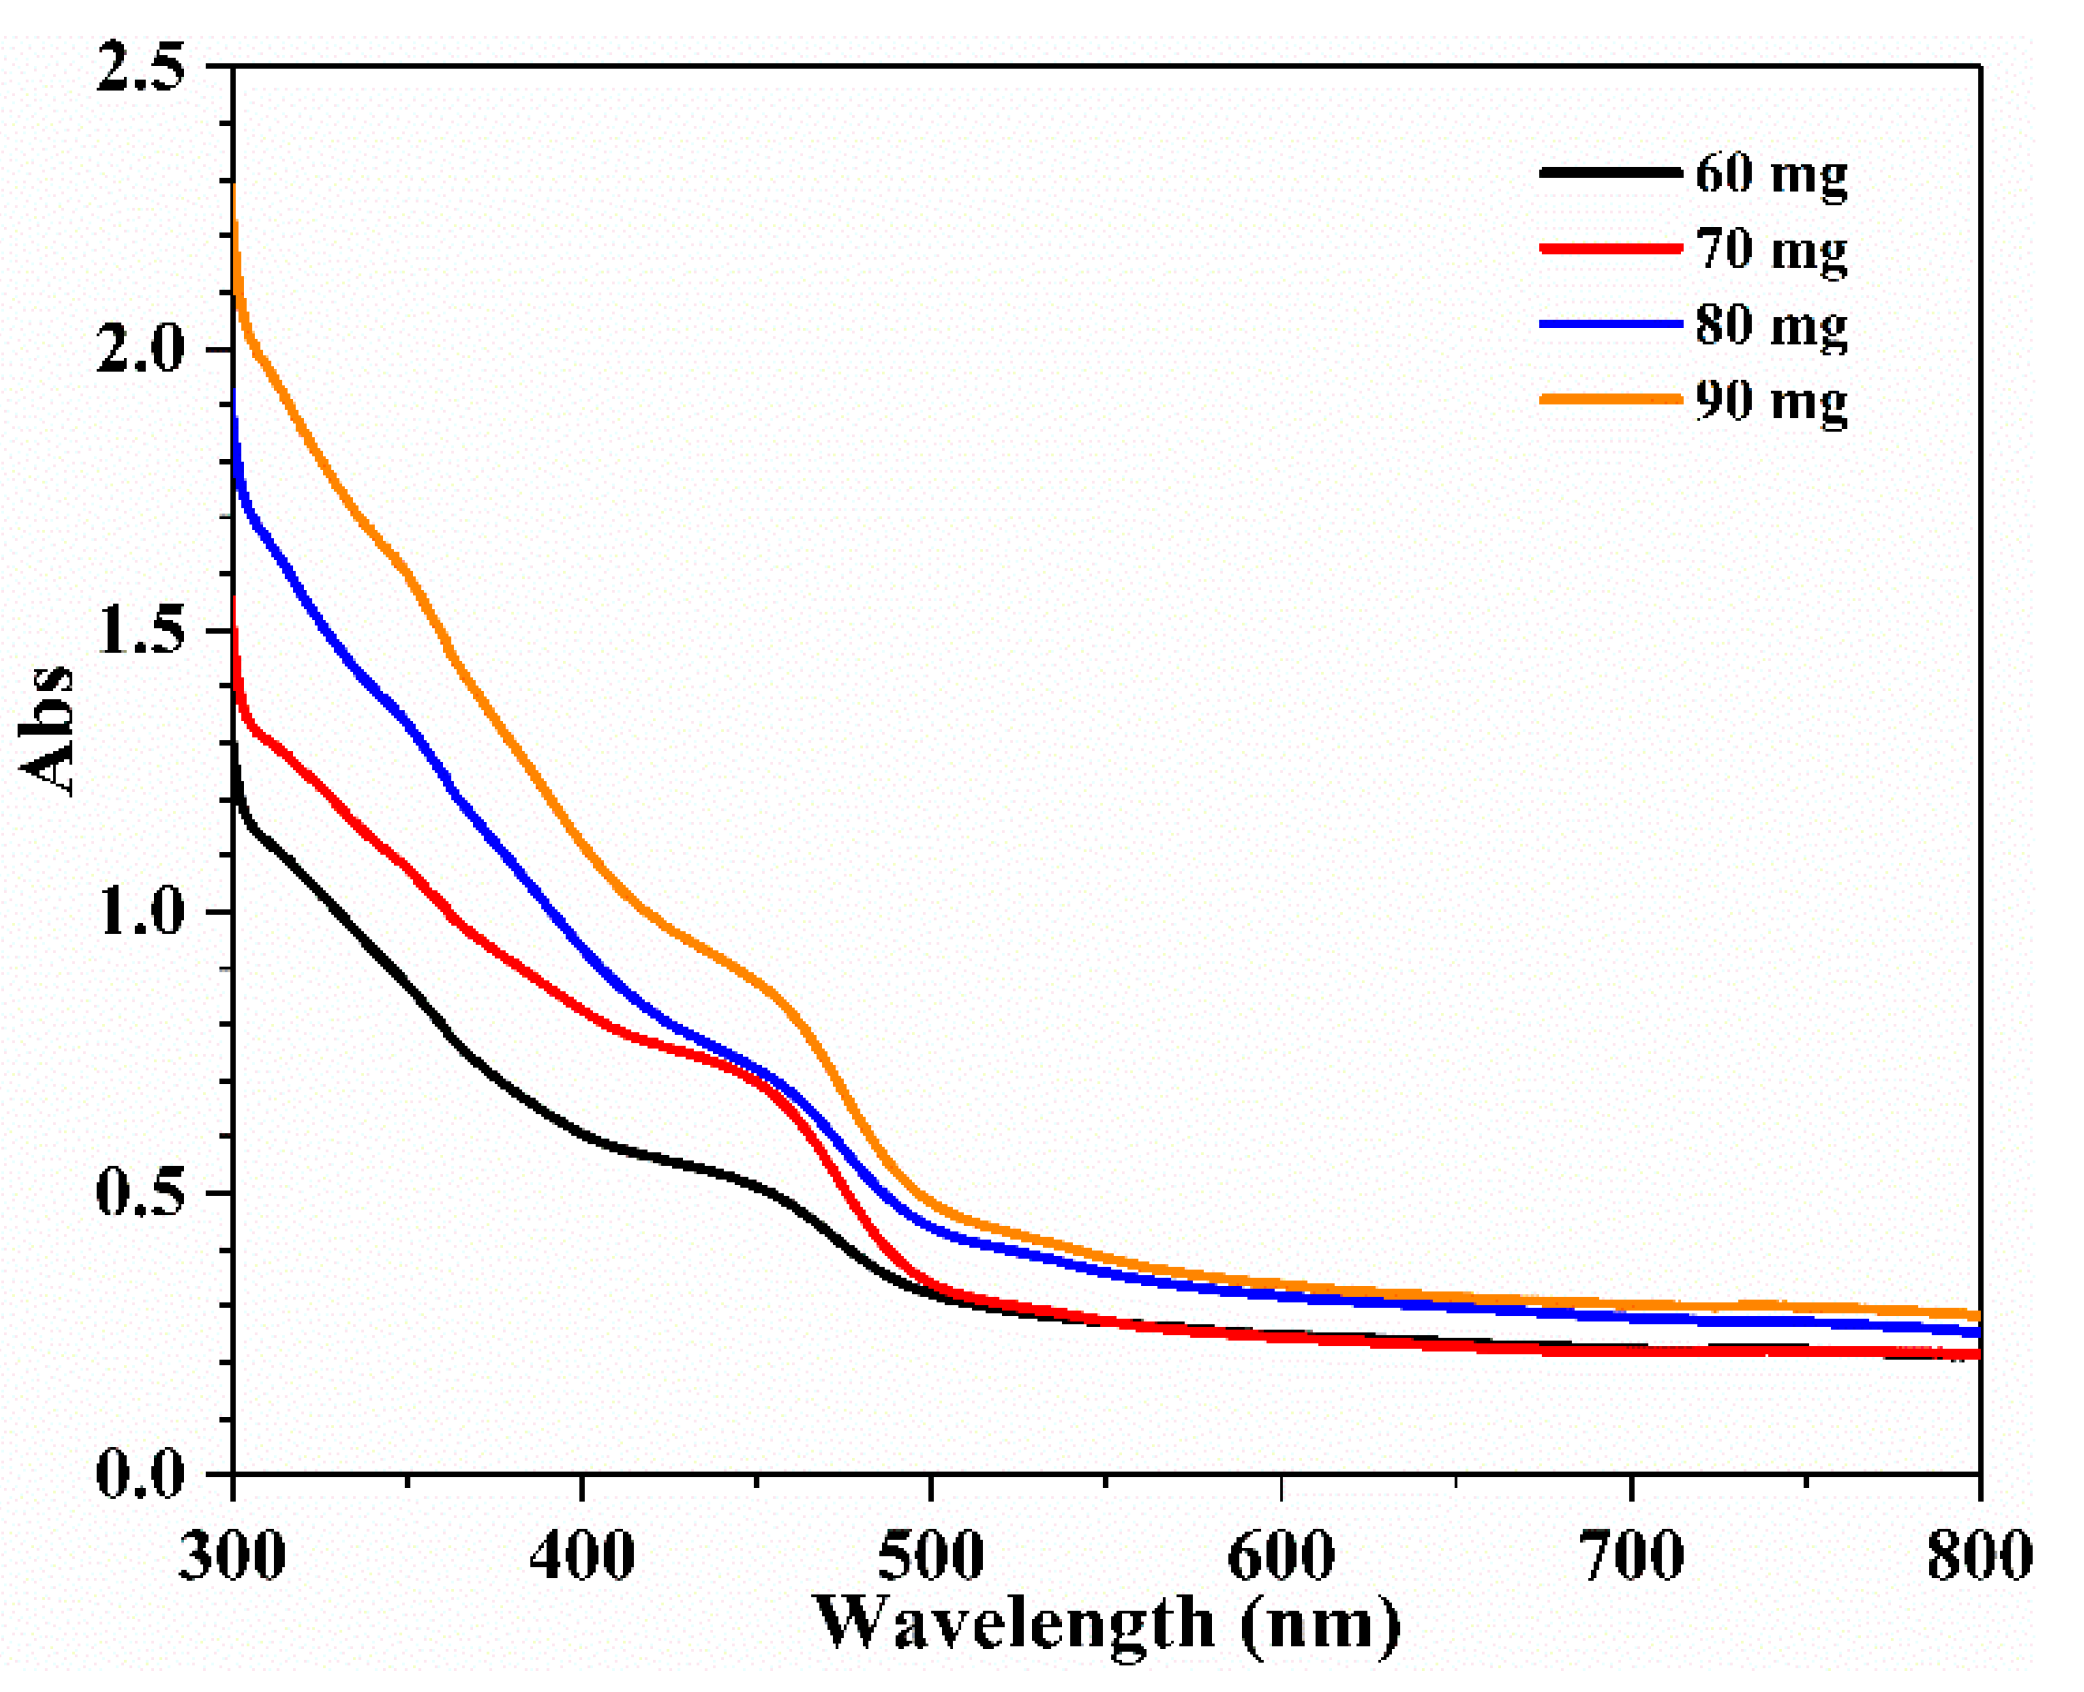
To confirm the formation of pDA, we first performed the UV/visible spectra of the pDA solution during the hydrothermal reaction from 300 nm to 800 nm. As shown in Figure 4, a characteristic peak appeared at 450 nm, which could be attributed to the polymerization of dopamine [19]. The results confirm that the pDA could successfully be formed during the hydrothermal process. Moreover, with the amount of dopamine rising, the absorbance of the characteristic peak gradually increased from 0.5 to 0.9, suggesting that more pDA formed during the hydrothermal process. With more dopamine in the solution, the pDA could form a polymer with higher molecular weight, and thus, the absorbance of the characteristic peak enhanced. The peak intensity of the curve of 70 mg dopamine dramatically enhanced, while it decreased at 80 mg dopamine, implying that 70 mg of dopamine should be the most efficient amount in our study.

3.4. SEM

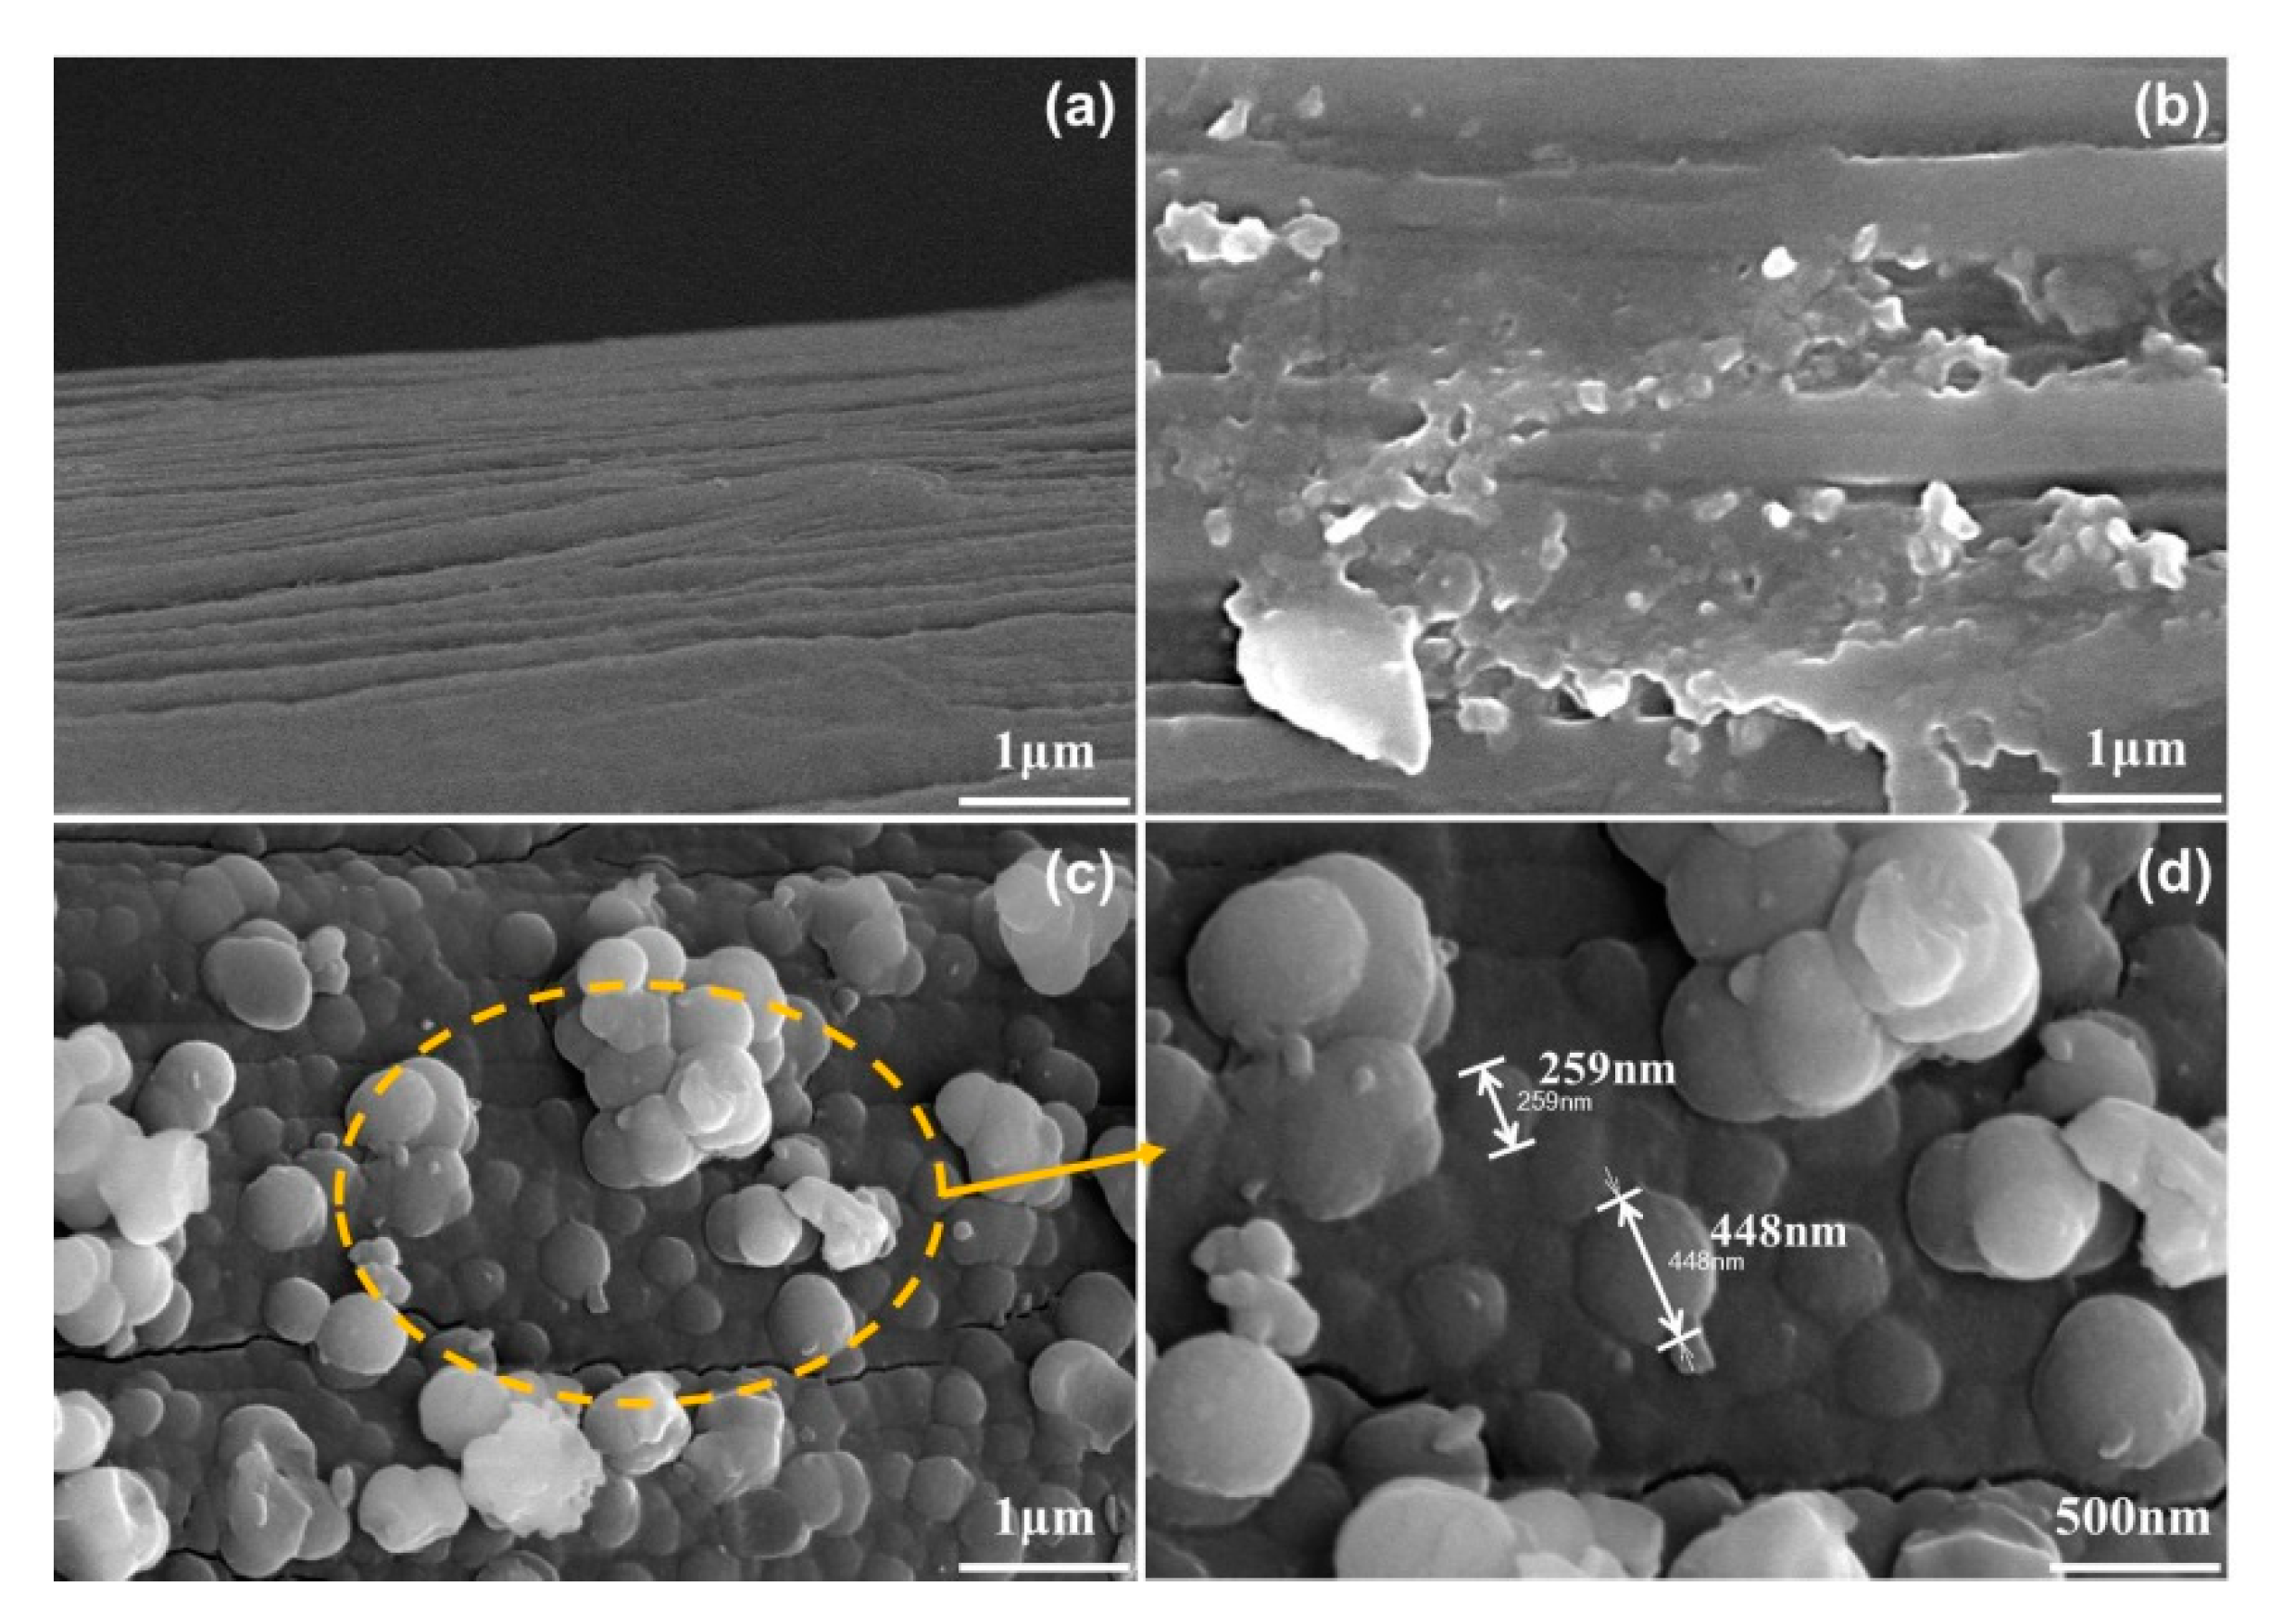
The corresponding SEM images of CF, ao-pDA/ACF and ht-pDA/ACF before and after electrolysis are shown in Figure 5 and Figure S4. It can be seen that the surface of raw CF before electrolysis was flat and smooth (Figure 5a), with some shallow grooves along the direction of the carbon fiber. For the ao-pDA/ACF sample, the pDA was covered on the surface of the carbon fiber (Figure 5b), which formed the rough film structure of ao-pDA/ACF (Figure 1) [20]. In general, the rough structure possesses a larger specific surface than the flat surface, which is beneficial for increasing the number of active sites and reactivity of the electrocatalysis, thus leading to higher H2O2 yield at the ao-pDA/ACF cathode than CF (Figure 3a). Differently, there are many spherical particles evenly accumulated on the surface of ht-pDA/ACF prepared by the hydrothermal method (Figure 1 and Figure 5c,d). The particle size distribution shows the particles varied from 200 nm to 550 nm (Figure S5). It has been reported that the spherical structure catalyst could have the largest specific surface area compared to film structures, and thus, could be the ideal shape of catalyst [21]. Furthermore, the SEM images after electrolysis (Figure S4) show that the CF, ao-pDA/ACF and ht-pDA/ACF cathode can maintain their morphology and structure after electrolysis, suggesting that all three samples have good stability to H2O2 production.
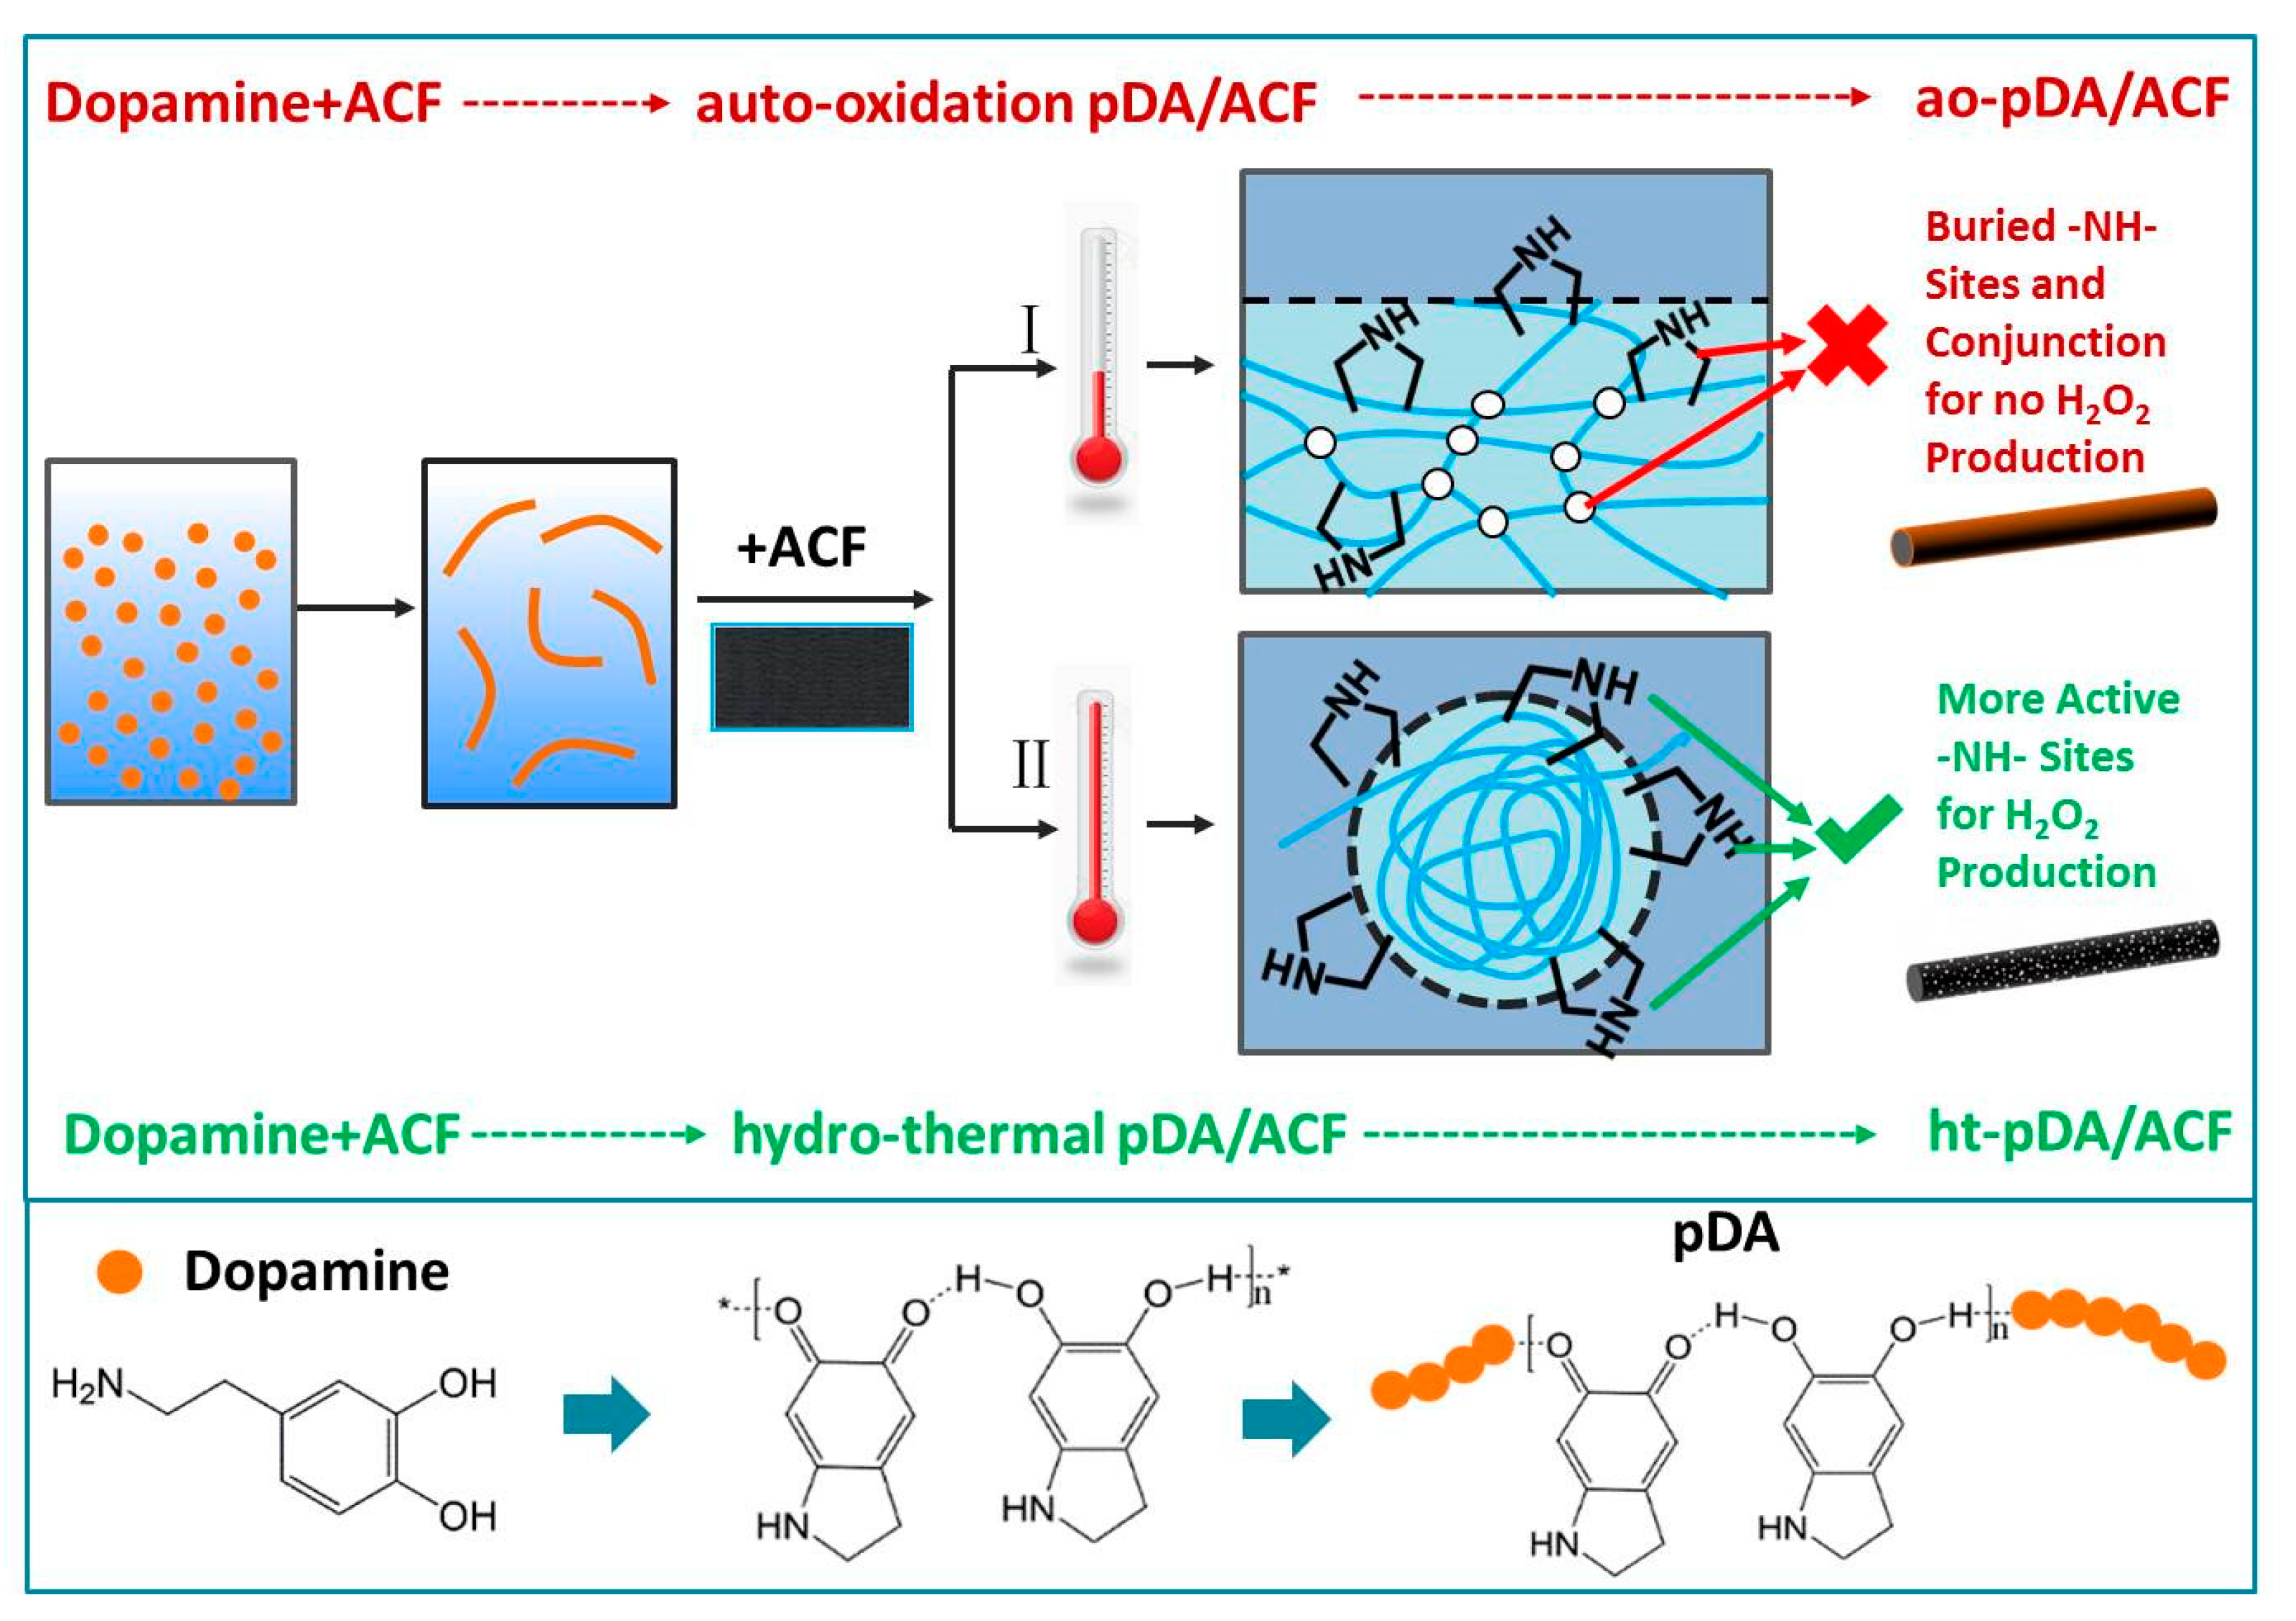
Meantime, compared to the film pDA structure in which many active sites could be buried, the spherical structure pDA could have a better structure for the exposed active sites and accelerate the reaction [21]. By comparing the SEM image of CF, ao-pDA/ACF and ht-pDA/ACF, it is clear that the change of dopamine oxidation process could lead to a different morphology of pDA accumulated on the surface of the CF fiber and further influence the cathode performance. After comparing the above three materials, ht-pDA/ACF could become the most promising cathode material due to its spherical structure providing a larger specific area, and hence, having more exposed active sites compared to ao-pDA/ACF, as a result of H2O2 production (Figure 2).

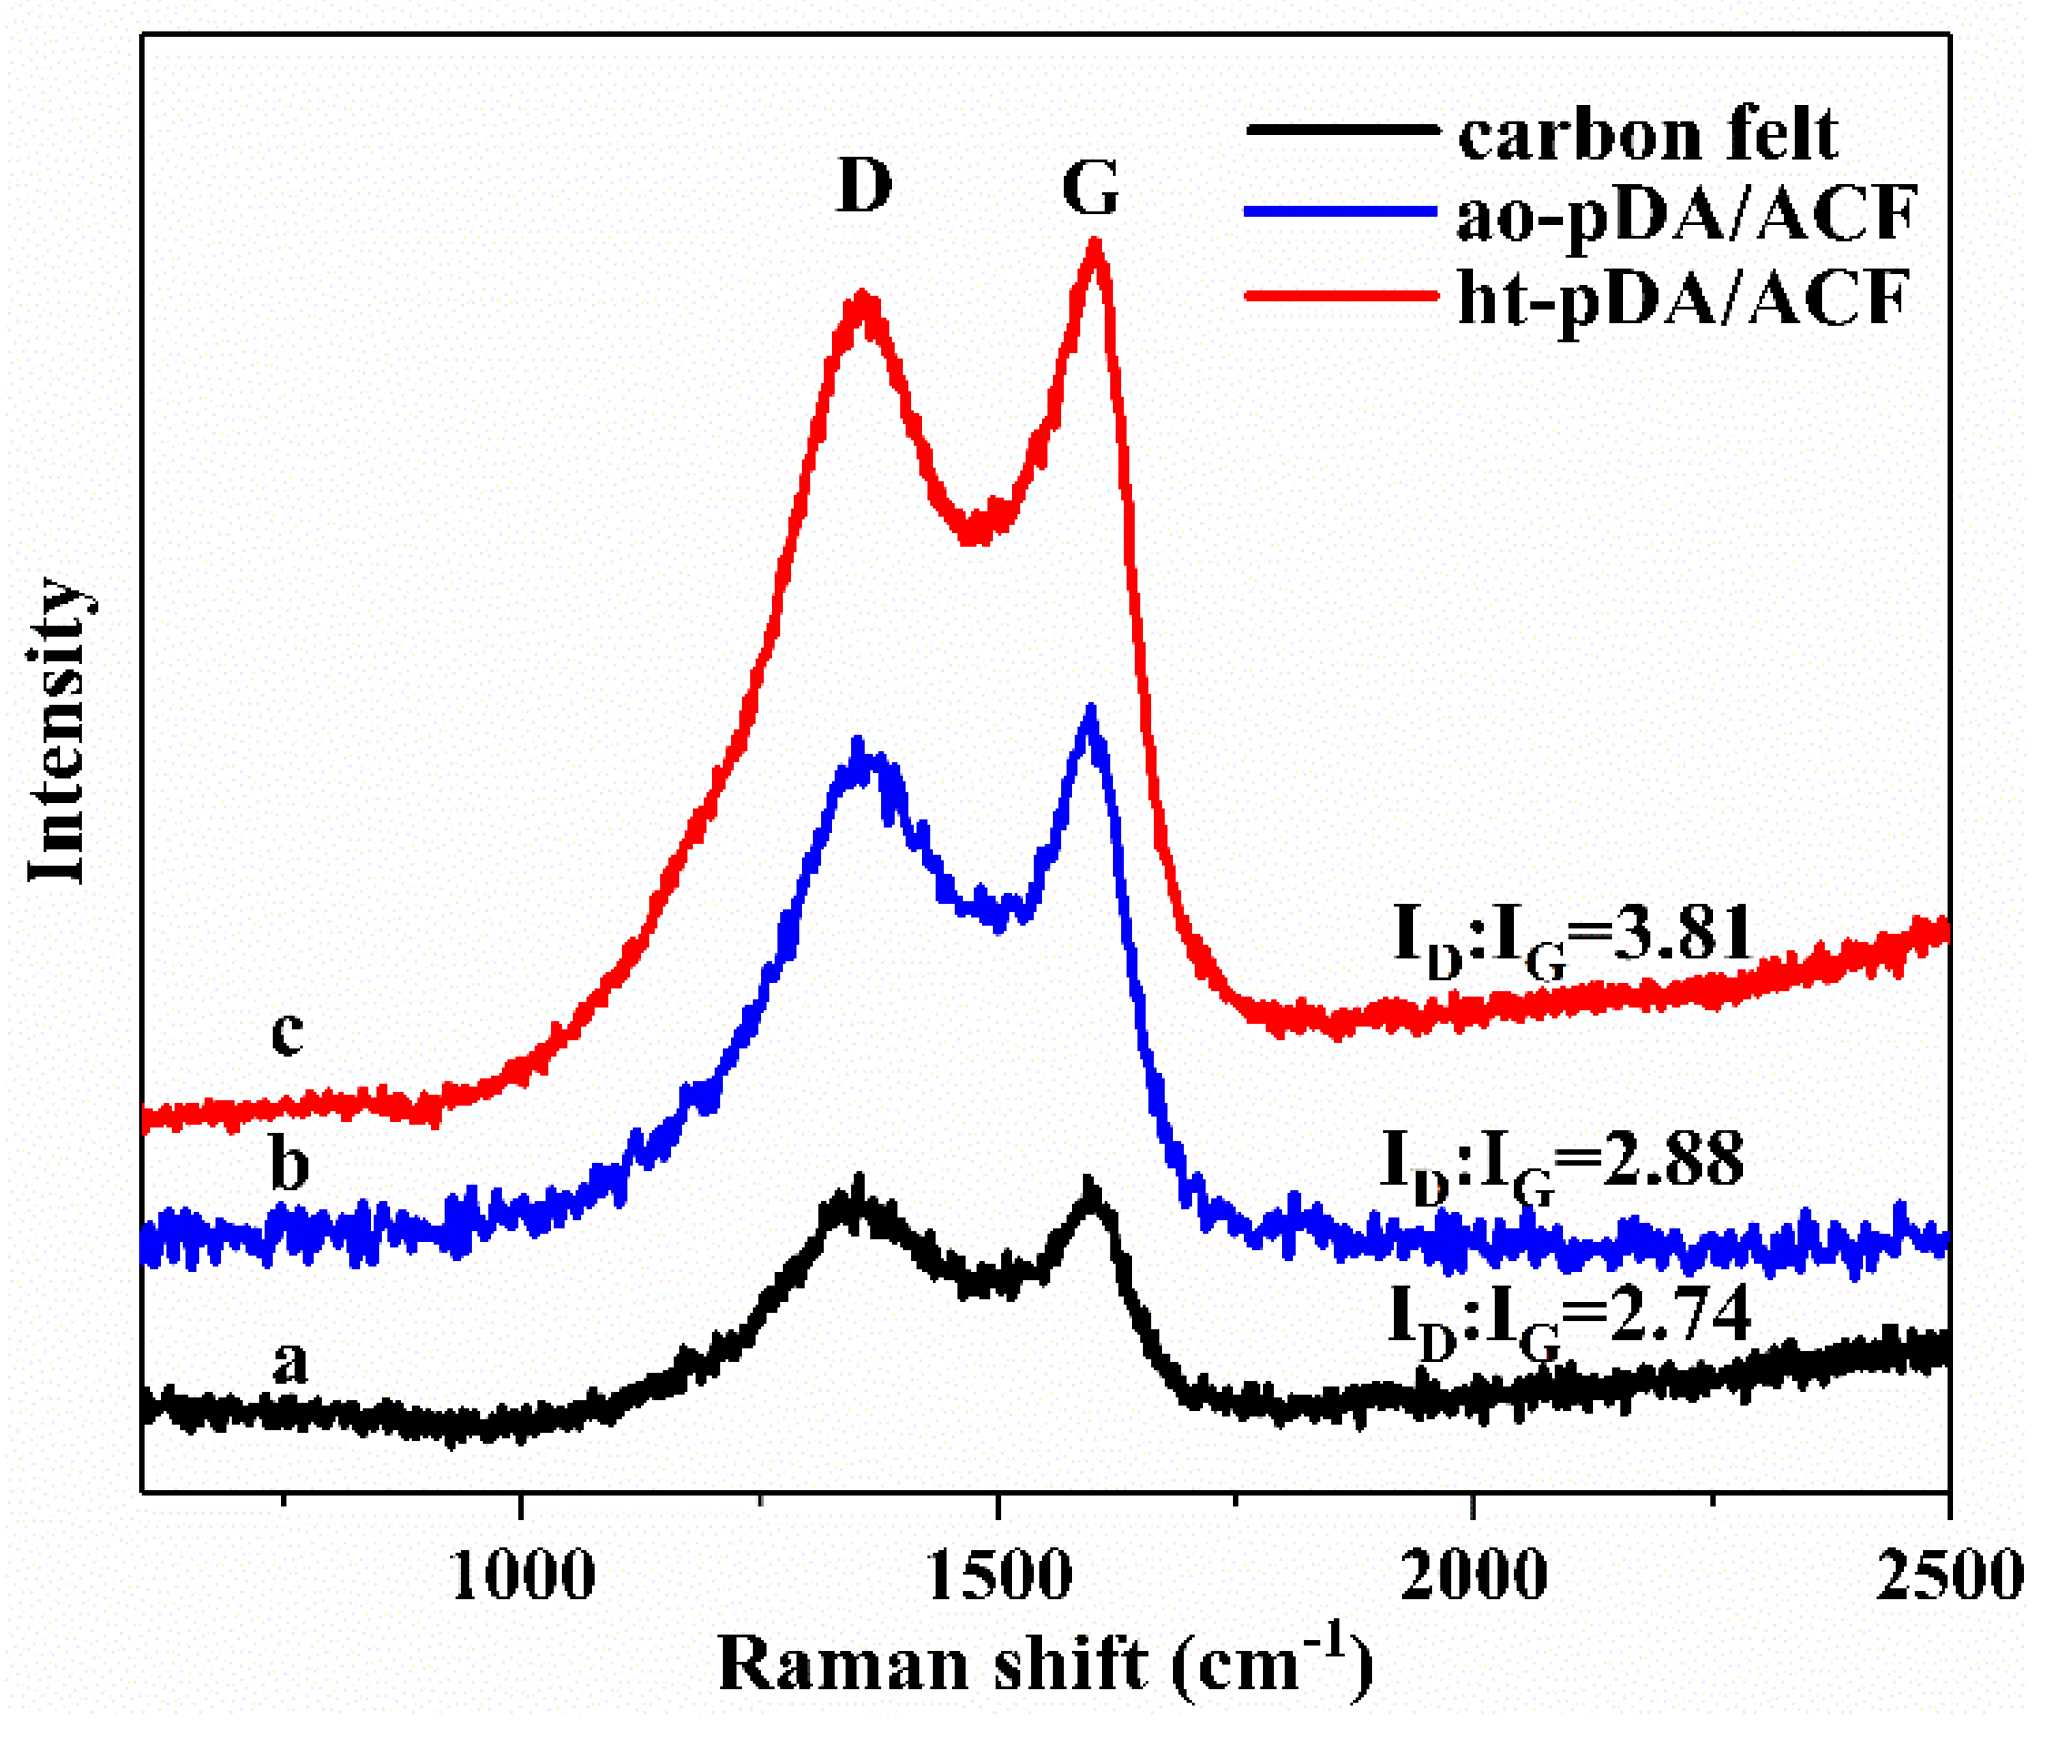
3.5. Raman Spectra

Raman spectroscopy is an effective characterization method for the identification of carbon materials. Two obvious characteristic peaks were observed within 800–2000 cm−1 (Figure 6) for each curve. The band at about 1338 cm−1 is correlated with the structural defect of graphene lattice and identified as a typical disordered carbon structure, which is noted as band D. The band at about 1568 cm−1 is associated with the C-C stretching of sp2 carbon atoms and identified as an ordered carbon structure, which is noted as band G. Therefore, the intensity ratio of D to G (ID/IG) is generally considered to judge the defect degree of carbon materials [16]. The ID/IG values of raw CF and ao-pDA/ACF are 2.74 and 2.88, respectively. However, the ht-pDA/ACF showed the highest value at 3.81 among the three cathodes, which indicates that more defect sites formed on the surface of ht-pDA/ACF than that of CF and ao-pDA/ACF. Such results prove that the modification of pDA by the hydrothermal process introduced numbers of defects to the CF. Moreover, the spherical structure of ht-pDA/ACF could expose more defects compared to ao-pDA/ACF. It has been reported that the defects of the carbon materials could be the active site to produce H2O2 via the 2e ORR [22]. The ht-pDA/ACF with more defects could show higher activity and selectivity for H2O2 production. Furthermore, the ID/IG of ht-pDA/ACF after electrolysis (Figure S6) remained at 2.94, which is still higher than CF and ao-pDA/ACF, indicating that the ht-pDA/ACF had good performance after electrolysis.

3.6. FT-IR Spectra

To analyze the active site of ht-pDA/ACF, we further test the surface functional groups of CF and ht-pDA/ACF by FTIR. The FTIR spectra of CF (Figure 7) shows two strong peaks at 3435 and 1640 cm−1, which are attributed to the bending vibration of hydroxyl groups (-OH) and the -C=O stretching vibration of the carboxyl group (-COOH), respectively. The weak absorption bands at 2930 and 2850 cm−1 are ascribed to the stretching vibration of the methyl and methylene groups (-CH2, -CH3) of CF. the bands at 1384 and 1055 cm−1 originated from -C-O-H asymmetric bending vibration and -C-O-C asymmetric vibration. However, two sharp peaks at 1502 and 1285 cm−1 appear on the spectra of ht-pDA/ACF, which can be assigned to the indole structure and the stretching vibration of -C-N according to the previous literature [23]. Such new peaks for ht-pDA/ACF prove that the dopamine polymerized into pDA during the hydrothermal process and pDA had been successfully introduced to the surface of CF. Similarly, the curve of ao-pDA/ACF shows the peaks of -C-N and indole structure at 1460 cm−1 and 1285 cm−1. However, the peak intensity of ao-pDA/ACF decreases significantly compared to ht-pDA/ACF, implying that the functional groups could be buried by the film structure of ao-pDA/ACF. The results show that ht-pDA/ACF could expose more defects and active sites that are favorable to H2O2 production because of the spherical structure formed during the hydrothermal process.

3.7. Mechanistic Analysis of ht-pDA/ACF Formation and the Production of H2O2

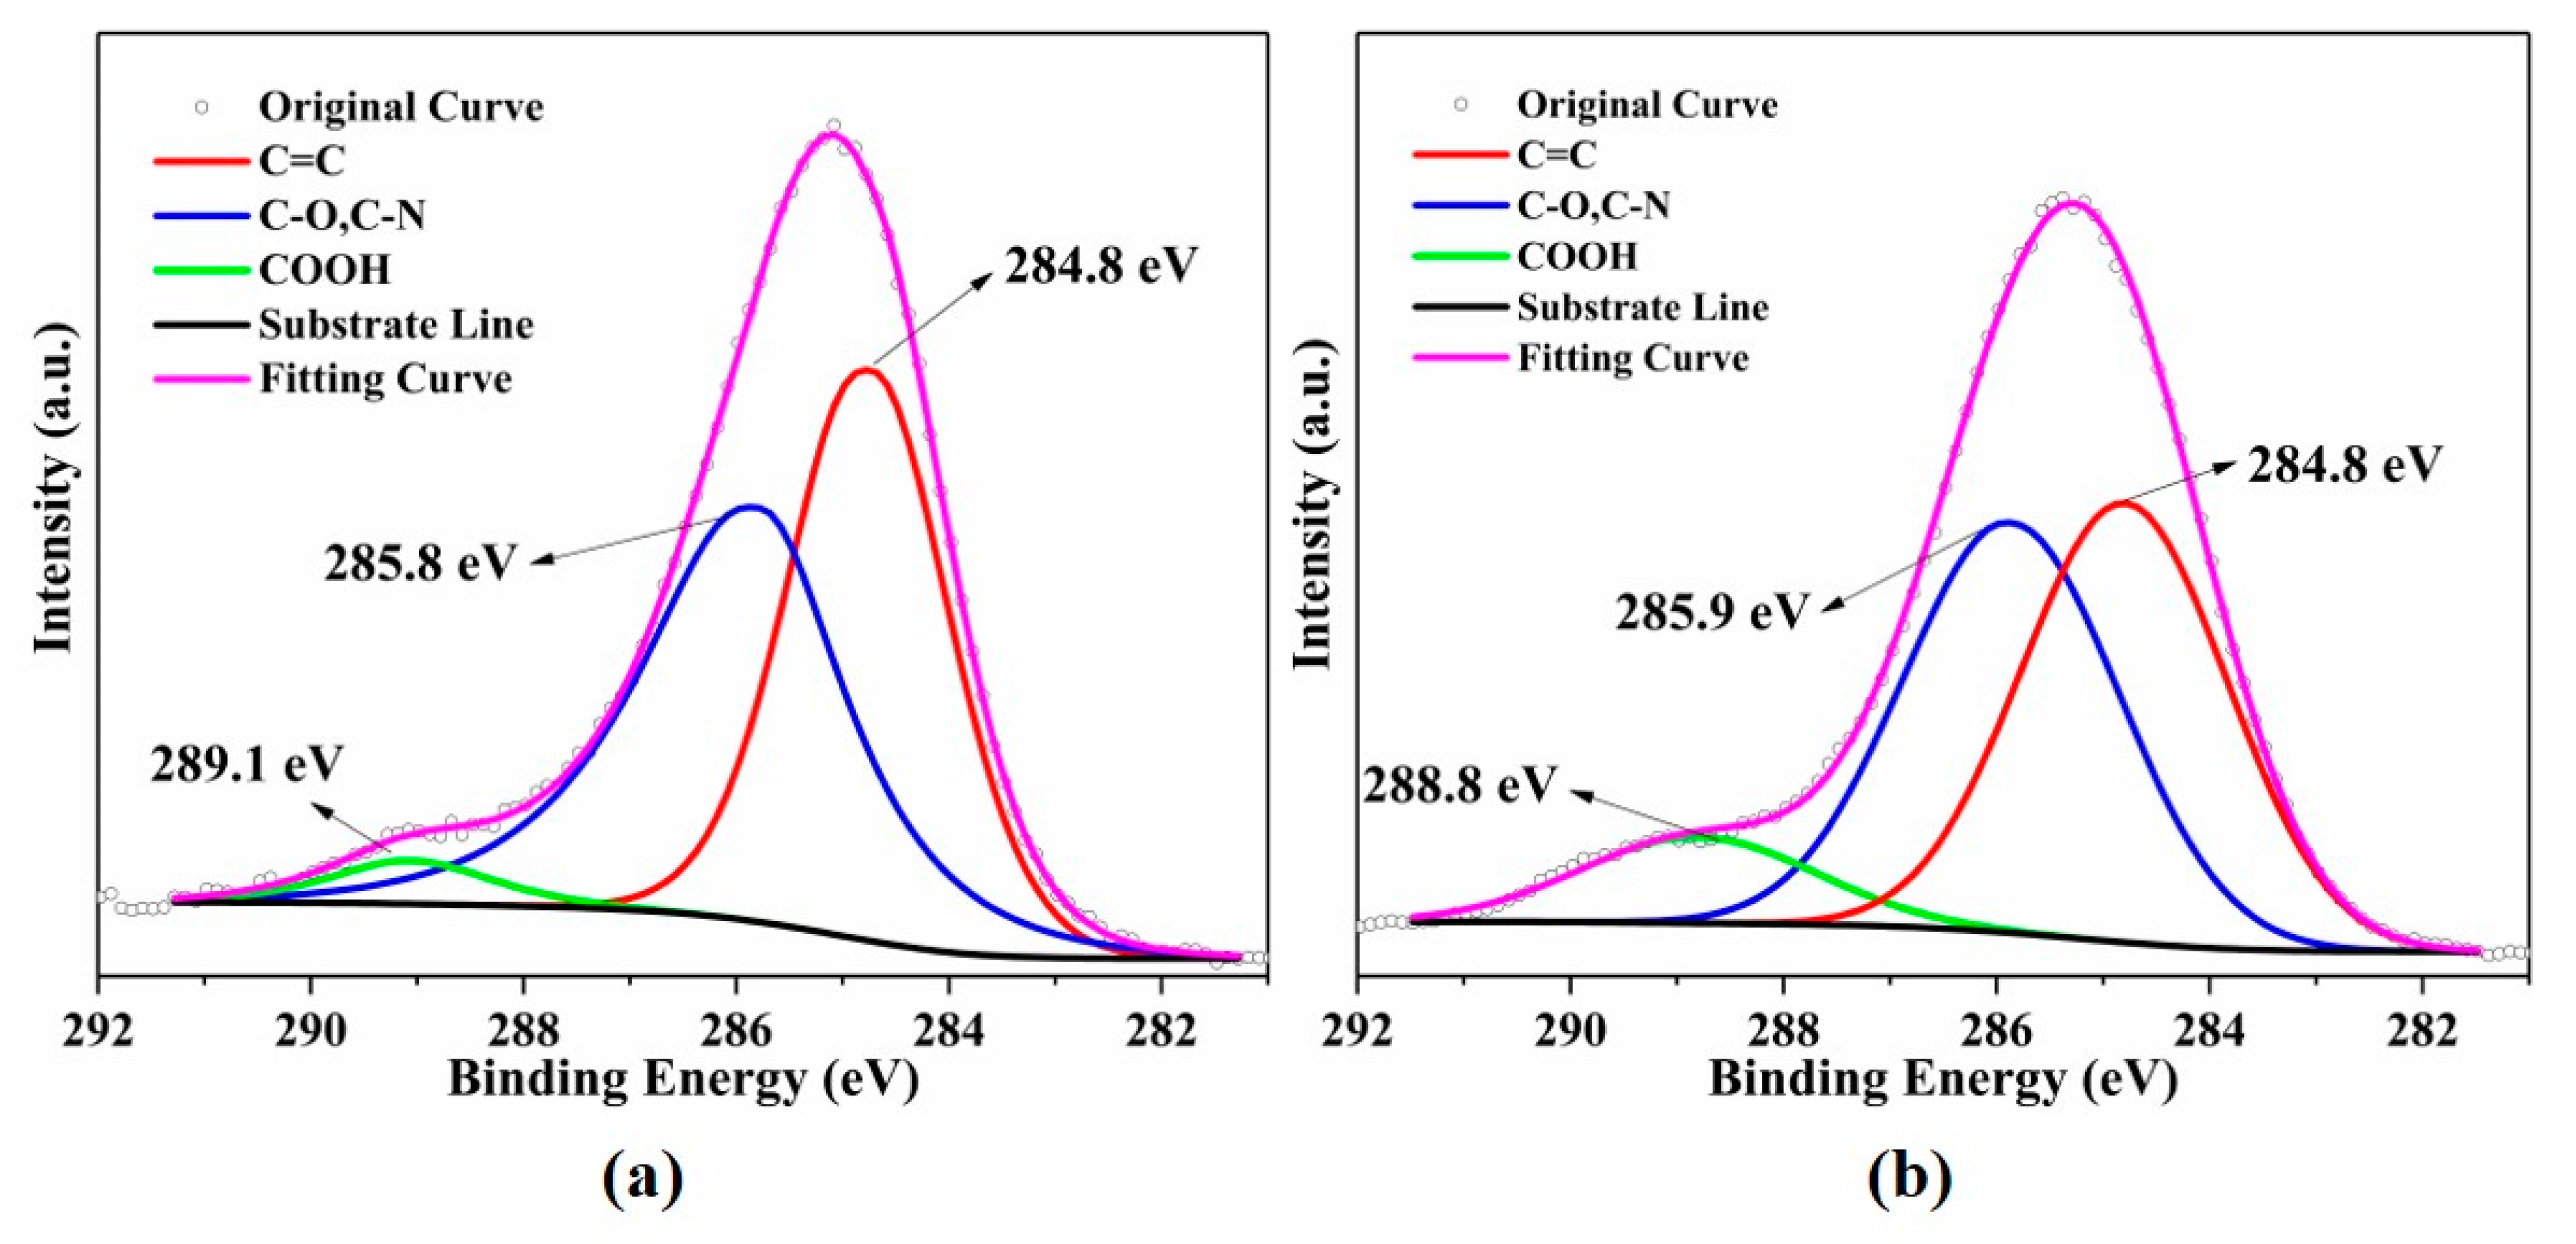
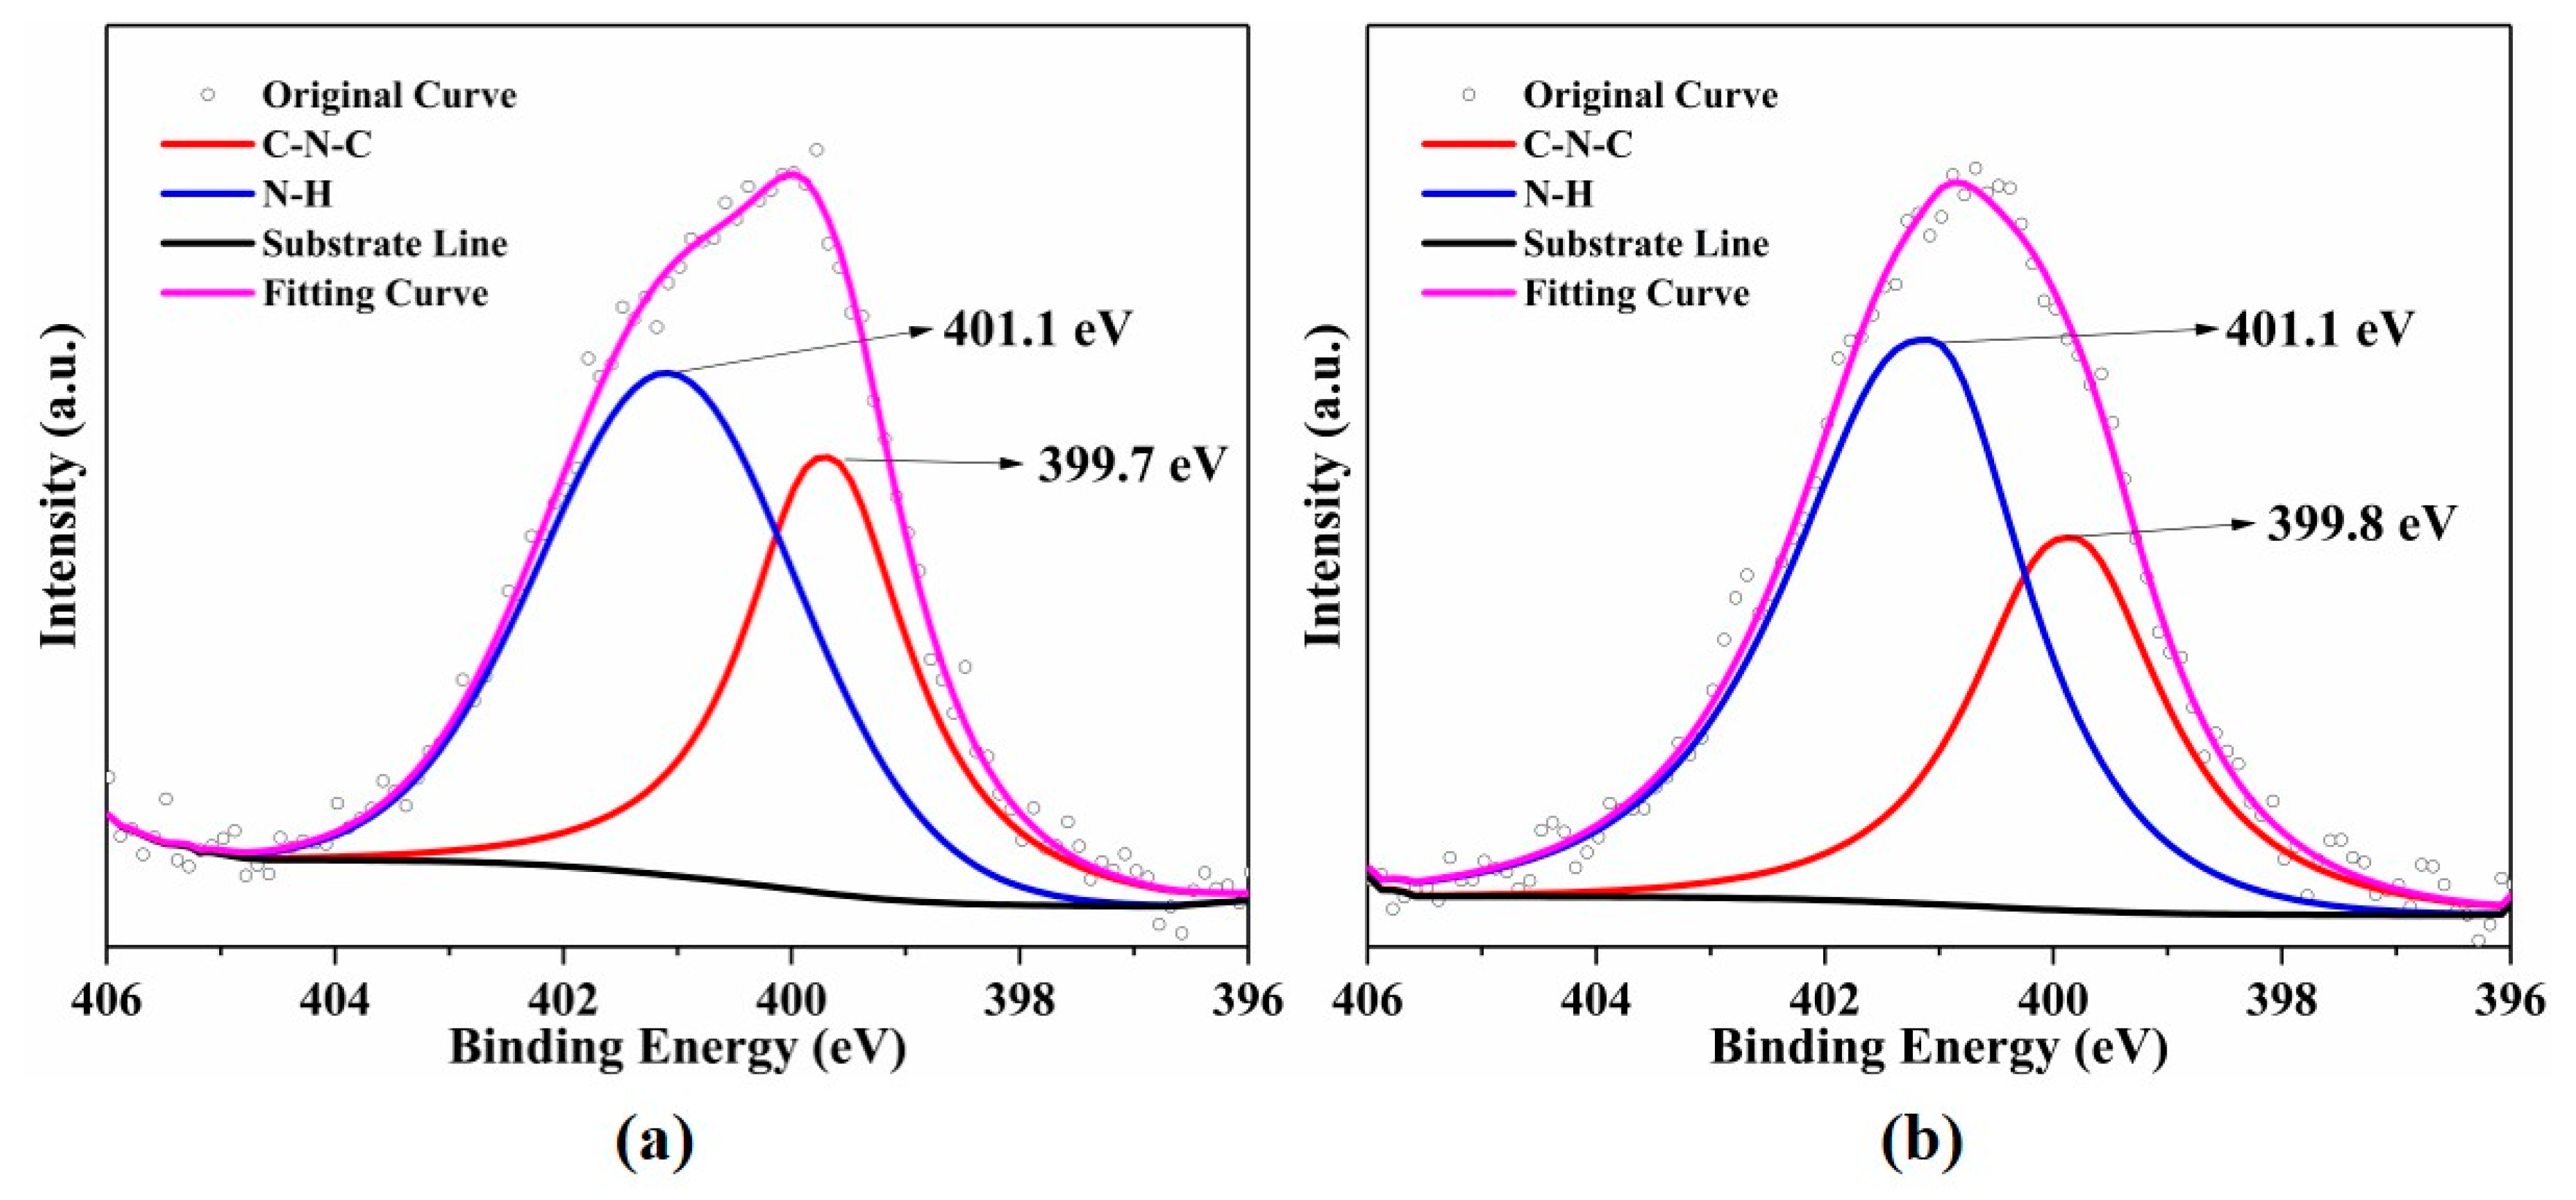
To figure out the surface states of ht-pDA/ACF and further explain the reason for its morphology and good H2O2 production performance, XPS was employed to determine its elemental composition and surface chemical bonding. The XPS spectra of ht-pDA/ACF before and after being used as the cathode for electrocatalytic H2O2 production (Figure S7) shows three peaks that represent C, O and N, which is in accordance with the result of the EDX spectra (Figure S8). The peak fittings of C 1s, O 1s and N 1s high-resolution spectra of ht-pDA/ACF before and after the electrolysis are depicted in Figure 8, Figure 9 and Figure 10, respectively. The C 1s spectrum of ht-pDA before electrolyzing shows three peaks at 284.8, 285.8 and 289.2 eV, which can be attributed to the graphite carbon of C=C sp2, C-O/C-N and C=O of -COOH, respectively [23,24]. The O 1s peaks of ht-pDA/ACF before electrolyzing at 531.9 and 533.0 eV were assigned to O=C and O-C, respectively [25]. The N 1s spectra of ht-pDA/ACF before electrolyzing exhibits two peaks, which are ascribed to the C-N-C peak at 399.7 eV and the N-H peak at 401.1 eV [23]. The existence of the C-N-C peak proves that during the hydrothermal process, the -NH2 group of dopamine was cyclized and dopamine was converted into an indole structure. Some articles have confirmed that dopamine could polymerize by altering dopamine to quinone and cyclizing [20]. Such results indicate that the dopamine has polymerized into pDA and that pDA had been successfully introduced onto the CF by the hydrothermal process, which is in accordance with the FTIR spectra shown in Figure 7. Furthermore, combining the results of SEM, FTIR, Raman and XPS, we conclude that the ht-pDA/ACF possesses more defects and N-containing groups compared to the CF due to the introduction of pDA, which could promote the 2e ORR for H2O2 production, as previous literature proved [26]. Additionally, the spherical morphology of ht-pDA/ACF provide a large specific area compared to the film morphology of ao-pDA/ACF, and thus, could expose more active sites that are favorable in the reaction.
To illustrate the reaction mechanism of the 2e ORR on the ht-pDA/ACF cathode, we further used methylene blue (MB) as a free radical scavenger and tested its concentration difference before and after 3 h electrolysis by UV-visible spectra. The results are shown in Figure 11. All curves have a peak at 664 nm, which are attributed to the absorption of MB [27]. The absorbance shows nearly no change when only supplying O2 to the CF (Figure 11, b), indicating that the MB did not react with O2 without electricity. Similarly, when CF was used as the cathode and without O2 (Figure 11, c), the absorbance only slightly drops compared with the original. This implies that although a part of MB was oxidized at the anode (platinum plate), most MB was not decomposed and still remains in the electrolyte. Considering the oxidation of MB at the anode, it is clear that there are nearly no free radicals formed on the surface of CF cathode. However, after supplying the oxygen to the cathode (Figure 11, d), the absorbance sharply decreased compared to the without oxygen cathode, suggesting the oxygen-containing free radicals, such as •OH, •OH, formed when the electricity and oxygen exist simultaneously. Furthermore, the absorbance of the ht-pDA/ACF cathode (Figure 11, e) with oxygen is even lower than CF cathode with oxygen, indicating that more free radicals formed on the ht-pDA/ACF cathode due to the existence of pDA. The results indicate that with the effect of electricity and oxygen, the free radicals could be generated at the surface of the cathode during electrolysis. Furthermore, the pDA could accelerate the above process and produce more free radicals that lead to more MB decomposition, and eventually, the absorbance decreases compared to the CF cathode with O2. The experiment also implies the potential application of the ht-pDA/ACF cathode on pollution degradation.
Some literature has proven free radical polymerization as a possible pathway that should exist during the formation of pDA [28]. With the temperature rising, the rate of free radical polymerization increased and the degree of polymerization (DP) decreased. According to the above characterization results and the characteristics of free radical polymerization, we illustrate the differences between ht-pDA/ACF and ao-pDA/ACF during dopamine polymerization, as shown in Figure 12. Firstly, the dopamine molecules interacted with each other and formed short chains in the solution by altering dopamine to quinone and cyclizing. When polymerizing at room temperature, the short pDA chains slowly extended its molecule chain and eventually formed the cross-linked pDA film with high DP at the surface of CF. The introduction of pDA brings numerous active sites and defects that are favorable for the 2e ORR and H2O2 production. Therefore, the ao-pDA/ACF cathode shows distinctive improvement for H2O2 production compared to the CF cathode, which has been proven by the results of H2O2 production in Figure 3a. However, in the meantime, the film pDA structure could bury the active sites, and thus, showing inferior H2O2 production compared to the ht-pDA/ACF, as shown in Figure 12 I. However, the high temperature during the hydrothermal process led to a higher polymerization rate at first but lower DP eventually according to the radical polymerization mechanism. Such chains tended to curl and formed spherical particles in the solution. The pDA particles deposited on the surface of CF, as the SEM shows in Figure 5. The spherical pDA is desirable to expose active sites and accelerate the 2e ORR, as Figure 12 II shows. By changing the morphology of pDA via altering the polymerization temperature, the H2O2 production further improved, which suggests that the hydrothermal process of dopamine polymerization is an efficient way to enhance the performance of CF for H2O2 production.
To explain the effect of ht-pDA/ACF and verify its active sites for the 2e ORR, we calculated the atomic percentage of ht-pDA/ACF before and after the electrolysis by detecting the XPS spectra and analyzed the change of surface states of ht-pDA/ACF. As we can see in the C 1s spectra in Table 1, the content of -COOH obviously increased after the electrolysis, from 3.79% to 10.18%, while the C=C and the C-N/C-O slightly decreased. Similarly, the O 1s spectra shows the percentage of O-C reduced from 70.22% to 53.82%, whereas the proportion of O=C rose up from 29.78% to 46.18%. Combining the C 1s spectra with the O 1s spectra, we concluded that the C=C and C-O groups got involved in the 2e ORR and were gradually oxidized to -COOH. The N 1s spectra show that the number of C-N-C groups went down and the number of N-H groups went up, suggesting that the ring cleavage reaction occurred during the electrolyzing and implying that the C-N-C also participated in the 2e ORR.
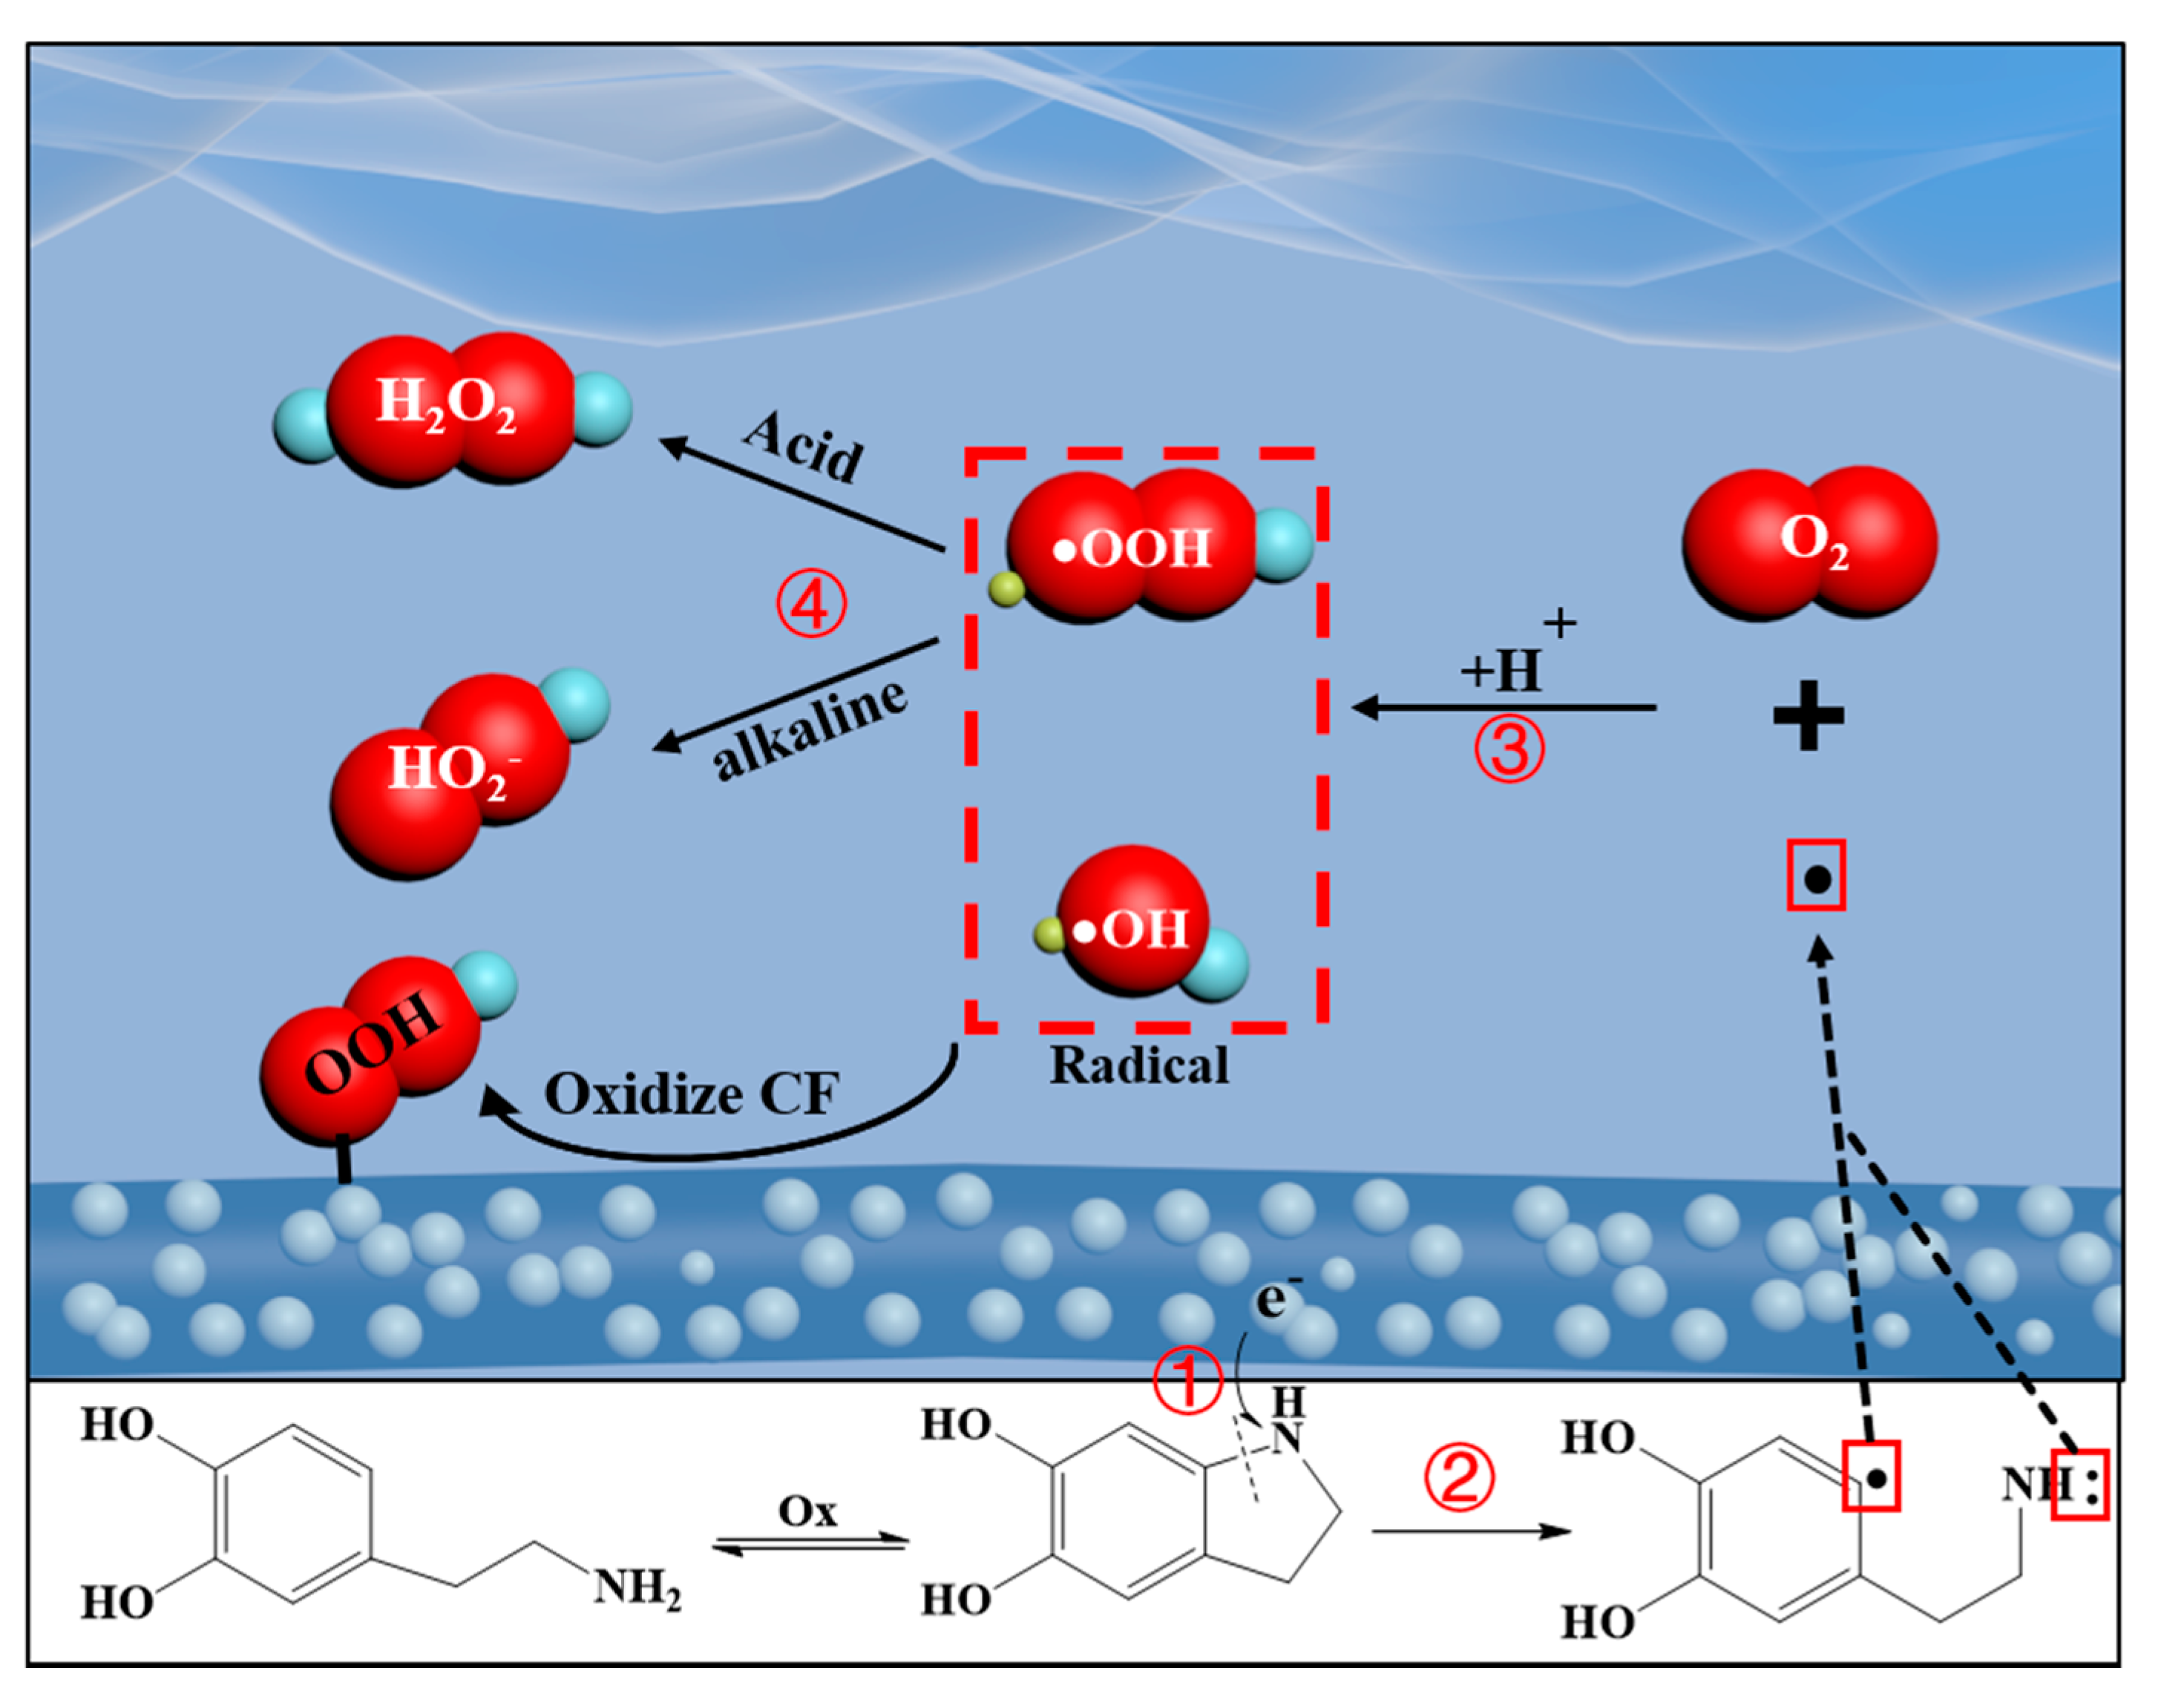
Based on the results of the XPS spectra and UV-visible results of MB and other literature [28,29], we provide a mechanism diagram of ht-pDA/ACF for the 2e ORR to H2O2 in Figure 13. Generally, the dopamine oxidized and formed pDA on the CF by the hydrothermal process at first (Figure 12 I). The amine group of dopamine got involved in the formation of indole structure and formed a C-N-C structure during polymerization (Figure 7 and Figure 10). The high electronegativity of nitrogen atoms at the neighbor of carbon atoms would induce the change of the spin density and charge distribution [14,29]. When the power supply was turned on, the nitrogen atom in dopamine captured electrons priority because of the strong electronegativity and split the bond to the adjacent carbon atom. The indole structure of the pDA was reduced and the ring cleavage reaction took place to form the structure of C • and HN during the electrolyzing (Figure 13). The C • or HN combined with an oxygen molecule to form • OH or • OOH , which is the oxidant for MB fading in free radical capture experiment [28]. The • OOH , as the intermediate of H2O2 production via the 2e ORR [29], combined with H+ to form the H2O2 in the acid environment or formed the HO2 in the alkaline environment. Thus, the ht-pDA/ACF shows high H2O2 production in both acid and alkaline electrolyte, as Figure S1 shows. Moreover, the • OH , one of the strongest oxidants, could oxidize the C-OH or C=C groups at the surface of the ht-pDA/ACF cathode to COOH and result in the increase of COOH content (Table 1) after H2O2 production. The COOH group has been proved as the ideal active site of the 2e ORR to H2O2 with high selectivity and activity [29]. More carboxyl groups were formed after the H2O2 production also reflects the stability, selectivity and activity of the ht-pDA/ACF cathode during the oxygen reduction. On the one hand, the indole structure of polydopamine acted as the active sites for ht-pDA/ACF cathode to produce H2O2. On the other hand, the spherical particle morphology of ht-pDA/ACF contributed to the good electrocatalytic H2O2 production for exposing more active sites. The synergistic effect between the spherical particles morphology and the continuous formation of H2O2 production active sites results in the high activity and selectivity of the ht-pDA/ACF cathode. This work will give a new way to prepare a low-cost and green electrocatalyst for efficient H2O2 electroproduction.

4. Conclusions

In this work, a spherical particle morphology polydopamine (pDA)-modified carbon felt (noted as ht-pDA/ACF) by a hydrothermal process was fabricated to be used as the cathode of H2O2 production. The hydrothermal process of dopamine not only incorporated nitrogen-containing groups but also formed desirable spherical polydopamine for the oxygen reduction reaction. The ht-pDA/ACF cathode showed an obvious hydrogen peroxide (H2O2) production improvement compared to the raw carbon felt cathode with a voltage of 2.0 V, from 30 mg/L to 220 mg/L. The H2O2 production further reached 340 mg/L when the voltage rose to 2.4 V. After analyzing the formation of polydopamine and H2O2 production process, we found that the active site of pDA for two-electron oxygen reduction reaction (2e ORR) is the indole structure. The ring cleavage of the indole structure during electrolyzing formed radicals and further formed H2O2. Moreover, the spherical morphology of pDA could enlarge the specific area and expose more active site compared to the film morphology of pDA. The results show that the ht-pDA/ACF is a promising material for H2O2 production via the 2e ORR.

Supplementary Materials

The following are available online at https://www.mdpi.com/article/10.3390/app11125371/s1, Figure S1: H2O2 production (mg/L) of ht-pDA/ACF cathode in acid (H2SO4, pH = 1) and alkaline (KOH, pH = 13) electrolyte, Figure S2: H2O2 production (mg/L) of ht-pDA/ACF cathode with different dopamine content. Figure S3: H2O2 production (mg/L) of ht-pDA/ACF cathode with different hydrothermal process time, Figure S4 the SEM images of CF (a), ao-pDA/ACF (b) and ht-pDA/ACF (c), Figure S5 pDA particles size distribution of ht-pDA/ACF (particle number:100), Figure S6 the Raman spectra of ht-pDA/ACF after electrolysis, Figure S7 the XPS spectra of ht-pDA/ACF before (a) and after (b) electrolysis, Figure S8 the EDX spectra of ht-pDA before (a,b,c) and after (d,e,f) electrolysis, Figure S9 the XPS spectra (a) of ao-pDA/ACF and its C 1s (b), N 1s (c) and O 1s (d) spectra, Table S1 Comparison of H2O2 accumulation concentration in other literature.

Author Contributions

Conceptualization, H.W., Y.Z. and Z.L.; methodology, L.C., Y.Z.; validation, L.C., Y.Z. and D.F.; writing—original draft preparation, L.C., Y.Z.; writing—review and editing, L.C., Y.Z. and S.Y.; supervision, Y.Z., H.W. All authors have read and agreed to the published version of the manuscript.

Funding

This research was funded by the National Science Foundation for Distinguished Young Scholars of China (Grant No. 51925403), the Major Research Plan of National Natural Science Foundation of China (Grant No. 2019002), the National Science Foundation of China (21676052, 21606042), the Open Research Subject of Key Laboratory of Fluid and Power Machinery (Xihua University), Ministry of Education (Grant No. szjj2019-021).

Conflicts of Interest

The authors declare that there is no conflict of interests regarding the publication of this article.

References

  1. Campos-Martin, J.M.; Blanco-Brieva, G.; Fierro, J.L.G. Hydrogen Peroxide Synthesis: An Outlook beyond the Anthraquinone Process. Angew. Chem. Int. Ed. 2006, 45, 6962–6984. [Google Scholar] [CrossRef] [PubMed]
  2. Yi, Y.; Wang, L.; Li, G.; Guo, H. A review on research progress in the direct synthesis of hydrogen peroxide from hydrogen and oxygen: Noble-metal catalytic method, fuel-cell method and plasma method. Catal. Sci. Technol. 2016, 6, 1593–1610. [Google Scholar] [CrossRef]
  3. Flaherty, D.W. Direct Synthesis of H2O2 from H2 and O2 on Pd Catalysts: Current Understanding, Outstanding Questions, and Research Needs. ACS Catal. 2018, 8, 1520–1527. [Google Scholar] [CrossRef] [Green Version]
  4. Zhou, W.; Meng, X.; Gao, J.; Alshawabkeh, A.N. Hydrogen peroxide generation from O2 electroreduction for environmental remediation: A state-of-the-art review. Chemosphere 2019, 225, 588–607. [Google Scholar] [CrossRef]
  5. Jiang, Y.; Ni, P.; Chen, C.; Lu, Y.; Yang, P.; Kong, B.; Fisher, A.; Wang, X. Selective Electrochemical H2O2 Production through Two-Electron Oxygen Electrochemistry. Adv. Energy Mater. 2018, 8. [Google Scholar] [CrossRef]
  6. Li, B.; Zhao, C.; Liu, J.; Zhang, Q. Electrosynthesis of Hydrogen Peroxide Synergistically Catalyzed by Atomic Co–N x –C Sites and Oxygen Functional Groups in Noble-Metal-Free Electrocatalysts. Adv. Mater. 2019, 31, e1808173. [Google Scholar] [CrossRef] [PubMed]
  7. Jirkovský, J.S.; Panas, I.; Ahlberg, E.; Halasa, M.; Romani, S.; Schiffrin, D.J. Single Atom Hot-Spots at Au–Pd Nanoalloys for Electrocatalytic H2O2 Production. J. Am. Chem. Soc. 2011, 133, 19432–19441. [Google Scholar] [CrossRef] [PubMed]
  8. Siahrostami, S.; Verdaguer-Casadevall, A.; Karamad, M.; Deiana, D.; Malacrida, P.; Wickman, B.; Escudero-Escribano, M.; Paoli, E.A.; Frydendal, R.; Hansen, T.W.; et al. Enabling direct H2O2 production through rational electrocatalyst design. Nat. Mater. 2013, 12, 1137–1143. [Google Scholar] [CrossRef] [Green Version]
  9. Verdaguer-Casadevall, A.; Deiana, D.; Karamad, M.; Siahrostami, S.; Malacrida, P.; Hansen, T.W.; Rossmeisl, J.; Chorkendorff, I.; Stephens, I.E.L. Trends in the Electrochemical Synthesis of H2O2: Enhancing Activity and Selectivity by Electrocatalytic Site Engineering. Nano Lett. 2014, 14, 1603–1608. [Google Scholar] [CrossRef] [Green Version]
  10. Yang, W.; Zhou, M.; Cai, J.; Liang, L.; Ren, G.; Jiang, L. Ultrahigh yield of hydrogen peroxide on graphite felt cathode modified with electrochemically exfoliated graphene. J. Mater. Chem. A 2017, 5, 8070–8080. [Google Scholar] [CrossRef]
  11. Contreras, E.; Dominguez, D.; Tiznado, H.; Guerrero-Sanchez, J.; Takeuchi, N.; Alonso-Nunez, G.; Contreras, O.E.; Oropeza-Guzmán, M.T.; Romo-Herrera, J.M. N-Doped carbon nanotubes enriched with graphitic nitrogen in a buckypaper configuration as efficient 3D electrodes for oxygen reduction to H2O2. Nanoscale 2019, 11, 2829–2839. [Google Scholar] [CrossRef]
  12. Zhang, H.; Jia, L.; Wu, P.; Xu, R.; He, J.; Jiang, W. Improved H2O2 photogeneration by KOH-doped g-C3N4 under visible light irradiation due to synergistic effect of N defects and K modification. Appl. Surf. Sci. 2020, 527, 146584. [Google Scholar] [CrossRef]
  13. Zhu, J.; Xiao, X.; Zheng, K.; Li, F.; Ma, G.; Yao, H.-C.; Wang, X.; Chen, Y. KOH-treated reduced graphene oxide: 100% selectivity for H2O2 electroproduction. Carbon 2019, 153, 6–11. [Google Scholar] [CrossRef]
  14. Xu, Y.; Mo, Y.; Tian, J.; Wang, P.; Yu, H.; Yu, J. The synergistic effect of graphitic N and pyrrolic N for the enhanced photocatalytic performance of nitrogen-doped graphene/TiO2 nanocomposites. Appl. Catal. B Environ. 2016, 181, 810–817. [Google Scholar] [CrossRef]
  15. Perazzolo, V.; Durante, C.; Pilot, R.; Paduano, A.; Zheng, J.; Rizzi, G.A.; Martucci, A.; Granozzi, G.; Gennaro, A. Nitrogen and sulfur doped mesoporous carbon as metal-free electrocatalysts for the in situ production of hydrogen peroxide. Carbon 2015, 95, 949–963. [Google Scholar] [CrossRef]
  16. Liu, Y.; Quan, X.; Fan, X.; Wang, H.; Chen, S. High-Yield Electrosynthesis of Hydrogen Peroxide from Oxygen Reduction by Hierarchically Porous Carbon. Angew. Chem. Int. Ed. 2015, 54, 6837–6841. [Google Scholar] [CrossRef]
  17. Fellinger, T.-P.; Hasché, F.; Strasser, P.; Antonietti, M. Mesoporous Nitrogen-Doped Carbon for the Electrocatalytic Synthesis of Hydrogen Peroxide. J. Am. Chem. Soc. 2012, 134, 4072–4075. [Google Scholar] [CrossRef] [PubMed]
  18. Amiinu, I.S.; Liu, X.; Pu, Z.; Li, W.; Li, Q.; Zhang, J.; Tang, H.; Zhang, H.; Mu, S. From 3D ZIF Nanocrystals to Co-N x /C Nanorod Array Electrocatalysts for ORR, OER, and Zn-Air Batteries. Adv. Funct. Mater. 2018, 28. [Google Scholar] [CrossRef]
  19. Zhang, C.; Ou, Y.; Lei, W.-X.; Wan, L.; Ji, J.; Xu, Z. CuSO4/H2O2-Induced Rapid Deposition of Polydopamine Coatings with High Uniformity and Enhanced Stability. Angew. Chem. Int. Ed. 2016, 55, 3054–3057. [Google Scholar] [CrossRef] [PubMed]
  20. Zangmeister, R.A.; Morris, T.A.; Tarlov, M.J. Characterization of Polydopamine Thin Films Deposited at Short Times by Autoxidation of Dopamine. Langmuir 2013, 29, 8619–8628. [Google Scholar] [CrossRef] [PubMed]
  21. Qiu, P.; Ma, B.; Hung, C.-T.; Li, W.; Zhao, D. Spherical Mesoporous Materials from Single to Multilevel Architectures. Accounts Chem. Res. 2019, 52, 2928–2938. [Google Scholar] [CrossRef]
  22. Wu, P.; Zhang, Y.; Chen, Z.; Duan, Y.; Lai, Y.; Fang, Q.; Wang, F.; Li, S. Performance of boron-doped graphene aerogel modified gas diffusion electrode for in-situ metal-free electrochemical advanced oxidation of Bisphenol A. Appl. Catal. B Environ. 2019, 255, 117784. [Google Scholar] [CrossRef]
  23. Qu, K.; Wang, J.; Ren, J.; Qu, X. Carbon Dots Prepared by Hydrothermal Treatment of Dopamine as an Effective Fluorescent Sensing Platform for the Label-Free Detection of Iron(III) Ions and Dopamine. Chem. A Eur. J. 2013, 19, 7243–7249. [Google Scholar] [CrossRef] [PubMed]
  24. Datsyuk, V.; Kalyva, M.; Papagelis, K.; Parthenios, J.; Tasis, D.; Siokou, A.; Kallitsis, I.; Galiotis, C. Chemical oxidation of multiwalled carbon nanotubes. Carbon 2008, 46, 833–840. [Google Scholar] [CrossRef]
  25. Kundu, S.; Wang, Y.; Xia, W.; Muhler, M. Thermal Stability and Reducibility of Oxygen-Containing Functional Groups on Multiwalled Carbon Nanotube Surfaces: A Quantitative High-Resolution XPS and TPD/TPR Study. J. Phys. Chem. C 2008, 112, 16869–16878. [Google Scholar] [CrossRef]
  26. Zhang, J.; Zhang, G.; Jin, S.; Zhou, Y.; Ji, Q.; Lan, H.; Liu, H.; Qu, J. Graphitic N in nitrogen-Doped carbon promotes hydrogen peroxide synthesis from electrocatalytic oxygen reduction. Carbon 2020, 163, 154–161. [Google Scholar] [CrossRef]
  27. Wetchakun, N.; Chaiwichain, S.; Inceesungvorn, B.; Pingmuang, K.; Phanichphant, S.; Minett, A.I.; Chen, J. BiVO4/CeO2 Nanocomposites with High Visible-Light-Induced Photocatalytic Activity. ACS Appl. Mater. Interfaces 2012, 4, 3718–3723. [Google Scholar] [CrossRef] [PubMed]
  28. Kang, X.; Cai, W.; Zhang, S.; Cui, S. Revealing the formation mechanism of insoluble polydopamine by using a simplified model system. Polym. Chem. 2017, 8, 860–864. [Google Scholar] [CrossRef]
  29. Lu, Z.; Chen, G.; Siahrostami, S.; Chen, Z.; Liu, K.; Xie, J.; Liao, L.; Wu, T.; Lin, D.; Liu, Y.; et al. High-efficiency oxygen reduction to hydrogen peroxide catalysed by oxidized carbon materials. Nat. Catal. 2018, 1, 156–162. [Google Scholar] [CrossRef]
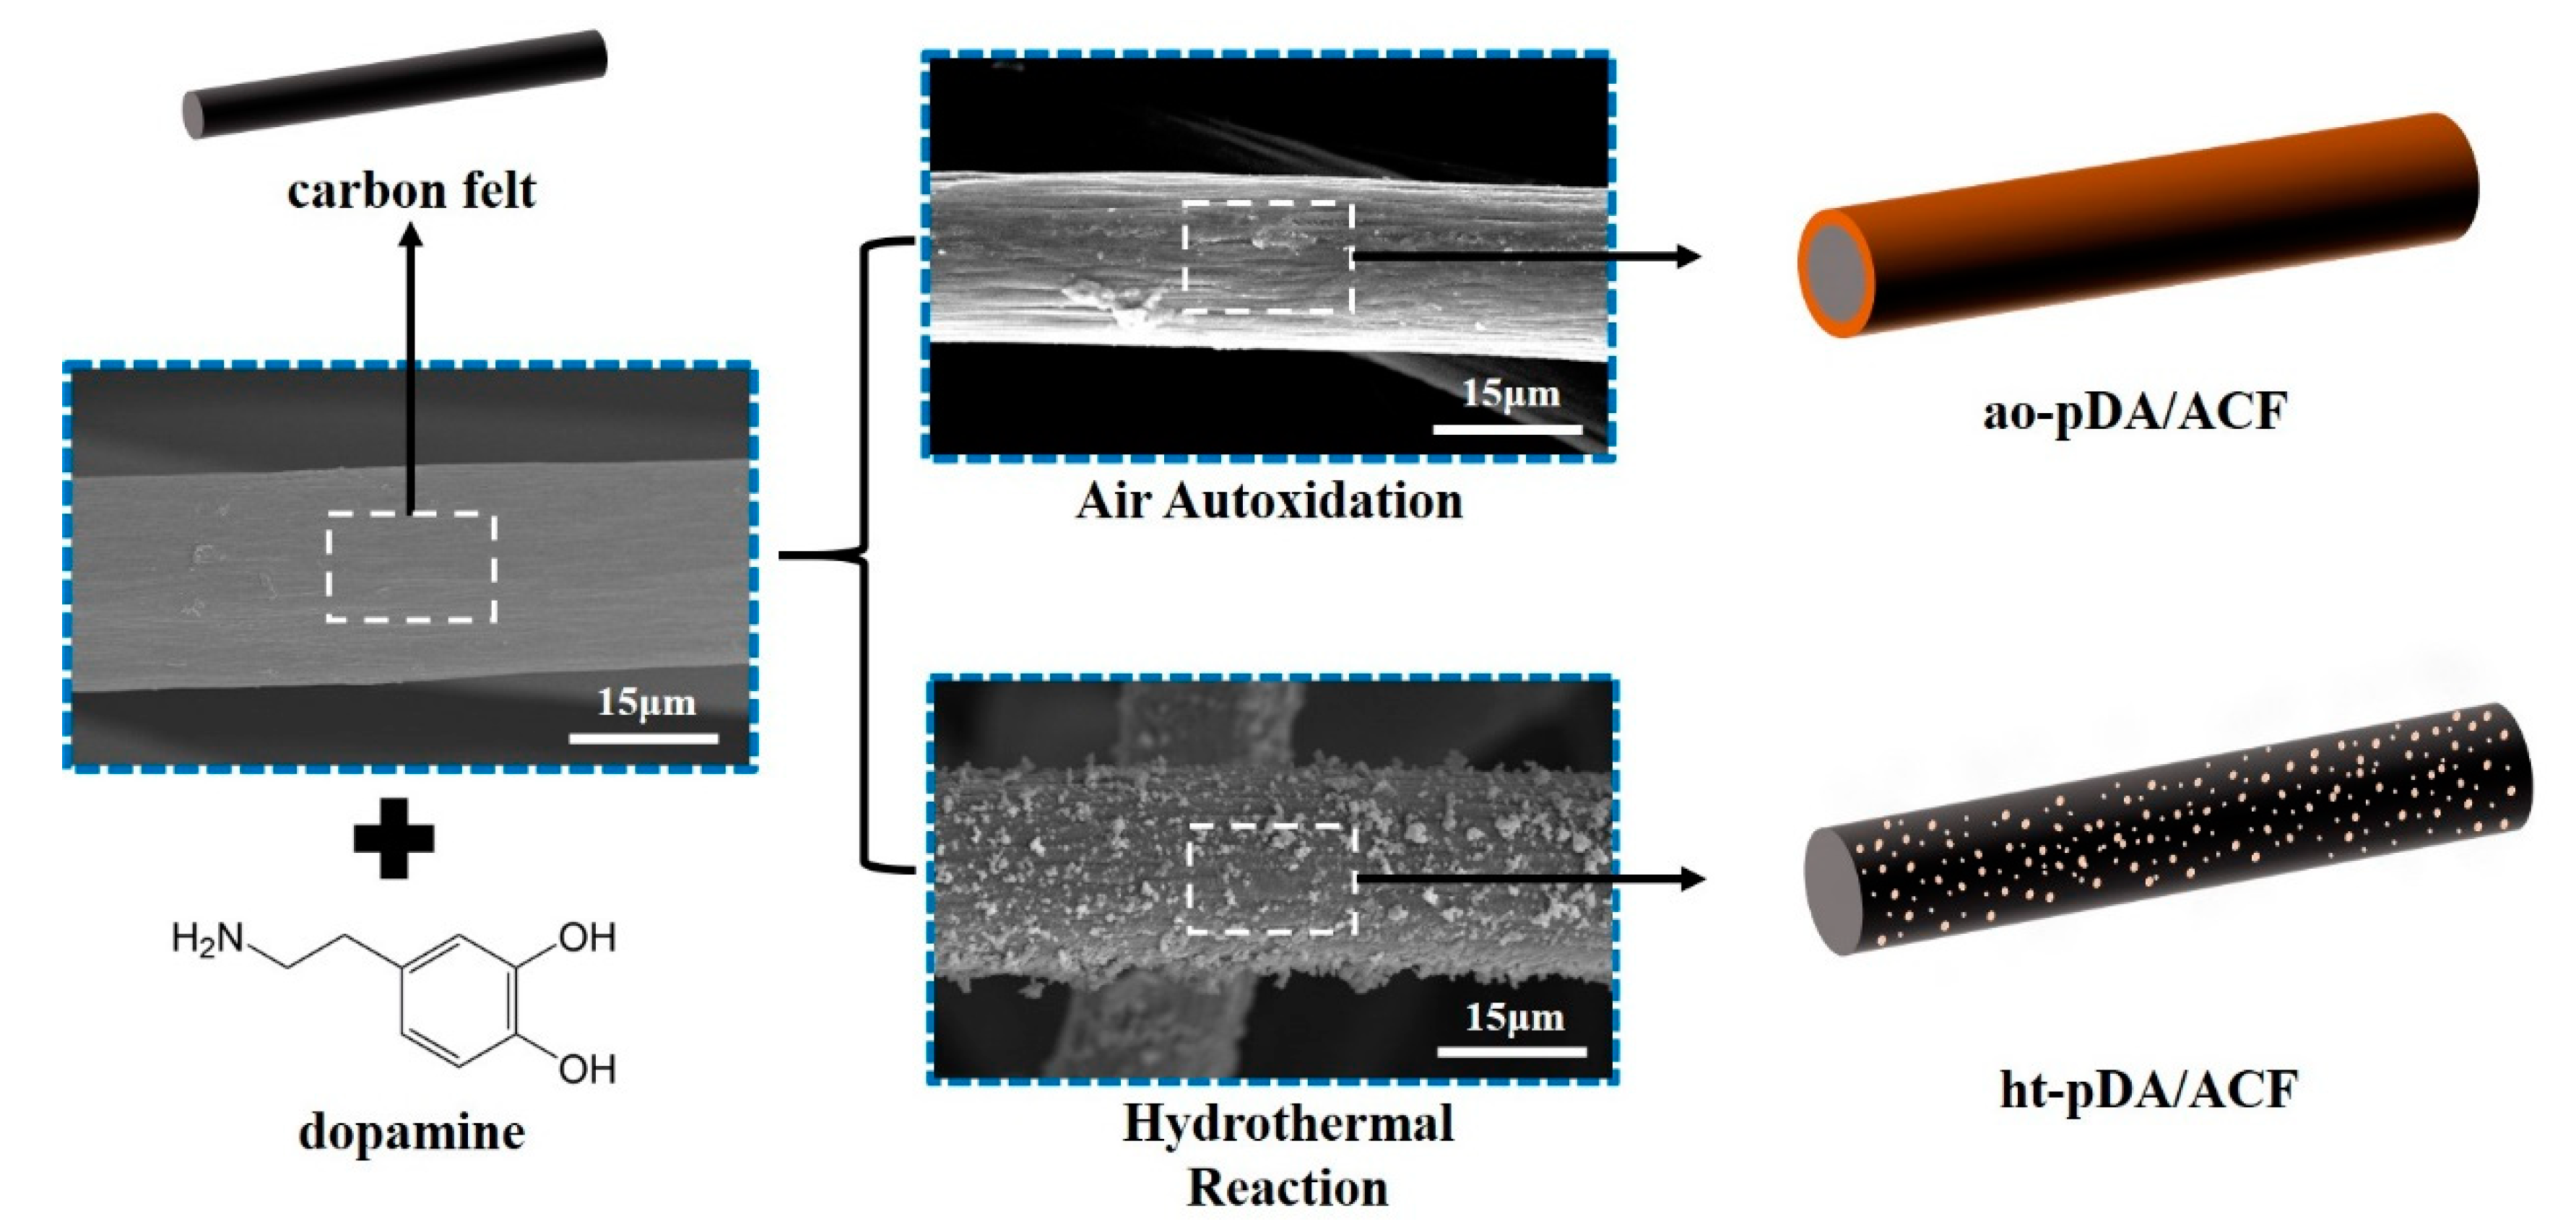
Figure 1. The preparation scheme of ao-pDA/ACF and ht-pDA/ACF.
Applsci 11 05371 g001
Figure 2. (a) The CV curve of carbon felt (curve 1), ACF (curve 2) and ht-pDA/ACF (curve 3) cathode at a scan rate of 10 mV/s from 0 V vs. Ag/AgCl to 1.0 V vs. Ag/AgCl in the electrolyte of 0.05 M H2SO4 (pH = 1) with saturated O2 (b) The CV curve of ht-pDA/ACF cathode at different scan rates from 1 mV/s to 100 mV/s (curve 4–curve 8).
Applsci 11 05371 g002
Figure 3. (a) The H2O2 production (mg/L) of carbon felt, ACF, ao-pDA/ACF and ht-pDA/ACF cathode (voltage: 2.0 V, electrolyte: 0.05 mol/L H2SO4 solution, anode: 1 cm×1 cm platinum plate, distance between two electrode: 1 cm). (b) The H2O2 production of the ht-pDA/ACF cathode under different voltages from 2.0 V to 2.4 V.
Applsci 11 05371 g003
Figure 4. The UV-visible spectra of polydopamine solution prepared by a hydrothermal process with different amounts of dopamine from 60 mg to 90 mg.
Applsci 11 05371 g004
Figure 5. The SEM images of carbon felt (a), ao-pDA/ACF (b) and ht-pDA/ACF (c,d).
Applsci 11 05371 g005
Figure 6. The Raman spectra of carbon felt (a), ao-pDA/ACF (b) and ht-pDA/ACF (c).
Applsci 11 05371 g006
Figure 7. The FT-IR spectra of carbon felt (a), ao-pDA/ACF (b) and ht-pDA/ACF (c).
Applsci 11 05371 g007
Figure 8. The C 1s XPS spectra of ht-pDA/ACF before (a) and after (b) electrolysis.
Applsci 11 05371 g008
Figure 9. The O 1s XPS spectra of ht-pDA/ACF before (a) and after (b) electrolysis.
Applsci 11 05371 g009
Figure 10. The N 1s XPS spectra of ht-pDA/ACF before (a) and after (b) electrolysis.
Applsci 11 05371 g010
Figure 11. The UV-visible spectra of methylene blue under different conditions. a: original; b: CF, only supplying O2; c: CF, only supplying electricity; d: CF, supplying O2 and electricity; e: ht-pDA/ACF, supplying O2 and electricity.
Applsci 11 05371 g011
Figure 12. The preparing mechanism of ht-pDA/ACF and ao-pDA/ACF.
Applsci 11 05371 g012
Figure 13. The mechanism diagram of H2O2 production on ht-pDA/ACF (oxygen atom: red sphere, hydrogen atom: blue sphere, pDA: white sphere).
Applsci 11 05371 g013
Table 1. The atomic percentage of ht-pDA/ACF before (a) and after (b) electrolysis.
As-Prepared (%)After (%)
Element (%)C 1s76.7176.58
N 1s17.0320.07
O 1s6.252.70
Group (%)C 1sC=C47.5745.34
C-N, C-O48.6444.48
-COOH3.7910.18
N 1sC-N-C38.9535.97
N-H61.0564.03
O 1sO-C70.2253.82
O=C29.7846.18
Publisher’s Note: MDPI stays neutral with regard to jurisdictional claims in published maps and institutional affiliations.