Article

Impact of Temperature on the Moisture Buffering Performance of Palm and Sunflower Concretes

1
Laboratoire des Technologies Innovantes, EA 3899—Université de Picardie Jules Verne, IUT Amiens, Avenue des Facultés, Le Bailly, CEDEX 1, 80025 Amiens, France
2
LMT-Laboratoire de Mécanique et Technologie, Université Paris-Saclay, ENS Paris-Saclay, CNRS, 94235 Paris, France
3
Institute of Research and Development, Duy Tan University, Danang 550000, Vietnam
4
Faculty of Natural Sciences, Duy Tan University, Danang 550000, Vietnam
*
Author to whom correspondence should be addressed.
Appl. Sci. 2021, 11(12), 5420; https://doi.org/10.3390/app11125420
Submission received: 30 April 2021 / Revised: 3 June 2021 / Accepted: 7 June 2021 / Published: 10 June 2021
(This article belongs to the Special Issue Biobased Building Materials)

Abstract

:
The use of bio-based materials (BBM) in buildings is an interesting solution as they are eco-friendly materials and have low embodied energy. This article aims to investigate the hygric performance of two bio-based materials: palm and sunflower concretes. The moisture buffering value (MBV) characterizes the ability of a material or multilayer component to moderate the variation in the indoor relative humidity (RH). In the literature, the moisture buffer values of bio-based concretes were measured at a constant temperature of 23 °C. However, in reality, the indoor temperature of the buildings is variable. The originality of this article is found in studying the influence of the temperature on the moisture buffer performance of BBM. A study at wall scale on its impact on the indoor RH at room level will be carried out. First, the physical models are presented. Second, the numerical models are implemented in the Simulation Problem Analysis and Research Kernel (SPARK) suited to complex problems. Then, the numerical model validated with the experimental results found in the literature is used to investigate the moisture buffering capacity of BBM as a function of the temperature and its application in buildings. The results show that the temperature has a significant impact on the moisture buffering capacity of bio-based building materials and its capacity to dampen indoor RH variation. Using the numerical model presented in this paper can predict and optimize the hygric performance of BBM designed for building application.

1. Introduction

Energy-efficient, insulated and poorly ventilated buildings can have a bad indoor air quality due to too high or too low relative humidity levels. An uncontrolled relative humidity increases the risk of exposure to bacteria, viruses and mold. These can have negative consequences on the health of occupants and reduce the comfort of indoor environments. Air conditioning systems permit maintaining optimal relative humidity levels but consume a lot of energy and increase the cost of bills. The moisture buffer capacity can moderate the relative humidity within a building, resulting in a naturally improved air quality and reduced energy consumption. Historically, the first research on the moisture buffer capacity was carried out at the Institute for Building Physics in Fraunhofer (Germany) and Lund University (Sweden) in 1960. Characterization of the moisture buffer value was carried out under dynamic conditions of relative humidity, hence the establishment of the standard for moisture buffering for experiments [1,2,3,4]. Following this method, the Padfield method [5] was developed which defines the moisture buffer value as a non-intrinsic property by making an analogy with thermal capacity [5]. Others methods have recently been developed by researchers such as the Japanese Industrial Standard [6], the NordTest project [7] and the ISO standard [8]. These methods consist in varying the relative humidity periodically with square or cyclic functions. These methods highlight the parameter of sorption of water vapor to characterize the moisture buffering value. It is predicted that these studies on the characterization of the MBV of building materials will remain a primary interest in order to refine the design of high energy-efficient and sustainable buildings.
In the literature, various authors have studied moisture buffering in the construction sector. Reviews have presented various experimental and numerical methods to quantify moisture buffering effects and their impact on the building scale (indoor RH and energy reduction). Research has been conducted to elucidate the physical, chemical and biological characteristics of building materials that have particularly high moisture buffer values [9,10,11,12,13,14,15,16,17,18,19,20,21,22]. One of the meta-analytical studies looked to see which properties are characterized in tandem with the moisture buffer value and which may be correlated with it [23]. These properties are: intrinsic physical properties and hygric properties dependent on relative humidity. The intrinsic physical properties are thickness, density and porosity. The study revealed that a simple least squares regression shows no relationship between thickness and the MBV. This may explain the fact that the majority of tests for the characterization of the MBV are based on the NordTest method [7]. The NordTest method is more used and is currently the main standard for characterizing the MBV of building materials. This method requires a sample thickness that is superior to its penetration depth. Moreover, a study carried out by Maskell et al. (2018) [24] on determining the optimum plaster thickness to dampen the indoor relative humidity showed that the MBV increases linearly with the thickness when it is lower than the penetration depth of the material. By deduction, analysis of the literature data has shown that a thickness higher than the penetration depth is a physical property of the material and is not a significant factor that can influence the value of the MBV. A porous medium is characterized by the combination of a solid matrix and a pore space that can be occupied by one or more fluids (liquid or gaseous form) [25]. The structure of porous materials is characterized by bulk density and porosity. These porous materials have a density which depends on their porosity. High porosity leads to a light material [26,27]. Kreiger and Srubar’s [23] analysis showed that there is a strong correlation between porosity and the MBV with an R2 of 0.46. This is predictable because a porous material has the potential to adsorb or desorb moisture through intra-/inter-pores. Although there is a relationship between porosity and density, the latter property has no correlation with the MBV. An analysis of Kreiger and Srubar [23] showed a correlation coefficient equal to 0.02 between the density and MBV. By deduction, it is possible to discuss the influence of the thickness of the material on the MBV, but the density has no relationship with the MBV, unlike the porosity, which has a very significant relationship. As a result, these scientific studies showed that porous materials allow passive and effective regulation of the indoor relative humidity thanks to their moisture buffer capacity.
The addition of fibrous matters from plant or animal origin to building materials has been conducted intuitively since antiquity [28,29]. However, scientific study of fiber-reinforced concretes made with mineral or synthetic fibers began in the early 20th century. Recently, in many studies, vegetable and organic fibers were used to substitute mineral or synthetic fibers in order produce bio-based building materials [29,30,31]. Bio-based concretes (such as hemp concrete, flax concrete, palm concrete and sunflower concrete) are dedicated to natural construction which is a means of achieving sustainable construction over time. These materials have very high porosity. They are produced by mixing bio-based aggregates, binder (cement, lime, etc.) and water. Bio-based concretes are a good response to limit the impact of buildings on the environment and meet the standards of thermal regulations (for example, RE 2020 in France) thanks to their thermal inertia and insulation which ensure better health of the occupants, thermal comfort and indoor air quality (IAQ) in the habitat [9,16,26,27]. Recently, a study of Tran Le et al. 2021 [32] showed that the combined dynamic sorption capacity (moisture and pollutant buffering capacity) of bio-based materials such as hemp lime concrete makes it possible to reduce the level of the indoor concentration of pollutants as well as the indoor relative humidity.
The MBV is a hygric property, which depends on the relative humidity of the surrounding ambience. Other hygric properties such as the permeability to water vapor (WV), sorption isotherm, penetration depth and mass transport coefficient may be correlated with the MBV. These hygric properties and boundary conditions depend on the relative humidity, which is also dependent on the temperature. Therefore, it should be noted that the temperature is an important factor influencing moisture buffer values.
A recent literature review carried out by Kreiger and Srubar [23] and a review conducted by the authors show that, to date, there is a lack of in-depth knowledge on the impact of the ambient temperature on the moisture buffer value of bio-based building materials. To overcome the lack of knowledge in the literature, the aim of this article is to examine the influence of the temperature on the moisture buffer performance of highly hygroscopic bio-based materials focusing on palm concrete (PC) and sunflower concrete (SC). It is aimed to underline that the MBV characterizes the ability of a multilayer material or simple layer to moderate the variation in the indoor relative humidity in buildings. In the literature, the MBV was determined at a constant temperature (e.g., 23 °C), while, in reality, the indoor temperature in buildings is under variable dynamic conditions. Some experimental studies found in the literature on hygroscopic materials [13,33,34] showed that the MBV is influenced by the temperature and the increase in temperature induces an increase in the MBV. For example, MBVs of palm concrete which were measured at 23 °C and 10 °C by Chennouf et al. (2018) [13] were 2.96 and 2.03 g/(m2%RH), respectively (with a percentage deviation of 31.42%). Therefore, it is necessary to carry out an in-depth study on the impact of the temperature on the MBV of bio-based materials designed for construction fields in order to predict and optimize their hygric performance. In this study, the impact of the temperature on the moisture buffering capacity of palm and sunflower concretes will be investigated at wall and room scales.

2. Numerical Model

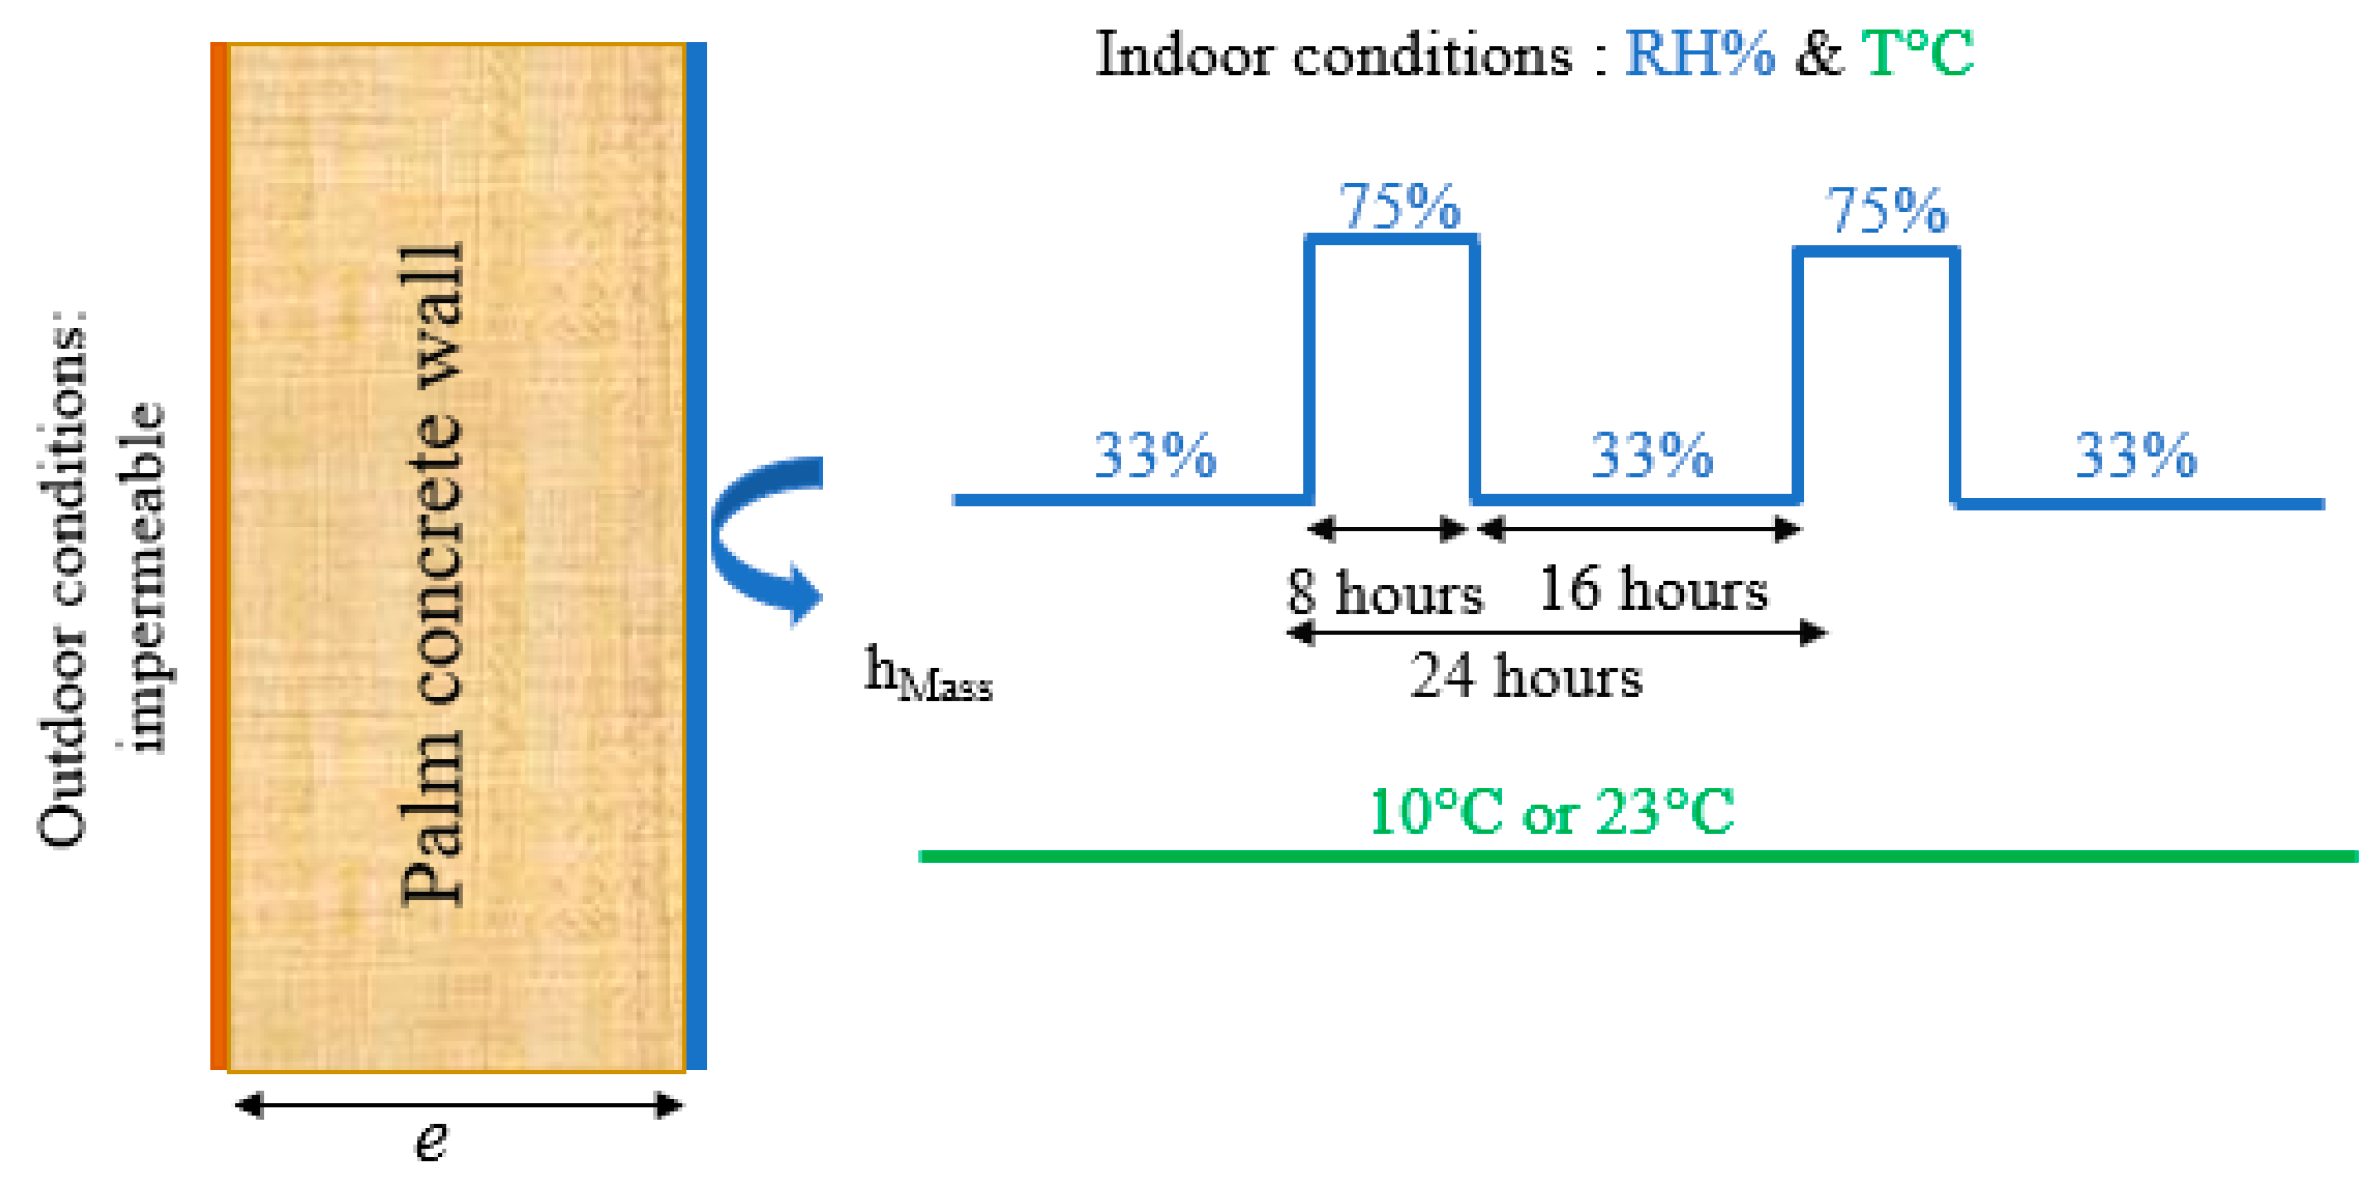
2.1. Mass Transfer Model in Single-Layer Wall

In this article, we use a model based on the theory of Philip and De Vries (1957) [35]. The moisture transport within a simple layered wall can be described by one-dimensional diffusion using the moisture content in the material as a driving force [35]. The mass balance equation is written as
θ t = x ( D θ θ x )
where θ is the moisture volumetric content in the material (m3 of water/m3 of material), and D θ is the diffusion coefficient of the moisture in the material (m2/s). The boundary conditions (in x = 0, outdoor environment, and x = L, indoor environment) are
ρ l ( D θ θ x ) | x = 0 , e = h M , e ( ρ v e , a , e ρ v e , s , e )
ρ l ( D θ θ x ) | x = L , i = h M , i ( ρ v e , s , i ρ v e , a , i )
where ρ v e , a , i and ρ v e , a , e are concentrations of water vapor in inside and outside air (kg/m3), ρ v e , s , i and ρ v e , s , e are concentrations of water vapor in the surface layers (inside and outside, (kg/m3)) and h M , e and h M , i are coefficients of exchange of water vapor by convection (m/s) for the external and internal surfaces.
The diffusion coefficient D θ is the total mass transport coefficient which is the sum of the liquid and vapor water phase:
D θ = D θ ,   v + D θ , l
In this article, we focus on the hygroscopic domain and the mass transport coefficient due to the liquid phase being negligible compared to that of water vapor ( D θ ,   l   D θ ,   v ), and therefore [36]
D θ = D θ ,   v   = π P v , s ( T ) ρ l   H R θ
The moisture sorption isotherm curve is a particularly important hygric property because it provides a true hygro-structural identity card of porous materials. It also impacts on the hygrothermal behavior of hygroscopic materials. Bio-based materials have high porosity and high sensitivity to moisture. These materials have the ability to adsorb and desorb water vapor, allowing for regulating the variation in the indoor relative humidity level in buildings [30]. When the humidity of the surrounding air increases, it results in an increase in mass. This mass gain is due to the phenomenon of physical adsorption. It allows water molecules to be fixed on surface pores in a reversible way. Likewise, a decrease in the humidity of the surrounding air results in an apparent loss of mass. This is the phenomenon of physical desorption.
Many theories analyze the shape of the experimental sorption isotherm curves. Langmuir’s model describes a monomolecular adsorption. The first adsorption layer for a porous middle is only verified at low humidity [37]. The Brünauer-Emmett-Teller model [38] is an extension of Langmuir theory, and it was developed to analyze multilayer adsorption. Additionally, the Guggenheim-Anderson-de Boer model [39,40], which was developed from two other models, will be used in this article to describe the sorption isotherm curves of the studied bio-based building materials. The GAB model [41] takes into account the heat of adsorption for all molecular layers and describes the dependence of the adsorption isotherm on the temperature. Using the GAB model has many advantages such as having a viable theoretical basis and giving a good description of the sorption behavior of bio-based concretes such as hemp lime concrete [42,43]. The GAB model can be written as follows [41]:
w = w m   C K φ ( 1 K φ ) ( 1 + K C φ K φ )
where wm is the water content (kg/kg). The parameters C and K are energy constants (J/mol) of the GAB model [40,41].

2.2. Effective Capacitance Model

The effective capacitance model assesses the impact of the use of hygroscopic materials on the variation in the indoor relative humidity of a room. The moisture buffering values which are obtained by experimental studies or by the numerical method will be used as input data in this model. Other parameters such as the ventilation rate, the effective exposed surface area, the source of water vapor, the exposure time and the room volume are also taken into account in the model. Note that the moisture buffering capacity of the simple wall is considered to be in equilibrium with the ambient conditions of the room [44]. The model which is established from the moisture balance for the room air can be written as follows (Equations (7) and (8)):
( V R v T i + 100 H I R V P v , s a t ( T i ) ) · P v i t = ( P v , e P v , i ) · n V 3600 R v T i + G v , p
H I R = ( k S k M B V k ) / V
where Sk is the exposed area of wall k (m2); V is the volume of the room (m3); HIR∗ is the hygric inertia of the room (kg/(m3%HR)); Rv is the gas constant for water vapor (462 J/(kg·K)); Ti is the indoor air temperature (K); Pv,e is the partial vapor pressure of the outdoor air (Pa); Pv,i is the partial vapor pressure of the indoor air (Pa); Pv,sat is the saturation vapor pressure (Pa); MBVk is the moisture buffer capacity of material k (g/(m2%RH)); Gv,p is the indoor water vapor production (kg/s); n is the ventilation rate (1/h).
The Simulation Problem Analysis and Research Kernel (SPARK) developed by the Lawrence Berkeley National Laboratory-USA, a simulation environment allowing for efficiently solving differential equation systems, has been used to solve this set of equations presented above [9,45,46,47]. Note that the SPARK describing the model has been solved using the finite difference technique with an implicit scheme.

3. Model Validation

3.1. Material Properties Used for Model Validation

Hygrothermal properties of palm and sunflower concretes were found in the literature and are grouped in Figure 1 [13,14]. The Guggenheim-Anderson-de Boer (GAB) model was applied to describe experimental sorption curves of two concretes [40]. The sorption isotherm curves modeled with the GAB model were validated by comparing with the measured values at a constant temperature of 23 °C for two bio-based concretes and are presented in Figure 1. The fitting GAB parameters (wm, C and K) of two concretes (PC and SC) are grouped together in Table 1 and were used to carry out the simulations in SPARK.

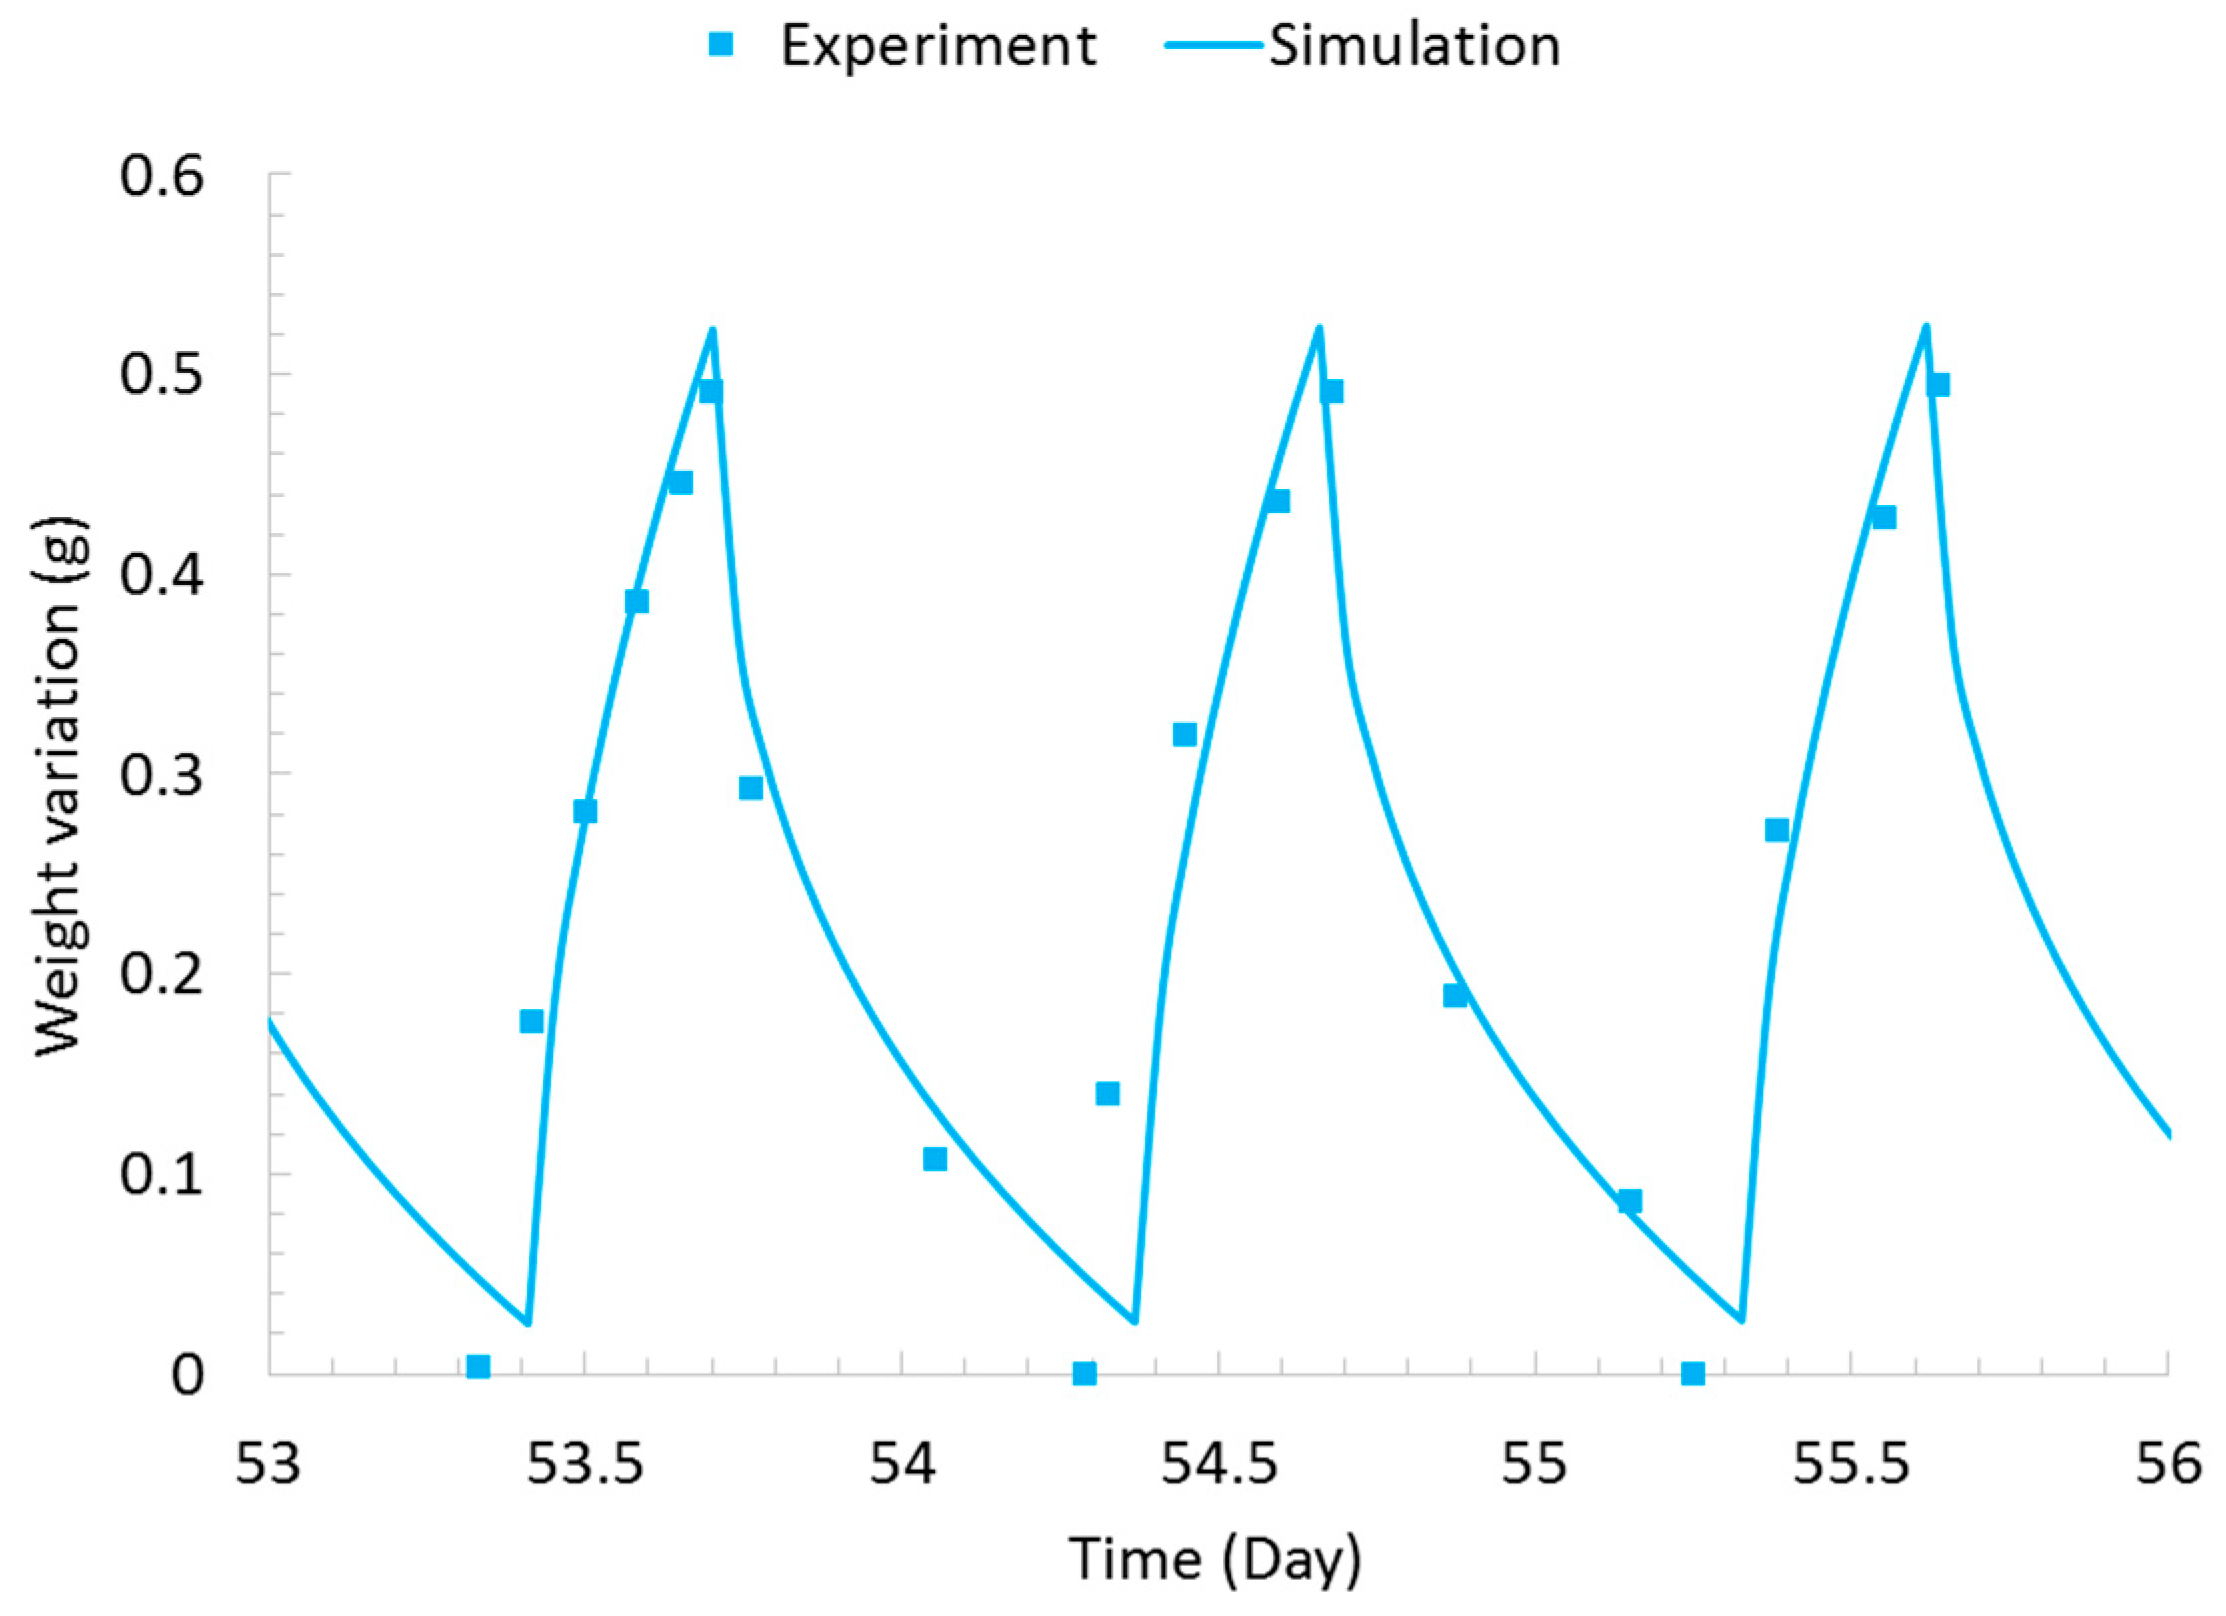
3.2. Model Validation

In order to validate the numerical model presented above, the numerical results obtained were compared with experimental ones found in the literature [13] carried out on a single-layer wall of palm concrete with a thickness of 9.5 cm. The experimental studies were performed by Chennouf et al. 2018 [13] to determine the values of the MBV at different temperatures, 10 °C and 23 °C. During the tests, the samples were conditioned beforehand at a relative humidity of 50% and were exposed to a constant temperature, while the RH was varied according to a square wave signal RH (t) having an adsorption phase of 8 h at 75% RH, followed by a desorption phase of 16 h at 33% RH. More details about the tests and experimental setup can be found in [13]. The experimental values of the moisture buffering capacity obtained according to the experimental protocol recommended in NordTest [7] are grouped in Table 2.
This numerical study aims to determine the moisture buffer capacity of palm concrete at two different temperatures, 10 °C and 23 °C, and then to compare with the experimental results. The boundary conditions of the simulation are defined by a single face of the wall which is permeable to water vapor, and the other faces are considered impermeable, as presented in Figure 2. Note that these simulation conditions are similar to experimental ones carried out in [13]. The interior convective mass transfer coefficient hM,i is 0.002 m·s−1. Concerning the interior RH variation, it was chosen according to the NordTest protocol [7] as mentioned in [13]; however, the temperatures for the two tests were fixed at 10 °C and 23 °C, respectively, to study the impact of T on the MBV. The MBV was calculated at the equilibrium state using the following equation:
MBV = Δ m S ( RH max RH min )
where Δm is the change in mass of the sample at the equilibrium state (kg), RHmin and RHmax are the minimum and the maximum relative humidity (% RH), respectively, and S is the exposed surface area (m2).
Regarding the numerical solution, the simulation time step was set to 240 s, and the wall thickness was discretized into 50 nodes. The hygrothermal properties used for the simulation are presented in Figure 1 and Table 2.
The numerical results obtained are the mass variation curves at the equilibrium state of the palm concrete at different temperatures, 10 °C and 23 °C. They are then compared to the ones obtained experimentally by Chennouf et al. (2018) [13], which are shown in Figure 3 and Figure 4. We remark that the change in mass follows the change in the indoor relative humidity due to the sorption phenomenon. Using the numerical results, the numerical values of the MBV of palm concrete at various temperatures, 10 °C and 23 °C, were calculated and are grouped in Table 3. Note that, in addition to the PC case, the model was used to calculate the MBV of SC at 23 °C, and the results are presented in Table 3. The comparison between numerical results obtained and the experimental values found in the literature shows a very good agreement. Note that MBV values of palm concrete at 10 °C and 23 °C are classified as excellent according to the NordTest classification [7]. It can also be observed that, concerning PC, there is a significant difference between the two MBVs obtained at two different temperatures, in which the MBV obtained at 23 °C (MBV = 2.96 g/(m2%RH) is higher than the one obtained at 10 °C (MBV = 2.03 g/(m2%RH). The difference observed between the MBV values at different temperatures can be explained by the fact that the temperature influences the adsorption and desorption equilibrium between the material and the surrounding environment due to the different levels of water vapor pressure. In Table 4, it can be seen that the saturation pressure of water vapor at 10 °C is 1241.2 Pa compared to 2842.1 Pa at 23 °C; therefore, for the same relative humidity, the water vapor pressure (Pv) should be different, which depends on the temperature. At 10 °C, when RH varies from 33% to 75%, Pv increases from 409.6 to 930 Pa (ΔPv = 521.3 Pa) compared to the variation from 937.9 to 2131.6 Pa (ΔPv = 1193.7 Pa) when T = 23 °C.
As it is shown in Figure 3 and Figure 4, the comparison shows a good agreement between the numerical results and experimental ones, and the numerical model satisfies investigating the hygric behavior of bio-based building materials at different temperatures.

4. Numerical Study and Discussions

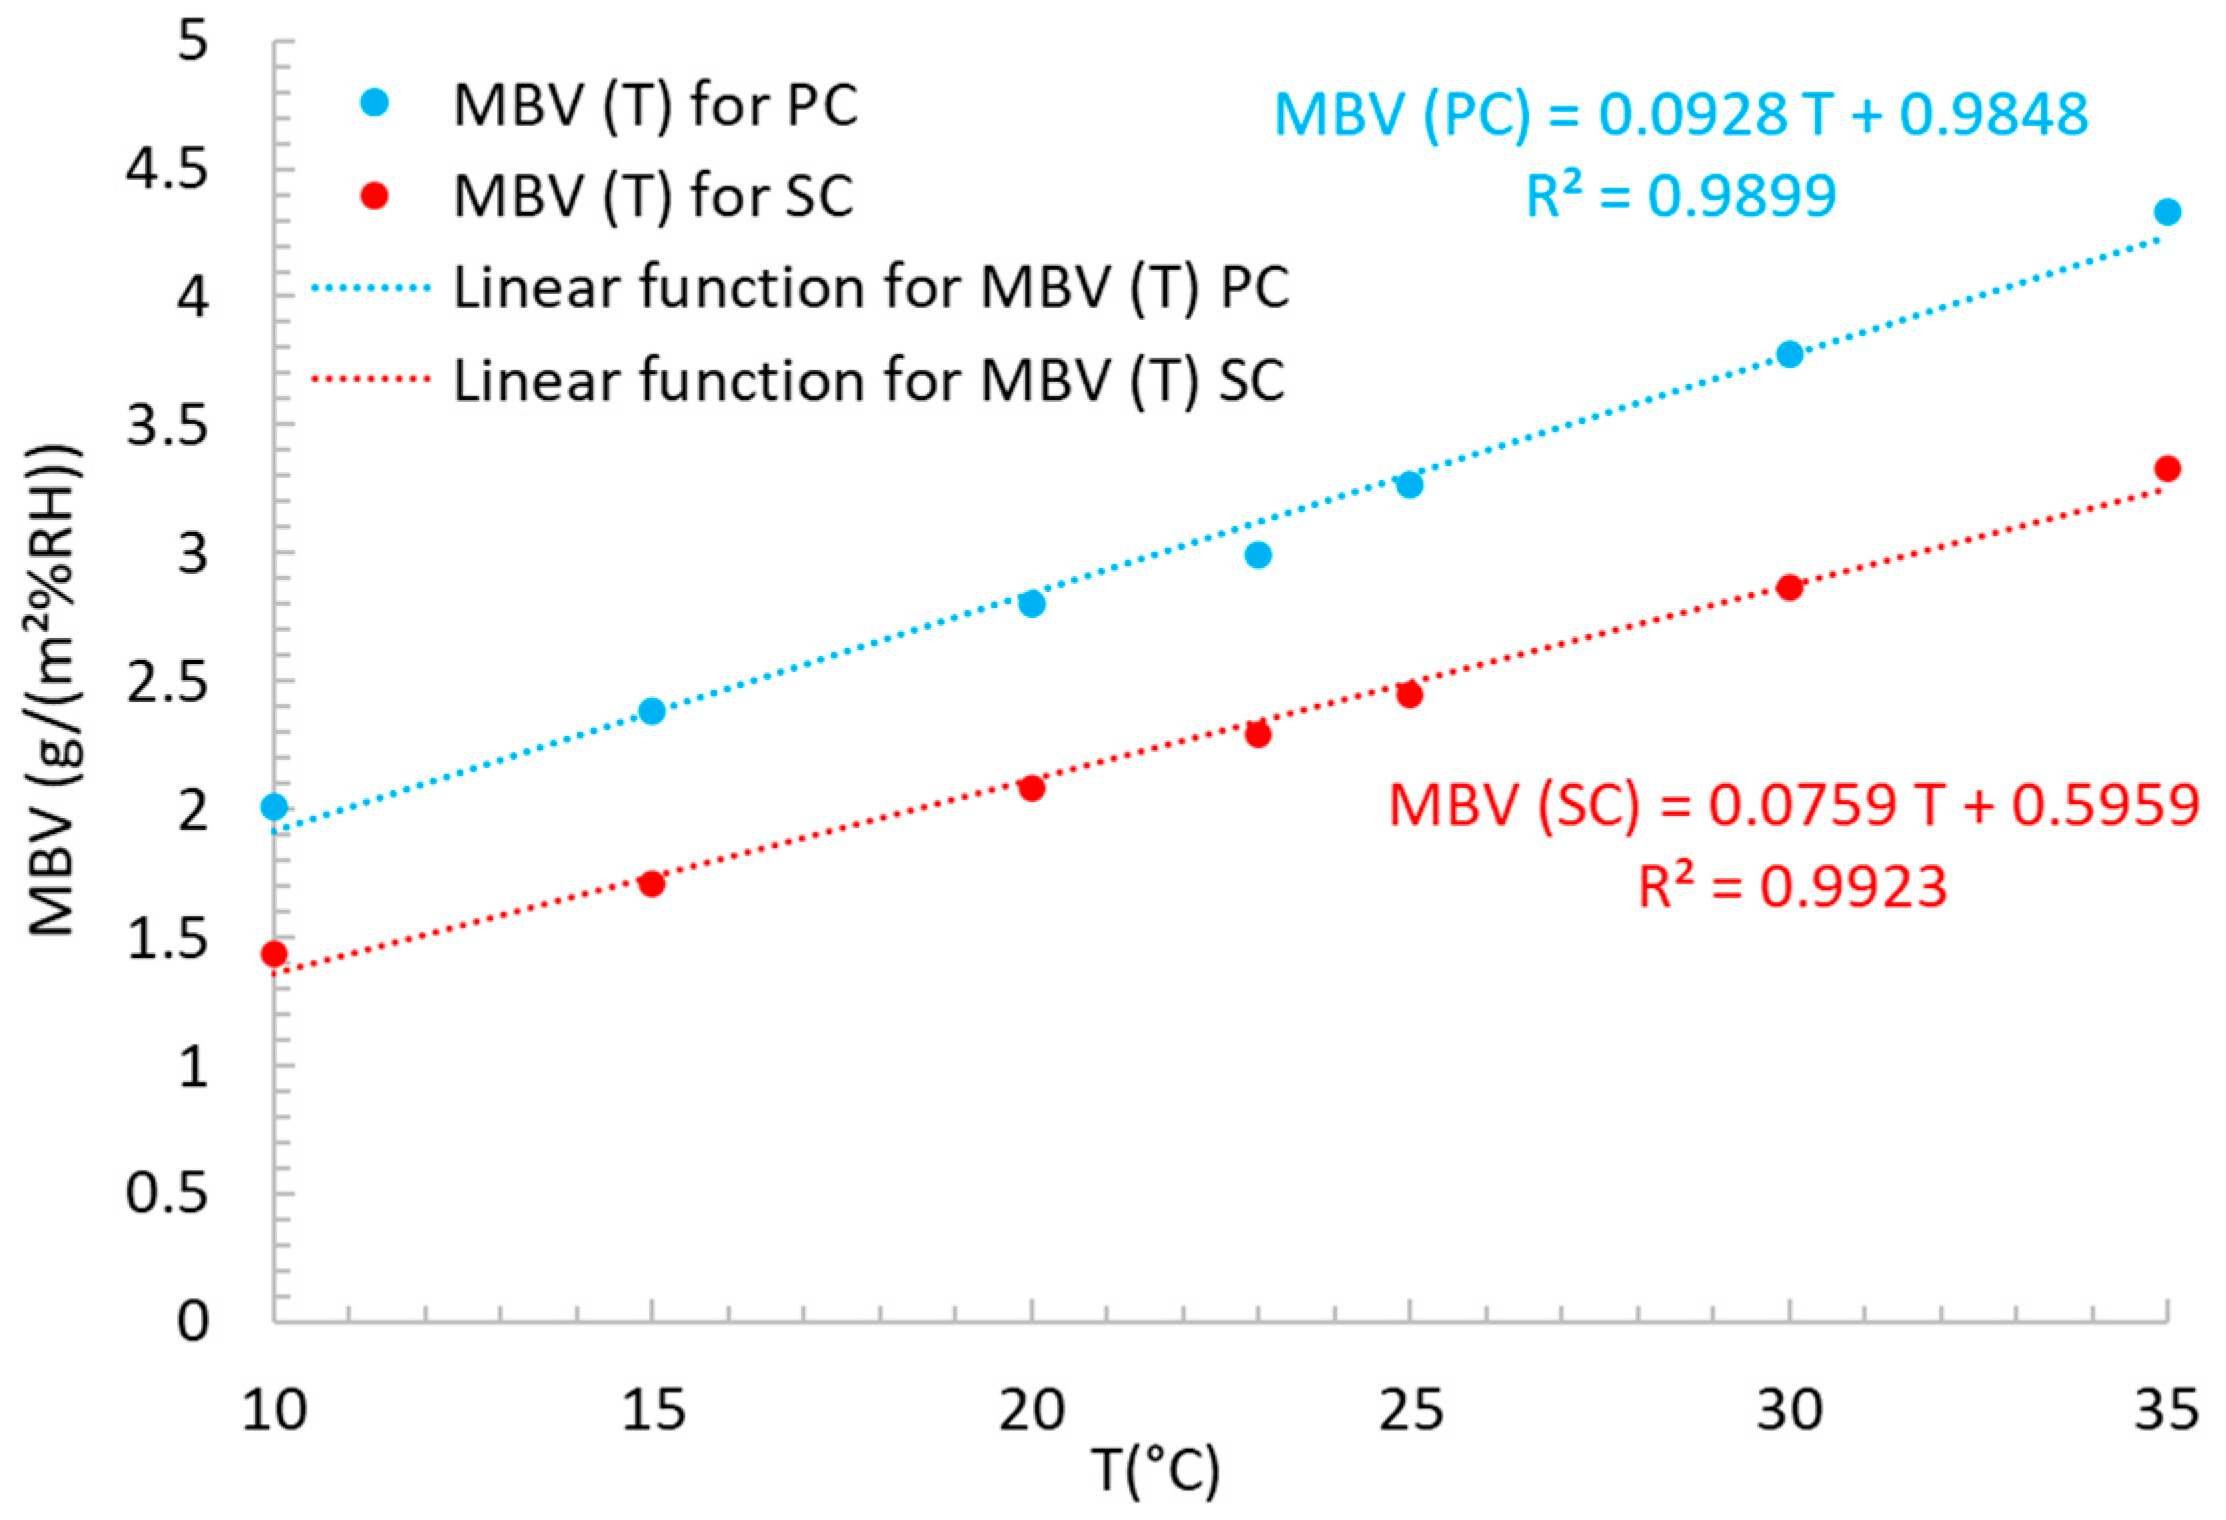
4.1. Influence of Temperature on the Moisture Buffering Capacity and Classification of Bio-Based Materials

The experimental studies carried out on palm concrete (PC) showed that the temperature has a significant impact on the MBV. Therefore, a study focusing on the influence of the temperature on the moisture buffering capacity is necessary in order to evaluate, analyze and optimize the hygric performance of bio-based materials.
In this section, the physical model and the boundary conditions are the same as the ones used in the section dedicated to the model validation. A wall thickness of 10.0 cm is considered for both bio-based concretes (PC and SC). The simulations are performed on a range of temperatures which vary from 10 to 35 °C, with a step of 5 °C. The hygrothermal properties used are the ones obtained experimentally and presented in Figure 1 and Table 2. The outputs of the simulation are the mass variation of the samples according to the variation in the indoor relative humidity and MBV at different temperatures. The numerical values of the MBV of two materials are calculated, compared and presented in Figure 5.
In Figure 5, it can be observed that increasing the temperature will increase the moisture buffer value. As explained above, this is due to the fact that increasing the interior temperature will influence the vapor pressure gradient of the surrounding environment. Table 4 and Figure 6 show the dependence of the saturation pressure of water vapor on the studied range of temperatures, going from 10 to 35 °C, and the vapor pressure/water vapor concentration as a function of the temperature and relative humidity. At a temperature of 10 °C, when the surrounding relative humidity varies from 33% to 75%, the water vapor pressure Pv varies from 409.6 to 930.9 Pa (ΔPv = 521.3 Pa) compared to the variation from 1879 to 4270.4 Pa (ΔPv = 2391.4 Pa) at a temperature of 35 °C. This significant difference in the water vapor pressure gradient results in a significant influence on the MBV obtained and classification, as shown in Figure 5.
Most bio-based concretes are excellent regulators of indoor relative humidity. This is due to the microstructure of vegetal particles (see Figure 7 and Figure 8) that are incorporated in bio-based concretes. As it is shown in Figure 7 and Figure 8, these vegetal particles have a tubular structure with interconnected pores very permeable to water vapor. The MBV values vary from 1.44 to 3.33 and from 2.01 to 4.33 g/(m2%RH) for SC and PC when the temperature varies from 10 to 35 °C, respectively. According to the classification of moisture buffer values of building materials suggested in the NordTest project [7], it can be seen that sunflower concrete is classified as good for the studied temperatures, ranging from 10 to 15 °C, and is classified as excellent beyond this temperature range, while for the palm concrete case, it is classified as excellent for all temperatures, as shown in Figure 5. The difference between the moisture buffering capacity of the two bio-based materials can be explained by sorption curves, as shown in Figure 1. It can be seen that they are similar when the RH is lower than 50% RH, but after that, the palm concrete has a higher adsorption capacity compared to SC. This reflects a very high hygroscopic property of palm concrete which is very interesting for regulating the surrounding relative humidity thanks to its sorption capacity of vapor water.
This present study shows that the temperature influences the MBV of bio-based concretes and the classification of the moisture buffer capacity. Note that in the studied range of temperatures, the MBV increases quite linearly as a function of the temperature due to the increasing water vapor pressure as well as the density of the water vapor (ρv,e) with increasing temperature. The numerical results permit establishing a relationship between the MBV and temperature. Two linear models are proposed and presented in Figure 9, MBV PC ( T ) and MBV SC ( T ) for PC and SC concretes, respectively:
MBV PC ( T ) = 0.0928   T + 0.9848
MBV SC ( T ) = 0.0759   T + 0.5959
Based on the obtained results, a regression coefficient (slope) of 0.0844 for other hygroscopic bio-based materials can be defined, but further experimental studies need to be conducted to verify this assumption.

4.2. Impact of the Moisture Buffering Capacity on Indoor Relative Humidity of an Office Room

4.2.1. Description of Studied Case and Simulation Conditions

In the previous sections, it was shown that the moisture buffering capacity is a property which depends on several factors such as porosity and temperature. The indoor relative humidity is one of most important factors to consider for evaluating indoor air quality and hygrothermal comfort [23]. Low and high indoor humidity (lower 40% or upper 60%) promotes the dehydration of materials and people (fissure and health problem), the development of molds and the survival of viruses and bacteria and increases the concentrations of polluting particles [32,50]. Therefore, to meet the hygrothermal comfort conditions, it is interesting to elucidate the impact of the moisture buffering capacity on the indoor relative humidity. This section aims is to study the effect of the moisture buffering capacity at different temperatures of palm and sunflower concretes on the indoor relative humidity of an office room. In addition, the impact of the MBV will be assessed by a sensitivity study.
In this section, the impact of the MBV on the hygric performance was investigated by considering an office room of 55 m3 (4 m × 5.5 m × 2.5 m), depicted in Figure 10. The effective capacitance model presented in Section 2.2. was used [44]. An effective surface area of 37.5 m2 is considered as the reference case (the roof and the floor are considered impermeable to water vapor; therefore, they are without moisture buffering capacity). The outdoor relative humidity is 50%. The office room is occupied from 9:00 a.m. to 17:00 p.m. (8 h a day) by two persons, and a ventilation rate of 0.65 ACH is considered. The values of the moisture buffering capacity obtained by the simulation at different temperatures in the previous section are used to perform the simulations.

4.2.2. Impact of Moisture Buffering Capacity Classification on Indoor RH

In this subsection, the impact of the MBV classification proposed in the NordTest project [7] on the indoor relative humidity at the room scale is studied. For this purpose, simulations were carried out by varying the MBV value from 0 to 4 g/(m2%RH), with a step of 0.5. Figure 11 shows the results of the comparative study of the influence of the MBV value on the indoor RH variation. It can be seen that, at the equilibrium state, the indoor RH variation is periodic (according to the occupied period) and the impact of the MBV on the variation in the indoor relative humidity is significant. A higher MBV results in a lower indoor relative variation. Numerically, as it is shown in Figure 11 and Table 5, when the hygric inertia of the walls is neglected (MBV = 0 g/(m2%RH), the case without moisture buffering capacity), the amplitude (AMBV=0) is 23% compared to A(MBV=1) = 15%, A(MBV=2) = 8%, A(MBV=3) = 6% and A(MBV=2) = 5% when the MBVs are equal to: 1, 2, 3 and 4 g/(m2%RH), respectively. These obtained results show that the moisture buffering capacity can reduce the indoor RH variation and needs to be taken into account in building design.
In order to quantify the hygric regulation capacity, we define a coefficient, f = A/A0, which represents the ratio between the amplitude of variation in the indoor RH with and without taking into account the hygric buffer capacity of the walls (A < A0 in which A0 corresponds to the case without moisture capacity). A low f ratio represents a higher quality of comfort. The results obtained are presented in Figure 12 and Table 5. Figure 12 shows the variation in the f coefficient according to the classification of the MBV suggested by the NordTest project [7]. Note that the f value decreases with increasing moisture buffering capacity; therefore, a lower f coefficient is observed for a higher MBV value, as shown in Figure 12 and Table 5. When the MBV is classified from negligible to moderate, the f value decreases from 1 to 0.65 compared to 0.39 to 0.22 for the excellent MBV classification. Note that beyond the MBV value of 3.5 g/(m2%RH), the f value decreases very slowly and tends towards an asymptotic value which means that the moisture buffering potential of BBM has been fully utilized. In addition, it can be observed in Table 5 that indoor RHmin increases with the increased MBV value, contrasting with RHmax, which can be explained by the phenomenon of water vapor sorption (adsorption and desorption) of BBM.
The results obtained are interesting and confirm that the use of bio-based building materials which are hygroscopic thanks to the microstructure of vegetal fibers results in higher hygrothermal comfort in buildings. This conclusion is supported by other studies in the literature [30,32,51].

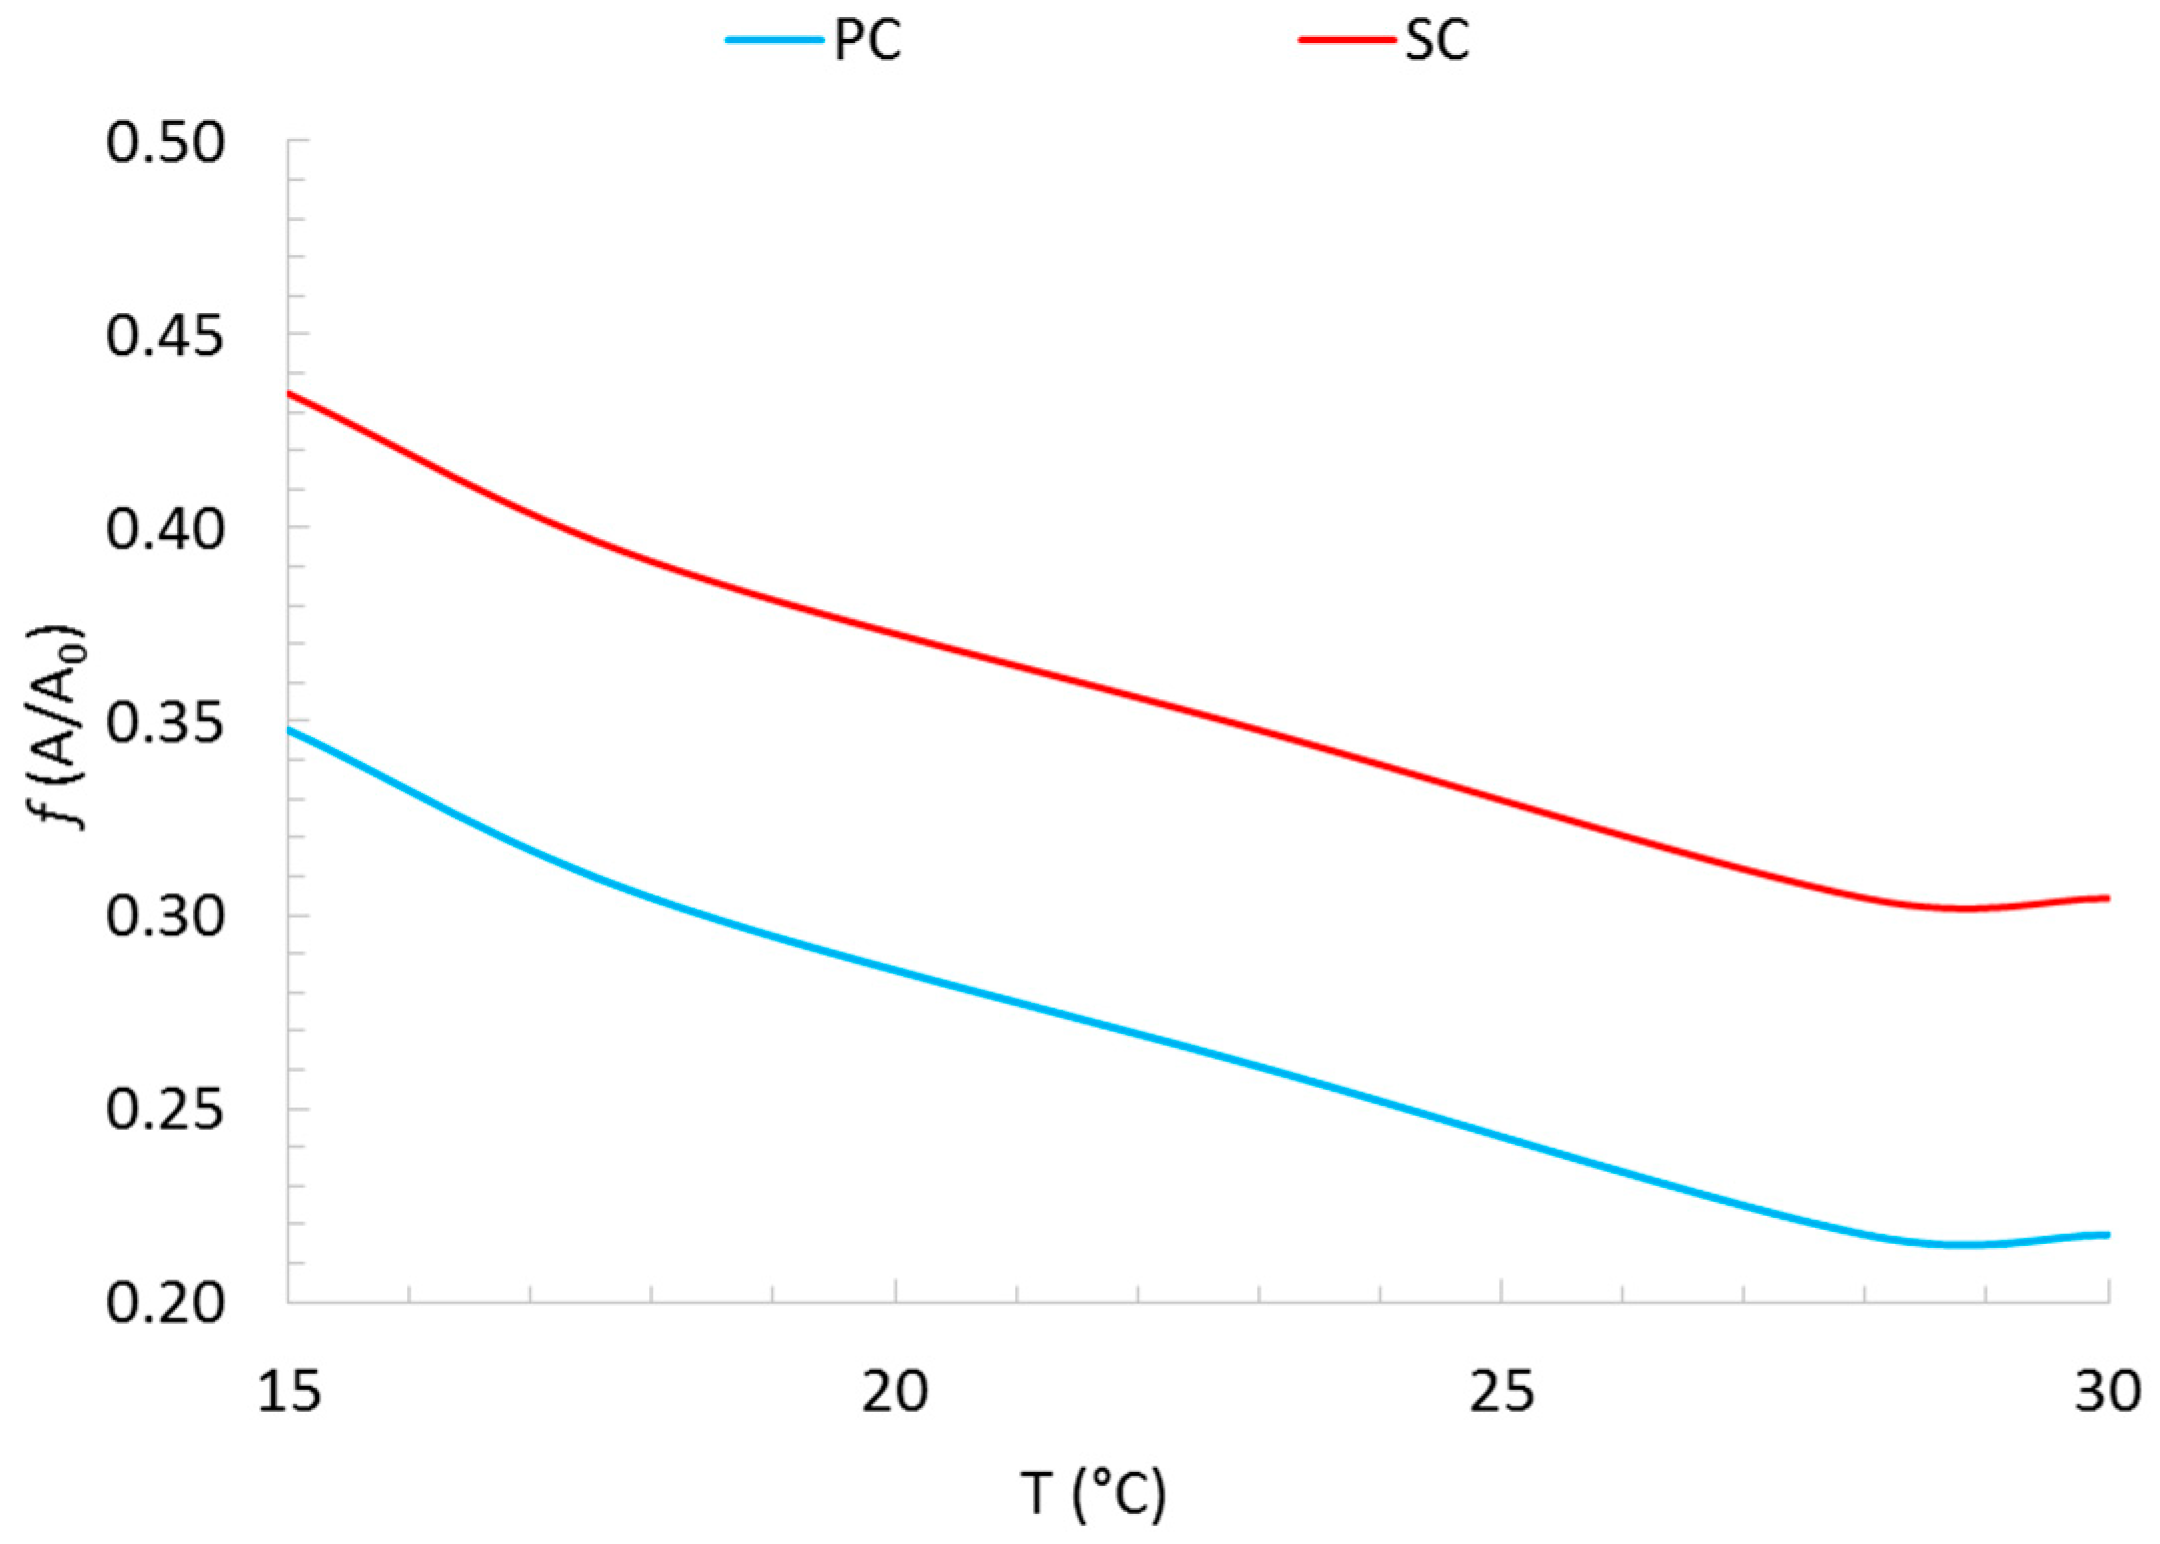
4.2.3. Impact of Temperature on the Performance of PC and SC

In order to study the influence of the temperature on the performance of PC and SC on indoor relative humidity of the studied office room, the following different temperatures were considered: 15 °C, 18 °C, 23 °C, 28 °C and 30 °C. To perform the simulations, the values of the moisture buffering capacity as a function of the temperature calculated from Equations (7) and (8) were used. Figure 13 and Table 6 show the results of the comparative study of the two studied concretes (PC and SC). It can be seen that the impact of the temperature on the indoor RH variation is significant for the two bio-based concretes. When the temperature increases, the f coefficient decreases because the MBV increases for the two bio-based concretes. However, the impact also depends on the considered temperature; beyond 28 °C, the f values for PC and SC are quite stable and equal 0.22 and 0.30, respectively. It can be concluded that the indoor temperature influences the moisture buffering capacity of the bio-based concretes which in turn impacts the indoor RH variation in buildings. This impact should be taken into account to correctly predict the moisture buffering performance of bio-based building materials.

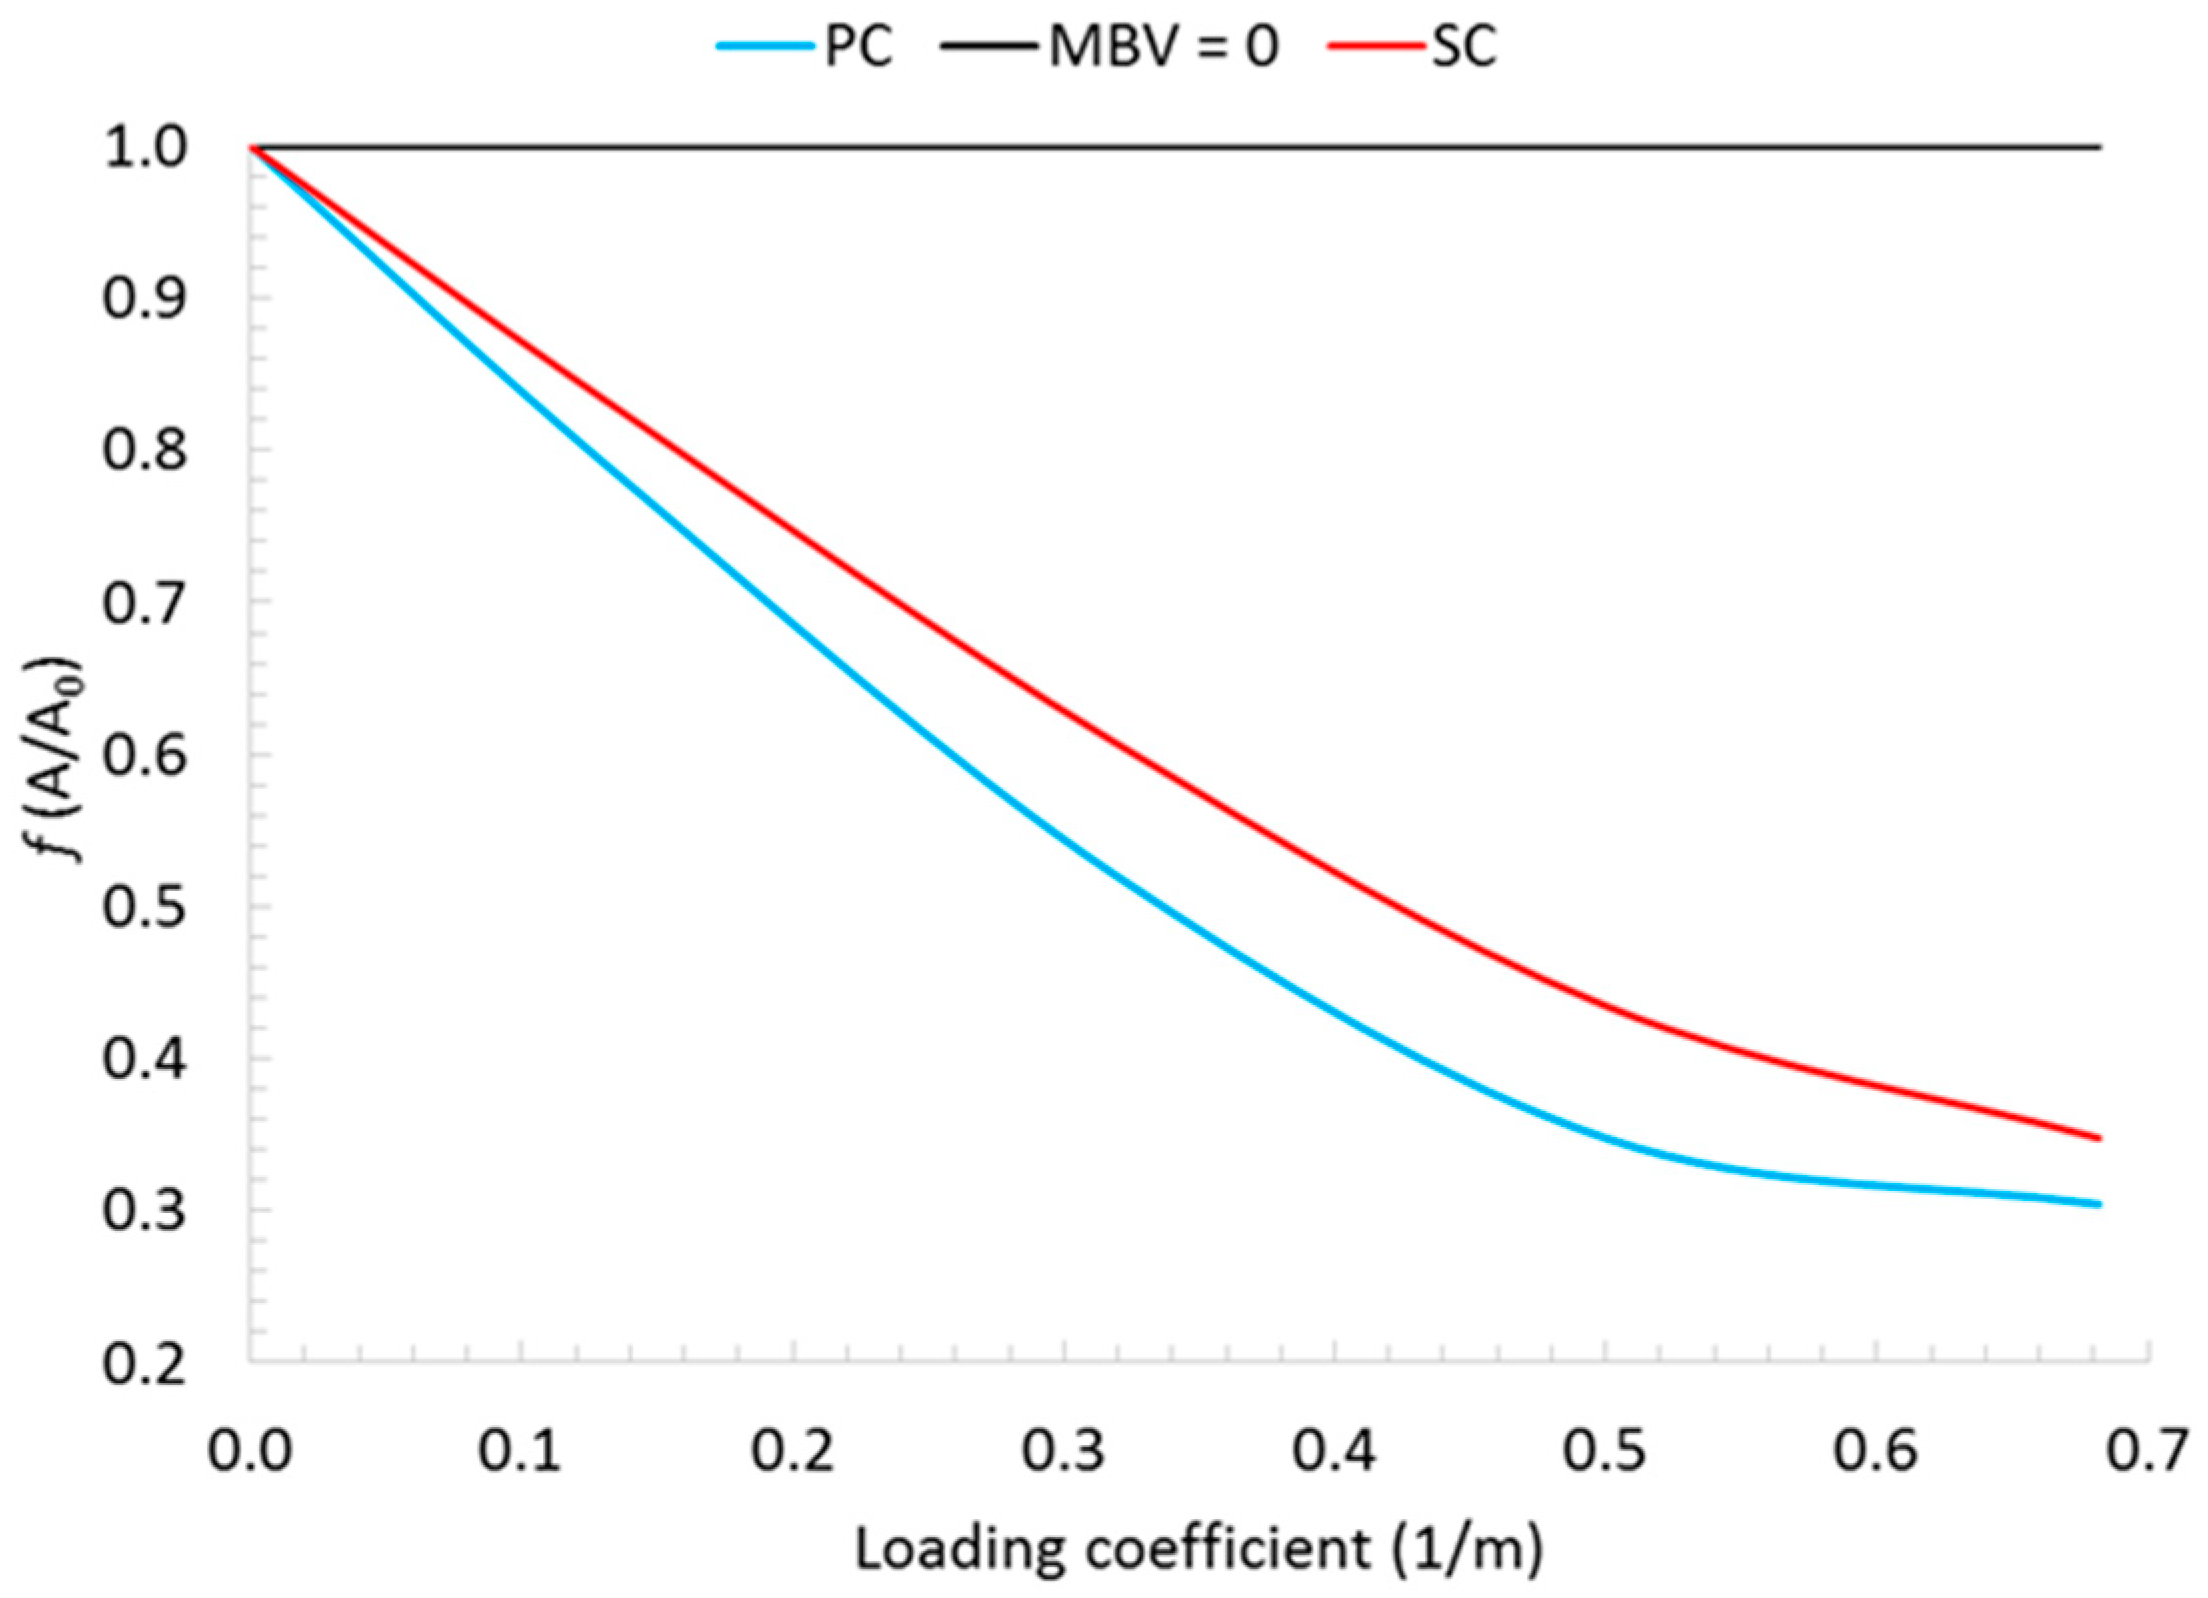
4.2.4. Impact of Exposed Surface Area on Indoor RH Variation

The moisture buffering potential of bio-based materials will be fully utilized when the material is directly exposed to indoor air. Regarding the material selection process in building design, it is important to study the effect of the exposed surface area and the loading ratio (the ratio of the wall surface area to the volume of the office room) of BBM on the hygric performance. In this section, a parametric study is carried out by varying the effective exposed surface area (Aef) of the room office from 0 to 37.5 m2, with a step of 10 m2. The MBV values of PC and SC used for the simulations are those obtained at the reference condition (at 23 °C). Other parameters used for the simulation are the ones presented in Section 4.2.1. Figure 14 and Table 7 and Table 8 show the influence of Aef on the variation in the indoor humidity. It can be seen that the increasing exposed surface area or loading coefficient (Aef/V) will reduce the amplitude of the indoor RH variation and f value. This can be explained by the increase in the quantity of water vapor exchanged between the wall and the indoor environment due to the sorption phenomenon of BBM. Compared to PC, the f value of SC is lower because its moisture buffer value is higher. Numerically, with a loading coefficient of 0.68 m−1, the f values for SC and PC are 35% and 30%, respectively, while they are 83% and 78% for a loading coefficient of 0.14 m−1. The results show that the use of palm concrete (PC), which has a very high hygroscopic property, is very interesting for regulating the indoor relative humidity. However, as it can be seen in Figure 14, beyond a loading coefficient of 0.5 m−1, the impact of the increasing exposed surface area on the indoor RH of the room is not significant. The results obtained are very interesting and suggest that a reasonable combination between the MBV and the Aef can be established in order to optimize the use of BBM in buildings.

5. Conclusions

The major contribution and novelty of this study are found in showing that the moisture buffer capacity and performance of hygroscopic bio-based materials can be influenced significantly by different parameters, and especially the temperature. The numerical model was presented and validated. The simulations were carried out focusing on the hygric performance of palm and sunflower concretes from wall to room levels.
At the wall scale, both numerical and experimental results confirm that the moisture buffer value is influenced by the temperature for the two studied bio-based materials. The higher the temperature, the higher the value of the MBV, due to the impact of the temperature on the water vapor pressure and the water vapor density. In addition, this study shows that the temperature needs to be taken into account to well define the MBV classification of BBM (especially for the SC in this study). Based on the numerical results, two models which express the moisture buffer values as a function of the temperature (MBV = f (T)) for PC and SC were proposed for application in buildings.
At the room scale, the results obtained show that bio-based building materials (PC and SC) can contribute to dampen the indoor RH variation. The f coefficient (f = A/A0) was also proposed to represent the moisture buffering capacity of materials in reducing the indoor RH variation, which is very useful for possible consideration in future standards. The results highlight that the MBV, the temperature and the effective exposed surface area have a significant impact on indoor hygrothermal comfort. The indoor temperature influences the MBV, which in turn impacts the indoor RH variation in buildings, and therefore it is necessary to take into account correctly predicting the moisture buffering performance of BBM.
Finally, this article suggests that an adequate combination between the MBV (as a function of T) and exposed surface area, which can be considered as key parameters, should be established to optimize the use of bio-based concretes in building design.

Author Contributions

Conceptualization, A.D.T.L.; Data curation, F.D.I.; Investigation, F.D.I., A.D.T.L., A.B., G.P., S.T.N., O.D. and L.L.; Supervision, A.D.T.L. and T.L.; Validation, F.D.I.; Writing—original draft, F.D.I.; Writing—review & editing, A.D.T.L., A.B., G.P., S.T.N., O.D., L.L. and T.L. All authors have read and agreed to the published version of the manuscript.

Funding

This research received no external funding.

Institutional Review Board Statement

Not applicable.

Informed Consent Statement

Not applicable.

Data Availability Statement

Not applicable.

Conflicts of Interest

The authors declare no conflict of interest.

Nomenclature

CEnergy constant of GAB model
CpSpecific heat at constant pressureJ·kg−1·K−1
DθMass (vapor and liquid) transport coefficient associated with a moisture content gradientm2·s−1
Dθ. lLiquid transport coefficient associated with a moisture content gradientm2·s−1
Dθ. vVapor transport coefficient associated with a moisture content gradientm2·s−1
hMConvective mass transfer coefficientm·s−1
KEnergy constant of GAB model
MBVMoisture buffer valueg/(m2%RH)
TTemperatureK
wMoisture contentkg·kg−1
wmMonolayer moisture contentkg·kg−1
φRelative humidity%
πWater vapor permeabilitykg·m−1·s−1 Pa−1
θMoisture volumetric contentm3·m−3
µWater vapor diffusion resistance factor

References

  1. Arundel, A.V.; Sterling, E.M.; Biggin, J.H.; Sterling, T.D. Indirect health effects of relative humidity in indoor environments. Environ. Health Perspect. 1986, 65, 351–361. [Google Scholar] [PubMed] [Green Version]
  2. Bergen, J. House air. Science 1911, 34, 407–408. [Google Scholar] [CrossRef]
  3. Djongyang, N.; Tchinda, R.; Njomo, D. Thermal comfort: A review paper. Renew. Sustain. Energy Rev. 2010, 149, 2626–2640. [Google Scholar] [CrossRef]
  4. Kent, W.; Crowell, W.J.; Jones, L.C. The air we breathe. Science 1911, 33, 486–491. [Google Scholar] [CrossRef]
  5. Padfield, T.; Jensen, L.A. Humidity buffering by absorbent materials. In Proceedings of the 9th Nordic Symposium on Building Physics, Tampere University of Technology, Tampere, Finland, 29 May–2 June 2011; pp. 475–482. [Google Scholar]
  6. Japanese Industrial Standard. JIS A1470-2: Test Method of Adsorption/Desorption Efficiency for Building Materials to Regulate an Indoor Humidity—Part 1: Response Method of Humidity; Japanese Industrial Standard: Tokyo, Japan, 2002. [Google Scholar]
  7. Rode, C.; Peuhkuri, R.H.; Hansen, K.K.; Time, B.; Svennberg, K.; Arfvidsson, J.; Ojanen, T. NORDTEST project on moisture buffer value of materials. In Proceedings of the AIVC Conference ‘Energy Performance Regulation’: Ventilation in Relation to the Energy Performance of Buildings, Brussels, Belgium, 21–23 September 2005; INIVE EEIG: Brussels, Belgium, 2005; pp. 47–52. [Google Scholar]
  8. International Standards Organization. ISO 24353: Hygrothermal Performance of Building Materials and Products: Determination of Hygroscopic Sorption Properties; ISO: Geneva, Switzerland, 2013. [Google Scholar]
  9. Tran Le, A.D.; Maalouf, C.; Mai, T.H.; Wurtz, E.; Collet, F. Transient hygrothermal behaviour of a hemp concrete building envelope. Energy Build. 2010, 42, 1797–1806. [Google Scholar] [CrossRef]
  10. Xie, H.; Gong, G.; Wu, Y.; Liu, Y.; Wang, Y. Research on the hygroscopicity of a composite hygroscopic material and its influence on indoor thermal and humidity environment. Appl. Sci. 2018, 8, 430. [Google Scholar] [CrossRef] [Green Version]
  11. Osanyintola, O.F.; Simonson, C.J. Moisture buffering capacity of hygroscopic building materials: Experimental facilities and energy impact. Energy Build. 2006, 38, 1270–1282. [Google Scholar] [CrossRef]
  12. Svennberg, K.; Lengsfeld, K.; Harderup, L.-E.; Holm, A. Previous Experimental Studies and Field Measurements on Moisture Buffering by Indoor Surface Materials. J. Build. 2007, 30, 261–274. [Google Scholar] [CrossRef]
  13. Chennouf, N.; Agoudjil, B.; Boudenne, A.; Benzarti, K.; Bouras, F. Hygrothermal characterization of a new bio-based construction material: Concrete reinforced with date palm fibers. Constr. Build. Mater. 2018, 192, 348–356. [Google Scholar] [CrossRef]
  14. Lagouin, M.; Magniont, C.; Sénéchal, P.; Moonen, P.; Aubert, J.-E.; Laborel-Préneron, A. Influence of types of binder and plant aggregates on hygrothermal and mechanical properties of vegetal concretes. Constr. Build. Mater. 2019, 222, 852–871. [Google Scholar] [CrossRef]
  15. Colinart, T.; Lelièvre, D.; Glouannec, P. Experimental and numerical analysis of the transient hygrothermal behavior of multilayered hemp concrete wall. Energy Build. 2016, 112, 1–11. [Google Scholar] [CrossRef]
  16. Collet, F.; Chamoin, J.; Pretot, S.; Lanos, C. Comparison of the hygric behaviour of three hemp concretes. Energy Build. 2013, 62, 294–303. [Google Scholar] [CrossRef]
  17. Nguyen, D.M.; Grillet, A.-C.; Diep, T.M.H.; Thuc, C.N.H.; Woloszyn, M. Hygrothermal properties of bio-insulation building materials based on bamboo fibers and bio-glues. Constr. Build. Mater. 2017, 155, 852–866. [Google Scholar] [CrossRef]
  18. Palumbo, M.; McGregor, F.; Heath, A.; Walker, P. The influence of two crop by-products on the hygrothermal properties of earth plasters. Build. Environ. 2016, 105, 245–252. [Google Scholar] [CrossRef] [Green Version]
  19. Promis, G.; Douzane, O.; Le, A.T.; Langlet, T. Moisture hysteresis influence on mass transfer through bio-based building materials in dynamic state. Energy Build. 2018, 166, 450–459. [Google Scholar] [CrossRef]
  20. Rahim, M.; Douzane, O.; Le, A.T.; Promis, G.; Langlet, T. Characterization and comparison of hygric properties of rape straw concrete and hemp concrete. Constr. Build. Mater. 2016, 102, 679–687. [Google Scholar] [CrossRef]
  21. Ramos, N.; Delgado, J.; de Freitas, V.P. Influence of finishing coatings on hygroscopic moisture buffering in building elements. Constr. Build. Mater. 2010, 24, 2590–2597. [Google Scholar] [CrossRef]
  22. Ahmad, M.R.; Chen, B.; Haque, M.A.; Shah, S.F.A. Development of a sustainable and innovant hygrothermal bio-composite featuring the enhanced mechanical properties. J. Clean. Prod. 2019, 229, 128–143. [Google Scholar] [CrossRef]
  23. Kreiger, B.K.; Srubar, W.V., III. Moisture buffering in buildings: A review of experimental and numerical methods. Energy Build. 2019, 202, 109394. [Google Scholar] [CrossRef]
  24. Maskell, D.; Thomson, A.; Walker, P.; Lemke, M. Determination of optimal plaster thickness for moisture buffering of indoor air. Build. Environ. 2018, 130, 143–150. [Google Scholar] [CrossRef]
  25. Daïan, J.-F. Equilibre et Transferts en Milieux Poreux. Hal-00452876v3. Ph.D. Thesis, Joseph-Fourier University, Grenoble, France, 2013. [Google Scholar]
  26. Cérézo, V. Propriétés Mécaniques, Thermiques et Acoustiques d’un Matériau à Base de Particules Végétales: Approche Expérimentale et Modélisation Théorique. Ph.D. Thesis, INSA Lyon, Lyon, France, 2005. [Google Scholar]
  27. Collet-Foucault, F. Caractérisation Hydrique et Thermique de Matériaux de Génie Civil à Faibles Impacts Environnementaux. Ph.D. Thesis, INSA Rennes, Rennes, France, 2004. [Google Scholar]
  28. Brandt, A.M. Fibre reinforced cement-based (FRC) composites after over 40 years of development in building and civil engineering. Compos. Struct. 2008, 86, 3–9. [Google Scholar] [CrossRef]
  29. Nozahic, V.; Amziane, S.; Torrent, G.; Saïdi, K.; De Baynast, H. Design of green concrete made of plant-derived aggregates and a pumice–lime binder. Cem. Concr. Compos. 2012, 342, 231–241. [Google Scholar] [CrossRef]
  30. Liuzzi, S.; Rubino, C.; Stefanizzi, P.; Petrella, A.; Boghetich, A.; Casavola, C.; Pappalettera, G. Hygrothermal properties of clayey plasters with olive fibers. Constr. Build. Mater. 2018, 158, 24–32. [Google Scholar] [CrossRef]
  31. Marques, B.; Tadeu, A.; Almeida, J.; Antonio, J.; de Brito, J. Characterisation of sustainable building walls made from rice straw bales. J. Build. Eng. 2020, 28, 101041. [Google Scholar] [CrossRef]
  32. Tran Le, A.D.; Zhang, J.S.; Liu, Z.; Samri, D.; Langlet, T. Modeling the similarity and the potential of toluene and moisture buffering capacities of hemp concrete on IAQ and thermal comfort. Build. Environ. 2021, 188, 107455. [Google Scholar] [CrossRef]
  33. Cascione, V.; Hagentoft, C.-E.; Maskell, D.; Shea, A.; Walker, P. Moisture buffering in surface materials due to simultaneous varying relative humidity and temperatures: Experimental validation of new analytical formulas. Appl. Sci. 2020, 10, 7665. [Google Scholar] [CrossRef]
  34. Cascione, V.; Maskell, D.; Shea, A.; Walker, P. The moisture buffering performance of plasters when exposed to simultaneous sinusoidal temperature and RH variations. J. Build. Eng. 2021, 34, 101890. [Google Scholar] [CrossRef]
  35. Philip, J.; De Vries, D. Moisture movement in porous materials under temperature gradients. Eos Trans. Am. Geophys. Union 1957, 382, 222–232. [Google Scholar] [CrossRef]
  36. Crausse, P.; Laurent, J.; Perrin, B. Influence des phénomènes d’hystérésis sur les propriétés hydriques de matériaux poreux: Comparaison de deux modèles de simulation du comportement thermohydrique de parois de bâtiment. Rev. Gén. Therm. 1996, 35, 95–106. [Google Scholar] [CrossRef]
  37. Langmuir, I. The adsorption of gases on plane surfaces of glass, mica and platinum. J. Am. Chem. Soc. 1918, 409, 1361–1403. [Google Scholar] [CrossRef] [Green Version]
  38. Brunauer, S.; Emmett, P.H.; Teller, E. Adsorption of gases in multimolecular layers. J. Am. Chem. Soc. 1938, 602, 309–319. [Google Scholar] [CrossRef]
  39. Merouani, L. Phénomènes de Sorption et de Transfert d’Humidité dans des Matériaux du Bâtiment: Étude Expérimentale Comparative d’un Mortier de Ciment et d’un Enduit de Façade. Ph.D. Thesis, INP Grenoble, Grenoble, France, 1987. [Google Scholar]
  40. Timmermann, E.O. Multilayer sorption parameters: BET or GAB values? Colloids Surf. A Physicochem. Eng. Asp. 2003, 220, 235–260. [Google Scholar] [CrossRef] [Green Version]
  41. Prothon, F.; Ahrné, L.l.M. Application of the Guggenheim, Anderson and De Boer model to correlate water activity and moisture content during osmotic dehydration of apples. J. Food Eng. 2004, 613, 467–470. [Google Scholar] [CrossRef]
  42. Andrade, I.; Pires, A.; de Carvalho, G.; Veloso, C.M.; Bonomo, P. Protein and carbohydrate fractioning in elephantgrass silage with agricultural by-products. Rev. Bras. Zootec. 2010, 39, 2342–2348. [Google Scholar] [CrossRef] [Green Version]
  43. Colinart, T.; Glouannec, P. Temperature dependence of sorption isotherm of hygroscopic building materials. Part 1: Experimental evidence and modeling. Energy Build. 2017, 139, 360–370. [Google Scholar] [CrossRef]
  44. Janssen, H.; Roels, S. Qualitative and quantitative assessment of interior moisture buffering by enclosures. Energy Build. 2009, 414, 382–394. [Google Scholar] [CrossRef] [Green Version]
  45. Mendonça, K.; Inard, C.; Wurtz, E.; Winkelmann, F.; Allard, F. A zonal model for predicting simultaneous heat and moisture transfer in buildings. In Proceedings of the INDOOR AIR 2002—The 9th International Conference on Indoor Air Quality and Climate, Monterey, CA, USA, 30 June–5 July 2002; p. 135. [Google Scholar]
  46. Sowell, E.F.; Haves, P. Efficient solution strategies for building energy system simulation. Energy Build. 2001, 334, 309–317. [Google Scholar] [CrossRef] [Green Version]
  47. Wurtz, E.; Haghighat, F.; Mora, L.; Mendonca, K.; Zhao, H.; Maalouf, C.; Bourdoukan, P. An integrated zonal model to predict transient indoor humidity distribution. ASHRAE Trans. 2006, 112, 175–186. [Google Scholar]
  48. Haba, B.; Agoudjil, B.; Boudenne, A.; Benzarti, K. Hygric properties and thermal conductivity of a new insulation material for building based on date palm concrete. Constr. Build. Mater. 2017, 154, 963–971. [Google Scholar] [CrossRef]
  49. Brouard, Y.; Belayachi, N.; Hoxha, D.; Ranganathan, N.; Méo, S. Mechanical and hygrothermal behavior of clay–Sunflower (Helianthus annuus) and rape straw (Brassica napus) plaster bio-composites for building insulation. Constr. Build. Mater. 2018, 161, 196–207. [Google Scholar] [CrossRef]
  50. Baughman, A.; Arens, E.A. Indoor humidity and human health--Part I: Literature review of health effects of humidity-influenced indoor pollutants. ASHRAE Trans. 1996, 102, 192–211. [Google Scholar]
  51. Shea, A.; Lawrence, M.; Walker, P. Hygrothermal performance of an experimental hemp–lime building. Constr. Build. Mater. 2012, 36, 270–275. [Google Scholar] [CrossRef] [Green Version]
Figure 1. Sorption isotherm curves of the studied concretes.
Applsci 11 05420 g001
Figure 2. Studied configuration at single-layer wall scale.
Applsci 11 05420 g002
Figure 3. Sample mass variation at 10 °C for PC case: model validation.
Applsci 11 05420 g003
Figure 4. Sample mass variation at 23 °C for PC case: model validation.
Applsci 11 05420 g004
Figure 5. Influence of temperature on the MBV of the studied bio-based materials (PC and SC) and their classification.
Applsci 11 05420 g005
Figure 6. Vapor pressure and density of water vapor as function of temperature.
Applsci 11 05420 g006
Figure 7. SEM microstructure view of date palm fiber [48].
Applsci 11 05420 g007
Figure 8. SEM longitudinal cross-section of sunflower pith [49].
Applsci 11 05420 g008
Figure 9. Variation in the MBV as function of temperature.
Applsci 11 05420 g009
Figure 10. Studied configuration of the office room occupied by two persons [32].
Applsci 11 05420 g010
Figure 11. Indoor RH variation of an office room with different values of MBV.
Applsci 11 05420 g011
Figure 12. Impact of moisture buffer classification on f value.
Applsci 11 05420 g012
Figure 13. f Value of the studied office room as a function of indoor temperature.
Applsci 11 05420 g013
Figure 14. Impact of exposed surface area on indoor RH variation for PC and SC.
Applsci 11 05420 g014
Table 1. Fitting parameters of GAB model.
MaterialsPCSC
wm0.0190.0171
C127
K0.860.76
R−20.980.99
Table 2. Hygrothermal properties and measured MBV of studied bio-based concretes [13,14].
Hygrothermal PropertiesPCSC
Density ρ (kg/m3)954539.64
Total porosity64%70%
Open porosity58%68.6%
Thermal conductivity λ (W/(m·K))0.1850.127
Specific heat capacity Cp (J/(kg·K))1500-
Water vapor diffusion resistance factor μ5.572.62
MBV measured at 23 °C
(g/(m2%RH))
2.962.26
MBV measured at 10 °C
(g/m2%RH))
2.03-
Table 3. Experimental and numerical MBVs of PC and SC concretes.
MaterialsExperimental MBV
(g/(m2%RH)) [13,14]
Numerical MBV
(g/(m2%RH))
PC2.03 at 10 °C
and 2.96 at 23 °C
2.01 at 10 °C
and 2.99 at 23 °C
SC2.26 at 23 °C2.29 at 23 °C
Table 4. Influence of temperature on vapor pressure and water vapor concentration.
T (°C)Pv,sat (Pa)ρv,e (g/m3) at 33%Pv (Pa)
at 33%
ρv,e (g/m3)
at 75%
Pv (Pa)
at 75%
101241.23.13409.67.1930.9
151724.24.35699.71293.1
202364.95.8780.413.11773.7
232842.16.9937.915.62131.6
253205.27.71057.717.52403.9
30429510.11417.7233221.3
355693.813.21879304270.4
Table 5. Impact of moisture buffer on indoor relative humidity variation.
MBV
(g/(m2%RH))
RHi,maxRHi,minA
(Amplitude)
f = A/A0
00.730.50A0 = 0.231
0.50.70.510.190.83
10.670.520.150.65
1.50.650.540.110.48
20.630.540.090.39
2.50.620.550.070.32
30.620.560.060.27
3.50.610.560.050.22
40.610.560.050.22
Table 6. Impact of moisture buffering capacity as function of T on indoor RH for PC and SC.
Table A0f (A/A0) for PCf (A/A0) for SC
150.350.43
180.300.39
230.260.35
280.220.30
300.220.30
Table 7. Impact of exposed surface on indoor RH variation for PC.
MBV (g/(m2%RH)) at 23 °C of PC
Air Effective
(Aef)
Loading Coefficient
(Aef/V)
RHmaxRHminΔRHf (A/A0)
00.000.730.50.231.00
7.50.140.690.510.180.78
17.50.320.650.530.120.52
27.50.500.630.550.080.35
37.50.680.620.550.070.30
Table 8. Impact of exposed surface on indoor RH variation for SC.
MBV (g/(m2%RH)) at 23 °C of SC
Air Effective
(Aef)
Loading Coefficient
(Aef/V)
RHmaxRHminΔRHf (A/A0)
00.000.730.50.231.00
7.50.140.70.510.190.83
17.50.320.660.520.140.61
27.50.500.640.540.10.43
37.50.680.630.550.080.35
Publisher’s Note: MDPI stays neutral with regard to jurisdictional claims in published maps and institutional affiliations.

