Article

Use of Bioceramics Enhanced with Effective Microorganisms as an Additive for Construction. Study of Physical and Mechanical Properties in Cement Mortars and Gypsum Plasters

by
Filomena Pérez-Gálvez
,
María Jesús Morales-Conde
and
Manuel Alejandro Pedreño-Rojas
*
Departamento de Construcciones Arquitectónicas 1, Escuela Técnica Superior de Arquitectura, Universidad de Sevilla, Avenida Reina Mercedes, n_ 2, 41012 Sevilla, Spain
*
Author to whom correspondence should be addressed.
Appl. Sci. 2021, 11(8), 3519; https://doi.org/10.3390/app11083519
Submission received: 31 March 2021 / Revised: 9 April 2021 / Accepted: 12 April 2021 / Published: 14 April 2021
(This article belongs to the Special Issue Biobased Building Materials)

Abstract

:
Biomaterials are materials that are used to manufacture devices that interact with biological systems. According to their chemical composition, they can be classified as biometals, biopolymers, bioceramics, biocomposites and semiconductors. Thus, in the present work, the application of bioceramics, enhanced with effective microorganisms, to construction materials (cement mortars and gypsum plasters) was studied in order to see the benefits that its incorporation contributes to construction materials. This first work constitutes the first phase of an experimental campaign in which the influence of bioceramics on the physical and mechanical properties (flexural and compressive strength) of the studied materials was analyzed. Furthermore, scanning electron microscopy (SEM) and mercury intrusion porosimetry (MIP) techniques were used. According to the results, a slight improvement in the mechanical properties of the new composites was observed. Besides, a more compact matrix was observed when bioceramics were used as an aggregate to the mixtures.

1. Introduction

Biomaterials are materials that are used to manufacture devices that interact with biological systems. They are applied in different scientific areas such as medicine and pharmacology, in order to be incorporated into a living system to replace or restore some function, by remaining in permanent or intermittent contact with body fluids [1]. According to their chemical composition, they can be classified as biometals, biopolymers, bioceramics, biocomposites and semiconductors.
However, several researches have recently developed different types of biomaterials to be used in the building sector. In that sense, several investigations have used wood waste as an aggregate for the generation of new construction materials and products. Some of them were focused on the development of new concretes, using the wood waste as an aggregate [2,3,4] or as a cement partial replacement (wood ashes) [5,6,7].
Besides, other investigations used wood waste as aggregate in new building materials, such as cement mortars [8,9] or gypsum plasters [10,11,12]. Furthermore, some of them used those new composites for the development of lightweight plaster pieces like false ceiling plates or gypsum blocks [13,14]. From this work, lighter pieces with enhanced thermal and acoustic properties were achieved.
Different types of bio-aggregates were also used to generate new building composites. Thus, Siddique et al. produced new concretes using rice husk ash as a cement partial replacement [15]. In addition, the same residue was also employed to carry out new cement mortars [16,17,18] and gypsum plasters [19].
On the other hand, some researches have carried out the development of new building composites reinforced with several natural fibers [20]. In that sense, Lertwattanaruk and Suntijitto produced new cement mortars containing coconut coir and oil palm fibers for residential building applications [21]. Rodríguez-Liñán et al. generated wood waste-gypsum plasters with straw as a natural fiber reinforcement. The results were compared with those reinforced with glass fiber at the same percentage [22]. Furthermore, other studies tried to develop new greener building materials by using several types of construction and demolition wastes [23,24]. Besides, Coppola et al. made a review focused on the use of different binders alternative to Portland cement, including sulfoaluminate cements, alkali-activated materials, and geopolymers [25].
However, the use of bioceramics in building applications is limited and scarce. Bioceramics are complex chemical composites that contain both metallic and non-metallic elements. Due to their ionic or covalent bonds, they are generally hard and brittle. In addition to having a high melting point and low thermal and electrical conductivity, bioceramics are considered wear-resistant. They can be classified as bionerts, in the case of alumina and zirconia.
The bioceramics used are made up of different minerals and are in synergy with microorganisms emitting far infrared waves, specifically from 2.5 to 15.4 µm and with a maximum intensity of 2.5 to 9.5 µm (transmittance of 100%). These types of waves break the hydrogen bonds of water molecules. This is why this bioceramic produces an effect on all materials that contain water. Previous studies showed that bioceramics improved water solubility, reduced viscosity and surface tension, increased volatility of some composites, dissociated hydrogen peroxide (H2O2), lower pH was achieved, improved the energy transfer from water, and acted as an accelerator when reducing chemical reactions [26,27,28].
Thus, in the present work, the application of bioceramics, enhanced with effective microorganisms, to construction materials (cement mortars and gypsum plasters) was studied in order to see the benefits that its incorporation contributes to construction materials. This first work constitutes the first phase of an experimental campaign in which the influence of bioceramics on the physical and mechanical properties (flexural and compressive strength) of the studied materials was analyzed. Furthermore, scanning electron microscopy (SEM) and mercury intrusion porosimetry (MIP) techniques were used.

2. Materials and Methods
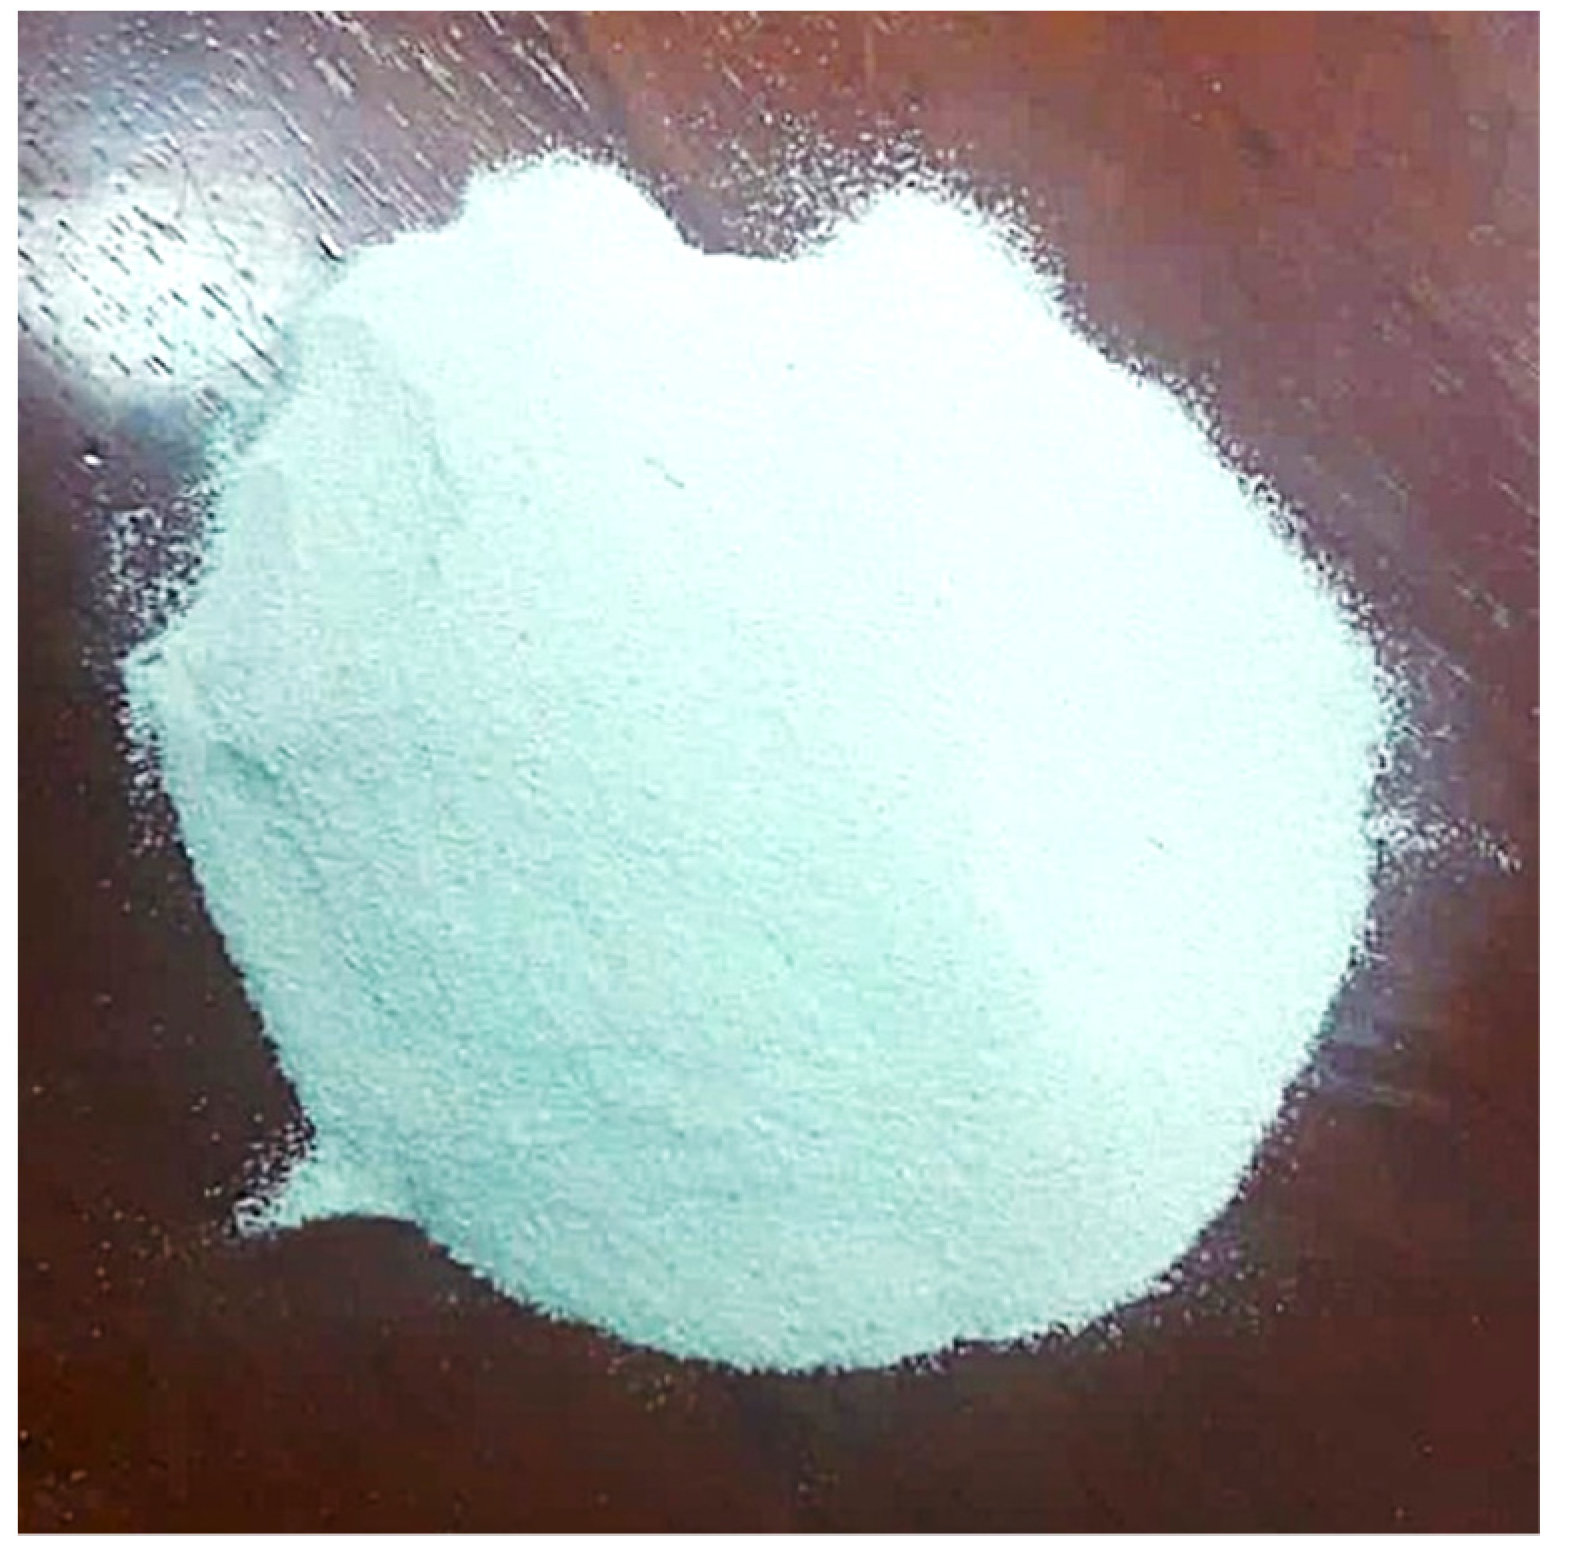
2.1. Bioceramics

The bioceramics used are aluminum silicate (atomized porcelain) in a very fine powder, with a particle diameter of 42 µm (Figure 1). It has a pH diluted at 1% in H2O of 8.4 and a density of 2.6 g/cm3. Its chemical composition is as follows (Table 1):

2.2. Gypsum Plasters

The following materials were used in order to generate the different gypsum mixtures:
  • Gypsum. The gypsum used was a controlled B1 gypsum cast (gypsum for construction), also known as YG/L (its traditional name), according to standard UNE-EN 13279-1 [29]. Its main characteristics are presented in Table 2.
  • Water. In order to obtain an appropriate workability for the plasters, and to favor the comparison of results, the quantity of water used was the same for all the mixtures.
Thus, four different mixtures were prepared. Three of them with a different percentage of bioceramics, called GBC-0.3, GBC-0.65 and GBC-1, as well as the reference sample (R). The percentages of bioceramics were 0.3, 0.65 and 1% (percentage by the weight of gypsum). A constant water/gypsum ratio of 0.55 was used in all the mixtures. As it was mentioned, the bioceramics used was in powder form. To ensure a homogeneous distribution of the bioceramics in the mixtures and, therefore, in the subsequent composition of the specimens produced, the product was previously dissolved in the gypsum mixing water until it was completely dissolved.
The quantities used were accurately calculated to guarantee the established percentages of bioceramics. Table 3 summarizes the composition of all mixtures per kilogram of gypsum powder used.
Each sample was composed of twelve specimens of a size of 160 × 40 × 40 mm3, according to the UNE-EN 13279-2 standard [30], for their physical and mechanical characterization. After the specimen preparation, the samples were cured at a temperature of 24 ± 1 °C and a relative humidity level of 50 ± 1% for 7 days [30]. They were then dried in an oven at 40 ± 2 °C for approximately 48 h, until they reach a constant mass. They were then cooled to air temperature before being tested.
For all of the mixtures, the following tests methods were carried out:
  • Dry State Density. Measuring the weight and dimensions of each sample, their dry state density was obtained following the procedure defined by UNE-EN 13279-2 standard [30];
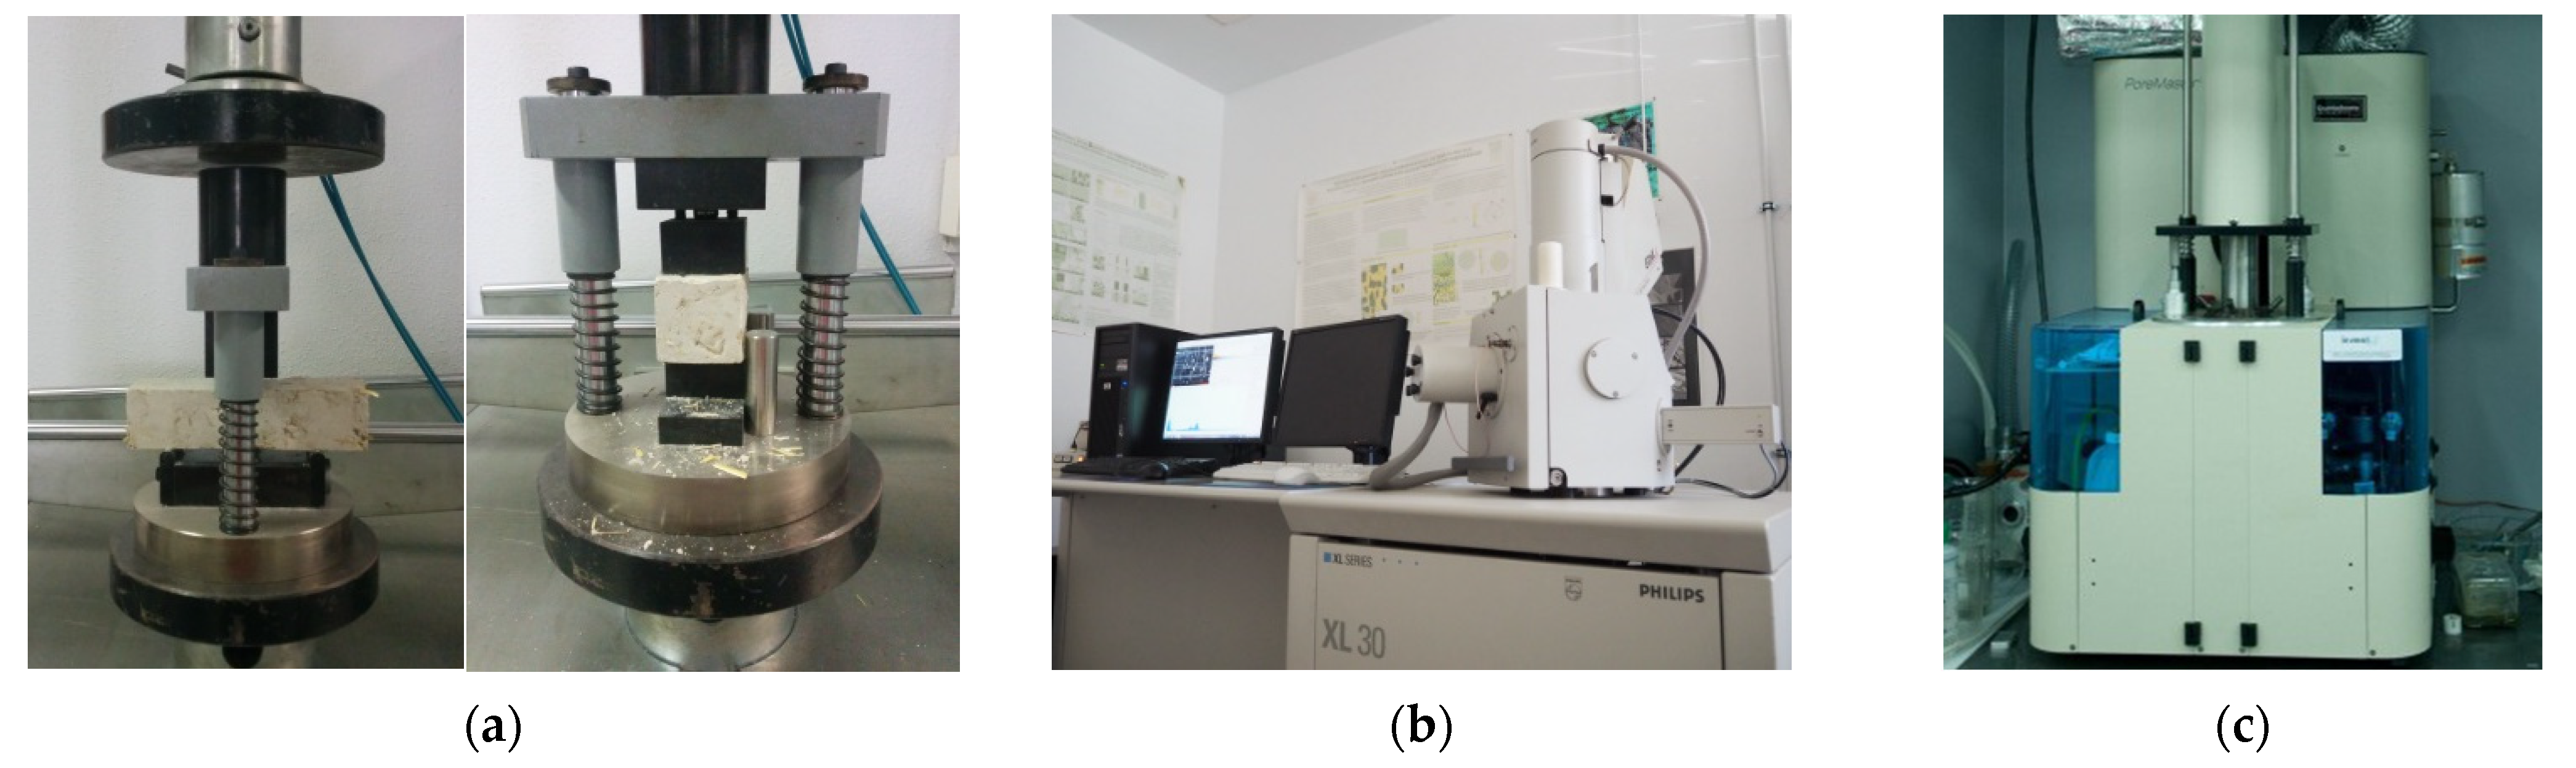
  • Mechanical Properties. To calculate the mechanical behavior of the samples, flexural and compressive strength tests were carried out, in accordance with the procedure described in the UNE-EN 13279-2 standard [30]. A universal Suzpecar multi-test press was used. This press has a load capacity of 20 tons and its precision depends on the type of control. In the control per round, the precision is 0.01 mm/min, whereas in the load control the precision is 0.1 Kg/s (Figure 3a);
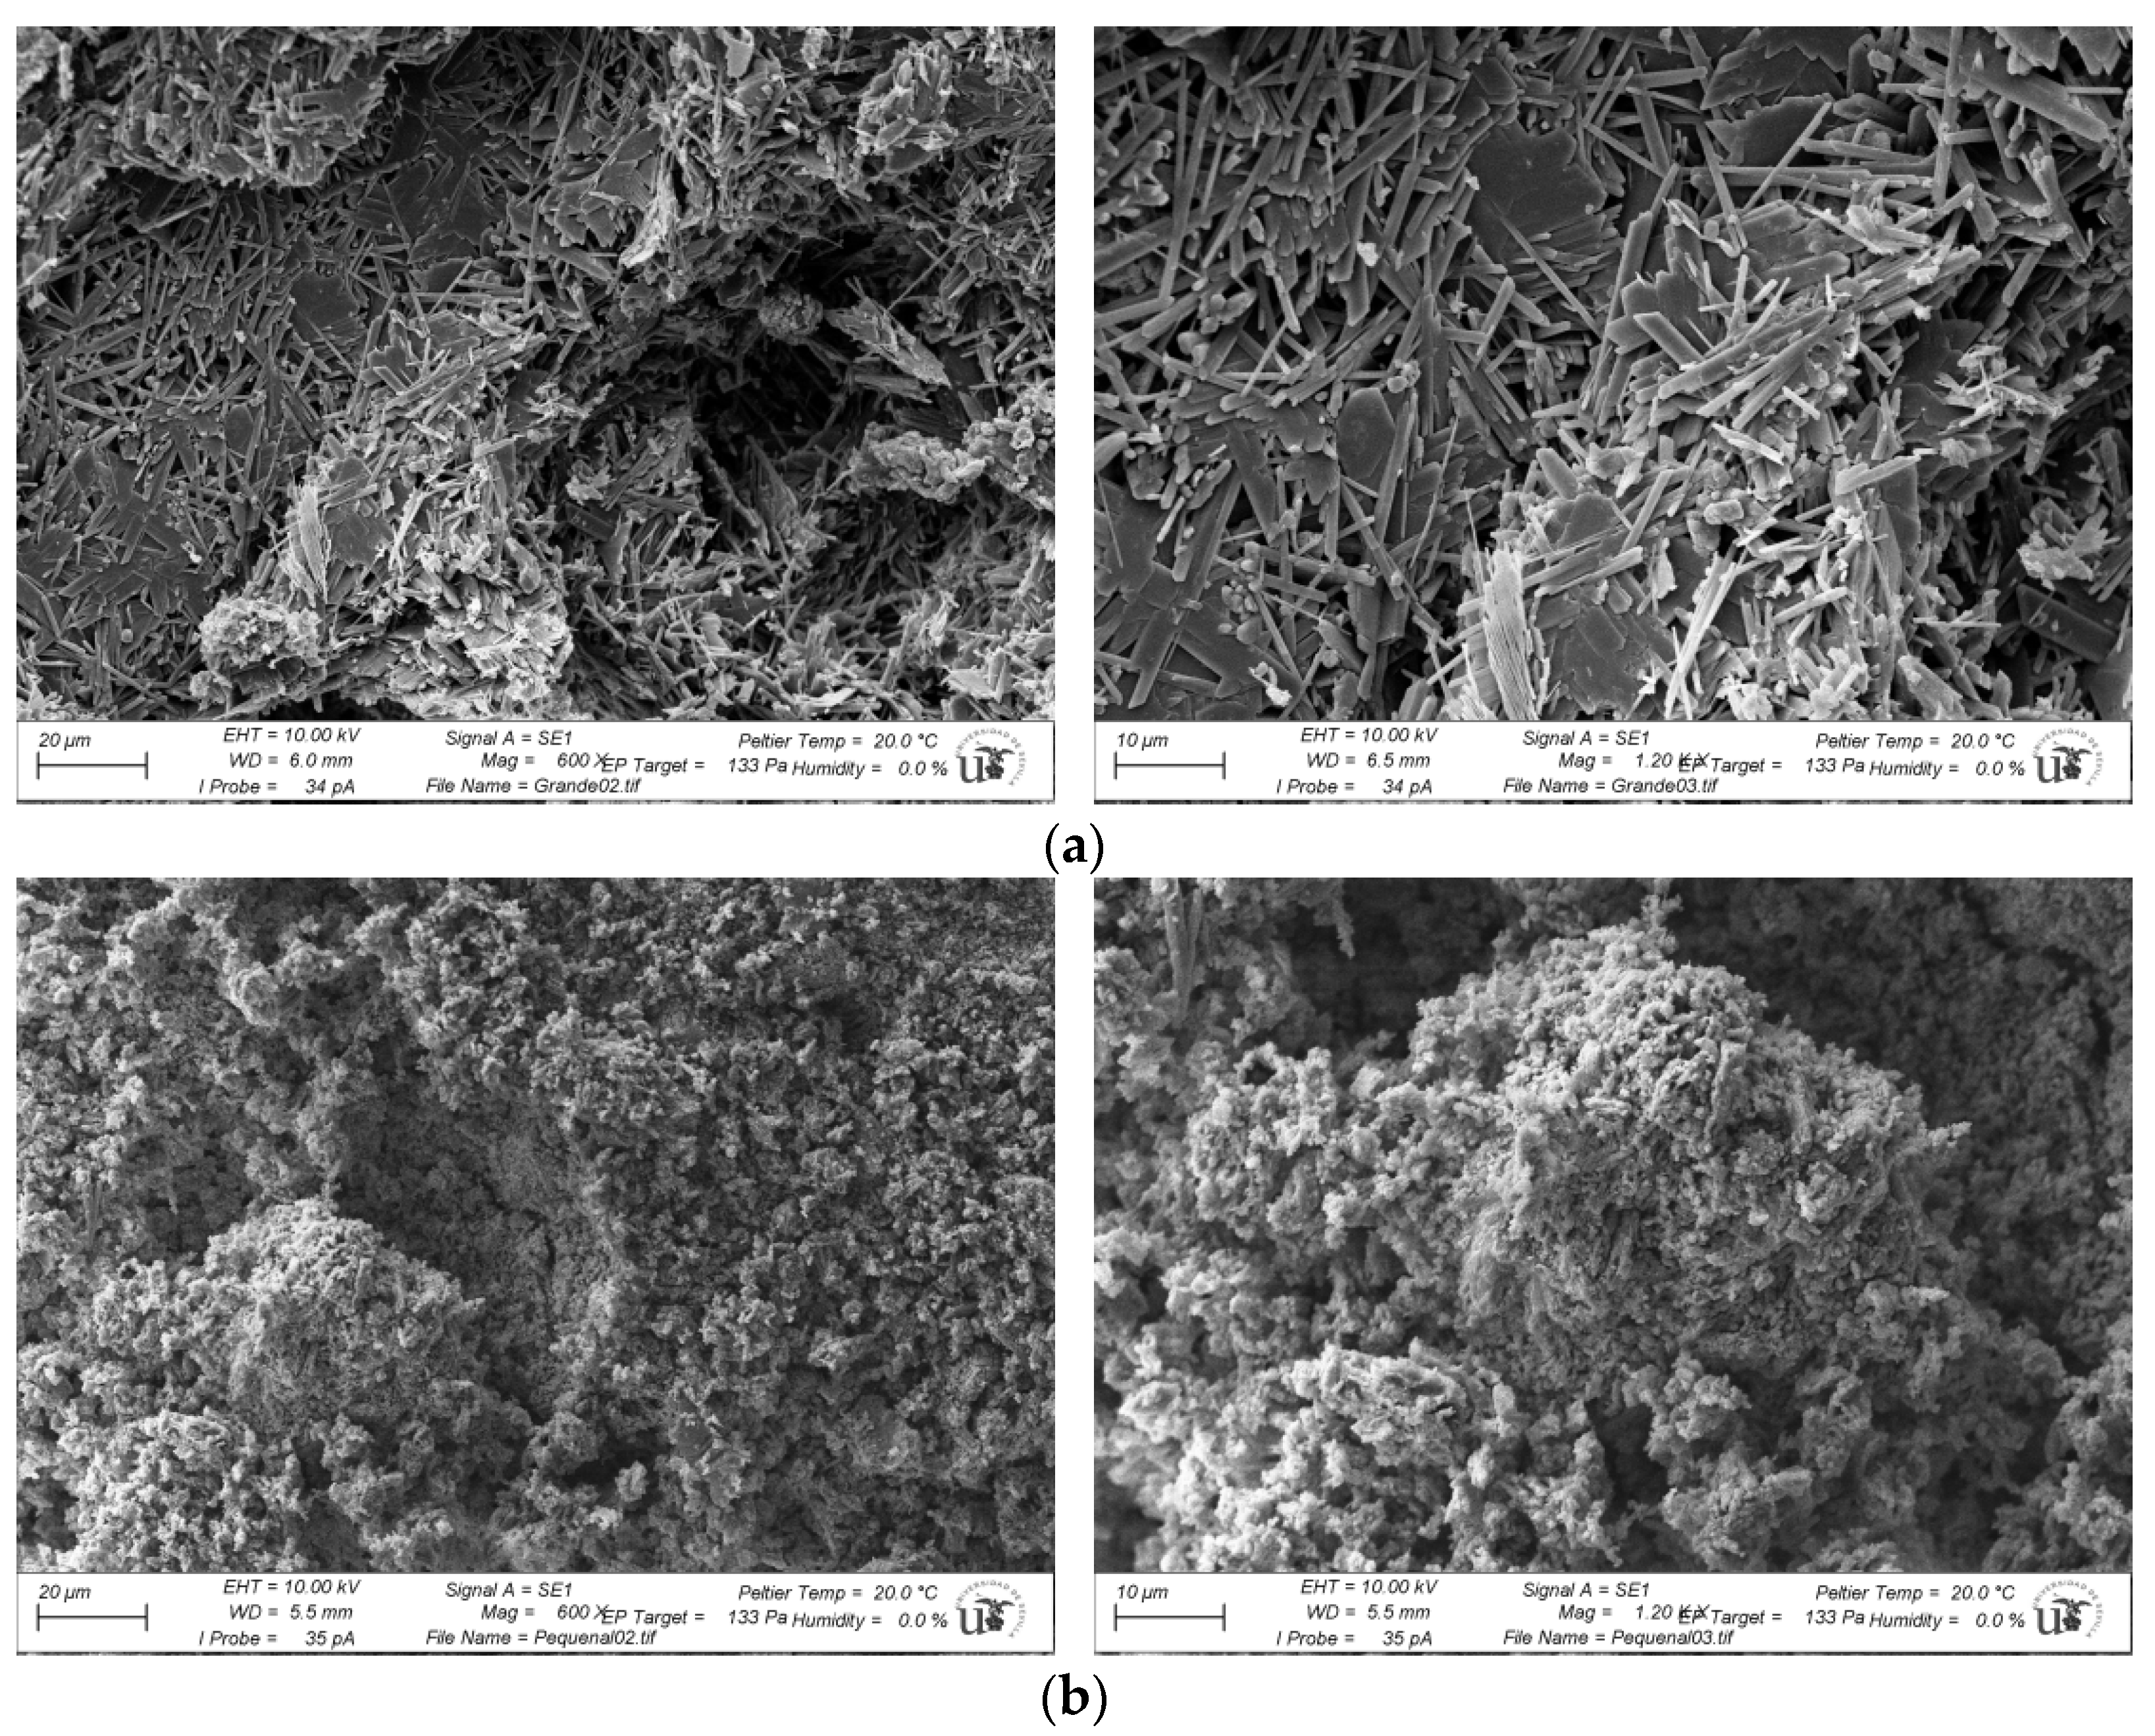
  • Scanning Electron Microscopy (SEM). To identify the alterations that the bioceramics caused in the microstructure of the plasters, SEM was employed for examining the microstructures of two samples, R and GBC-1 (mixture including 1% of bioceramics additives). The microscope used was a Phillips XL-30 Scanning Electron Microscope (Figure 3b). The SEM is equipped with an Energy Dispersive Spectrometrer (EDS) and has both back-scattered electron and secondary electron detectos for imaging. The state is nonmotorized. The SEM is operated through a PC-based system. The equipment has a resolution of 3.5 mm at 30 kV and 25 nm at 1 kV, and an acceleration range between 0.2 and 30 kV. To achieve adequate sample conductivity, the EDWARDS sputter six scancoat metallizer was applied to a superficial pattering of gold. The micrographs were recorded for two magnifications, x600 and x1200, for in-depth details.

2.3. Cement Mortars

The following materials were used to generate the different cement mortars mixtures:
  • White Cement. White cement with limestone, called BLII/A-L 42.5 R, was used. Its compressive strength at 28 days is greater than 42.5 MPa and it presents a high initial resistance, according to Spanish Cement Instruction standard [31]. Its chemical composition is detailed below (Table 4);
  • Sand. The aggregate used for the mixture’s preparation was natural and had a maximum size (MAS) of 4 mm (Figure 2). This parameter was determined according to the UNE-EN 933:1 standard [32]. The bulk density and the porosity presented values of 1600 kg/m3 and 37.8%, respectively. Finally, the apparent particle density and water absorption presented values of 2600 kg/m3 and 0.47%, respectively. All these magnitudes were determined according to the UNE-EN 1097:6 standard [33];
  • Water. In order to obtain an appropriate workability for the mortars, and to favor the comparison of results, the quantity of water used was the same for all the mixtures.
Four different mortars were produced at different bioceramics content ratios, 0.1, 0.25 and 0.4% (CBC-0.1, CBC-0.25 and CBC-0.4). The quantity of bioceramics added was measured by the weight of the aggregate. A reference mortar made with no bioceramics addition was also manufactured. For each mixture, 12 prismatic specimens of 160 × 40 × 40 mm3 were manufactured and tested. The cement/aggregate ratio of 0.3 was kept constant in all mixtures to identify the influence of bioceramics in mortar mixtures. Table 5 shows the composition of the specimens.
In this study, the water/cement ratio of 0.6 was kept constant to identify the influence of bioceramics in mortar mixtures (Table 5). Therefore, in the same way as it occurred in gypsum samples, it was found that as the amount of bioceramics added increased, the mortars set quicker and the workability of the samples was reduced.
After the specimens were produced, they underwent a curing process at 20 ± 2 °C for 28 days. During this period, relative humidity was maintained constant at 95 ± 5% for the first 7 days and at 65 ± 5% for the remaining 21 days, according to the UNE-EN 1015-11 standard [34]. After curing, the pieces were tested, as established in the experimental plan.
Thus, the following fresh and hardened properties of the mortars were tested:
  • Fresh State Bulk Density: It was determined by dividing its mass by the volume it occupies when it is introduced into a measuring vessel with a known capacity, following the specifications detailed in the UNE-EN 1015-6 standard [35];
  • Dry State Density: Once the mortar hardened, the values of the dry state density were estimated. It was calculated after the curing process described above for 28 days and determined by obtaining the mass in the dry state of a specimen and dividing it by its volume when it is immersed in water in a saturated state, as is specified in the European Standard UNE-EN 1015-10 [36];
  • Water Absorption by Capillarity: It was determined using three specimens. They were dried until they reached their constant mass. They were then split and the coefficient of water absorption was determined by measuring the increase in mass after immersing the fractured surface of the dried specimen in 5–10 mm of water for a period of time, following the experimental procedure described in UNE-EN 1015-18 [37];
  • Mechanical Properties: All samples were characterized by flexural and compressive strength tests after 28 days, according to the European Standard UNE-EN 1015-11 [34]. Flexural strength was determined using the prismatic samples of 160 × 40 × 40 mm3 and applying a load until failure. After the bending test, the two resulting pieces were tested to compressive strength. These mechanical tests were carried out using the electromechanical Suzpecar press, already described above (Figure 3a);
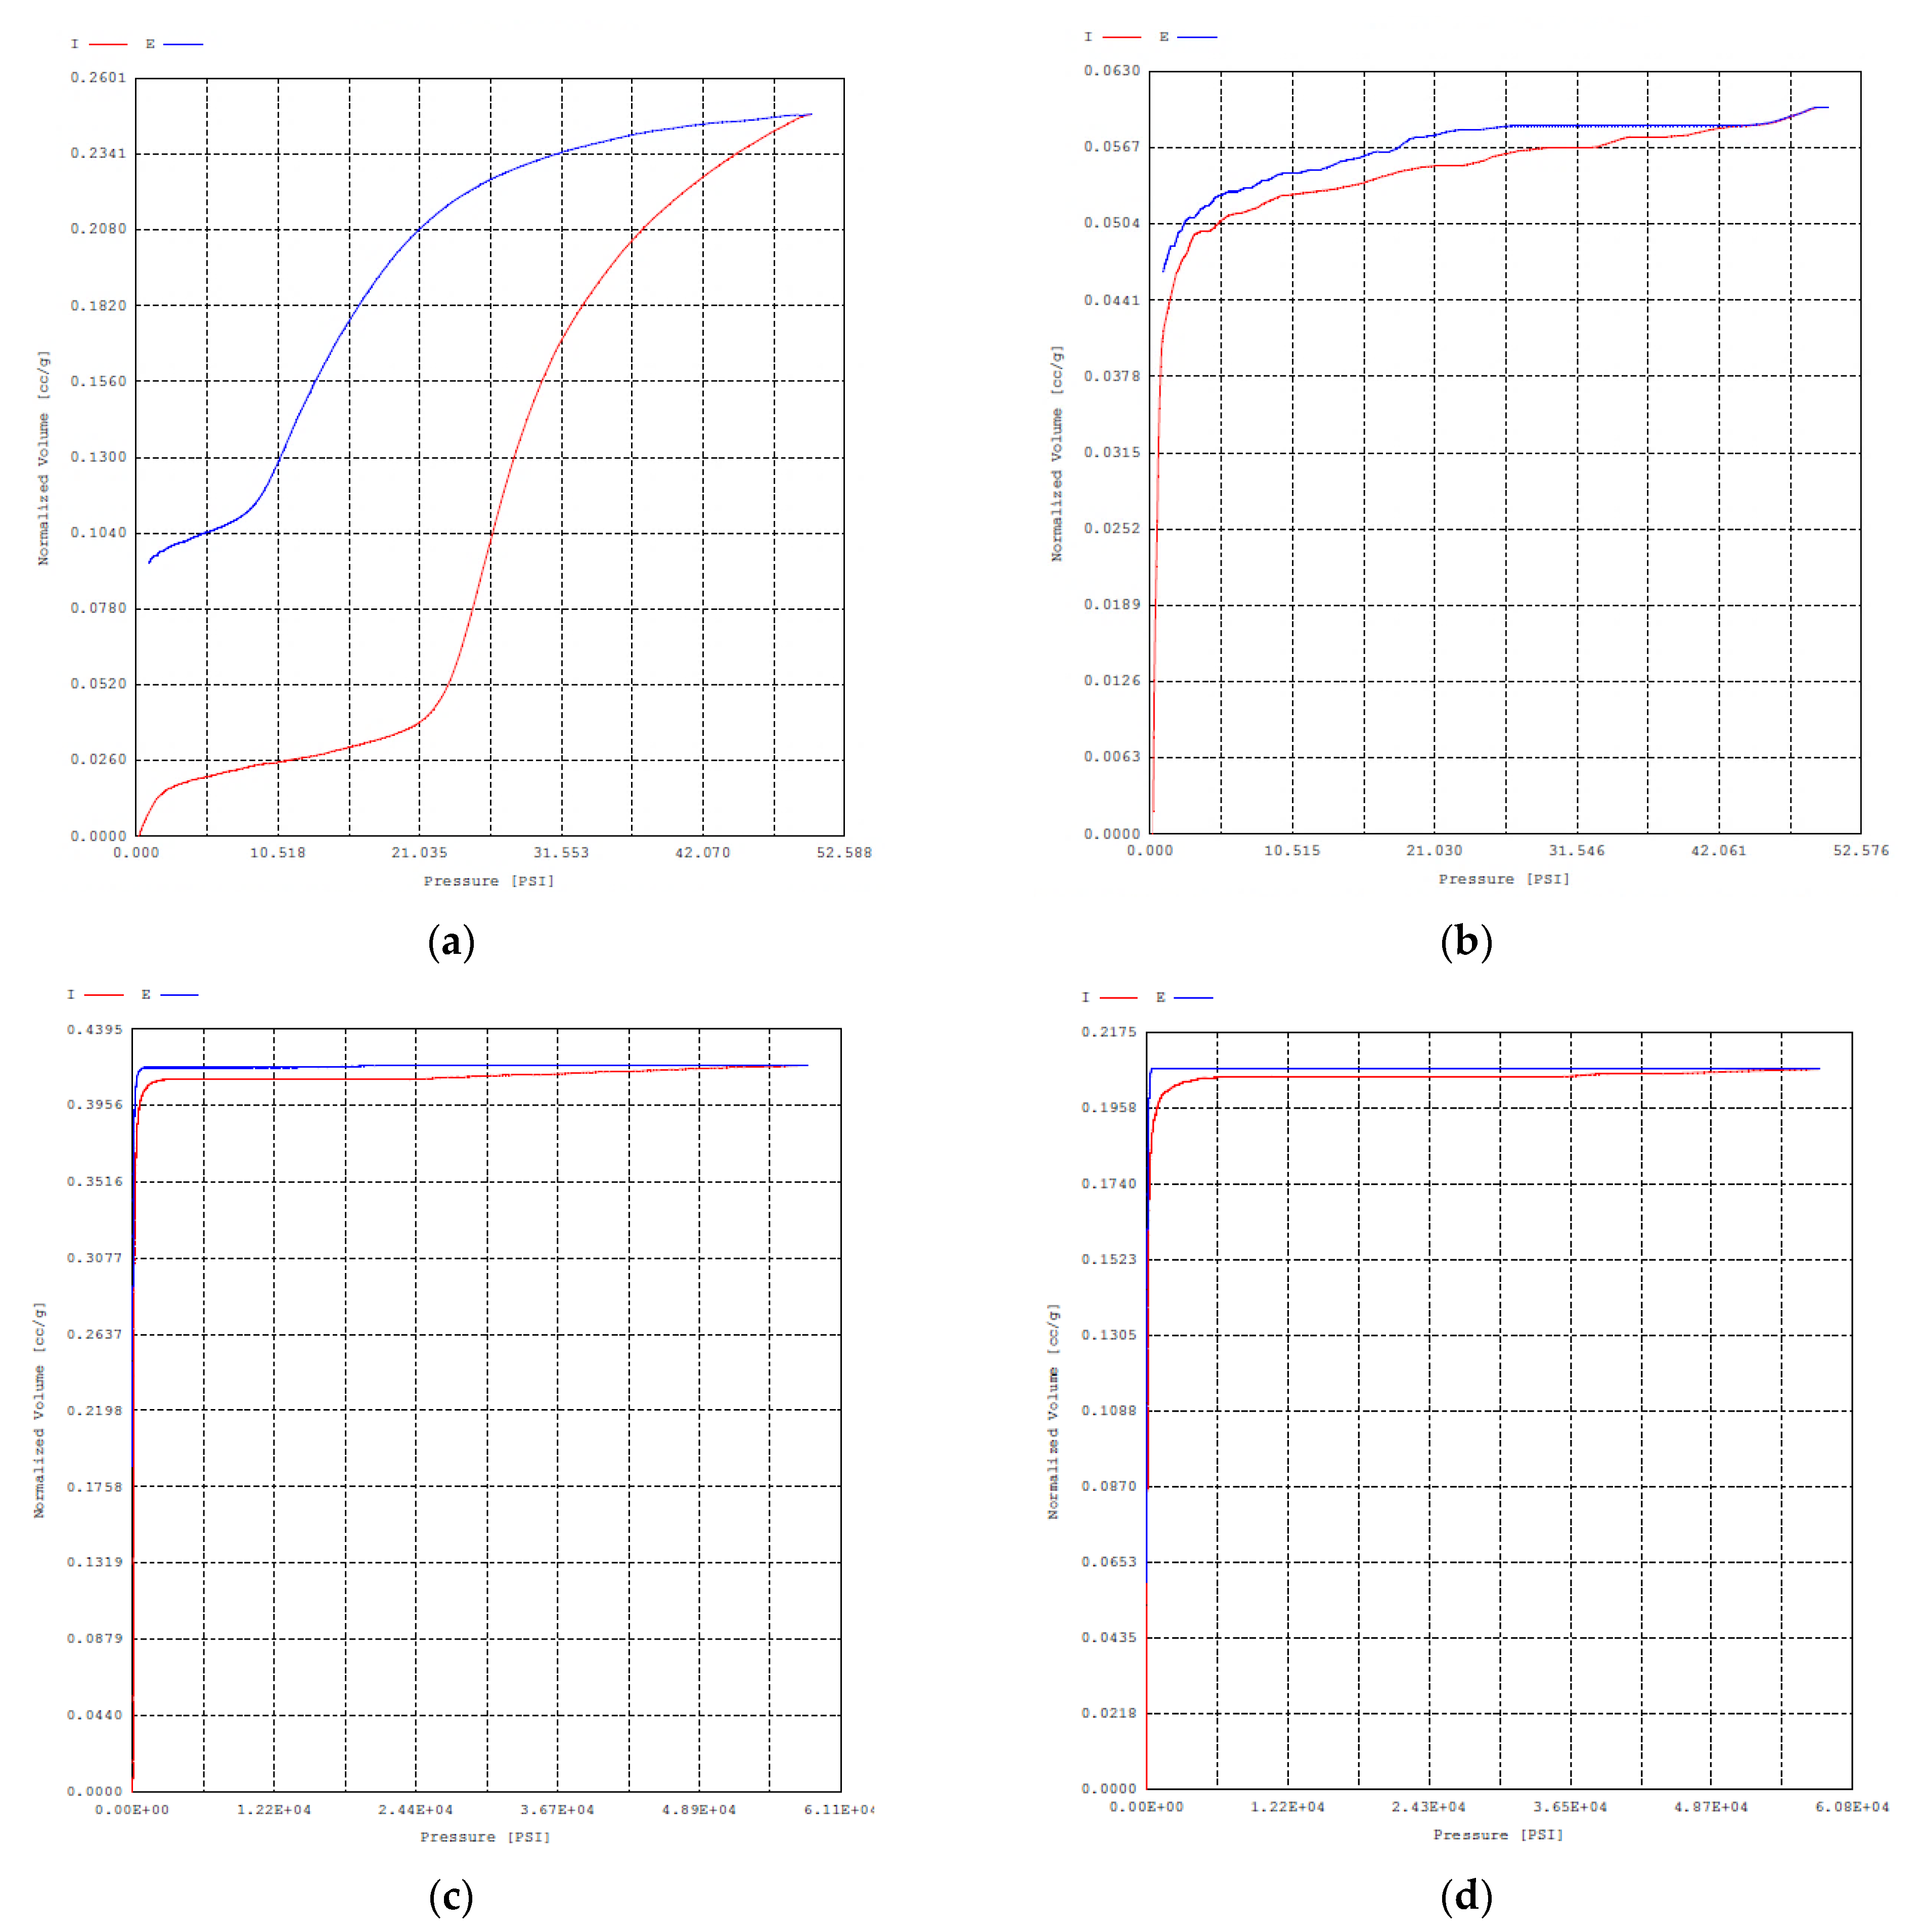
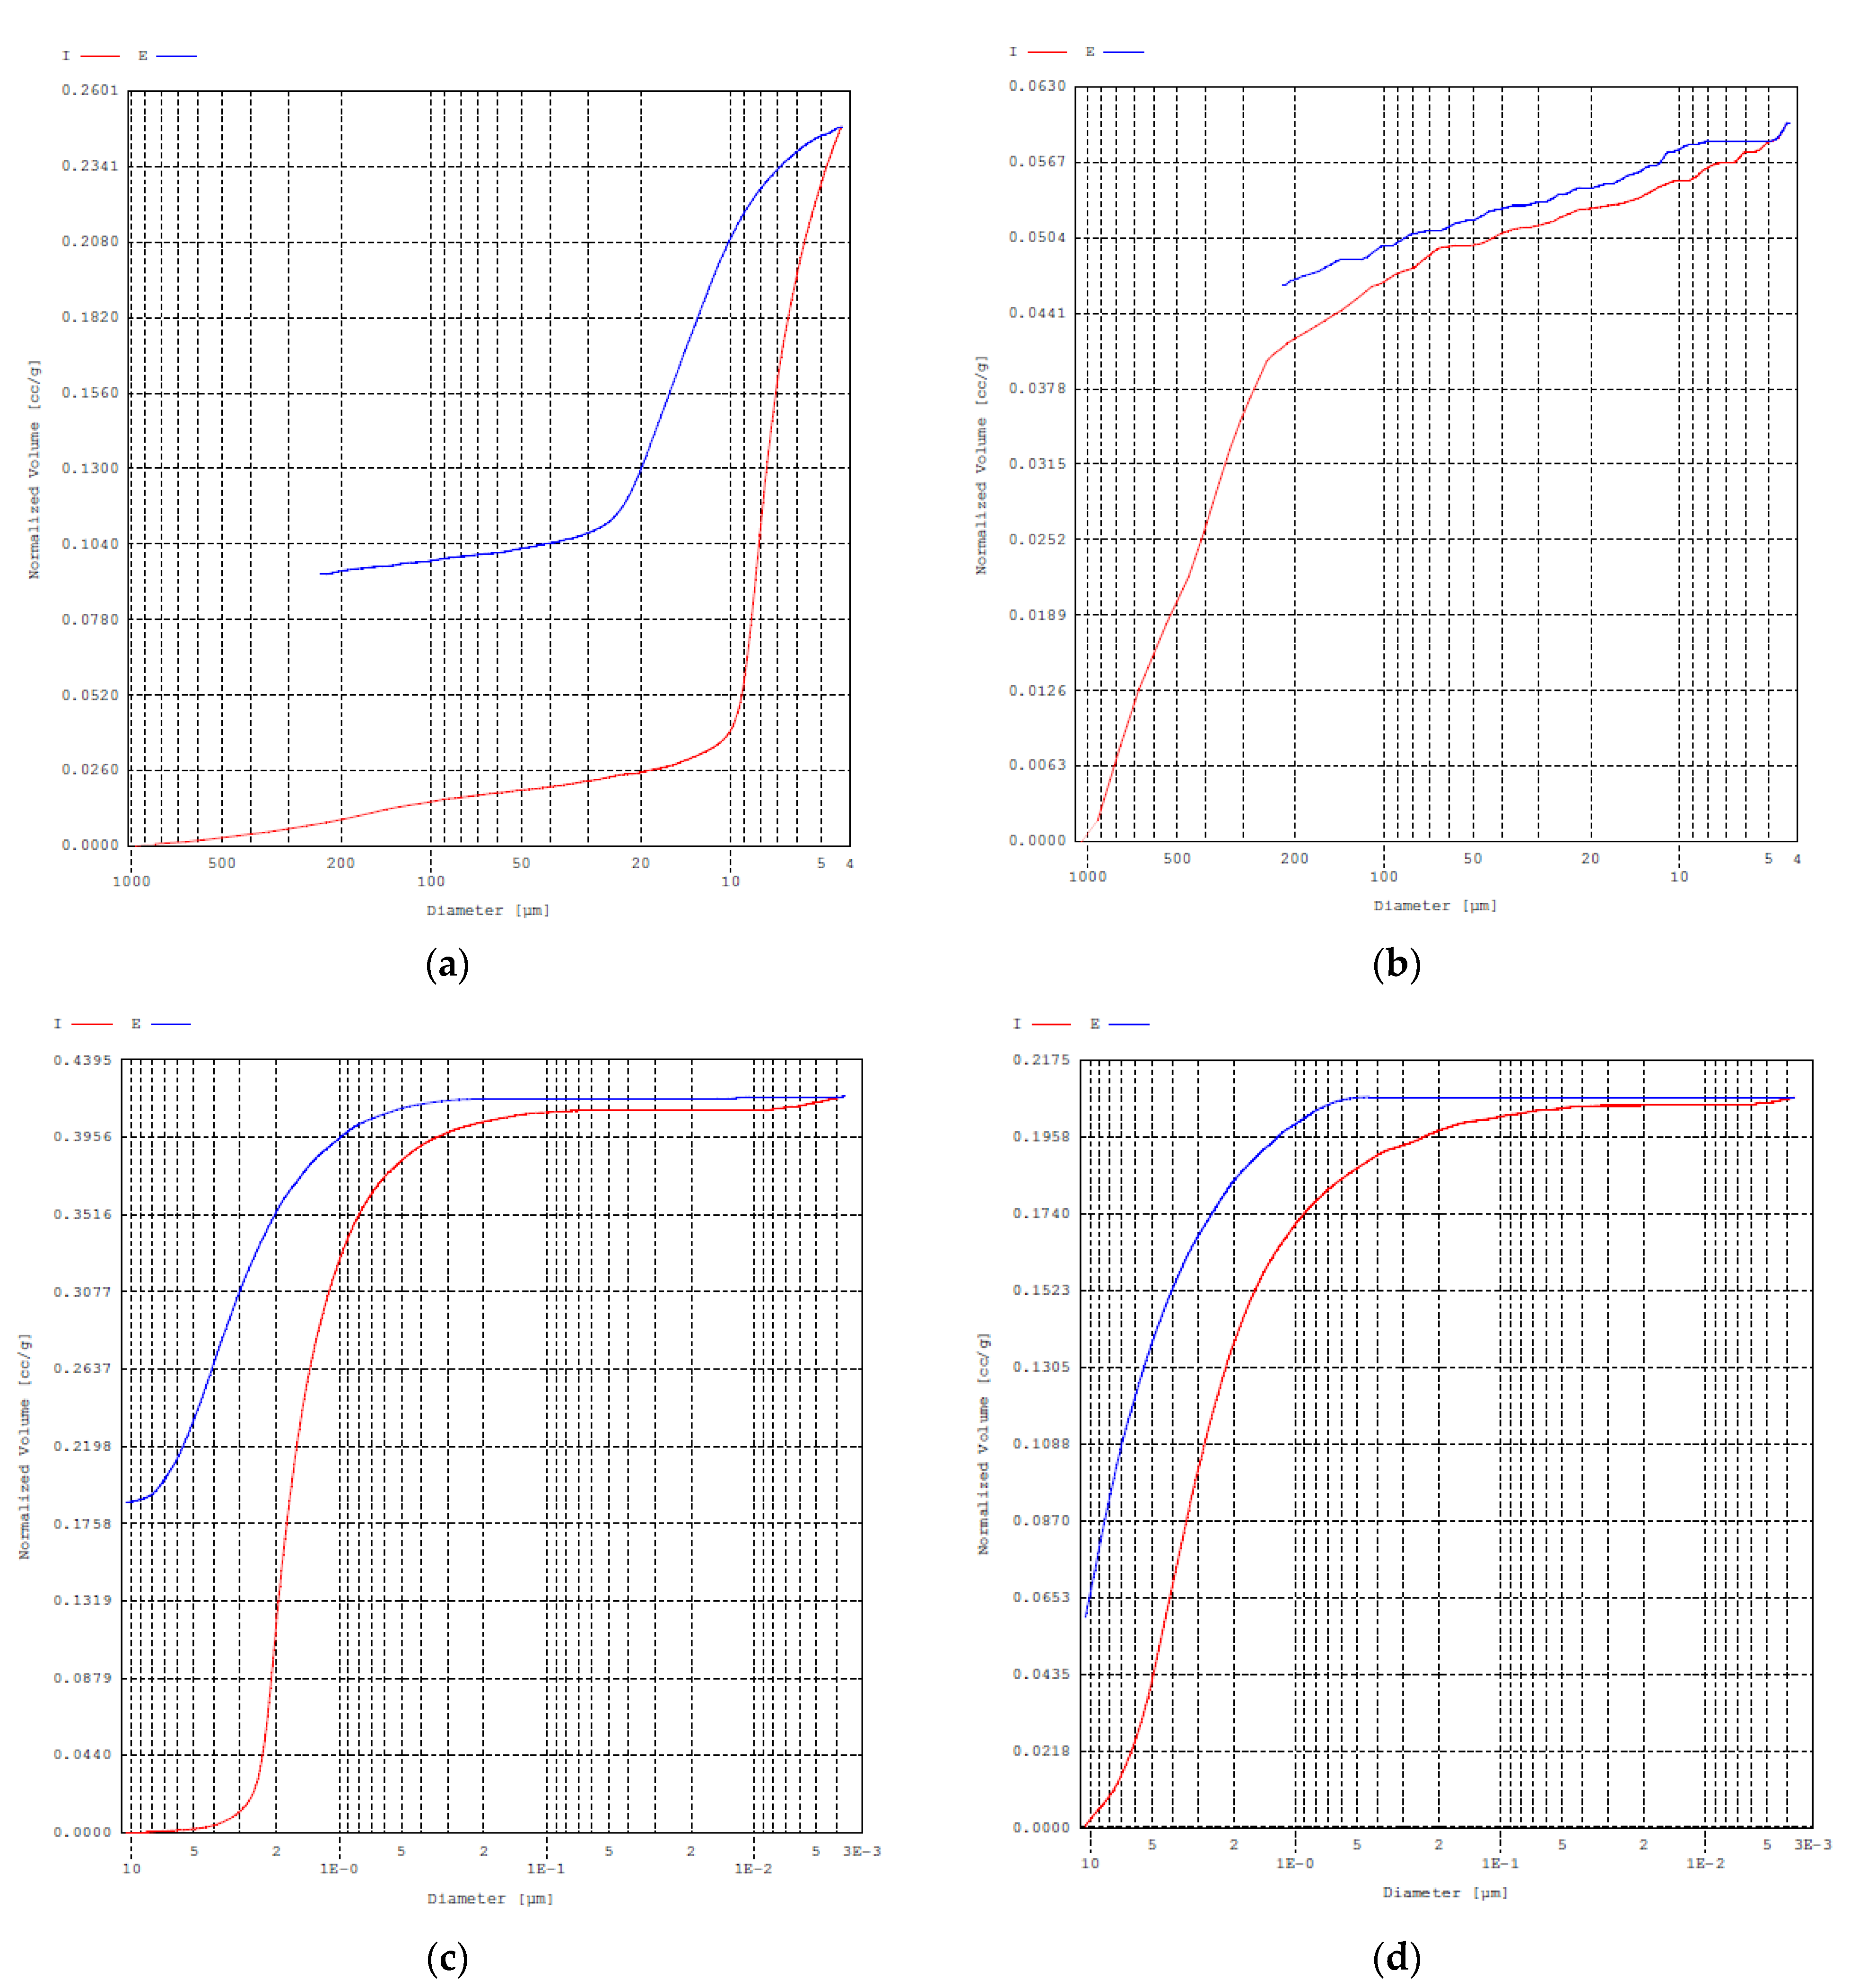
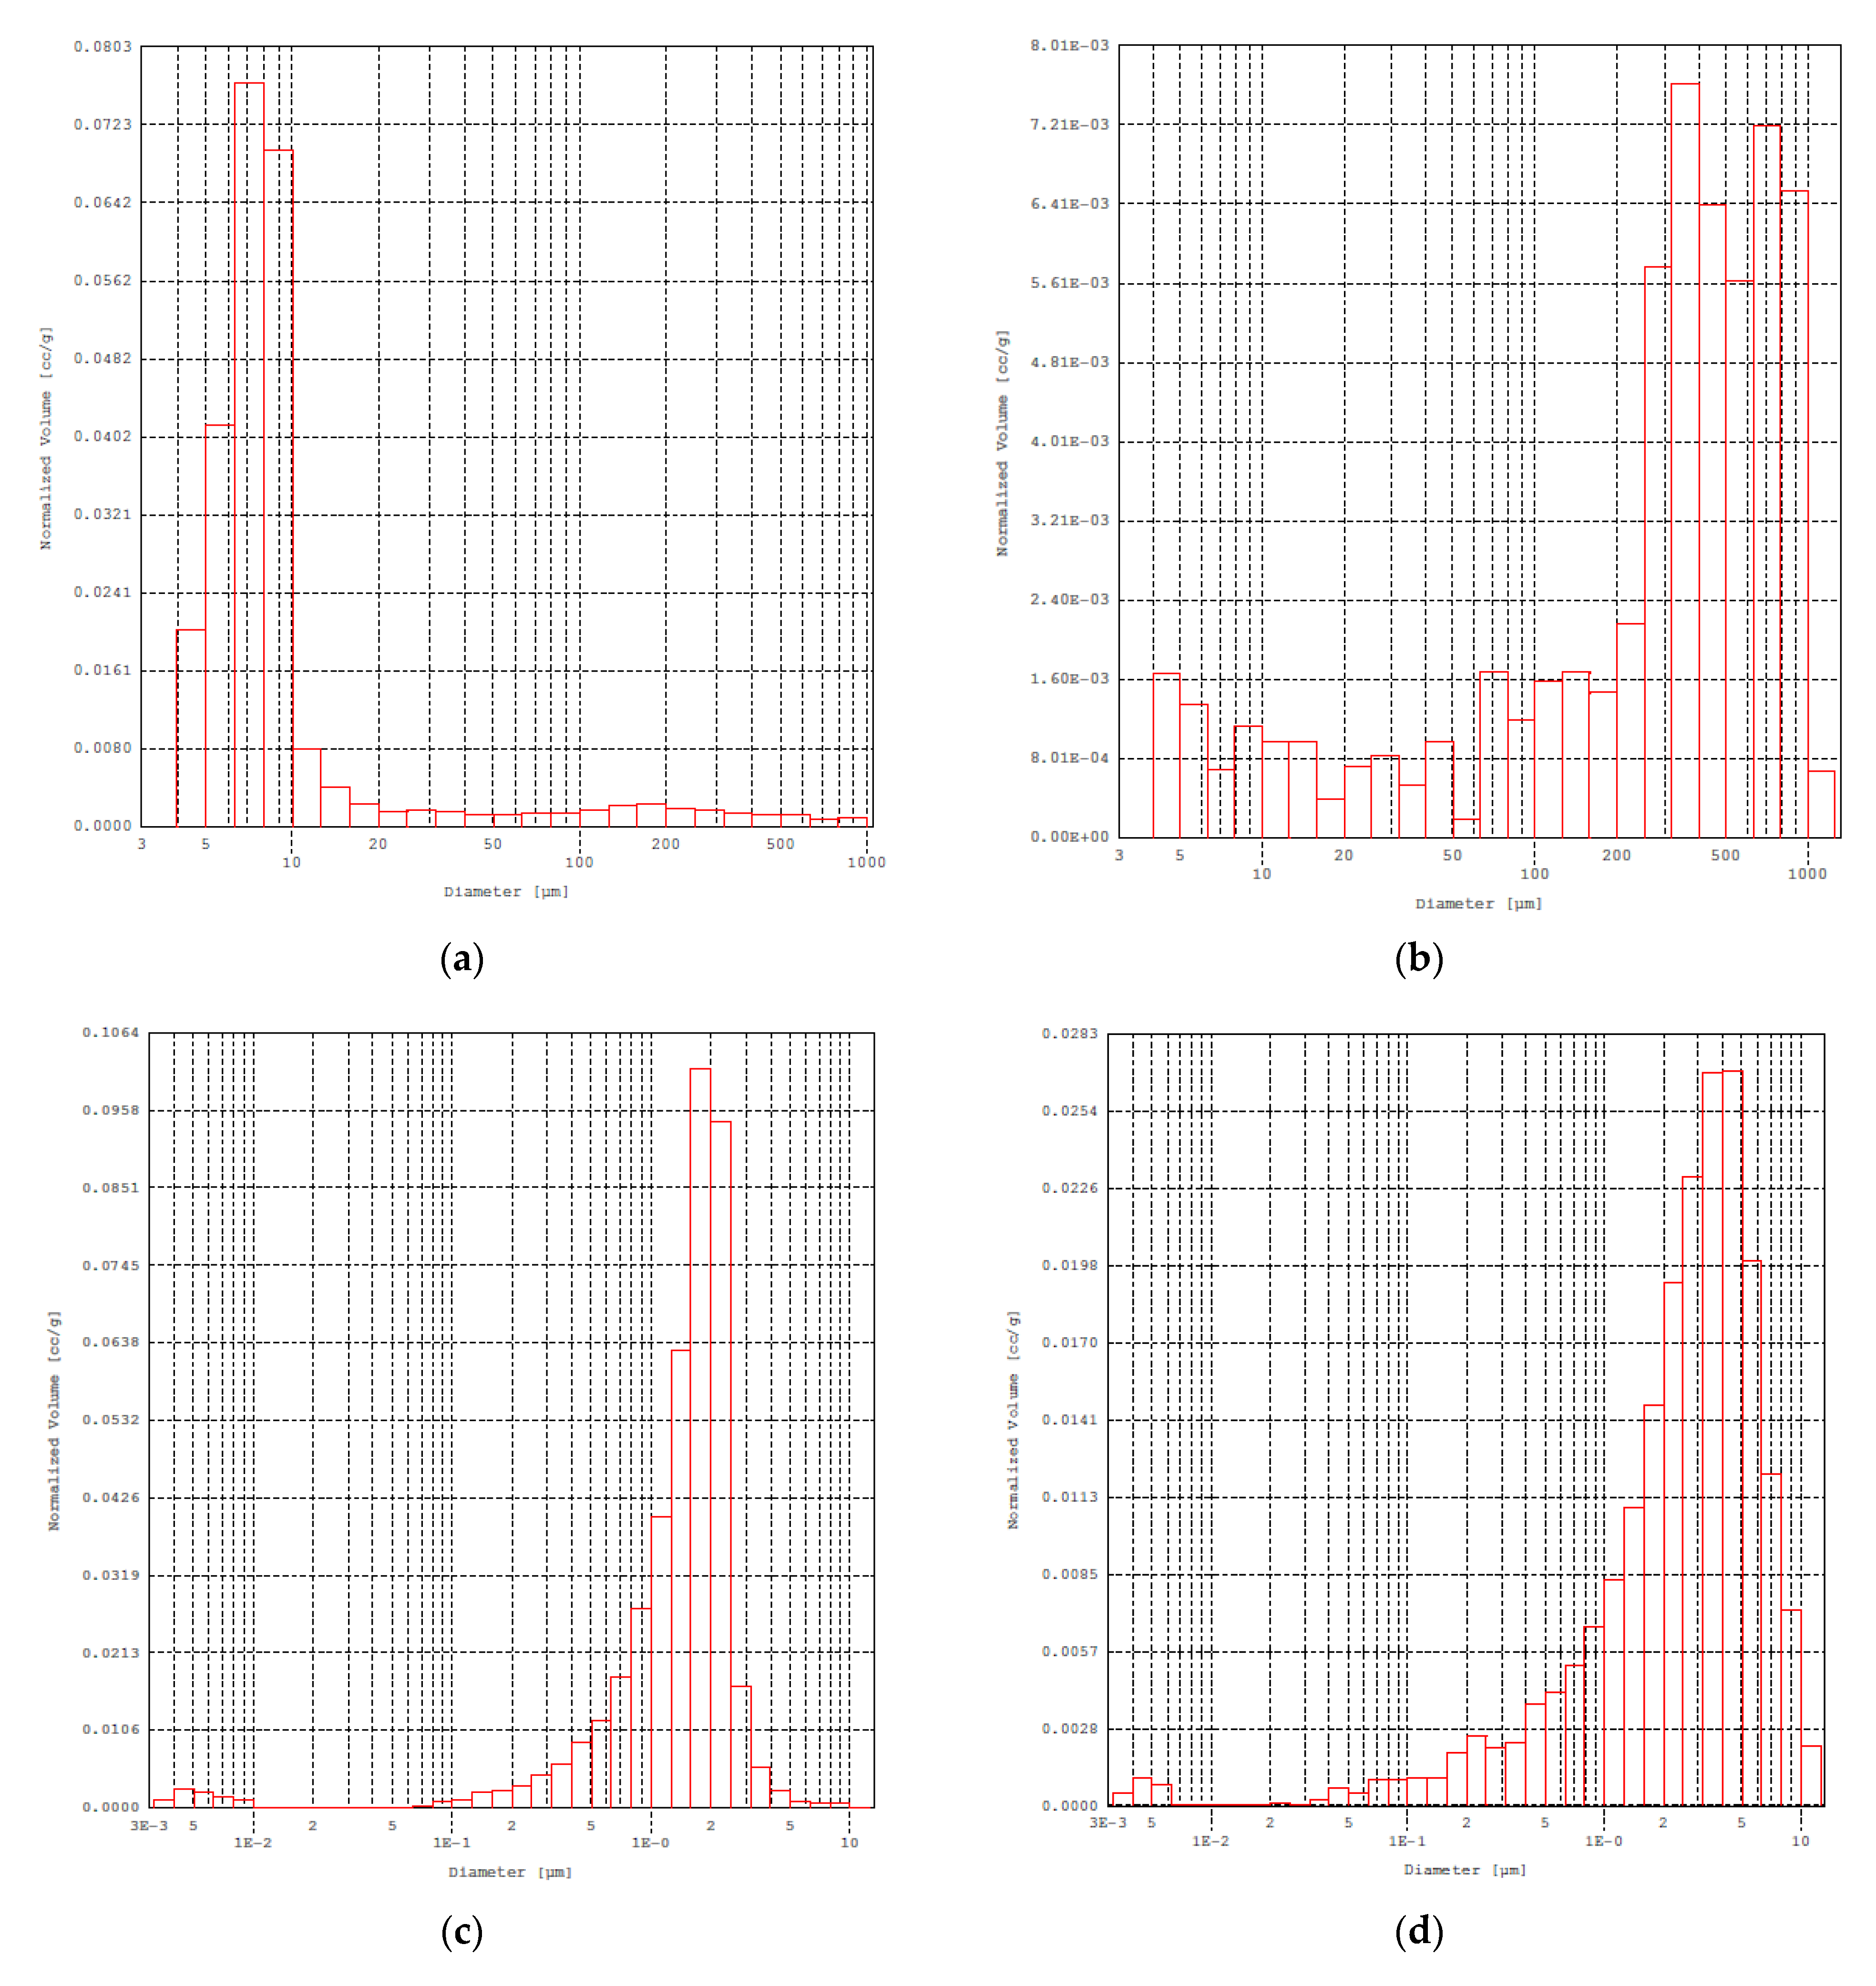
  • Mercury Intrusion Porosimetry (MIP): It is a technique where applying pressure forces mercury to enter the pores of the solid. The value of the volume of intruded mercury allows the calculation of area, pore size distribution, percentage of material porosity, and real and apparent densities. The relationship that describes the pressure required to force liquid mercury into the pores of a specific diameter is the called Washburn Equation. The tests can be run at low and high pressure. The low-pressure porosimetry technique was used to characterize pores from 900 micros down to approximately 7 microns. The high-pressure porosimetry was used in the characterization from 7 microns up to the mesopore range. Both tests, at low and high pressure, determined the total porosity of the specimens, as well as the interparticle and intraparticle porosities. The equipment used was a Poremaster 60 GT (Figure 3c). The tests were carried out in samples with a weight of 1 ± 0.01 g stabilized at a temperature of 20 °C.

3. Results and Discussion

3.1. Gypsum Plasters

As a summary, all the results obtained from the tests performed and their measurement variability (CoV) are compiled in Table 6.

3.1.1. Dry State Density

Figure 4 shows the results obtained for the dry state density of the new plasters. As it can be seen, the density results varied depending on the percentage of bioceramics added. It was observed that, as the amount of bioceramics added increased, the density also increased slightly. This increase was most noticeable for GBC-1 samples, reaching a value of 1220.22 kg/m3, which is higher than the one achieved for the reference sample. For lower percentages of bioceramics (GBC-0.3) the density value decreased, being even lower than the reference mixture.

3.1.2. Mechanical Properties

Figure 5 reports the results of flexural (a) and compressive strength (b). The results are compared to the mechanical properties of the reference sample (without additives). It should be noted that, in general, the increase in the percentage of bioceramics involved an improvement in the mechanical properties. For flexural strength, a slight decrease, compared to the reference mixture, was experienced when a percentage of 0.3% of bioceramics was added. When the amount of bioceramics increased, with 0.6 and 1% percentages, the flexural strength increased, achieving resistances above the reference specimens. For the GBC-1 samples, flexural strength reached an increase of 3% compared to the reference values. Regarding the compressive strength, all samples analyzed reached an increase compared to the reference sample, obtaining an increase of up to 21% in the case of the GBC-1 mixture.

3.1.3. Scanning Electron Microscopy (SEM)

To identify the alterations that the bioceramics caused in the microstructure of the plasters, a scanning electron microscopy (SEM) was employed for examining the microstructures of two samples, R and GBC-1 (mixture including 1% of bioceramics aggregate).
The SEM images obtained for the reference and GBC-1 specimens are presented in Figure 6. In the images, an alteration of the gypsum crystalline structure could be observed. The typical gypsum crystalline structure was modified when bioceramics were added to the mixture. Thus, a more compact matrix with shorter and more deformed crystal geometry was observed. Those results are in accordance with previous experiences, in which citric acid was used as aggregate when a similar behavior on the matrix was noticed [38].

3.2. Cement Mortars

As a summary, all of the results obtained from the tests performed and their measurement variability (CoV) are compiled in Table 7.

3.2.1. Fresh State Bulk Density

Figure 7 shows the density in a fresh state. It was observed that the density of all samples was lower than the one achieved for the reference sample. The progressive increase in bioceramics into the mortar matrix was linked to a density increase. However, the density value of the reference sample was not reached by any mortar. The values of the fresh mortar ranged from 2014.12 to 2074.38 kg/m3, compared to the 2096.74 kg/m3 obtained from the reference sample. Thus, lighter mortars were generated.

3.2.2. Dry State Density

The values obtained for the dry state density of the mortars are presented in Figure 8. As it can be seen, although they are, in all the cases, lower than the reference composite, the dry state density values were irregular. However, it was confirmed that the new mixtures were lighter than the reference material. The sample CBC-0.25 showed the biggest decrease, with a reduction of 5.7% compared to the reference density value.

3.2.3. Water Absorption by Capillarity

The variation in the coefficient of water absorption by capillarity (Figure 9), expressed in kg/m2·min0.5, was related to the previously obtained dry state density values. As for the dry state density values, the results for the coefficient of water absorption by capillarity were irregular. However, in all mixtures, this coefficient was lower than the coefficient achieved for the reference mortar. CBC-0.1 and CBC-0.4 presented similar values, thus reducing water absorption by capillarity of mortars up to 25% compared to the mortar mixture without bioceramics aggregate.

3.2.4. Mechanical Properties

Figure 10 reports the results of flexural (a) and compressive strength (b). The results were compared to the mechanical properties of the reference samples (without additives), which is presented as a dotted black line. The results showed an increase in the flexural strength of the samples. A slight decrease was experienced with the percentage of 0.25%, although it was higher compared to the reference sample. For the compressive strength, a slight increase was experienced in the 0.1 and 0.4% of bioceramics added mortars, compared to the reference one. For the CBC-0.25 mortar, a slight reduction in the compressive strength was experienced, compared to the control values.

3.2.5. Mercury Intrusion Porosimetry (MIP)

The results obtained for the mercury intrusion porosimetry tests are compiled in Table 8:
Figure 11, Figure 12 and Figure 13 show the results obtained at low and high pressure for the two specimens under study (R and CBC-0.4). The following graphs indicated a different behavior in the porous distribution of the two analyzed specimens.
In that sense, Figure 11 shows that a higher volume of mercury by sample weight was introduced into the reference specimen for the same test pressure. It indicated a higher porosity of the reference sample, compared to the CBC-0.4 specimen. The maximum pressure used in the test (42.070 PSI) until a volume of 0.2341 cc/g was introduced in the reference sample, whereas a volume of 0.0567 cc/g in the CBC-0.4 sample. The tests carried out at high pressure showed a constant volume of mercury in each sample regardless of the pressure used. For the reference sample, this volume reached a value higher than 0.3956, compared to 0.1958 reached in the CBC-04 mortar.
On the other hand, Figure 12 shows the normalized mercury volume according to the pore size. At a low pressure, the volume of mercury was strongly higher in the reference simple (R; approximately four times higher than the CBC-0.4 sample) concentrated mainly in the small diameters. Likewise, the graph of the reference specimen presented an uneven porous distribution with a high percentage of intraparticle capillaries between 10 and 5 µm. Regarding the interparticle distribution, the highest proportion of capillaries was concentrated in a range between 20 and 5 µm. Considering the CBC-0.4 sample, it can be observed that the sample presented an appreciable decrease in the volume of pores. In this case, the porous distribution was more homogeneous, although the existence of a percentage of large-capillary (200–1000 µm) intraparticles should be noted. As for the porous interparticle distribution, it presented a capillary distribution more homogeneous with a diameter between 200 and 5 µm. Besides, at high pressure, the mercury volume was significantly higher for the reference sample, reaching values over 0.3956 cc/g, compared to the CBC-0.4 sample that reached values over 0.1958, which showed a higher porosity in the reference sample.
Finally, Figure 13 shows the normalized intraparticle volume according to the pore-size histogram. In the results obtained at low pressure, a high percentage of small capillaries (5–10 µm) in the reference specimen and a very low concentration in higher pore size was observed. In relation to the CBC-0.4 specimen, a more homogeneous porous distribution was observed, with a higher concentration of capillaries with a larger pore diameter. In relation to the results obtained at high pressure for the reference sample, they showed the main concentration of pores in a size of 0.1 to 10 µm containing a great volume of capillaries with a size of 2–3 µm. For the CBC-04 sample, the distribution was more homogeneous, although it was concentrated from 1 to 10 µm with a lower volume compared to the reference sample.

4. Conclusions

The present work shows the experimental plan and the results obtained when incorporating bioceramics into construction materials. Bioceramics were used as additives, in different percentages, to the generation of new gypsum plasters and cement mortars in order to study their effect on the physical and mechanical properties of these materials. The results obtained from the experimental plan on gypsum mixtures showed that the addition of bioceramics contributed to improving the mechanical properties of the mixtures (flexural and compressive). The greatest increases were achieved by incorporating 1% bioceramics into the plaster matrix, which allowed them to increase their flexural strength by 3% and, notably, their compressive strength, related to the reference sample, by up to 21%. Regarding its physical properties, the addition of bioceramics by 1% slightly increased the density of the material. Finally, the microscopy tests revealed that a more compact matrix was achieved when bioceramics were used as an additive in the plasters.
On the other hand, the results obtained for the cement mortars showed that the incorporation of bioceramics into the mixtures produced alterations in their physical and mechanical properties. In this case, contrary to the results obtained for the gypsum plasters, the addition of bioceramics reduced the density of the resulting mortars. Likewise, it contributed to reducing the absorption of water by the capillarity of the mortars (up to 24%) and notably reduced its porosity, as it was reflected in the results obtained from the mercury porosimetry carried out on the CBC-0.4 sample (77% in tests at low pressure and 55% at high pressure). These results can be related to the microscopy images obtained in the plaster mortars, in which a more compact matrix (with fewer pores) was also observed when bioceramics were used as an aggregate. Regarding the mechanical properties of the cement mortars, the addition of bioceramics to these mortars, in a percentage of 0.4%, allowed to improve both the flexural and compressive strength of the new mortars.
In conclusion, the studies carried out on these materials allow us to deduce that the addition of bioceramics on gypsum plasters, and/or cement mortars, produced alterations in the internal structure of these materials, as it can be seen in the optical microscopy images as well as in the results of the mercury porosimetry. These modifications caused a reduction in the particle size of the materials, which led to a reduction in their porosity and, therefore, on their absorption capacity. These results could have a great relevance to the composites. The changes produced in the internal structure of the materials could positively affect their durability, a fact that will be studied in upcoming researches.

Author Contributions

F.P.-G.: conceptualization, writing—review and editing. M.J.M.-C.: writing—original draft, writing—review and editing, formal analysis. M.A.P.-R.: writing—original draft, writing—review and editing. All authors have read and agreed to the published version of the manuscript.

Funding

This research received no external funding.

Conflicts of Interest

The authors declare no conflict of interest.

References

  1. Tathe, A.; Ghodke, M.; Nikalje, A.P. A brief review: Biomaterials and their application. Int. J. Pharm. Pharm. Sci. 2010, 2, 19–23. [Google Scholar]
  2. Coatanlem, P.; Jauberthie, R.; Rendell, F. Lightweight wood chipping concrete durability. Constr. Build. Mater. 2006, 20, 776–781. [Google Scholar] [CrossRef]
  3. Bederina, M.; Laidoudi, B.; Goullieux, A.; Khenfer, M.M.; Bali, A.; Quéneudec, M. Effect of the treatment of wood shavings on the physico-mechanical characteristics of wood sand concretes. Constr. Build. Mater. 2009, 23, 1311–1315. [Google Scholar] [CrossRef]
  4. Mohammed, B.S.; Abdullahi, M.; Hoong, C.K. Statistical models for concrete containing wood chipping as partial replacement to fine aggregate. Constr. Build. Mater. 2014, 55, 13–19. [Google Scholar] [CrossRef]
  5. Elinwa, A.U.; Mahmood, Y.A. Ash from timber waste as cement replacement material. Cem. Concr. Compos. 2002, 24, 219–222. [Google Scholar] [CrossRef]
  6. Cheah, C.B.; Ramli, M. The implementation of wood waste ash as a partial cement replacement material in the production of structural grade concrete and mortar: An overview. Resour. Conserv. Recycl. 2011, 55, 669–685. [Google Scholar] [CrossRef]
  7. Siddique, R. Utilization of wood ash in concrete manufacturing. Resour. Conserv. Recycl. 2012, 67, 27–33. [Google Scholar] [CrossRef]
  8. Corinaldesi, V.; Mazzoli, A.; Siddique, R. Characterization of lightweight mortars containing wood processing by-products waste. Constr. Build. Mater. 2016, 123, 281–289. [Google Scholar] [CrossRef]
  9. Morales-Conde, M.J.; Rubio-de-Hita, P.; Pérez-Gálvez, F. Composite mortars produced with wood waste from demolition: Assessment of new compounds with enhanced thermal properties. J. Mater. Civ. Eng. 2018, 30, 04017273. [Google Scholar] [CrossRef]
  10. Dai, D.; Fan, M. Preparation of bio-composite from wood sawdust and gypsum. Ind. Crop. Prod. 2015, 74, 417–424. [Google Scholar] [CrossRef]
  11. Morales-Conde, M.J.; Rodríguez-Liñán, C.; Pedreño-Rojas, M.A. Physical and mechanical properties of wood-gypsum composites from demolition material in rehabilitation works. Constr. Build. Mater. 2016, 114, 6–14. [Google Scholar] [CrossRef]
  12. Pedreño-Rojas, M.A.; Morales-Conde, M.J.; Rubio-de-Hita, P.; Pérez-Gálvez, F. Impact of Wetting–Drying Cycles on the Mechanical Properties and Microstructure of Wood Waste–Gypsum Composites. Materials 2019, 12, 1829. [Google Scholar] [CrossRef] [PubMed] [Green Version]
  13. Pedreño-Rojas, M.A.; Morales-Conde, M.J.; Pérez-Gálvez, F.; Rodríguez-Liñán, C. Eco-efficient acoustic and thermal conditioning using false ceiling plates made from plaster and wood waste. J. Clean. Prod. 2017, 166, 690–705. [Google Scholar] [CrossRef]
  14. Del Río-Merino, M.; Santa Cruz-Astorqui, J.; Hernández-Olivares, F. New prefabricated elements of lightened plaster used for partitions and extrados. Constr. Build. Mater. 2005, 19, 487–492. [Google Scholar] [CrossRef]
  15. Siddique, R.; Singh, K.; Singh, M.; Corinaldesi, V.; Rajor, A. Properties of bacterial rice husk ash concrete. Constr. Build. Mater. 2016, 121, 112–119. [Google Scholar] [CrossRef]
  16. Mehta, P.K. Properties of blended cements made from rice husk ash. J. Proc. 1977, 74, 440–442. [Google Scholar]
  17. Jauberthie, R.; Rendell, F.; Tamba, S.; Cissé, I.K. Properties of cement—Rice husk mixture. Constr. Build. Mater. 2003, 17, 239–243. [Google Scholar] [CrossRef]
  18. Wei, J.; Meyer, C. Utilization of rice husk ash in green natural fiber-reinforced cement composites: Mitigating degradation of sisal fiber. Cem. Concr. Res. 2016, 81, 94–111. [Google Scholar] [CrossRef]
  19. Selamat, M.E.; Hashim, R.; Sulaiman, O.; Kassim, M.H.M.; Saharudin, N.I.; Taiwo, O.F.A. Comparative study of oil palm trunk and rice husk as fillers in gypsum composite for building material. Constr. Build. Mater. 2019, 197, 526–532. [Google Scholar] [CrossRef]
  20. Kesikidou, F.; Stefanidou, M. Natural fiber-reinforced mortars. J. Build. Eng. 2019, 25, 100786. [Google Scholar] [CrossRef]
  21. Lertwattanaruk, P.; Suntijitto, A. Properties of natural fiber cement materials containing coconut coir and oil palm fibers for residential building applications. Constr. Build. Mater. 2015, 94, 664–669. [Google Scholar] [CrossRef]
  22. Rodríguez-Liñán, C.; Morales-Conde, M.J.; Rubio-de-Hita, P.; Pérez-Gálvez, F.; Pedreño-Rojas, M.A. The influence of natural and synthetic fibre reinforcement on wood-gypsum composites. Open Constr. Build. Technol. J. 2017, 11, 350–362. [Google Scholar]
  23. Sormunen, P.; Kärki, T. Recycled construction and demolition waste as a possible source of materials for composite manufacturing. J. Build. Eng. 2019, 24, 100742. [Google Scholar] [CrossRef]
  24. Zhang, L.W.; Sojobi, A.O.; Kodur, V.K.R.; Liew, K.M. Effective utilization and recycling of mixed recycled aggregates for a greener environment. J. Clean. Prod. 2019, 236, 117600. [Google Scholar] [CrossRef]
  25. Coppola, L.; Bellezze, T.; Belli, A.; Bignozzi, M.C.; Bolzoni, F.; Brenna, A.; Cabrini, M.; Candamano, S.; Cappai, M.; Caputo, D.; et al. Binders alternative to Portland cement and waste management for sustainable construction—Part 1. J. Appl. Biomater. Funct. Mater. 2018, 16, 186–202. [Google Scholar]
  26. Leung, T.K.; Huang, P.J.; Chen, Y.C.; Lee, C.M. Physical-chemical Test Platform for Room Temperature, Far-infrared Ray Emitting Ceramic Materials (cFIR). J. Chin. Chem. Soc. 2011, 58, 653–658. [Google Scholar] [CrossRef]
  27. Shigezo, S.; Tetsuro, Y.; Tadahiko, M.; Hiroki, T.; Tomoki, E.; Tsunehisa, A. Effect of Far-Infrared Light Irradiation on Water as Observed by X-Ray Diffraction Measurements. Jpn. J. Appl. Phys. 2004, 43, L545. [Google Scholar]
  28. Leung, T.; Lin, S.; Yang, T.; Yang, J.; Lin, Y. The Influence of Ceramic Far-Infrared Ray (cFIR) Irradiation on Water Hydrogen Bonding and its Related Chemo-physical Properties. Hydrol. Curr. Res. 2014, 5. [Google Scholar] [CrossRef] [Green Version]
  29. AENOR. UNE-EN 13279–1: Gypsum Binders and Gypsum Plasters. Part 1: Definitions and Requirements; AENOR: Madrid, Spain, 2006. [Google Scholar]
  30. AENOR. UNE-EN 13279–2: Gypsum Binders and Gypsum Plasters. Part 2: Test Methods; AENOR: Madrid, Spain, 2006. [Google Scholar]
  31. Ministerio de la Presidencia. RC-16. Instrucción Para la Recepción de Cementos; Ministerio de la Presidencia: Madrid, Spain, 2016. [Google Scholar]
  32. AENOR. UNE-EN 933-1: Tests for Geometrical Properties of Aggregates. Part 1: Determination of Particle Size Distribution. Sieving Method; AENOR: Madrid, Spain, 2012. [Google Scholar]
  33. AENOR. UNE-EN 1097-6: 2001/A1. Tests for Mechanical and Physical Properties of Aggregates. Part 6: Determination of Particle Density and Water Absorption; AENOR: Madrid, Spain, 2006. [Google Scholar]
  34. AENOR. UNE-EN 1015-11:2000/A1. Methods of Test for Mortar for Masonry. Part 11: Determination of Flexural and Compressive Strength of Hardened Mortar; AENOR: Madrid, Spain, 2007. [Google Scholar]
  35. AENOR. UNE-EN 1015-6: Methods of Test for Mortar for Masonry. Part 6: Determination of Bulk Density of Fresh Mortar; AENOR: Madrid, Spain, 2000. [Google Scholar]
  36. AENOR. UNE-EN 1015-10: Methods of Test for Mortar for Masonry. Part 10: Determination of Dry Bulk Density of Hardened Mortar; AENOR: Madrid, Spain, 2000. [Google Scholar]
  37. AENOR. UNE-EN 1015-18: Methods of Test for Mortar for Masonry. Part 18: Determination of Water Absorption Coefficient Due to Capillary Action of Hardened Mortar; AENOR: Madrid, Spain, 2003. [Google Scholar]
  38. Lanzón, M.; García-Ruiz, P.A. Effect of citric acid on setting inhibition and mechanical properties of gypsum building plasters. Constr. Build. Mater. 2012, 28, 506–511. [Google Scholar] [CrossRef]
Figure 1. Bioceramics powder used as an aggregate for the development of the new mortars.
Applsci 11 03519 g001
Figure 2. Sand grading curve with a maximum aggregate size (MAS) of 4 mm.
Applsci 11 03519 g002
Figure 3. Equipment used for the several test methods conducted for the gypsum plasters and cement mortars characterization: (a) Suzpecar multi-test press for flexural and compressive strength tests; (b) Phillips XL-30 Scanning Electron Microscope used for SEM tests; (c) Poremaster 60 GT used for MIP tests.
Applsci 11 03519 g003
Figure 4. Dry state density results for gypsum plasters.
Applsci 11 03519 g004
Figure 5. Mechanical properties of gypsum plasters (a) Flexural strength results; (b) Compressive strength values.
Applsci 11 03519 g005
Figure 6. SEM images obtained for gypsum plasters (a) Reference material; (b) GBC-1.
Applsci 11 03519 g006
Figure 7. Fresh state bulk density results for cement mortars.
Applsci 11 03519 g007
Figure 8. Dry state density results for cement mortars.
Applsci 11 03519 g008
Figure 9. Water absorption by capillarity results for cement mortars.
Applsci 11 03519 g009
Figure 10. Mechanical properties of cement mortars (a) Flexural strength results; (b) Compressive strength values.
Applsci 11 03519 g010
Figure 11. The normalized volume of mercury vs. pressure (low and high). Intraparticle porosity is shown in red and interparticle one in blue: (a) Reference at low pressure; (b) MBC-0.4 at low pressure; (c) Reference at high pressure; (d) MBC-0.4 at high pressure.
Applsci 11 03519 g011
Figure 12. The normalized volume of mercury vs. pore size in low and high pressure. Intraparticle porosity is shown in red and interparticle one in blue: (a) Reference at low pressure; (b) MBC-0.4 at low pressure; (c) Reference at high pressure; (d) MBC-0.4 at high pressure.
Applsci 11 03519 g012
Figure 13. Normalized intraparticle volume vs. pore size histogram in low and high pressure. Intraparticle porosity is shown in red: (a) Reference at low pressure; (b) MBC-0.4 at low pressure; (c) Reference at high pressure; (d) MBC-0.4 at high pressure.
Applsci 11 03519 g013
Table 1. Bioceramics chemical composition.
Composition[%]
Silica (SiO2)62.72
Alumina (Al2O3)25.88
Sodium oxide (Na2O)2.30
Ferric oxide (Fe2O3)0.47
Potassium oxide (K2O)1.16
Calcium oxide (CaO)0.42
Table 2. Characteristics of gypsum powder used as base material.
Purity
[%]
Particle Size
[mm]
Surface Hardness
(Shore C)
Performance
[kg/m2/cm Thickness]
Flexural Strength [N/mm2]Compressive Strength
[N/mm2]
Adherence [N/mm2]Ph
>750–1>4510–12>2>2>0.1>6
Table 3. Gypsum plasters composition (per kilogram of powder used).
SamplesGypsum [g]Water [g] or [mL]W/G RatioBioceramics [g]
Reference (R)10005500.55-
GBC-0.310005500.553
GBC-0.6510005500.556.5
GBC-110005500.5510
Table 4. White cement (BL II/A-L 42.5 R) chemical composition.
Composition[%]
Calcium oxide (CaO)62.01
Silica (SiO2)18.33
Alumina (Al2O3)4.81
Ferric oxide (Fe2O3)3.22
Sulfuric anhydride (SO3)3.15
Magnesium oxide (MgO)0.83
Potassium oxide (K2O)0.69
Sodium oxide (Na2O)0.18
Titanium oxide (TiO2)0.01
Table 5. Cement mortars composition (per kilogram of white cement used).
SamplesCement [g]Aggregate [g]C/A RatioWater [g] or [mL]W/C RatioBioceramics [g]
Reference (R)100033330.36000.6-
CBC-0.1100033330.36000.63.3
CBC-0.25100033330.36000.68.3
CBC-0.4100033330.36000.613.3
Table 6. Summary table with all the test results obtained for gypsum plasters.
SamplesDry State Density
[kg/m3]
(CoV [%])
Flexural Strength
[MPa]
(CoV [%])
Compressive Strength [MPa]
(CoV [%])
Reference (R)1209.56 (0.26)3.84 (4.55)9.02 (21.16)
GBC-0.31206.65 (1.49)3.81 (7.87)9.36 (18.76)
GBC-0.651209.61 (1.85)3.89 (6.06)9.58 (33.26)
GBC-11220.22 (1.24)3.96 (6.49)10.96 (20.49)
Table 7. Summary table with all the test results obtained for cement mortars.
SamplesFresh State Density
[kg/m3]
(CoV [%])
Dry State Density
[kg/m3]
(CoV [%])
Water Absorption
[kg/m2·min0.5]
Flexural Strength
[MPa]
(CoV [%])
Compressive Strength [MPa]
(CoV [%])
Reference (R)2096.74 (0.26)1989.82 (0.18)0.424.68 (5.26)23.66 (10.23)
CBC-0.12040.12 (0.74)1937.97 (0.15)0.295.38 (7.00)24.59 (22.73)
CBC-0.252066.01 (1.33)1876.31 (0.23)0.414.92 (10.70)20.21 (26.22)
CBC-0.42074.38 (1.16)1956.00 (0.05)0.325.68 (13.52)27.71 (25.03)
Table 8. Mercury intrusion porosimetry tests results.
SamplesPorosity TypeReference (R)CBC-0.4
Low PressureTotal [%]31.607.04
Interparticle [%]31.607.04
Intraparticle [%]0.000.00
High PressureTotal [%]59.0826.43
Interparticle [%]0.737.72
Intraparticle [%]58.3518.71
Publisher’s Note: MDPI stays neutral with regard to jurisdictional claims in published maps and institutional affiliations.

