Abstract
In online commerce systems that trade in many products, it is important to classify the products accurately according to the product description. As may be expected, the recent advances in deep learning technologies have been applied to automatic product classification. The efficiency of a deep learning model depends on the training data and the appropriateness of the learning model for the data domain. This is also applicable to deep learning models for automatic product classification. In this study, we propose deep learning models that are conscious of input data comprising text-based product information. Our approaches exploit two well-known deep learning models and integrate them with the processes of input data selection, transformation, and filtering. We demonstrate the practicality of these models through experiments using actual product information data. The experimental results show that the models that systematically consider the input data may differ in accuracy by approximately 30% from those that do not. This study indicates that input data should be sufficiently considered in the development of deep learning models for product classification.
1. Introduction
Recently, internet commerce has become more active as internet distribution networks have grown. Because of the resulting increase in volume and variety of products, classification methods have become important. Traditional electronic commerce (e-commerce) is based on business-to-consumer (B2C) transactions. Herein, classification tasks are convenient because companies have all the information on the products they sell to customers. However, the recently emerged used-product trading is consumer-to-consumer (C2C) trading. Herein, any entity can input and register product information. Furthermore, a private seller can arbitrarily input the product name, detailed description, price, and product category of a product they are selling. However, unlike companies, private sellers do not have the correct information on the products sold, and the product information entered may be inaccurate.
Inaccurate product classification is disadvantageous for both seller and buyer. The appropriate product category can be identified if text data extracted from past data of used-product transactions are refined and used to train a deep learning model. This is a technical solution to the problem of inaccurate classification. Deep learning models have been developed mainly by two approaches. The first approach is to apply a well-known typical deep model as-is by tuning hyperparameters. This approach sets the weights of some particular layers appropriately and applies it in typical models such as a convolutional neural network (CNN) [,]. The second approach is to develop a technically new model [,].
This study found that deep learning model development and hyperparameter tuning should be integrated for the resulting model to be conscious of the product information data []. Specifically, we considered the text data of product information appropriately and propose an architecture that integrates the data selection, transformation, and filtering processes with the training of CNN [,,] and bidirectional long short-term memory (Bi-LSTM) [,,] models. We adopted a methodology that performs the required partial transformation and adds layers to fit the data in these typical deep learning models. These models are established to be suitable for the product classification of product information text data. We performed a comparative analysis using actual data to determine the proposed deep learning model that is more suitable for the automatic classification of products. In addition, we conducted a case study in which stopwords [,] were filtered out using heuristics during the text data filtering process to investigate its effect on the model performance.
2. Related Work
Product classification can be an application of text classification problem, if we consider only text data for product information. Early studies on automatic product classification exploited the traditional text classifiers such as Naïve Bayes, SVM (support vector machine), and KNN (k-nearest neighbors) [,,]. Aanen, S. et al. [] exploited a lexical similarity to improve the disambiguation of product taxonomy and suggested an ontology-based approach using WordNet. Lee, T., et al. [] also suggested an ontological approach to classify the products, and they exploited a set of ontological data dictionaries for keyword-based product classification.
Recently, various deep learning models have been applied in studies related to product classification. Table 1 summarizes representative related works and the deep learning models or classifiers used therein. It also summarizes whether the approach of each work was to develop a new model or to tune the hyperparameters of an existing model, as mentioned in the previous section.

Table 1.
Studies related to deep learning models for product classification.
Krishnan, A. et al. [] proposed an approach based on multi-CNN and multi-LSTM models (flat models). Hierarchical and flat classification schemes were compared. The results showed that the multi-CNN and multi-LSTM were more robust than the bag-of-word model (hierarchical model). The paper proposed an approach based on multi-CNN and multi-LSTM and a novel method that combines structured attributes with the deep learning models.
Xia, Y. et al. [] classified product categories using product title data in Japanese, which is an agglutinative language. An attention conventional neural network (ACNN) was proposed using a conventional CNN model and gradient boosted tree (GBT) []. In the ACNN, a context encoder and an attention mechanism exist in the left and right modules, respectively. Moreover, higher weights are assigned to certain parts of the inputs through embedding. This plays the role of emphasizing tokens that have high correlations semantically.
Das, P. et al. [] discussed data preprocessing to improve classification performance by increasing the quality of data. In that study, noise data were removed using various methods. The imbalance of data was quantified, and experiments were conducted using a basic algorithm such as Naïve Bayes (NB) [] and by additionally applying CNN and GBT. They indicated that performance could be improved further using a method that deletes noise data as stopwords. The related works mentioned above regard automatic product classification as a classification problem []. Furthermore, a commonality between these works is that they discussed the effect of various input data on classification models.
As deep learning technology has been actively researched in image processing and recognition areas, some studies suggested to exploit the product image data for product classification [,]. Ha, J. et al. [] proposed a RNN-based DeepCNN model for product classification using real data from their own shopping mall. They used text data such as product names and brand names, and the use of image data was also suggested. Their data were imbalanced across the categories like ours. Note that data imbalance problems are frequently observed in other deep learning based studies as well [,]. Zahavy, T. et al. [] proposed a multi-modality framework using VGG, a kind of CNN model, for image data as well as text data of product information.
3. Proposed Methods
3.1. Model Architecture and Dataset Details
Our proposed product classification model is based on an approach that integrates the data selection, transformation, and filtering phases with the inputs of the deep learning model used. Figure 1 illustrates an overview of this architecture. The selection phase involves the selection of appropriate input data as training data, and the transformation phase involves the structural (rather than semantic) transformation of the selected data for their convenient application in training. For example, we (1) removed null data, duplicate data, etc.; (2) removed special characters, emojis, etc., except letters; and (3) used a morphological analyzer to extract only meaningful words or characters as outputs.
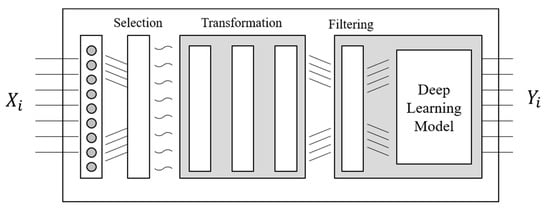
Figure 1.
Architecture of our data-conscious product classification model: incorporated with the selection, transformation, and filtering phases.
After the transformation phase, the filtering process is performed to filter out and remove the stopwords (which are considered to be unnecessary for training) among the words. Upon completion of the transformation phase, ancillary tasks such as tokenization, padding, or tensorization are performed. Finally, the results are used as the input data to train the deep learning models. Various deep learning models can be employed. The models we used are presented in the next section.
In this study, we used real-world data provided by a South Korean used-product trading platform company []. The data contained the information of approximately 2.9 million products the second half of 2019. The product information data comprised the attributes “name”, “keyword”, and “description” in the text format, and “category” in the integer format. The attributes “name”, “keyword”, and “description” provided each product’s name, keyword, and description, respectively. Meanwhile, the attribute “category” provided the product classification number to which each product belonged to. For the product classification, we used the second-level classification of a commonly used three-level hierarchy system [,]. The total number of second-level categories was around 120. Note that we can have seven ways of simply combining the training data for the selection process, as there are three attributes of data: “name”, “keyword”, and “description”.
Figure 2 shows the distribution of the number of product data by category in descending order. It is distributed disproportionately across the categories, similar to other datasets [,,]. Figure 3 shows the distribution of the number of words for the name, keyword, and description attributes. In the figure, the distributions before and after the transformation phase are represented by blue and orange, respectively. The blue and red vertical lines represent the average number of words per product data for each attribute before and after the transformation phase, respectively. After the process, the average number of words for the name, keyword, and description attributes varied to 5.2, 6.6, and 39.9, respectively. In the case of the name and keyword attributes, the number of words increased because these were split into nouns through the transformation process. However, in the case of description, the number of words decreased because words such as postpositions were removed. In Figure 3, we omit the parts that are difficult to display on the graph because of low word-frequencies.
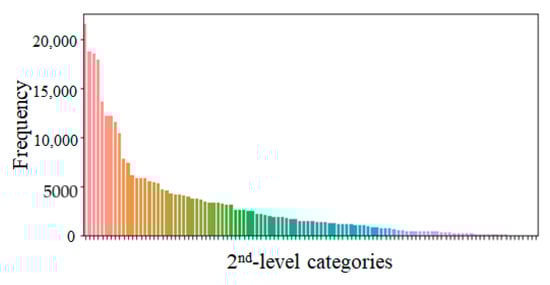
Figure 2.
Distribution of number of products for each category.
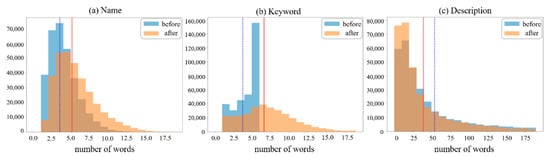
Figure 3.
Distributions of number of words for name, keyword, and description attributes (blue: before transformation phase, orange: after transformation phase).
Table 2 describes the difference in the data before and after the transformation phase and shows an example of the product data. The data were originally in Korean. Although English translations are provided, there is a limitation: the characteristics of Korean cannot be presented.
Table 2.
Example of data according to the transformation phase.
In the filtering phase, stopwords were selected based on various criteria to conduct a case study on the influence of the stopwords (see Section 4.2). Figure 4 shows the results of an analysis of the frequencies of all the words appearing in the experimental data. Figure 4a shows the frequency (logarithmic form) of words combining all the attributes. The vertical lines in (a) represent the proportion of the top 10% frequency words among all the words for description, keyword, and name (left to right): approximately 13.5 K, 15.2 K, and 17.4 K words, respectively. The top 10% of words of the three attributes exist within approximately 13.5% of all of the words (129 K words). Figure 4b shows the frequency (logarithmic form) of words for each attribute.
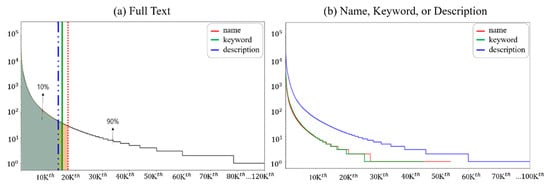
Figure 4.
Words and their frequency distributions. Each word is sorted in descending order based on its appearance frequency in all the attributes (a) or in individual attributes (b).
Figure 4 sorts the frequency of words in descending order. Among these, the words corresponding to the top 1% (1.3 K words) were selected. These are stopwords corresponding to six criteria and were determined to be non-influential in the data training. Furthermore, after selecting various stopwords according to the criteria, we continued the study following the procedure shown in Figure 1.
3.2. Models for Baseline
In this study, we used NB, CNN, and Bi-LSTM as models for product classification.
Naïve Bayes (NB). We applied NB as a baseline model for comparison with the deep learning models proposed in this paper. We chose it as the baseline non-deep learning model, similar to the approach described in [,]. In the experiments, NB was applied after training TF-IDF (term frequency-inverse document frequency) [].
Convolutional Neural Network (CNN). The model was designed primarily to effectively process images. A convolutional layer that extracts feature values and a pooling layer that reduces the layer size are configured repeatedly. All the nodes with the resulting data processed until the present are connected and represented in a one-dimensional array. This is called a fully-connected layer. It is added at the end of model construction. Figure 5a shows the architecture of the CNN model employed in this paper.
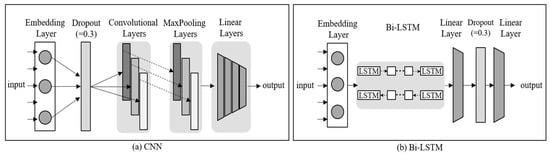
Figure 5.
Architectures of our CNN model and Bi-LSTM model. Each model is plugged in as a deep learning model in Figure 2.
After the filtering method is applied to an original image, the classification operation is performed for the filtered image. In this study, the channel size was set to one for it to be suitable for text, among various CNN models. The width size was 300, which is equal to that for embedding. The embedding layer was applied, and the dropout activation function was executed using a value of 0.3. The inputs based on the attribute values set up were combined into a single layer. After transforming a three-dimensional tensor into a four-dimensional tensor, the dropout function was executed. After the development of convolution layers with the kernel size list of the input attributes, the tensor was reduced to two dimensions. After inserting max pooling layers, the tensor was manipulated into four dimensions, and these were combined into a single layer. The linear layers were processed repeatedly. Finally, the Softmax function was applied for normalization and output.
Bidirectional Long-Short Term Memory (Bi-LSTM). LSTM is a type of recurrent neural network (RNN) []. It was designed to solve the long-term dependency problem, which occurs when the time gap for obtaining necessary information is large. It has an architecture wherein a cell-state is added to the hidden state in an RNN. The limitation of LSTM is that it is executed based on the immediately preceding pattern. Bi-LSTM was designed to overcome this limitation. In Bi-LSTM, forward training and backward training are performed through an RNN. One of its advantages is that the performance does not decrease even when the length of data is large. Figure 5b shows the architecture of the Bi-LSTM model employed in this paper.
In this study, the proposed Bi-LSTM is set to facilitate this model in both directions. The hidden size is set to 64, and the embedding is performed. The inputs based on the attribute values that are set are combined into a single layer. The combined layer is entered into the LSTM layer and processed. Two pooling layers are passed through, and each layer outputs the mean and maximum. Then, these are combined back into one layer. This linear layer is processed repeatedly. Subsequently, the dropout function is executed with a value of 0.3 []. Finally, the linear layer is passed through one more time, which completes the process.
4. Experiment
4.1. Performance Results
Based on the data-conscious method proposed in this paper, we compared and evaluated the performance of each model trained by plugging in the CNN and Bi-LSTM models presented in the previous section. The NB model was considered as the baseline. We measured the accuracy as the performance metric. All the experiments were conducted using a GPU (Tesla P100-PCIE-16 GB RAM) provided by Google Colab Pro (Google Colaboratory, https://colab.research.google.com/).
We performed the experiment to determine the performance of each model for the selection, transformation, and filtering processes. Table 3 shows the accuracy for each combination method and the training time required for each method. For example, the second row of Table 3 shows that the accuracy of the model trained using the CNN deep learning model up to the selection phase is 48.67% in the worst case, 74.25% in the best case, and 67.74% on an average. If this CNN deep learning model is used in the selection and transformation phases, the accuracy is 58.92% in the worst case, 78.69% in the best case, and 73.14% on an average. These results demonstrate that if the CNN deep learning model is used indiscriminately without considering the data as a product classification model, its accuracy can differ by approximately 67.74% from that of the CNN model that effectively considers the data in both selection and transformation phases. The average accuracy increases by 7.4% after the selection-transformation phases compared with that after only the selection phase. Similar results are obtained when the Bi-LSTM deep learning model is used: the maximum and average differences are 29% and 7.3%, respectively.
Table 3.
Comparison of accuracy and training time between deep learning models (time: hh:mm:ss).
The final average accuracy is 52.28% in the case wherein the NB model is used. However, it is 73.45% and 72.32% in the cases where the proposed CNN and Bi-LSTM models, respectively, are used. Furthermore, when the baseline and deep learning models are compared, the minimum and maximum differences in accuracy are 10.79% and 31.09%, respectively. These results verify that the method of training the deep learning models is effective for increasing the classification accuracy. Furthermore, it was observed that the two models are highly suitable for the methodology and product data used in this study. A comparison of the accuracy of the deep learning models reveals that the CNN model shows an accuracy that is marginally higher (an average difference of 1.12%) than that of the Bi-LSTM model. A performance comparison between the selection-transformation phases and selection-transformation-filtering phases for each model reveals that the Bi-LSTM shows an increase, although it is marginal. For example, the average accuracy increases from 71.91% to 72.32. However, in the case of the CNN model, the increase is smaller than that for the Bi-LSTM and negligible. These results indicate that attention should be paid to the selection of stopwords for removal in the filtering phase. The next section presents a case study of this.
The deep learning models were also examined in terms of time because the training time was required. The training time for each case is shown in the cell below that with the relevant accuracy performance in Table 3. For example, the training time required for the CNN model that showed the best accuracy after the filtering phase was approximately 6 min shorter than that of the Bi-LSTM for the same case. Although we could not present all the cases in the table, the time required for the training after completing the filtering phase was shorter in the CNN model than in the Bi-LSTM model. The difference in the training time is likely to be larger if the data size increases from that in this experiment.
4.2. Case Study of Filtering Efficiency
In this section, we present a case study conducted to see the impact of the filtering process on the performance of the product classification models. Same as in the previous section, accuracy was used as a performance metric.
For the top 1% of the frequency of all the words, i.e., 1.3K words, we increased the number of filtered-out stopwords by the top 10% words of the highest frequencies, and examined the accuracy for each case. Figure 6 shows the result of using the CNN model. A similar trend is displayed when the Bi-LSTM model is used. As shown in the figure, the accuracy decreases as the number of stopwords increases by the top 10% each time. It can also be observed that after the 70% setting is exceeded, the decreasing rate is relatively flat compared with the 10–70% settings. When the words with high frequencies are filtered-out as stopwords, the impact on the accuracy should be more significant. Furthermore, in our data, we observed that the distribution of the words displaying those frequencies is approximately 70%.
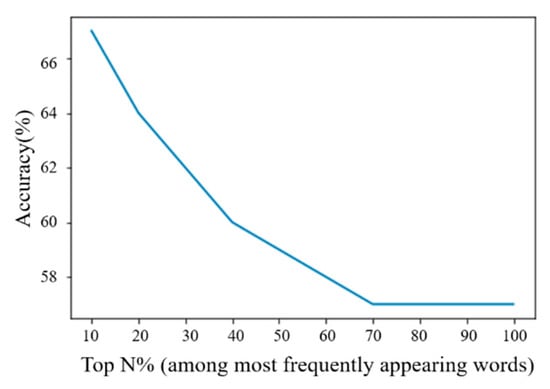
Figure 6.
Variation in accuracy according to the increase in number of stopwords.
Figure 6 shows a case where the experiment involves the observation of only the frequency of the filtered-out stopwords irrespective of the syntactic structure or semantics of those words. This can lead to the following question: would the performance improve if we filter out words that are syntactically wrong or weird, composed of unnecessary characters, or have a highly poor semantic relationship with the category that the product belongs to?
Therefore, we conducted the experiments to determine the performance of the models wherein the words considered unnecessary syntactically or semantically were removed using heuristics among the top 1% words with high frequencies. This is similar to the previous experiment. Table 4 shows the type of heuristics, stopword examples, and number and proportion of words removed as stopwords.
Table 4.
Stopword-selection criteria for filtering, stopword examples, and number of stopwords.
The data refining process was conducted with the list of stopwords created for each criterion. Then, the training process was performed. Table 5 shows the accuracy measured after performing filtering with each criterion of stopwords, for the NB, CNN, and Bi-LSTM models. Without loss of generality, in this experiment we used only the attributes “name” and “keyword”. In Table 5, the average accuracy of the CNN and Bi-LSTM models for criteria (1)–(6) is 0.7799 and 0.7756, respectively.
Table 5.
Prediction accuracy of each model for each selection criterion of stopwords (refer to Table 4 for the criterion number).
The stopword filtering selection criterion with the highest prediction accuracy is criterion (4), i.e., words composed of (number + unit). In general, the words corresponding to criterion (4) show detailed product descriptions such as size and price (e.g., “100 cm” and “1000 won”). These words generally are not significant in terms of learning of the products and are of low importance. Furthermore, a comparison between the results in Table 5 and the accuracy before the filtering phase in Table 3 does not reveal a significant difference. By training with various criteria, we determined that the improvement of training performance through stopwords is challenging. It requires more extensive analysis and experiments.
5. Conclusions
A substantial amount of data is produced each day in actual industrial sites. The problem-solving based on deep learning is favorable in terms of both improvement of analysis performance and reduction of time. Online commerce domain in which a rapid and precise automatic product classification is indeed required may be no exception. The efficiency of a deep learning model depends on the training data and the appropriateness of the learning model for the product data. In this study, we propose deep learning models that are conscious of input data comprising text-based product information.
Our approaches exploit two well-known deep learning models and integrate them with the processes of input data selection, transformation, and filtering. Through experiments using actual product information data, we demonstrated that the models that systematically consider the input data may differ in accuracy by approximately 30% from those that do not. Our model architecture proposed in this study consists of selection, transformation, and filtering phases. There can be other ways of integrating approaches in which some phases can be further decomposed or some can be merged with each other. For example, in this study, we conducted a case study to see how the filtering phase can affect the overall accuracy of product classification. It may be a future research direction to develop another way of data-conscious architecture for deep learning-based product classification.
The results of this study can be applied to methods for refining text data and classifying categories for e-commerce as well as other fields. In the case of social media, deep learning models can be trained using composed texts to classify the category of pertinent texts or determine whether the texts require filtering for pornography, violence, racism, etc. In the future, the characteristics of the text data used in this study should be sub-categorized further, and the data cleaning process should be further refined to enhance future studies. Apart from the two deep learning models used in this study, other models can be implemented to expand follow-up studies.
Author Contributions
Supervision, J.S.; Writing—original draft, Y.K.; Writing—review & editing, H.J.L. All authors have read and agreed to the published version of the manuscript.
Funding
This work was supported in part by the National Research Foundation of Korea (NRF) funded by the Ministry of Science, ICT, and Future Planning through the Basic Science Research Program under Grant 2020R1F1A1075952. The authors also acknowledge the effective comments and recommendations of the reviewers, which have improved the presentation.
Conflicts of Interest
The authors declare no conflict of interest.
References
- Das, P.; Xia, Y.; Levine, A.; di Fabbrizio, G.; Datta, A. Large-scale taxonomy categorization for noisy product listings. In Proceedings of the 2016 IEEE International Conference on Big Data (Big Data), Washington, DC, USA, 5–8 December 2016; pp. 3885–3894. [Google Scholar]
- Skinner, M. Product categorization with LSTMs and balanced pooling views. In eCOM@ SIGIR; 2018; Available online: https://sigir-ecom.github.io/ecom2018/accepted-papers.html (accessed on 2 June 2021).
- Krishnan, A.; Amarthaluri, A. Large Scale Product Categorization using Structured and Unstructured Attributes. arXiv 2019, arXiv:1903.04254. [Google Scholar]
- Xia, Y.; Levine, A.; Das, P.; di Fabbrizio, G.; Shinzato, K.; Datta, A. Large-scale categorization of Japanese product titles using neural attention models. In Proceedings of the 15th Conference of the European Chapter of the Association for Computational Linguistics, Valencia, Spain, 3–7 April 2017; Volume 2, pp. 663–668. [Google Scholar]
- Kim, Y. Automatic Product Category Classification Using Deep Learning. Master’s Dissertation, Department of Computer Science, Sookmyung Women University, Seoul, Korea, 2021. [Google Scholar]
- Kim, Y. Convolutional Neural Networks for Sentence Classification. arXiv 2014, arXiv:1408.5882. [Google Scholar]
- Krizhevsky, A.; Sutskever, I.; Hinton, G.E. Imagenet classification with deep convolutional neural networks. Commun. ACM 2017, 60, 84–90. [Google Scholar] [CrossRef]
- Yu, W.; Sun, Z.; Liu, H.; Li, Z.; Zheng, Z. Multi-level Deep Learning based E-commerce Product Categorization. In eCOM@ SIGIR; 2018; Available online: https://sigir-ecom.github.io/ecom2018/accepted-papers.html (accessed on 2 June 2021).
- Hochreiter, S.; Schmidhuber, J. Long short-term memory. Neural Comput. 1997, 9, 1735–1780. [Google Scholar] [CrossRef] [PubMed]
- Sak, H.; Senior, A.; Beaufays, F. Long Short-term memory recurrent neural network architecture for large scale acoustic modeling. Interspeech 2014, 2014, 338–342. [Google Scholar]
- Kil, H. The study of Korean stopwords list for text mining. Korean Lang. Lit. 2018, 78, 1–25. [Google Scholar]
- Lee, N.; Kim, J.; Shim, J. Empirical Study on Analyzing Training Data for CNN-based Product Classification Deep Learning Model. J. Soc. e-Bus. Stud. 2020, 26, 107–126. [Google Scholar] [CrossRef]
- Dalal, M.K.; Zaveri, M.A. Automatic Text Classification: A Technical Review. Int. J. Comput. Appl. 2011, 28, 37–40. [Google Scholar] [CrossRef]
- Cortez, E.; Herera, M.R.; da Silva, A.; de Moura, E.; Neubert, M. Lightweight Methods for Large-Scale Product Categorization. J. Am. Soc. Inf. Sci. Technol. 2011, 62, 1839–1848. [Google Scholar] [CrossRef]
- Shen, D.; Ruvini, J.-D.; Sarwar, B. Large-scale item categorization for e-commerce. In Proceedings of the 21st ACM International Conference on Information and Knowledge Management (CIKM’12), Maui, HI, USA, 29 October–2 November 2012; pp. 595–604. [Google Scholar]
- Aanen, S.; Vandic, D.; Frasincar, F. Automated product taxonomy mapping in an e-commerce environment. Expert Syst. Appl. 2015, 42, 1298–1313. [Google Scholar] [CrossRef]
- Lee, T.; Lee, I.-H.; Lee, S.; Lee, S.-G.; Kim, D.; Chun, J.; Lee, H.; Shim, J. Building an Operational Product Ontology System. Electron. Commer. Res. Appl. 2006, 5, 16–28. [Google Scholar] [CrossRef][Green Version]
- Friedman, J. Greedy function approximation: A gradient boosting machine. Ann. Stat. 2001, 29, 1189–1232. [Google Scholar] [CrossRef]
- Ristoski, P.; Petrovski, P.; Mika, P.; Paulheim, H. A machine learning approach for product matching and categorization. Semant. Web 2018, 9, 707–728. [Google Scholar] [CrossRef]
- Ha, J.; Pyo, H.; Kim, J. Large-scale item categorization in e-commerce using multiple recurrent neural networks. In Proceedings of the 22nd ACM SIGKDD, International Conference on Knowledge Discovery and Data Mining, San Francisco, CA, USA, 13–17 August 2016; pp. 107–115. [Google Scholar]
- Zahavy, T.; Krishnan, A.; Magnani, A.; Mannor, D. Is a Picture Worth a Thousand Words? A Deep Multi-Modal Architecture for Product Classification in E-Commerce. In Proceedings of the AAAI Conference on Artificial Intelligence, New Orleans, LA, USA, 2–7 February 2018; Volume 32. [Google Scholar]
- Kim, S.; Gil, J. Research paper classification systems based on TF-IDF and LDA schemes. Hum. Cent. Comput. Inf. Sci. 2019, 9, 1–21. [Google Scholar] [CrossRef]
- Sherstinsky, A. Fundamentals of recurrent neural network (RNN) and long short-term memory (LSTM) network. Phys. D Nonlinear Phenom. 2020, 404, 132306. [Google Scholar] [CrossRef]
Publisher’s Note: MDPI stays neutral with regard to jurisdictional claims in published maps and institutional affiliations. |
© 2021 by the authors. Licensee MDPI, Basel, Switzerland. This article is an open access article distributed under the terms and conditions of the Creative Commons Attribution (CC BY) license (https://creativecommons.org/licenses/by/4.0/).