Article

Nanosecond-Fiber Laser Cutting and Finishing Process for Manufacturing Polycrystalline Diamond-Cutting Tool Blanks

Department of Mechanical Engineering, National Taiwan University of Science and Technology, No. 43, Keeglung Rd., Section 4, Taipei 10607, Taiwan
*
Author to whom correspondence should be addressed.
Appl. Sci. 2021, 11(13), 5871; https://doi.org/10.3390/app11135871
Submission received: 2 June 2021 / Revised: 19 June 2021 / Accepted: 22 June 2021 / Published: 24 June 2021
(This article belongs to the Section Optics and Lasers)

Abstract

:
This paper presents a nanosecond-fiber-laser-based method for manufacturing polycrystalline-diamond (PCD) tool blanks. The effects of variations in the process path and operating parameters on the cut-surface morphology and surface-quality of the processed PCD workpieces have been analyzed. The results obtained in this study reveal the reactive fusion cutting mechanism to yield a processing depth of 155.2 µm at 30-W average laser power, 200-ns pulse width, and 30-kHz pulse frequency. The successful cutting of a 1.2-mm-thick PCD workpiece via implementation of the horizontal-shifting and vertical layer–by-layer processing methods is reported. Compared to the wire-electrical-discharge machining (WEDM), the proposed approach yields superior cut-surface roughness (Ra = 0.378 µm). Moreover, the laser processing was performed on a single-axis curved stage, on which the workpiece placed at an inclination during laser cutting and finishing. Thus, a PCD insert with an orthogonally cut edge, flat and pit-free finishing surface, and excellent tool-surface roughness (Ra = 0.202 µm) was obtained, thereby verifying the feasibility of the proposed approach. Furthermore, it is evident that the nanosecond-fiber laser can be used to not only cut and finish PCD inserts but also produce PCD workpieces oriented at different rake and clearance angles.

1. Introduction

Polycrystalline diamond (PCD) manufactured by high-pressure synthesis is a high-performance synthetic super-hard material with high compressive strength, high wear resistance, good thermal conductivity, low thermal expansion coefficient, and favorable chemical stability [1]. PCD has greater fracture toughness than single-crystal diamond and ceramic materials; therefore, it can be used in cutting tools to obtain excellent machining accuracy and efficiency [2,3]. PCD tools are mainly used for non-ferrous metal processing and high-wear processing, and have been widely used in the aerospace, automotive, and wood industries [4,5]. In recent years, the use of carbon fiber/glass fiber composite materials in the aerospace and automotive industries has continued to expand; these materials are mostly processed using PCD tools. The Global Market Analysis Agency (GII) has estimated the global aerospace composite materials market to reach US $41.4 billion by 2025 [6], which will increase the demand for processing tools for PCD blanks.
Owing to the excellent properties of PCD materials, such as high hardness and high strength, PCD tools are more difficult to process and shape, and are not suitable for production by traditional milling or turning processing methods [7]; therefore, the development of PCD processing technology is necessary. At present, in the manufacturing of PCD tools, wire electrical discharge machining (WEDM) is commonly used to cut the PCD material into a tool blank, which is then welded to the tool-holder and then polished and finished using a diamond grinding wheel [8]. Electrical discharge machining is a non-contact machining process, which is not affected by the strength and hardness of the material during processing. However, wire electrical discharge machining produces a surface damage layer, which affects the quality of the cut edge [7], and the discharge efficiency is affected by the diamond grain size [9]. The discharge pulse will also cause surface pits on the cut surface, which will reduce the strength of the material. Hence, it needs to be polished with a diamond wheel during post-treatment.
Galindo-Fernandez et al. [7] mentioned that the processing of a PCD material by wire electrical discharge machining is limited by the fact that diamond cannot conduct electricity, and it is necessary to induce electrical discharge to remove the material through a cobalt binder. The study explored the effects of processing parameters such as pulse time, pulse interval, and servo voltage on the PCD surface morphology after processing. After the optimization experiments, the best surface roughness (Ra = 0.684 µm) was obtained with pulse time of 0.4 µs, pulse interval of 20 µs, and servo voltage of 80 V. However, the results showed that when the PCD was processed by wire cutting, the surface of the PCD was contaminated and damaged due to sputtering of the spark during discharge, resulting in obvious damage layers and pits on the surface of the PCD. Tso and Liu [10] discussed the difference in the quality of PCD tools obtained by electrical discharge machining and grinding. Applying diamond-wheel grinding to the PCD workpiece ensures better surface quality. However, the processing efficiency of grinding is poor, and the tool to be ground must have sufficient material strength to support the cutting force generated during processing. Hence, it is not suitable for processing tools with complex geometric shapes. The study also revealed that because the surface quality after PCD cutting is better with fewer surface defects, the impact resistance and fatigue damage resistance of the cutting edge would be improved. It can also reduce the cutting heat caused by friction between the tool and workpiece. Therefore, diamond grinding wheel finishing is widely used in the finishing process of PCD tools. However, it has problems such as high processing cost, low processing efficiency, and unsuitability for both complex geometry tools and micro tool processing [10,11,12,13,14].
Laser processing is a non-traditional processing technique, wherein a high-energy laser beam is focused on the material. Removal of the material occurs by either photothermal ablation or destruction of the material bond [15]. Because there is no contact between the laser beam and the workpiece, the processing method is not limited by the hardness and strength of the workpiece. The workpiece will not be deformed under the mechanical forces during the processing. The technique is suitable for processing hard and brittle materials and workpieces of complex shapes. Therefore, it can be used to address the challenges in processing PCD [15,16]. In addition, laser processing is not affected by the electrical properties of the material, and the surface quality after processing is better than that in electrical discharge machining [17]. Harrison et al. [16] studied the processing of PCD materials with Nd: YAG nanosecond pulse lasers (pulse width of 20 to 200 ns, wavelength of 1064 nm, and maximum average power of 300 W). The study proposed using the reactive fusion cutting mechanism (melt, burn, and blow) with purified air or oxygen to obtain better cutting results.
Moreover, it revealed that diamond is converted to graphite during the laser ablation process, and because graphite is very soft, it can be easily removed by high-pressure assisted gas. The optimized laser processing parameters (average power of 300 W, pulse repetition rate of 45 kHz, pulse energy of 6.7 mJ, and peak power density of 120 MW/cm2) produced a 24 mm/min cutting speed. Despite this, they could not make a cutting edge of sufficient sharpness and accuracy as reactive fusion cutting produces striations on the cut face.
Butler-Smith et al. [17] compared the difference between PCD tools after picosecond pulse laser machining (pulse width of 12 ps, wavelength of 1064 nm, and maximum average power of 50 W) and electrical discharge machining. The results indicated that during electrical discharge machining, the binder on the tool surface was preferentially removed and formed numerous voids, contributing to the irregular cutting surface (surface roughness Ra = 0.72 µm). These voids weaken the strength of the tool structure and lead to breakage after abrasion testing. After surface of the tool after laser processing, the tool’s surface was relatively smooth and free of voids (the best surface roughness, Ra = 0.16 µm), providing sufficient strength to the tool during cutting. However, microcracks were observed after the abrasion test.
Dold et al. [12] compared the difference between picosecond pulse laser processing (pulse width = 10 ps; wavelength = 1064 nm; fluence = 5.53 J/cm2) and diamond-wheel grinding of PCD tools. The results showed that because the grinding process cannot directly remove the diamond grains, the cutting force would tear the diamond grains out of the surface and leave numerous pits on the cutting edge. On the other hand, laser processing could ablate the diamond grains directly without creating surface pitting. The processing surface quality was uniform after laser processing, and the efficiency was higher than that of the diamond-wheel-grinding process.
Scalbert et al. [18,19] applied ultrashort-pulsed laser ablation to polish PCD and explored the effects of pulse width and spot overlap percentage on the material removal rate and surface roughness. The study reported that using low-average-power with pulse widths measuring less than 500 fs could avoid diamond graphitization, thereby yielding better surface quality after processing (surface roughness Sa 0.41–0.47 µm). Kamlage et al. [20] studied femtosecond laser (150 fs, 780 nm, 1 kHz) cutting and finishing a magnesium alloy plate with a thickness of 125 µm. The results indicated that the cutting surface uneven when the magnesium alloy sheet was cut by single pass cutting. However, with increase in the number of passes required to cut the workpiece, most of the laser energy is no longer made directly incident on the material. Instead, only a small fringe of the laser beam (near the laser spot) is made incident on the surface of the cut edge. The laser energy density located around the fringe of the laser beam is very low. In this low-fluence regime, the laser beam power is switched from laser beam cutting to laser beam polishing, and has a low-fluence finishing effect. The flatness of the cut edge and the surface roughness is improved. Hung and Chang [21] used a femtosecond laser and multiple horizontal shifting to produce a nitinol stent. The processed stent had high surface quality with no apparent thermal residual stress. Moreover, the femtosecond laser-beam energy is a Gaussian distribution; this characteristic could trim the stent to achieve a rounded edge.
Martínez et al. [22] applied the laser hardening process with scanning optics to AISI 1045 steel. The scanner-based laser hardening process presented an inherent variation of the temperature due to the scan effect of the laser beam. The test results showed two different regimes, relatively smooth and rippled, depending on the scanning speed and feed rate values. Zimmermann et al. [23] studied laser machining for the preparation of cutting edges of cemented carbide inserts. The laser parameter settings applied for the preparation were varied, and the analysis reveals that the surface, the surface integrity and the tool performance are significantly affected by the parameter sets used for laser machining. The less heat dissipates from the processing area into the adjacent material, the more efficient the material removal, and the lower the surface roughness and the undesired alteration of the sub-surface properties.
Traditionally, the diamond-wheel-grinding technique is used to finishing PCD cutting tool blanks after WEDM cutting. However, owing to its poor efficiency, this technique is unsuitable for processing complex geometric-shapes tools [10,11,12,13,14]. Previous studies have reported methods involving the use of pico- and femto-second lasers as potential alternatives to the WEDM cutting and diamond-wheel-grinding techniques [17,18,19]. However, these laser-based methods are expensive, and their high maintenance cost could hinder their widespread industrial utility. This study used a nanosecond fiber-optic laser system with an adjustable pulse width (maximum average power of 30 W) by referring to the studies by Kamlage et al. [20] and Hung and Chang [21], and established a horizontal shifting and vertical layered processing method to achieve a high-quality processed PCD workpiece. The relationship between the laser focus position and kerf width was first studied. The effects of various laser parameters such as the laser pulse width, repetition rate, peak energy, pulse energy, processing scan rate, and number of machining passes on the kerf depth and material removal rate were examined. Next, the feasibility of applying the horizontal shifting and vertical layering processing methods to cut through a PCD workpiece with a nanosecond fiber laser was investigated. Then, the effects of variation in the operating parameters on the morphology of the cut surface and surface quality were explored. This study proposes three different processing paths to perform the laser finishing and achieve improved cut surface quality. Moreover, it discusses the effects of the variation in pulse widths on the results of the finished surface. The tilting of the cutting edge after laser cutting, due to the physical characteristics of the laser beam energy, is addressed. Finally, the parameter settings for achieving the best results for processing the PCD tools by nanosecond fiber laser processing are summarized.

2. Experimental Methods

2.1. Materials

A PCD blank is consist of diamond grains of similar sizes packed on a tungsten carbide substrate and sintered in a high-temperature and high-pressure environment [1,2]. The cobalt in tungsten carbide melts and infiltrates into the gaps between the diamond grains during the sintering process. The conductivity of PCDs is poor despite the infiltration of the small amount of cobalt between the diamond grains. The PCD used in this study was manufactured by ELEMENT SIX; the grade was Syndite CTX002, which is made by sintering diamond particles with an average size of 2 µm and cobalt binder on a tungsten carbide substrate. The overall thickness of this PCD material was 1.2 mm, of which the thickness of the diamond layer was 400 µm. The material properties are listed in Table 1.

2.2. Nanosecond Fiber Laser Processing System

The nanosecond fiber laser system used in this study mainly comprised a laser source, scanning galvanometer, an F-theta lens, a Z-axis stage, and controller. The laser source was IPG Laser (Model YLPN-1-4x200-30-M, IPG Photonics Corporation, Oxford, MA, USA); the excitation medium was a glass fiber doped with the rare earth element ytterbium, which had the characteristics of adjustable pulse width. The output characteristics of the laser source used in this study are shown in Table 2. The laser source used in this study had an adjustable pulse width. Each pulse width had a corresponding range of pulse repetition rate, and the peak power that could be reached was different. The scanning range of the scanning galvanometer (Raylase: model RS-12) in this system was 55 mm × 55 mm, and the maximum scan rate was 9 m/s. The F-theta lens (JENOPTIK: JENar 03-90FT-125-1030... 1080) had a focal length of 125.1 mm. The controller consisted of a UMC4 motion control card manufactured by Eastern Logic, Inc., to synchronize the laser, galvanometer, and Z-axis positioning stage (SIGMAKOKI: SGSP80-20ZF; the lifting resolution was 0.1 µm/pulse, and the maximum moving speed was 2 mm/s).

2.3. Determination of Focus and Processing Parameters of Nanosecond Fiber Laser System for PCD Material

Laser processing must be performed within the correct range of the focal length and with appropriate parameters to obtain good machining quality. The processing parameters of the fiber laser system include the average power, scan rate, pulse width, pulse repetition rate, peak pulse power, and pulse energy.
After the laser beam is focused by the lens, the beam will converge to a spot and then diverge. The different focusing positions of the laser affect the distribution of its processing energy. The focus position should be correct to achieve the highest energy density for processing and obtain better results and desired quality. If the laser beam is under-focused or over-focused on the surface of the workpiece, the energy density will be insufficient for effective material removal. The laser energy will accumulate on the surface of the workpiece, which will widen the cutting kerf width [21,24]. In addition, a laser beam with sufficient energy will produce high-frequency sound when focused on the surface of the material [24]. This study first determined the focal length range based on the audio frequency used in the processing, and then observed the effect of different Z-axis positions within this range on the cutting kerf width and material removal during the processing of the PCD workpiece. The most suitable focal length setting was used in the subsequent processing experiments. The reactive fusion cutting mechanism [16] was used for PCD material processing, and a nozzle provided clean dry air (pressure six bar) to assist in the laser processing.
The laser beam was focused by a lens; the focal spot size can be determined from Equation (1), and the depth of focus can be obtained from Equation (2) [24]:
Spot   size :   2 ω 0 = ( 4   × λ   ×   f   ×   M 2 ) / ( π × D ) ,
Depth   of   focus :   D O F = 4 2   × ω 0 .
where, λ denotes the laser wavelength, f denotes the lens focal length, M2 denotes the coefficient of laser-beam quality, D denotes the input beam diameter, and ω 0 denotes the spot size.
It can be seen from the formula that a smaller spot diameter can be obtained by increasing the incident beam diameter or shortening the focal length. However, a smaller spot diameter will reduce the depth of focus. In laser processing, a larger spot diameter and longer depth of focus can improve the cutting efficiency, but the processing accuracy is poor. A smaller spot diameter and shorter depth of focus can improve the processing accuracy, but the processing efficiency is poor. The laser system used in this study was calculated to have a spot diameter of 36 µm and depth of focus of 102 µm.
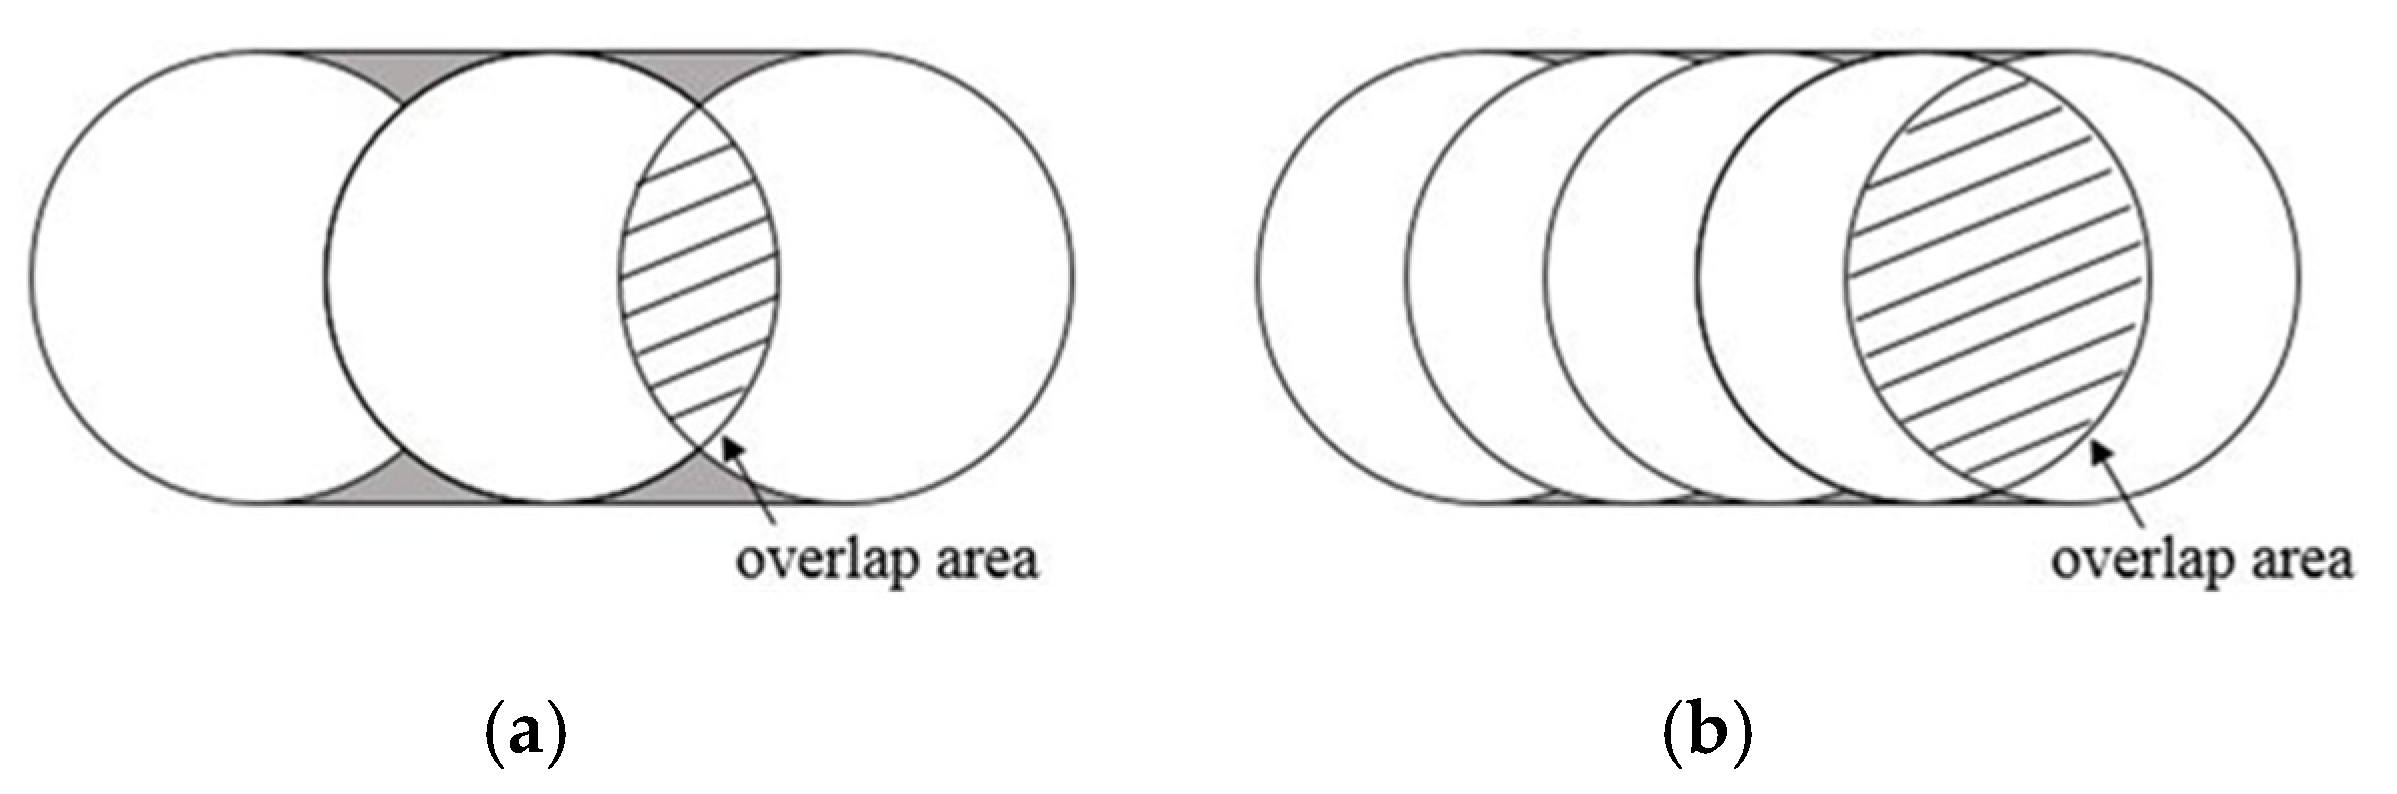
When the pulse repetition rate is fixed, the scan rate will affect the amount of energy accumulated by the laser in the same processing area. A pulse repetition rate will have a corresponding appropriate range of the scan rate. Much faster scan rate and very low pulse repetition rate will decrease the rate of overlap, which will cause a discontinuous corrugated surface and rough cutting edge; this will affect the processing efficiency and surface quality of the workpiece after processing. The gray area in Figure 1a is the unprocessed area, and the size of this area is the main factor affecting the processing quality.
To obtain better laser cutting efficiency, this study first investigated the cutting depth of PCDs based on different operating parameters of the nanosecond fiber laser, such as the scan rate and number of processing passes. For measuring the cutting depth of PCDs, the laser cutting was proceeded over the workpiece edge, and a Nikon Eclipse ME600 optical microscope was used to investigate the edge surface. The processing parameters that yielded the best processing efficiency were selected and used in the subsequent experiments. The selected parameters are listed in Table 3. A slower scan rate was selected for the testing to reflect the physical properties of good thermal conductivity and higher reflectivity of the PCD bulk, and the other laser processing parameters and number of processing passes were fixed. The following tests were performed at the scan rates of 1, 3, 5, 7, and 9 mm/s. The laser machining parameters and scan rates were fixed, and the number of processing passes was set at 1, 3, 5, 7, and 9 passes per path in this study.
The laser power can be divided into peak power and average power. The peak power is the highest power of each laser pulse. The average power is the total power output of the laser beam in a unit of time and is affected by the peak power, pulse repetition rate, and pulse width. Equations (3)–(5) express the relationships between them [25].
P a = E p × f
E p = P p × τ
P a = P p × τ × f
where Pa is the average power (W), Pp is the peak power (W), Ep is the pulse energy (J), f is the pulse repetition rate (Hz), and τ is the pulse width (s).
The average power directly affects the results of material processing. The main reason is that the processing energy of the laser beam is proportional to the average power. Increasing the laser average power increases the laser output energy. In addition, the magnitude of laser energy, which is higher than the material ablation threshold, is increased. This also increases the amount of material that is removed. When the average power is fixed, the pulse width is inversely proportional to the peak power, and when the peak power is fixed, the pulse width is proportional to the average power. Therefore, processing the workpiece with different pulse widths under a fixed average power causes variation in the peak pulse power. In addition, the pulse repetition rate affects the pulse overlap rate during the processing. If the rate is very low, the cutting edge becomes very rough, and the processing quality is affected. When the average power is fixed, processing the workpiece with different pulse repetition rates will cause variation in the peak power.
Because the laser system used in this study has the characteristics of adjustable pulse width, various pulse repetition rates can be selected. The pulse width and pulse repetition rate can be adjusted individually; therefore, the peak pulse power will also vary. In the testing for the kerf depth, the average power was fixed at 30 W, and the scan rate was fixed at 5 mm/s. The lowest pulse repetition rate was selected at a specific pulse width, at which the maximum pulse energy and maximum peak power were defined. These tests were designed to determine the effects of pulse width on the kerf width, kerf depth, and surface morphology of the laser-processed PCD workpiece. The lowest pulse repetition rate at a specific pulse width was selected, as shown in Table 4.

2.4. Nanosecond Fiber Laser Cutting Process of PCD Workpiece

During nanosecond fiber laser processing of the PCD material surface, the molten material and emitted particles can be effectively expelled from the V-shaped bottom with the aid of side-blown clean dry air. However, when the processing depth increases, it is difficult to remove the molten material and emitted particles from the bottom, which leads to a reduction in the material removal rate and deterioration of the quality of the processed surface. Therefore, this study adopted a stepwise shifting processing method [21] to broaden the width of the V-shaped bottom while cutting the PCD workpiece. A broad V-shaped bottom facilitates the blowing of the auxiliary gas through it and removal of the molten material and emitted particles during the laser cutting process to avoid recasting and redeposition. Thus, an improved cut surface quality will be achieved.
The laser system used in this study cannot cut through the PCD workpiece in a single step. In addition to the shifting of galvanometer scanning from left to right during the processing, it is also necessary to use the Z-axis positioning stage to lift the workpiece. When the workpiece is processed in layers, the surface of each layer is lifted to the height of the correct laser focus position. The process described above is repeated until the PCD workpiece is cut. The cutting paths are plotted in Figure 2a,b. The number of path shifts and shifting distance from left to right will also affect the number of Z-axis lifts. Therefore, this test used the optimized processing parameters obtained from previous tests, with seven shifts of the same layer from left to the right, shifting distance of 10 µm between paths, and Z-axis lifting set at 50 µm at the beginning. The PCD workpiece was lifted repeatedly after each layer was processed until the workpiece was cut through. As this strategy was proven successful, a test involving higher Z-axis lifts of 80 µm and 100 µm was planned. The best processing parameters were selected from these tests for the subsequent PCD laser cutting process.
During laser cutting, the workpiece is required to be positioned with an overhang, as shown in Figure 2c, to avoid recast accumulation or the attachment of the workpiece to the holder as the laser beam approaches the other end of the workpiece. The laser beam was focused on the overhanging portion of the workpiece.

2.5. Laser Surface Finishing Process of PCD Workpiece

After laser cutting, the size of the PCD workpiece was 5 mm in length, 3 mm in width, and 1.2 mm in thickness. However, it is common to observe recasts and splashes on the cut surface, mostly at the very end of the cut surface with a V-shaped cutting pattern. These recasts and splashes on the cut surface are due to the narrowing of the V-shaped cutting as the laser beam approaches the end of the workpiece, where the auxiliary blowing gas cannot reach to expel it. Therefore, we devised a laser finishing process to remove the recasts and splashes attached to the cut surface, and improve the quality of the tool and cut surfaces.
Previous studies have [20,26] mentioned that selecting a smaller pulse width during processing can yield better surface quality. Therefore, this study compared the effects and results of using pulse width of 50 ns (the smallest possible pulse width with the equipment) and 200 ns for the surface finishing. The operating parameters and finishing processes are as follows: average power of 30 W, pulse repetition rate of 90 kHz, and scan rate of 5 mm/s. The target finishing depth selected in this study ranged from 0 to 400 µm (the thickness of the PCD layer of the workpiece). The tests were conducted with three different finishing methods and the results of these methods were compared. The processing of Method 1 and Method 2 are similar; in both methods, the processing by the laser beam occurs from the top surface to the bottom of the PCD layer along the vertical Z-axis, and then returns to the initial surface. The laser beam shifts by a fixed distance from left to right to process the next path. The difference between the two methods is the number of Z-axis lifts, magnitude of horizontal shifting distance, and number of processing passes per path. Processing Method 3 is similar to the laser cutting process mentioned in Section 2.4. The laser beam finishing process begins at Path 1 and then shifts by a fixed distance to the right for the subsequent paths. After the first layer is processed, the laser beam is shifted back to the starting position, and the Z-axis is lifted to a fixed height to process the second layer. The details of the finishing methods are as follows:
(1)
Method 1
The processing paths are plotted as shown in Figure 3. The vertical direction along the Z-axis of the workpiece was processed first with 20 passes per path. After Layer 1 was processed, the workpiece stage was lifted by 100 µm in the Z-axis direction to process Layer 2. The total number of Z-axis lifts is 4 (5 layers in total). After processing all 5 layers in row 1, the stage was returned to its original position. The focal spot of the laser beam was shifted horizontally by 5 µm to the right to process the following path in layer 1 in row 2. The processing paths mentioned above were repeated until the number of horizontal shifts reach 6 (7 rows in total).
As shown in Figure 3a, the starting position of the laser finishing process was set at 48 µm to the left from the vertical baseline A. The location of baseline A was set at the vertex of the laser-cut upper edge. This starting position was calculated as half the laser spot diameter (18 µm) plus 6 horizontal shifts (30 µm). As a result, the laser beam was shifted 6 times to the right and the fringe of the laser focal spot will be in aligned with baseline A.
Kamlage et al. [20] pointed out that as the number of cutting passes increased, the workpiece was cut through and most of the laser energy was no longer focused directly on the side wall of the workpiece; only the fringe of the laser beam (in the vicinity of the laser spot diameter) was focused on the surface of the cut edge. The laser energy density located around the fringe of the laser beam was very low. In this low-fluence regime, the laser intensity was higher than the ablation threshold of the material. The laser beam power was switched from that for laser beam cutting to that for laser beam polishing and had the effect of low-fluence finishing. The flatness of the cut edge and surface roughness were improved. Thus, by referring to the study by Kamlage et al., the subsequent finishing processes considered multiple passes per path (up to 20 passes) to improve the flatness and surface roughness of the cut PCD surface.
(2)
Method 2
The processing paths were similar to those in Method 1. The difference in this method was that it applied 5 passes per path, 80 µm Z-axis lift, 5 Z-axis lifts (6 layers in total), 10 µm of horizontal shifting, and 3 horizontal shifts (4 rows in total).
(3)
Method 3
The processing paths are plotted as shown in Figure 4. Laser finishing was conducted in the horizontal shifting direction (Layer 1) for 6 shifts (7 rows in total). Then, the stage was lifted in the vertical direction along the Z-axis for processing Layer 2. The finishing was performed with 20 passes per path and horizontal space shift of 5 µm between paths, with total number of 6 shifts (7 rows in total). The stage lift in the Z-axis was 100 µm, and the total number of stage lifts was 4 (5 layers in total).

2.6. Resolving the Tilting of the Laser-Cut Edge

In this study, post cutting, the PCD workpiece comprised a tilted edge, as depicted in Figure 5a, and the finishing process described in Section 2.5 could not improve this result. This could be attributed to the accumulation of higher material volume removed from the upper layer compared to the lower layer. Furthermore, the bulk PCD material invariably shields the inner layers material by absorbing a significant portion of the incident laser energy. In order to reduce the tilting of the cut edge, this study used a single-axis curved stage (installed on the Z-axis positioning stage) to tilt the PCD workpiece at a defined angle, as shown in Figure 5b. The feasibility of the stage tilt and effect of applying/omitting it on the surface quality after laser finishing are discussed.

3. Results and Discussions

3.1. Adjustment of Laser Focus Position and Results of Kerf Width Measurement

This study used a fixed average power of 25.5 W, pulse width of 200 ns, pulse repetition rate of 170 kHz, one pass per path, and scan rate of 5 mm/s to determine the focal length of the laser processing system. Air blowing with clean dry air was also applied.
Based on the judgment of the magnitude of audio frequency, the focal length of the laser beam was located in the range of 165.2 to 167.2 mm from the top surface of the workpiece to the laser beam source along the Z-axis (for which the height along the Z-axis is defined as 0 mm). The details of the calibration process of the focal length are as follows: a change in distance of 0.5 mm was adopted to observe the magnitudes of kerf width and kerf depth. The focal length reading was narrowed in the range of 165.7 to 166.7 mm. Furthermore, in this focal range, the change in distance of 0.05 mm was also observed. We found that the focal length of the laser beam along the Z-axis was in the range of 166.1 to 166.3 mm, in which the minimum kerf width was measured between 28 to 30 µm, which was slightly less than the spot size of 36 µm (calculated from Equation (1)). The smaller spot size was attributed to the laser beam energy density with Gaussian distribution, and the energy density in the fringe of the focal spot was less than the threshold for the PCD material ablation. As we adjusted the Z-axis reading to be slightly higher or lower than the measured range, the kerf width became wider and kerf depth became shallower. We considered an average of 166.2 mm from the range measured in the final testing as the focal length, which was used to set the height of the Z-axis in the subsequent testing.

3.2. Laser Cutting of PCD Workpiece

3.2.1. Influence of Various Processing Parameters on Kerf Depth of PCD Materials

To obtain better cutting efficiency, this study compared the effects of various scan rates, number of processing passes, and various processing parameters on the kerf depth of the PCD workpiece. The parameter settings that yielded the best cutting efficiency were used in the subsequent tests. Figure 6 and Figure 7 reveal that the kerf depth decreases with an increase in scan rate. When the scan rate was less than 5 mm/s, there was very little increase in the kerf depth. This was because the laser energy accumulation had reached its limit and the cutting efficiency could not be improved further, even when higher laser energy was input. The local accumulation of a large amount of heat will enlarge the heat-affected zone. Therefore, in this study, a 5-mm/s scan rate was considered as the operating parameter for subsequent testing. This was followed by changing the number of cutting passes per path. Figure 8 and Figure 9 illustrate an increase in the kerf depth corresponding to an increase in the number of cutting passes. However, the observed increase in the kerf depth becomes less pronounced as the number of cutting passes per path exceeds five. This is because the initial increase in the kerf depth with the cutting-pass count causes the material in the bottom layers subjected to laser beam irradiation to be over-focused. Because the laser energy in this over-focused region is lower compared to the material-ablation threshold, no further material removal can be realized. Therefore, five cutting passes per path were considered in this study for subsequent testing. Moreover, the test results revealed that changing the number of cutting passes was better than changing the scan rate to increase the kerf depth.
The effects of variation in pulse width and pulse energy of laser cutting on the PCD workpiece was studied at the fixed average power of 30 W. The lowest pulse repetition rate for a specific pulse width at which the maximum peak pulse power was obtained was selected, and the kerf depth and surface quality of the cut surface were discussed. In the laser cutting studies, the processing scan rate was set at 5 mm/s, and the number of cutting passes was set at one pass per path. The lowest pulse repetition rate corresponding to the specific pulse width, maximum pulse energy, and maximum peak power is listed in Table 5. The information in the table reveals that the lowest pulse repetition rate decreases corresponding to an increase in the pulse width under the constant average-power setting. Correspondingly, the pulse energy and peak power increase and decrease, respectively.
Moreover, a large pulse width corresponded to an increased kerf depth, as depicted in Figure 10. Therefore, the maximum kerf depth corresponded to the pulse-width and pulse-repetition-rate values of 200 ns and 30 kHz, respectively. Furthermore, Figure 11 reveals that the kerf depth increased with an increase in pulse energy. Therefore, it can be inferred that conditions involving the maximum pulse width (200 ns) (at lowest pulse repetition rate) and highest pulse energy (1 mJ) would yield the maximum kerf depth. In addition, the maximum pulse width of 200 ns corresponded to the lowest peak power, as illustrated in Figure 12. Therefore, despite the peak power corresponding to its lowest value, it was sufficient to exceed the material ablation threshold.

3.2.2. Test Results of Laser Cutting of PCD Workpiece

To achieve the best cutting efficiency, the laser cutting parameters were selected based on the results obtained in Section 3.2.1. The selected cutting parameters were scan rate of 5 mm/s, pulse width of 200 ns, pulse repetition rate of 30 kHz, and maximum average power of 30 W. During the cutting process, the PCD workpiece was fixed with an overhang and clean dry air was supplied at pressure of six bar. The cutting process was plotted as in Figure 2, with 5 cutting passes per path; the cutting path was arranged from left to right (shifting by 10 µm per path, with seven shifts in total). The workpiece stage was lifted along the vertical Z-axis to cut the next layer (for example, the Z-axis lift can be set to 50 µm per layer). This test showed that the PCD workpiece could be cut through when the stage was lifted along the Z-axis 24 times by 50 µm per layer to achieve a total processing depth of 1200 µm.
Subsequent cutting tests were conducted with different lifting heights along the Z-axis to determine whether the cutting efficiency can be improved (i.e., the shortest cutting time can be attained) by increasing the lifting distance. The optimal value will be used as the final operating parameter for the laser cutting process of the PCD workpiece. In these tests, the total stage lift along the Z-axis was set at 1200 µm. We compared the test results for different stage lift settings: 50 µm, 80 µm, and 100 µm per layer. The test results are shown in Table 6. The results reveal that the PCD workpiece can be cut through with stage lifts of 50 µm and 80 µm, whereas it cannot be cut through with the stage lift of 100 µm. This result may be related to the horizontal shifting distance of 10 µm; although the data from the cutting tests showed that the kerf depth would reach 155 µm with 5 passes of cutting per path, the space measured between the two paths was less than 7 µm at the lifting height of 100 µm (indicating that less amount of material was removed from the bottom surface of the workpiece). Thus, in the case of a 100-µm stage lift per layer, the bottom material cannot be removed entirely by laser power alone. Under this situation, the accumulated depth becomes insufficient, thereby resulting in an incompletely cut PCD workpiece. Based on these tests, we selected the stage lift along the Z-axis of 80 µm per layer for subsequent testing.
After the PCD workpiece was cut into two parts, the starting path side (left side, Figure 13a) and final path side (right side, Figure 13b) of the cut surface were observed by an optical microscope, as shown in Figure 13. A tilt of approximately 5.4° was observed on the final path, which appears smoother than the starting path, as shown in Figure 13b,d. On the contrary, the starting path appears very rough with numerous recasts; the surface quality of the starting path was much worse than that of the final path, as shown in Figure 13a,c. This phenomenon might be attributed to the repeated focusing of the laser beam energy on the right side wall, which creates a better surface quality of the cut workpiece.

3.3. Test Results of Laser Surface Finishing of PCD Workpiece

The results during the previous laser-cutting tests reveal that the final processing path depicted on the right (Figure 3 and Figure 4) yields superior surface quality. Therefore, this path was used for the laser-finishing tests using Methods 1, 2, and 3. To this end, the finishing paths depicted in Figure 3 and Figure 4 were considered. The surface morphologies of the finished surface obtained by these methods were investigated by scanning electron microscope (JSM-6390LV, JEOL), as shown in Figure 14. The images reveal that the recasts and deposits are removed; moreover, the best surface quality was obtained with Method 3. The inferior surface quality observed with Methods 1 and 2 might be due to the laser beam energy being shielded by the PCD bulk material located above the laser beam focal spot, as shown in Figure 15. The shielding of the laser beam energy increases with processing depth. Thus, the deepest part is subjected to the lowest laser energy, thereby resulting in the incomplete removal of recasts and sidewall deposits as well as inferior surface quality.
The finishing Methods 1, 2, and 3 achieved finishing depths of 250 µm, 231 µm, and 347 µm, respectively. However, even though the finishing Method 3 showed the best surface quality, it could not reach the targeted depth of 400 µm. An unfinished area existed at the very end of the PCD workpiece. We decided to use higher pulse energy in the finishing process to rectify this issue.
To achieve the target finishing depth of the PCD workpiece, pulse width of 200 ns and pulse repetition rate of 30 kHz were used for the laser-finishing test conducted with Method 3. The test results are shown in Figure 16. No significant difference in the surface quality was observed between high pulse width of 200 ns and low pulse width of 50 ns, as shown in Figure 14d and Figure 16b, respectively. The surface roughness of the finished surface of the PCD workpiece was measured by coherence correlation interferometry (CCI; Talysurf CCI-Lite, Taylor Hobson, West Chicago, IL, USA), as shown in Figure 17. The surface roughness before finishing was Ra = 0.378 µm, and that after finishing was Ra = 0.209 µm. The laser cut surface showed a flat morphology. The findings of this study reveal the realization of improved surface morphology and roughness after laser finishing of the PCD workpiece. This results in superior surface quality of the cut surface. These results demonstrate good agreement with those reported by Kamlage et al. [20].
The optical microscope images reveal that the cut edge of the PCD workpiece is titled, as shown in Figure 16a. The titled angle of the laser finishing edge was measured at 5.2°. Although this value was slightly less than that of the laser cut edge, it was not sufficiently low. The titled edge angle was attributed to the layer-by-layer cutting and finishing process from the top of the workpiece to the bottom. The material on the upper layer was subjected to multi-processing, after which more material was removed. This is in agreement with the results of Hung and Chang [21] and Li et al. [27]. The other reason that led to the titled edge angle was the laser energy shielding effect, as the focal spot of the laser beam was located below the top surface of the workpiece. The laser energy was shielded, and the laser energy was decreased.

3.4. Results of Improvement in Tilting of Edge

To improve the tilted-edge angle condition described in Section 3.3, a curved, single-axis stage tilted a 5.2° was installed. The subsequent laser cutting operation and relevant parameter selection were performed a described in Section 3.2. The laser finishing was performed in accordance with Section 3.3 and Method 3. The laser parameters were average power of 30 W, scan rate of 5 mm/s, pulse width of 200 ns, and pulse repetition rate of 30 kHz, as shown in Figure 18. The test results showed that the tilting of the edge was resolved successfully by tilting the workpiece at a specific angle during laser processing. The measurement of the cut edge after laser processing was approximately 90°, and no significant difference in surface quality was observed between the untilted and tilted stage settings. The surface morphologies and roughness of the processed surface measured by CCI are shown in Figure 19. The surface roughness of the processed PCD workpiece with tilted stage was Ra = 0.202 µm, which was similar to that in the untilted stage processing (Ra = 0.209 µm).
Based on this test, the proposed laser cutting and finishing processes could obtain a smooth and pit-free processed surface of the PCD workpiece, as shown in Figure 18 and Figure 19. The surface morphology and surface quality (see Figure 18b) observed through SEM are very similar to those reported in the studies by Butler-Smith et al. [17] and Dold et al. [12] with picosecond pulse laser processing, and Scalbert et al. [18,19] with femtosecond laser processing. The surface roughness measured in this study (see Figure 19) was similar to that in the study conducted by Butler-Smith et al. [17] with picosecond pulse laser (surface roughness Ra = 0.16 µm). Furthermore, this tilted stage method can be used in applications that require various rake angles and clearance angles in the PCD cutting tool design in the future.

4. Conclusions

1. This article successfully developed a nanosecond fiber laser cutting and finishing process for PCD inserts. As discussed in this paper, the variations in the processing path and operating parameters affect the surface morphology and surface quality of the laser-cut and finished PCD workpiece. Based on the investigation of the processing parameter, the most stable kerf depth and best material removal rate can be obtained with the scan rate of 5 mm/s and 5 cutting passes per path.
2. This study revealed that the number of cutting passes per path significantly influence on the kerf depth magnitude than the scan rate. In this study, we used a nanosecond fiber laser with average power of 30 W. The investigation of the kerf depth revealed that the magnitude of laser pulse energy affects it more than the peak power. In the cutting process, the deepest kerf of 155.2 µm was obtained at the pulse width of 200 ns and pulse repetition rate of 30 kHz.
3. The processing technique adopted in this study successfully cut through the PCD workpiece by applying a reactive fusion cutting mechanism combined with horizontal shifting followed by vertical lifting to cut the material layer by layer. It is concluded that during the laser processing, the cut part on the right-hand side was subjected to repeated action of the laser on the sidewall of the cut edge, resulting in improved laser finishing with good surface morphology and surface quality. Furthermore, it is clearly shown that laser cutting provides better surface roughness of Ra = 0.378 µm than that obtained by WEDM (Ra = 0.684 µm).
4. The laser finishing study presented the optimal laser processing paths followed in Method 3 (horizontal shifting followed by vertical lifting to process the next layer, with 20 passes per path). The feasibility of using a nanosecond fiber laser as a tool for surface finishing was verified. Excellent surface quality (Ra = 0.202 µm) was achieved after laser finishing.
5. Finally, the laser processing was conducted with the PCD workpiece placed on a single-axis curved stage with a tilt of 5.2° for the laser cutting and finishing. The test results revealed that the issue caused by the tilted cut edge was solved by using this arrangement.
It is evident that the nanosecond fiber laser can not only perform the cutting and finishing process for the production of PCD inserts but it can also be used in applications such as those involving an oriented PCD workpiece with various rake angles and clearance angles.
6. Future research may study the optimal number of paths to cut through the PCD workpiece. Furthermore, it is worth developing a laser machining process suitable for producing a very sharp cutting edge or a tool nose with a tiny radius, which can be used in high-precision cutting tools manufactured from PCD blanks.

Author Contributions

Conceptualization, F.-Y.C., C.-F.H. and W.-H.L.; methodology, F.-Y.C.; software, C.-F.H. and W.-H.L.; validation, F.-Y.C., C.-F.H. and W.-H.L.; formal analysis, F.-Y.C., C.-F.H. and W.-H.L.; investigation, C.-F.H. and W.-H.L.; resources, F.-Y.C.; data curation, C.-F.H. and W.-H.L.; writing—original draft preparation, C.-F.H.; writing—review and editing, F.-Y.C.; visualization, C.-F.H.; supervision, F.-Y.C.; project administration, F.-Y.C.; funding acquisition, F.-Y.C. All authors have read and agreed to the submitted draft of the manuscript.

Funding

This research received no external funding.

Acknowledgments

This research was supported by the Ministry of Science and Technology, Taiwan, Republic of China under grants MOST 106-2221-E-011-071-MY2 and MOST 108-2221-E-011-128.

Conflicts of Interest

The authors declare no conflict of interest.

References

  1. Astakhov, V.P.; Stanley, A. Polycrystalline diamond (PCD) tool material: Emerging applications, problems, and possible solutions. In Traditional Machining Processes; Davim, J.P., Ed.; Springer: Berlin/Heidelberg, Germany, 2015; pp. 1–32. [Google Scholar] [CrossRef]
  2. Davis, J.R. ASM Specialty Handbook: Tool Materials; ASM International: Almere, The Netherlands, 1995; p. 88. ISBN 978-0-87170-545-7. [Google Scholar]
  3. Bai, Q.; Yao, Y.; Chen, S. Research and development of polycrystalline diamond woodworking tools. Int. J. Refract. Hard Metals Hard Mater. 2002, 20, 395–400. [Google Scholar] [CrossRef]
  4. Hosseini, A.; Kishawy, H.A. Cutting tool materials and tool wear. In Machining of Titanium Alloys; Springer: Berlin/Heidelberg, Germany, 2014; pp. 31–56. [Google Scholar] [CrossRef]
  5. Kraus, T.; Kühnel, M. Composites Market Report 2016. Carbon Composites; AVK Industrievereinigung Verstärkte Kunststoffe: Frankfurt, Germany, 2016. [Google Scholar]
  6. Global Information Inc. Aerospace Composites Market by Fiber Type (Carbon, Ceramic, Glass), Matrix Type, Application, Manufacturing Process, Aircraft Type (Commercial & Military Aircraft, Business & General Aviation, Civil Helicopter), & Region-Global Forecast to 2025. Published by MarketsandMarkets. Product code 950629. Available online: https://www.giiresearch.com/report/mama950629-aerospace-composites-market-by-fiber-type-carbon.html (accessed on 9 July 2020).
  7. Galindo-Fernandez, M.; Diver, C.; Leahy, W. The prediction of surface finish and cutting speed for wire electro-discharge machining of Polycrystalline Diamond. Procedia CIRP 2016, 42, 297–304. [Google Scholar] [CrossRef]
  8. Davim, J.P. Traditional Machining Processes; Springer: Berlin/Heidelberg, Germany, 2015. [Google Scholar] [CrossRef]
  9. Gao, C.; Zhan, Z.; Wang, S.; He, N.; Li, L. Research on WEDM process optimization for PCD micro milling tool. Procedia CIRP 2013, 6, 191–214. [Google Scholar] [CrossRef] [Green Version]
  10. Tso, P.L.; Liu, Y.G. Study on PCD machining. Int. J. Mach. Tool Manuf. 2002, 42, 331–334. [Google Scholar] [CrossRef]
  11. Kui, L.; Hu, W.; Tong, N.S.; Senthil, K.A. EDM wire cutting of polycrystalline diamond (PCD) for customized cutting tool fabrication. In Proceedings of the 20th International Symposium on Advances in Abrasive Technology (ISAST 2017), Okinawa, Japan, 3–6 December 2017; pp. 572–577. [Google Scholar]
  12. Dold, C.; Henerichs, M.; Bochmann, L.; Wegener, K. Comparison of ground and laser machined polycrystalline diamond (PCD) tools in cutting carbon fiber reinforced plastics (CFRP) for aircraft structures. Procedia CIRP 2012, 1, 178–183. [Google Scholar] [CrossRef]
  13. Li, G.; Yi, S.; Sun, S.; Ding, S. Wear mechanisms and performance of abrasively ground polycrystalline diamond tools of different diamond grains in machining titanium alloy. J. Manuf. Process. 2017, 29, 320–331. [Google Scholar] [CrossRef]
  14. Kuppuswamy, R.; Airey, K.-A.; Sardikmen, H. Micro-grinding characteristics of polycrystalline diamond tool. Int. J. Adv. Manuf. Technol. 2015, 76, 161–171. [Google Scholar] [CrossRef]
  15. Konrad, W.; Dold, C.; Henerichs, M.; Walter, C. Laser prepared cutting tools. Physics Procedia 2012, 39, 240–248. [Google Scholar] [CrossRef] [Green Version]
  16. Harrison, P.M.; Henry, M.; Brownell, M. Laser processing of polycrystalline diamond, tungsten carbide, and a related composite material. J. Laser Appl. 2006, 18, 117–126. [Google Scholar] [CrossRef]
  17. Butler-Smith, P.; Warhanek, M.; Axinte, D.; Fay, M.; Bucourt, J.-F.; Ragueneau, R.; Wegener, K. The influences of pulsed-laser-ablation and electro-discharge-grinding processes on the cutting performances of polycrystalline diamond micro-drills. CIRP Annals Manuf. Technol. 2016, 65, 105–108. [Google Scholar] [CrossRef]
  18. Scalbert, W.; Tanner, D.; Laffir, F.; Holtz, R. Development of high power laser ablation process for polycrystalline diamond polishing-Part 1: Fundamental understanding of PCD ultra-short pulsed laser ablation. In Proceedings of the High-Power Laser Materials Processing: Applications, Diagnostics, and Systems VII. International Society for Optics and Photonics, San Francisco, CA, USA, 15 February 2018. [Google Scholar] [CrossRef] [Green Version]
  19. Scalbert, W.; Tanner, D.; Holtz, R. Development of high-power laser ablation process for polycrystalline diamond polishing Part 2: Upscaling of PCD ultra-short pulsed laser ablation to high power. In Proceedings of the High-Power Laser Materials Processing: Applications, Diagnostics, and Systems IX, Bellingham, WA, USA, 2 March 2020. [Google Scholar] [CrossRef]
  20. Kamlage, G.; Bauer, T.; Ostendorf, A.; Chichkow, B.N. Deep drilling of metals by femtosecond laser pulses. Appl. Phys. A Mater. Sci. Process. 2003, 77, 307–310. [Google Scholar] [CrossRef]
  21. Hung, C.-H.; Chang, F.-Y. Curve micromachining on the edges of nitinol biliary stent by ultrashort pulses laser. Opt. Laser Technol. 2017, 90, 1–6. [Google Scholar] [CrossRef]
  22. Martínez, S.; Lamikiz, A.; Ukar, E.; Calleja, A.; Arrizubieta, J.A.; Lopez de Lacalle, L.N. Analysis of the regimes in the scanner-based laser hardening process. Opt. Lasers Eng. 2017, 90, 72–80. [Google Scholar] [CrossRef]
  23. Zimmermann, M.; BenjaminKirsch, B.; Kang, Y.; Herrmann, T.; Aurich, J.C. Influence of the laser parameters on the cutting edge preparation and the performance of cemented carbide indexable inserts. J. Manuf. Process. 2020, 58, 845–856. [Google Scholar] [CrossRef]
  24. Kasunic, K.J. Laser Systems Engineering; Chapter 3; SPIE: Bellingham, WA, USA, 2016; Volume PM271, ISBN 9781510604261. [Google Scholar]
  25. Thawari, G.; Sarin Sundar, J.K.; Sundararajan, G.; Joshi, S.V. Influence of process parameters during pulsed Nd: YAG laser cutting of nickel-base superalloys. J. Mater. Process. Technol. 2005, 170, 229–239. [Google Scholar] [CrossRef]
  26. Kleine, K.F.; Whitney, B.; Watkins, K.G. Use of fiber lasers for micro cutting applications in the medical device industry. In Proceedings of the 21st International Congress on Applications of Lasers and Electro-Optics, Scottsdale, AZ, USA, 14–17 October 2002. [Google Scholar] [CrossRef] [Green Version]
  27. Li, L.; Low, D.K.Y.; Ghoreshi, M.; Crookall, J.R. Hole taper characterisation and control in laser percussion drilling. CIRP Annals-Manuf. Technol. 2002, 51, 153–156. [Google Scholar] [CrossRef]
Figure 1. Schematic of pulse overlap at different laser scan rates and pulse repetition rates: (a) at a high scan rate or low pulse repetition rate, the pulse overlap area is small; (b) at a low scan rate or high pulse repetition rate, the pulse overlap area is significant.
Applsci 11 05871 g001
Figure 2. Schematic diagram of laser cutting: (a) Laser cutting paths, cut from the start (Path 1) to the end (Path 8). After Path 1 is traversed, the laser beam is shifted 10 µm to the right to cut Path 2. The total number of shifts is seven with total shifting of 70 µm to the right. (b) After the first layer is cut, the laser beam is switched back to the position of the first path; the workpiece is lifted by 50 µm along the Z-axis, and the cutting process is repeated as described in (a) until the workpiece is cut through. (c) Schematic of fixing the workpiece with an overhang. The workpiece and stage holder can be simultaneously lifted along the Z-axis.
Applsci 11 05871 g002
Figure 3. Laser finishing Method 1: (a) The starting position of the laser finishing process (Row 1) was set at 48 µm to the left from the vertical Baseline A. The vertical direction along the Z-axis of the workpiece was processed first with 20 passes per path. After Layer 1 (Path 1) was processed, the workpiece stage is lifted by 100 µm in the Z-axis direction to process Layer 2 (Path 2). The total number of Z-axis lifts was 4 (5 paths in total); (b) After processing all 5 layers in row 1, the stage was returned to its original position. The focal spot of the laser beam was shifted horizontally by 5 µm to the right to process the following paths (from Path 6 to Path 10) in Row 2. The processing paths mentioned above were repeated until the number of horizontal shifts reachd6 (7 rows in total).
Applsci 11 05871 g003
Figure 4. Laser finishing Method 3: (a) 7 paths of laser finishing, from Path 1 to Path 7, were conducted in Layer 1 with 6 horizontal shifts. The finishing was performed with 20 passes per path and horizontal space shift of 5 µm between paths; (b) The stage was lifted in the vertical direction along the Z-axis for processing Layer 2. Path 8 to path 14 were conducted in the layer with 6 horizontal shifts. The stage lift in the Z-axis was 100 µm, and the total number of stage lifts was 4 (5 layers in total).
Applsci 11 05871 g004
Figure 5. (a) Tilted cut edge of the PCD workpiece: (b) a single-axis curved stage is installed on the Z-axis positioning stage with a defined tilt angle to offset the cut edge of the PCD workpiece.
Applsci 11 05871 g005
Figure 6. Optical microscope observation of the effect of variation in the scan rate on the kerf depth in laser cutting of PCD workpiece (laser processing parameters were set at average power of 25.5 W, pulse width of 200 ns, and repetition rate of 170 kHz): (a) scan rate of 1 mm/s; (b) scan rate of 3 mm/s; (c) scan rate of 5 mm/s; (d) scan rate of 7 mm/s; (e) scan rate of 9 mm/s.
Applsci 11 05871 g006
Figure 7. Relationship between scan rate and kerf depth (laser processing parameters are average power of 25.5 W, pulse width of 200 ns, and repetition rate of 170 kHz).
Applsci 11 05871 g007
Figure 8. Optical microscope observation of the effect of variation in the number of cutting passes per path on the kerf depth in laser cutting of PCD workpiece (laser processing parameters were set at average power of 25.5 W, pulse width of 200 ns, and repetition rate of 170 kHz): (a) 1 pass per path; (b) 3 passes per path; (c) 5 passes per path; (d) 7 passes per path; (e) 9 passes per path.
Applsci 11 05871 g008aApplsci 11 05871 g008b
Figure 9. Relationship between number of cutting passes and kerf depth (laser processing parameters were set at average power of 25.5 W, pulse width of 200 ns, and repetition rate of 170 kHz).
Applsci 11 05871 g009
Figure 10. Effect of variation in pulse width on kerf depth in laser cutting of PCD workpiece. The fixed average power was 30 W, and the lowest pulse repetition rate for a specific kerf width was selected, as shown in Table 5. (a) Pulse width of 4 ns; (b) pulse width of 8 ns; (c) pulse width of 14 ns; (d) pulse width of 20 ns; (e) pulse width of 30 ns; (f) pulse width of 50 ns; (g) pulse width of 100 ns; (h) pulse width of 200 ns.
Applsci 11 05871 g010
Figure 11. Correlation between variation in pulse width, pulse energy, and kerf depth. Both pulse energy and kerf depth increase with an increase in pulse width.
Applsci 11 05871 g011
Figure 12. Correlation between variation in pulse width, pulse energy, and peak power. The pulse energy increases with an increase in pulse width. The maximum pulse width of 200 ns corresponds to the lowest peak power 5000 W.
Applsci 11 05871 g012
Figure 13. Optical microscope images of left and right sides of a laser cut PCD workpiece. (a) Left side, where the starting path begins; (b) right- side, where the final path ends; (c) surface of the cut side, where the starting path begins; (d) surface of the cut side, where the final path ends.
Applsci 11 05871 g013
Figure 14. SEM morphologies of the laser finished surface (laser finishing parameters are average power of 30 W, scan rate of 5 mm/s, pulse width of 50 ns, repetition rate of 90 kHz). (a) The surface without laser finishing; (b) the surface after laser finishing using Method 1; (c) the surface after laser finishing using Method 2; (d) the surface after laser finishing using Method 3.
Applsci 11 05871 g014
Figure 15. Schematic diagram of the laser shielding effect.
Applsci 11 05871 g015
Figure 16. Optical microscope image (a) and SEM morphology (b) of the laser-finishing surface of the PCD workpiece by Method 3, using a pulse width of 200 ns and pulse repetition rate of 30 kHz.
Applsci 11 05871 g016
Figure 17. Coherence correlation interferometry measurement of surface roughness of the laser processed PCD workpiece before and after laser finishing. (a) Surface morphology and surface roughness before finishing (Ra = 0.378 µm); (b) surface morphology and surface roughness after finishing (Ra = 0.209 µm).
Applsci 11 05871 g017aApplsci 11 05871 g017b
Figure 18. Optical microscope image (a) and SEM morphology (b) of the PCD workpiece processed using Method 3 with the stage tilted by 5.2°.
Applsci 11 05871 g018
Figure 19. Coherence correlation interferometry measurement for the laser processed PCD workpiece with tilted stage angle of 5.2° (Ra = 0.202 µm).
Applsci 11 05871 g019
Table 1. Properties of PCD.
Density (g/cm3)8.35
Young’s modulus (GPa)900
Poisson’s ratio0.086
Thermal conductivity (W/mK)560
Compressive strength (GPa)7.55
Transverse rupture strength (GPa)1.04
Fracture toughness (MPa × m1/2)6.55
Knoop hardness (GPa)50
Table 2. Specifications of nanosecond fiber laser system.
BrandIPG
ModelYLPN-1-4x200-30-M
Wavelength1064 nm
Average power30 W
Pulse width4,8,14,20,30,50,100,200 ns
Pulse repetition rate1.6 ~ 2000 kHz
Output beam diameter7 mm
Beam quality M21.5
Maximum peak power15 kW
Maximum pulse energy1 mJ
Table 3. Operating parameters for testing the effects of number of passes per path and scan rate on the PCD kerf depth.
Fixed ParameterParameter SettingVariable ParameterParameter Setting
Average power (W)25.5Number of passes per path1, 3, 5, 7, 9
Pulse width (ns)200Scan rate (mm/s)1, 3, 5, 7, 9
Pulse repetition rate (kHz)17
Table 4. Parameter settings for various pulse widths at an average power of 30 W and scan rate of 5 mm/s.
Pulse width (ns)4814203050100200
Repetition rate (kHz)750300190160130906030
Note: the lowest repetition rate was selected for each pulse width to have the maximum pulse energy and maximum peak power.
Table 5. Lowest pulse repetition rates for specific pulse widths. The maximum pulse energy and maximum peak power are also listed.
Pulse Width (ns)Repetition Rate (kHz)Pulse Energy (mJ)Peak Power (W)
47500.0410,000
83000.112,500
141900.1611,278
201600.199375
301300.237692
50900.336666
100600.55000
2003015000
Table 6. Laser cut testing of PCD workpiece.
Stage lifting distance (µm) (a)5080100
Number of lifts (b)241512
Total lifting distance (µm) (=a × b)120012001200
Number of paths per lifting888
Number of passes per path555
Cutting throughyesyesno
Note: distance between paths = 10 µm.
Publisher’s Note: MDPI stays neutral with regard to jurisdictional claims in published maps and institutional affiliations.

