Article

Agricultural Residue Management for Sustainable Power Generation: The Poland Case Study

1
Department of Tractors and Agricultural Machines, Operating and Maintenance, Mykolayiv National Agrarian University, 54020 Mykolaiv, Ukraine
2
Institute of Environmental Engineering and Biotechnology, University of Opole, 45-040 Opole, Poland
3
Department of Information System and Technology, Poltava State Agrarian University, 36003 Poltava, Ukraine
4
Faculty of Management, Czestochowa University of Technology, 42-201 Czestochowa, Poland
5
Department of Technology, Faculty of Natural Sciences, Matej Bel University, 974 01 Banská Bystrica, Slovakia
*
Author to whom correspondence should be addressed.
Appl. Sci. 2021, 11(13), 5907; https://doi.org/10.3390/app11135907
Submission received: 19 May 2021 / Revised: 16 June 2021 / Accepted: 23 June 2021 / Published: 25 June 2021
(This article belongs to the Section Food Science and Technology)

Abstract

:
The European Union has set targets for renewable energy utilization. Poland is a member of the EU, and its authorities support an increase in renewable energy use. The background of this study is based on the role of renewable energy sources in improving energy security and mitigation of climate change. Agricultural waste is of a significant role in bioenergy. However, there is a lack of integrated methodology for the measurement of its potential. The possibility of developing an integrated evaluation methodology for renewable energy potential and its spatial distribution was assumed as the hypothesis. The novelty of this study is the integration of two renewable energy sources: crop residues and animal husbandry waste (for biogas). To determine agricultural waste energy potential, we took into account straw requirements for stock-raising and soil conservation. The total energy potential of agricultural waste was estimated at 279.94 PJ. It can cover up to 15% of national power generation. The spatial distribution of the agricultural residue energy potential was examined. This information can be used to predict appropriate locations for biomass-based power generation facilities. The potential reduction in carbon dioxide emissions ranges from 25.7 to 33.5 Mt per year.

1. Introduction

Throughout the millennia of its existence, mankind has primarily used natural energy sources such as wood, vegetable oils, sun, wind, etc. Human civilization uses fossil fuels such as coal, oil, and natural gas only in recent centuries. These energy resources are exhaustible. Their combustion products result in harmful emissions, which pollute the environment, firstly, the atmosphere. This situation forces humanity to look for renewable and environmentally friendly energy resources.
The world’s population is increasing and it is projected to reach 9 billion by 2050 [1]. This requires a rise in energy (conventional and renewable) consumption [2]. It results in a shortage of fossil fuels and an increase in their prices. Firms are truly becoming more environmentally conscious by minimizing energy costs and the use of fossil energy [3,4]. The above forces mankind to seek alternative energy resources, which include biomass. The European Union (EU) has set targets for renewable energy utilization. According to the targets, electricity and heat energy should be generated by the use of biomass [5].

1.1. Renewable Energy and Bioeconomy

The share of bioenergy exceeded 13.5% in 2018. It has been ranked fourth among all types of energy resources [6]. Scientists consider that the global potential of biomass (including forestry, organic waste, agricultural residues, and energy crops) ranges from 100 to 600 EJ [7]. The International Energy Agency estimated that the above ranges from 15% to 65% of primary energy consumption [8]. Biomass has a great potential to mitigate greenhouse gases emissions [9,10,11,12] and may be a key component to meet global climate targets [13,14,15]. Its use is a promising pathway towards a low carbon economy [16] and circular economy [17]. The general trends in the use of biomass for energy production were in the spotlight of scientists [18,19].
Bioenergy is an important component of the bioeconomy. This concept has been put forward by the EU and supported by many countries [20,21,22,23]. There has been an increase in awareness of the green business among stakeholders, leading to increased contributions to the management of the companies’ ecological transition [24,25].
The bioeconomy includes all the economic activities concerning the use of biomass of different origins [26]. Concepts of the bioeconomy and circular economy are very close [27,28]. The bioeconomy strategy of the EU focuses on the balance of environmental, social, and economic benefits through the sustainable use of renewable resources [29]. In 2015, the EU bioeconomy created 18 million jobs and generated EUR 10,831 million [30].

1.2. Power Generation in Poland

In 2018 total energy consumption of Poland was 4490.7 PJ. The country produces its own energy resources which cover 60% of the national energy requirements. The share of renewable energy reached 8.2% of the total energy consumption [31].
National electricity generation is growing, and in 2018 it was 170.04 TWh. Coal-based power plants generate over 80% of electricity. Around 21.58 TWh of electricity were generated by renewable energy sources (Figure 1). Their share exceeded 12% [31,32]. Meanwhile, since 2015 electricity generated by biomass and biogas has decreased (Figure 1). In 2018 their share fell from 59.8% in 2012 to 30.2%.
The main problem of the energy sector is its transition to meet national environment and climate policies. This process is regulated by the Energy Law Act [33]. The Polish power industry is regulated by two primary documents: The National Renewable Energy Action Plan [34,35] and the Energy Policy of Poland until 2030 [36]. They stipulate gradual diversification of fuels and an increase in the share of renewable energy resources in power generation. The development of renewable energy utilization is supported by the Energy Law [33]. The National Renewable Energy Action Plan comprises four sources of biomass: forestry, agriculture (energy crops and residues), municipal and industrial waste. It must be emphasized that biomass production in agriculture should not compete for arable land with food crop cultivation [37].
Agriculture generates a significant volume of organic residues. They are valuable feedstock for energy production. Thus, agriculture can become a significant producer of renewable energy. It is important to reveal still underestimated sides of agricultural residues-based power generation. All in all, there are still knowledge gaps concerning agricultural residue resources, their spatial-temporal distribution, and energy potential for energy cluster formation in Poland. The aim of this study is to determine agricultural residue energy potential on a regional level; select suitable regions for biomass-based power generation; determine the potential carbon dioxide emission savings.
This paper is organized as follows. The Literature Review is elaborated in Section 2. The methods of this study are described in Section 3 (Materials and Methods). Section 4 (Results) comprises four subsections. Crop residue availability is analyzed in Section 4.1. Biogas production potential is estimated in Section 4.2. The impact of sugar beet leaf on total energy potential is studied in Section 4.3. Followed by a carbon dioxide emission saving is presented in Section 4.4. Conclusion remarks are given in Section 5. This study is based on previous authors’ publications concerning cluster analysis of renewable energy resources [38,39].

2. Literature Reviews

Agricultural, municipal, and industrial waste should be recycled. Unprocessed organic waste can be used to generate heat and electricity. It corresponds to circular economy principles. The optimal location of the processing plants is essential. Optimization methodologies are developed to find the optimal allocation of the plants [40]. Optimal waste-to-energy facility location may be assessed by integer linear and non-linear models [41]. Uneven distribution of waste incinerators and landfills impacts the economic efficiency of organic waste utilization. To find an optimal solution to the above problem, Brezina et al. [42] modeled the network of waste collection sites and the deployment of waste incinerators in the Slovak Republic. Municipal waste-to-energy plants in Poland and their impact on the national energy security and benefits associated with energy production were studied by Cyranka et al. [43].
The cluster concept is a promising way to keep biomass utilization competitive [44]. Energy communities in renewable energy utilization are essential components to the successful transition towards a low carbon economy. These renewable energy systems were defined by Lowitzsch et al. as “renewable energy clusters” [45]. “Energy communities” were mentioned in some documents such as the Renewable Energy Directive, the Internal Electricity Market Directive and Regulation [46,47,48]. Renewable energy clusters are similar to analogous concepts such as hybrid renewable energy systems [49]; multi-energy systems [50]; autonomous polygeneration systems [51]; and sustainable energy districts [50,52]. To develop and support renewable energy clusters, it is necessary to have information about the spatial distribution of renewable energy resources and their energy potential. Geographical location impacts the competitiveness of any bioenergy cluster [28]. McCauly and Stephens [53] explained the impact of renewable energy clusters on the economic development of any region. Wiktor-Sułkowska examined the bioenergy cluster synergy effect [54].
Many researchers studied the use of agricultural biomass for energy production. Baum et al. [55] studied the potential of agricultural biomass to be used for energy production in Poland. They divided biomass utilization into three groups such as vehicle fuels, electricity, and heat generation. The economic energy potential of available biomass has been estimated at around 600 PJ. The share of agricultural residues has been determined at 48.17% of the total value [55].
A spatial method for estimating the potential of biomass energy has been developed and used by many scientists [56,57]. Ericsson et al. [58], Kuś and Faber [59] found that Poland can cover from 90 to 95% of its own energy needs from bioenergy resources. Some researchers believe that due to high production costs, renewable energy will be more expensive than fossil energy carriers [60,61,62,63]. It is believed that there will be co-utilization of fossil and renewable energy resources [64]. Simionescu et al. have proven that gross domestic product per capita has a positive impact on the use of renewable energy [65]. Zaliwski et al. studied the production of perennial energy crops for co-firing. They have found that their cultivation on poor land has high production costs and, therefore, their use is not profitable [66].
Biomass direct and co-firing technologies are cheaper compared to gasification, fermentation, and digestion ones. And the co-firing technology is cheaper than the direct burning one. This technology can reach a competitive production cost of electricity [67]. Therefore, co-firing straw with fossil fuels is a promising direction. Razakis et al. have used a cost-minimize transport model to optimize crop straw allocations among primary power plants in Poland. The model takes into account their capacities and constraints of co-firing. Its application results in minimizing straw costs (production cost and transportation). According to their estimates, agricultural residues could cover around 36% of the fuel required for power generation in Poland [67].

3. Materials and Methods

This study focuses on the study of the available crop and livestock residues potential for power generation, their spatial distribution. Carbon dioxide emission saving was used as an ecological indicator. The necessary data are got from the Central Statistical Office of Poland. A novelty of this study is as follows: the use of integrated methodology of two renewable energy sources (for direct burning and anaerobic digestion); taking into account carbon dioxide emission associated with straw formation. Energy potential for crop residues and biogas (from manure and crop residues) is determined in PJ (1 PJ = 1015 J). Power generation potential is calculated in TWh (1 TWh = 1012 W).

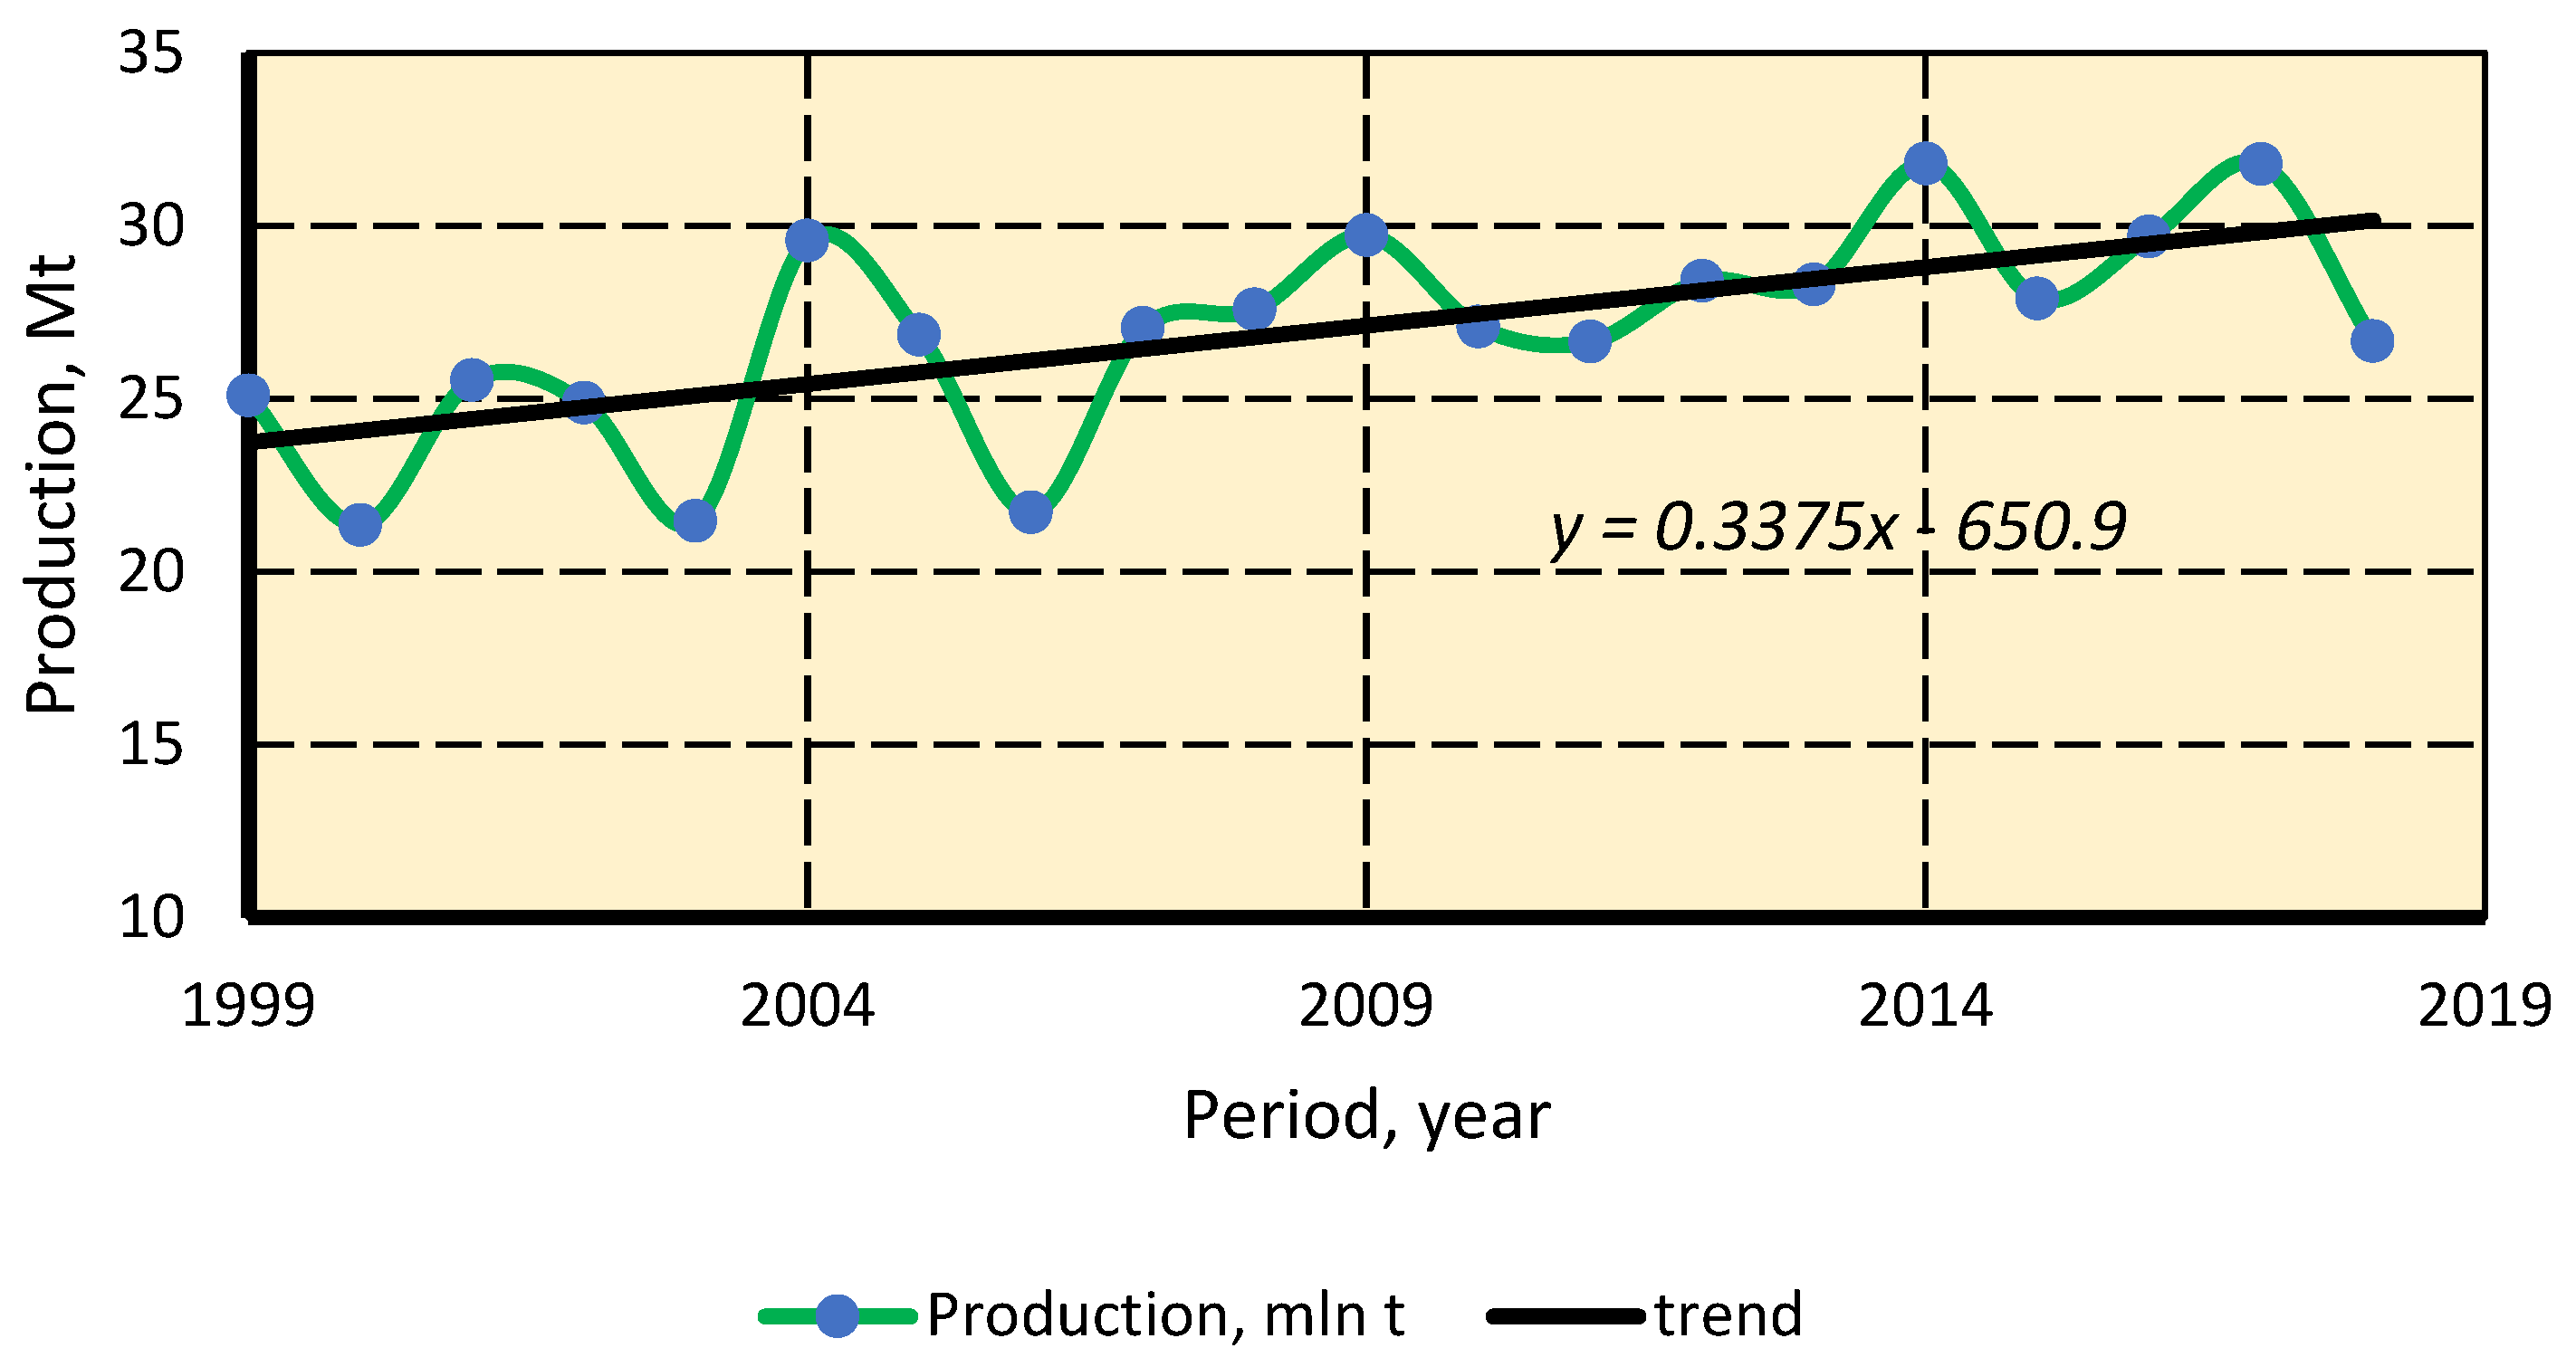
3.1. Available Crop Residues Energy and Power Generation Potential

Crop productions were estimated for a 19-year period based on Polish official statistical reports. The residue quantity for each crop was computed based on the gross crop harvest and a Residue-to-Crop Ratio (RCR). For our study, we selected eight crops: triticale, wheat, barley, corn, oat, rapeseed, sugar beet and mixed grain. Their residues production is
M R = i = 1 n ( M o i R C R i ) ,   [ t ] ,  
where Moi is the production of ith crop, [t]; RCPi is the Residue-to-Crop Ratio of ith crop; i is the crop number; n is the number of crops.
The Residue-to-Crop Ratios vary in a wide range. This range depends on a crop and weather conditions. We used the following values [65,68]: rye—from 0.91 to 1.44; oats—from 0.91 to 1.08; mixed grain—from 0.91 to 1.11; wheat—1.11; barley—from 0.87 to 1.25; triticale—from 1.00 to 1.13; rapeseed—1.00; corn—1.00.
Leaf-to-root ratios of sugar beet are stated to be within a range from 0.1 to 0.5 [69,70,71]. In our study, we assumed the above ratio of 0.209.
We take into account the use of straw for animal feeding and bedding. To calculate the above, livestock unit (LSU) coefficients are used. The following conversion coefficients for one head of animal are used: horse—1; cattle—0.8; pig—0.15; sheep—0.08; poultry—0.0105 [72,73,74,75,76]. With this in mind, energy potential of crop residues is calculated by the expression
E P r = 10 6 ( 1 l = 1 m [ A N l L S U l ( A B + A F ) ] + S C M R ) i = 1 n ( M o i R C R i L H V r i ) ,   [ PJ ] ,
where LHVri is the lower heating value of ith crop residue, [MJ/kg]; ANl is the livestock population of lth species, head; m is the number of livestock; LSUl is the livestock unit coefficient for lth species; AB is the straw bedding consumption for one LSU, AB = 1.5 t per year; AF is the straw feed consumption for one LSU, AF = 1.0 t per year; SC is the straw consumption for soil conservation, t.
Potential power generation of biomass-based power plants is
P G P r = 1 3.6 E P r η e ,   [ TWh ] ,
where ηe is the electric efficiency of a power plant.

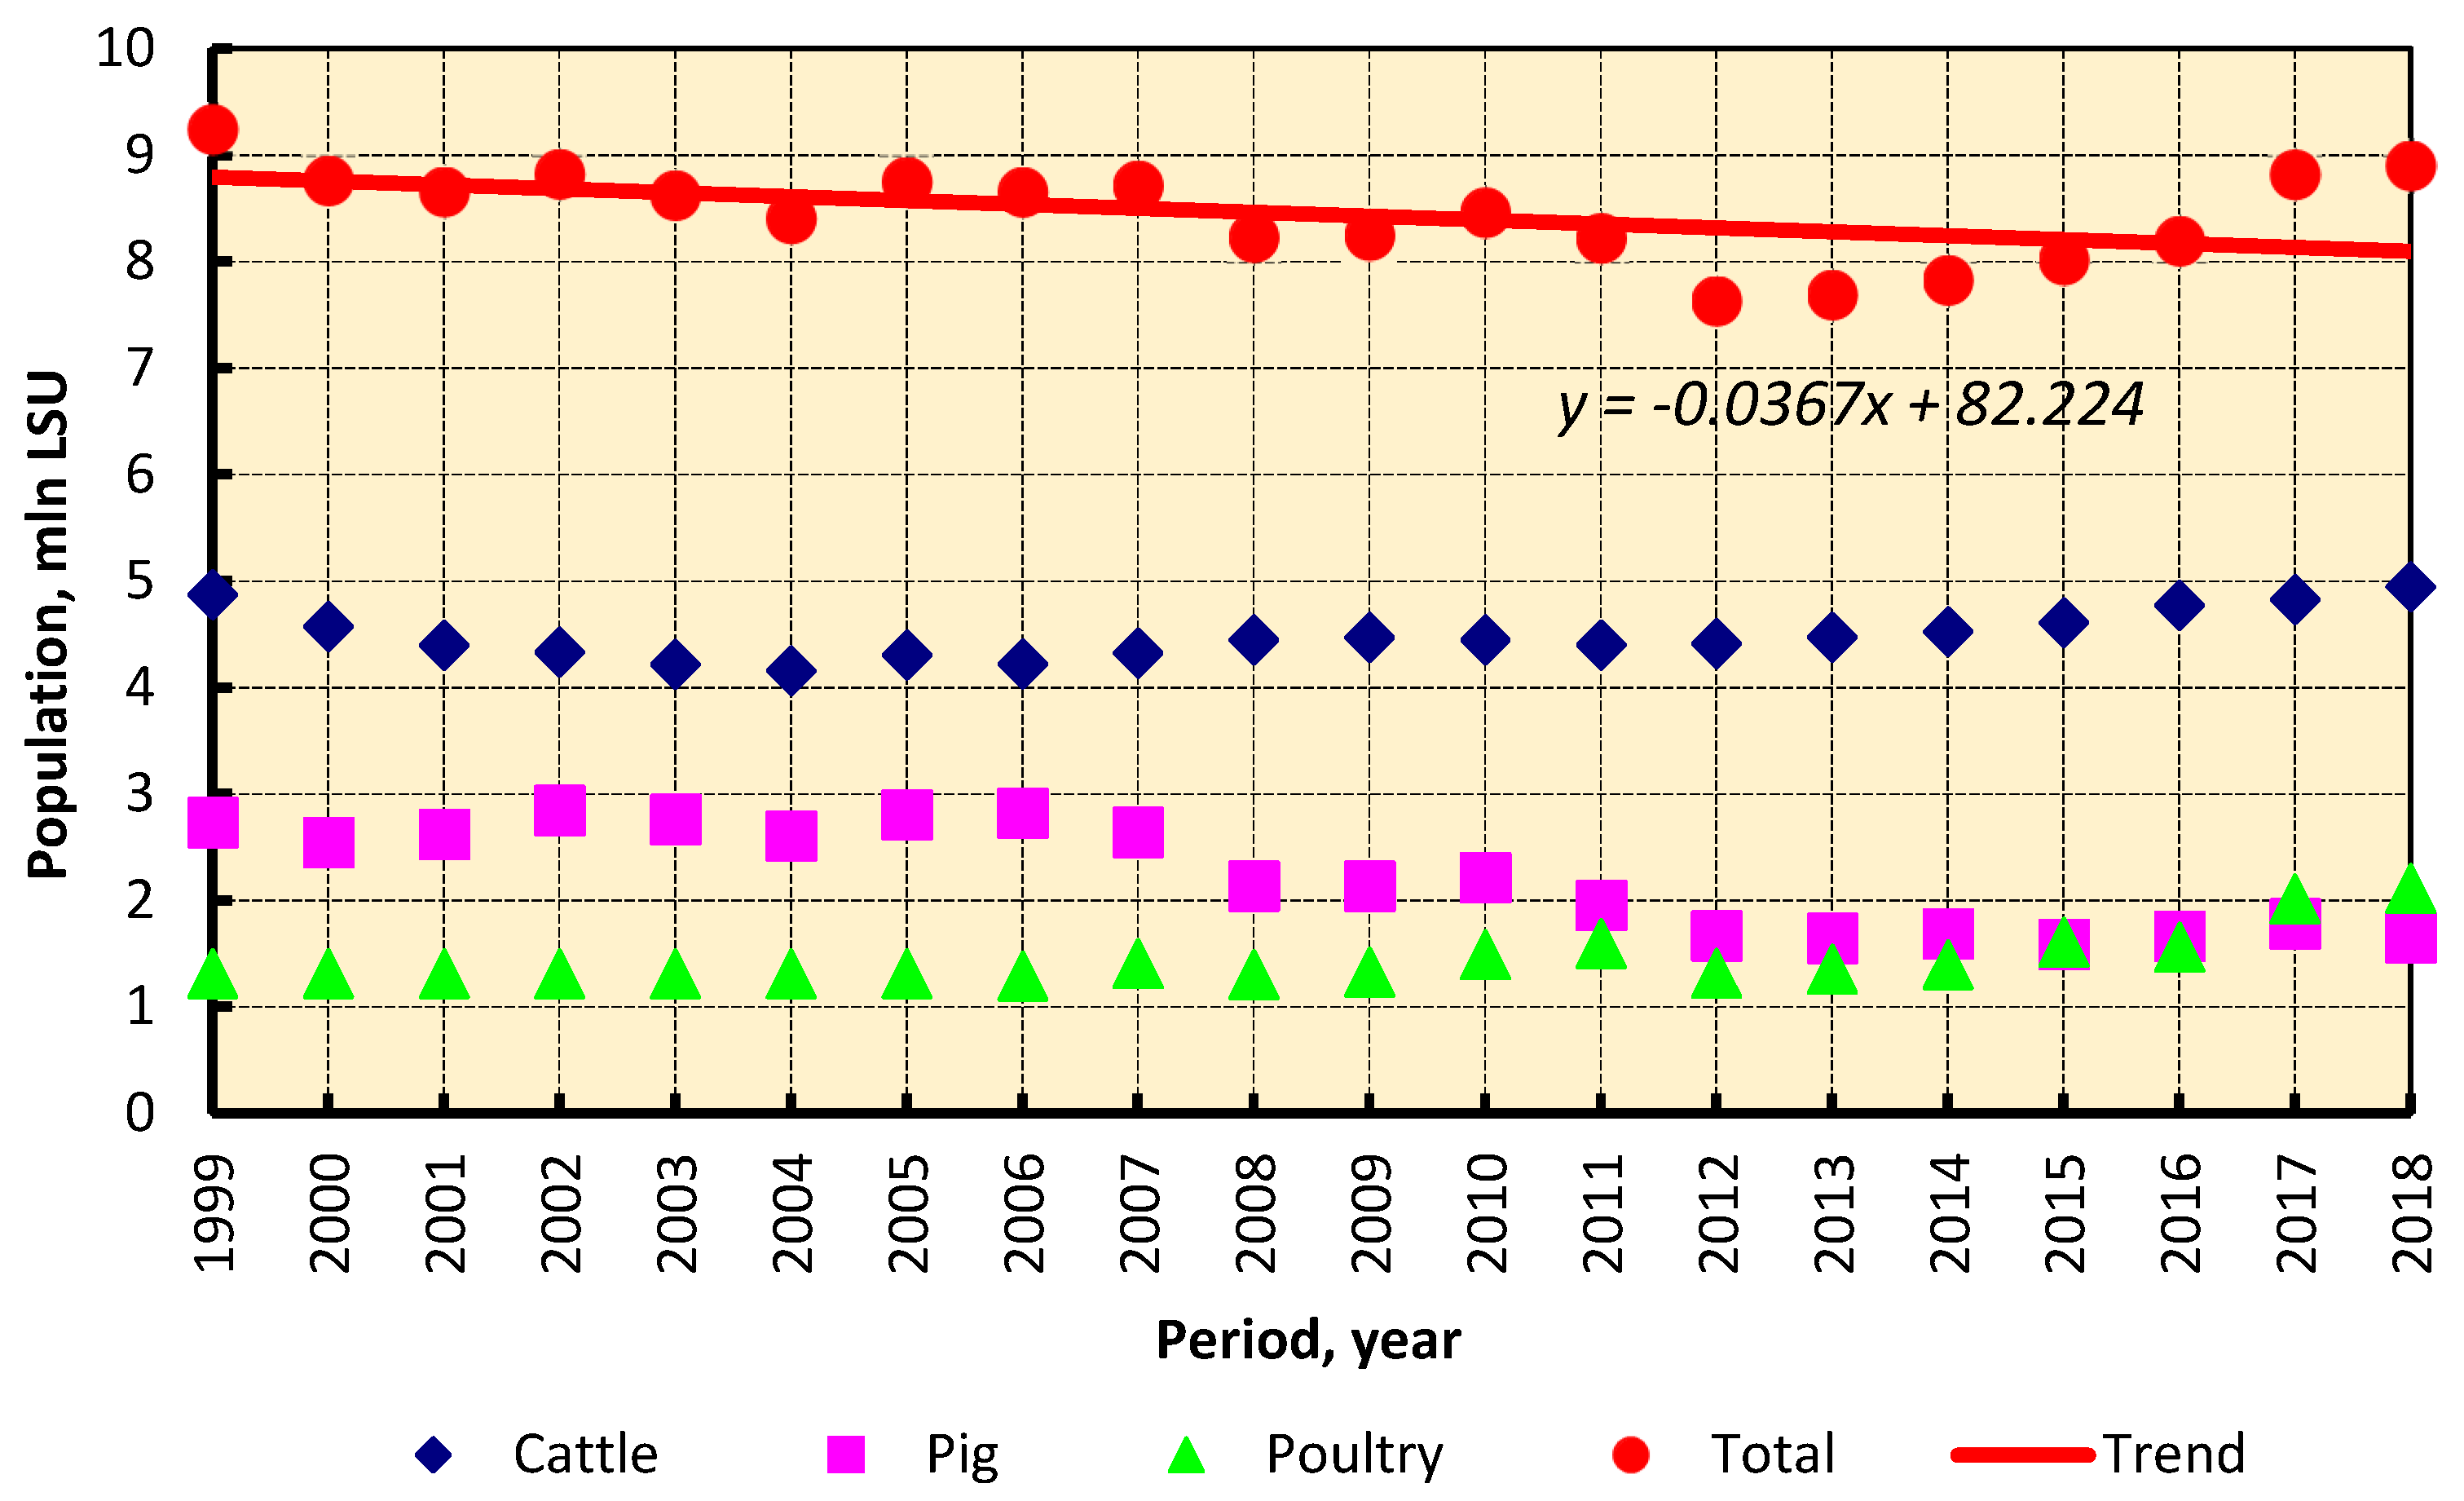
3.2. Biogas Energy Potential

Biogas yields are the function of the type of feedstock and species of a crop. The conversion of livestock population data into biomethane production has been done on the base of a literature analysis. The factors used in the computation are for different feedstock (animal and crop) are the following [74,77,78,79]:
  • Animals, m3/head/year: cattle—302.6; pig—23.7; sheep/goat—26.3; poultry—3.7;
  • Crop residues, m3 per fresh ton: maize straw -from 201 to 207; sugar beet leaves—48.6.
The energy potential of biomethane (produced from crop residue and manure) is equal to
E P m = 10 9 l = 1 m ( A N l M Y l L H V m ) + 10 9 i = 1 k ( M o i R C R i C Y i L H V m ) ,   [ PJ ] ,  
where LHVm is the lower heating value of methane, [MJ/m3]; MYl is the methane yield of lth species, cubic meter per year; CY is the methane yield of ith crop residue, [m3/t].
Potential power generation of a biogas plant is
P G P m = 1 3.6 E P m η e ,   [ TWh ] ,
where ηe is the electric efficiency of a biogas power plant.

3.3. Carbon Dioxide Emission

The use of renewable energy resources instead of fossil fuel decreases greenhouse gas emission. Carbon dioxide emission saving is [80]
C D E S = H E ( E F f E F r ) ,   [ t CO 2 ] ,  
where HE is the energy of fossil fuel substituted, [GJ]; EFf is the carbon dioxide emission factor for conventional fuel, [tCO2/GJ]; EFr is the carbon dioxide emission factor associated with straw formation, [tCO2/GJ].
For Poland, carbon dioxide emission factors are equal to, kg GJ−1: hard coal—94.52 and lignite—105.21 [81]. Carbon dioxide emission factor associated with straw formation was estimated at 0.0121 tCO2/GJ. This factor takes into account direct and indirect carbon dioxide emissions during crop growing and harvesting [39].

3.4. Data Analysis

The general data is processed by the following sequence: assessment of the crop residues production; assessment of manure production; determining the energy potential and power generation potential; evaluation of carbon dioxide emission saving; spatial distribution of residue energy potential. To carry out the spatial distribution analysis we used the cluster analysis and the Statistica program All voivodships of Poland are grouped into clusters. A voivodship is the administrative division of Poland. It corresponds to a province. Poland has 16 voivodships. Energy potential is calculated for each cluster.

4. Results

Straw and biogas can be used for power generation. Livestock waste and crop residues are studied as feedstock for biogas production. Their energy potential and carbon dioxide emission saving are examined further in the following Subsections.

4.1. Crop Residue Availability for Power Generation

Agricultural crop field residues are straw, stover, stalks, stubble, seed pods, etc. They can be used for energy production. In this paper widespread crops have been selected: wheat, triticale, rye, barley, oats, mixed grain, and rape. Productions of their residues are examined. To calculate residue production, we use the Equation (1). There is stability in sown area. Since 2010 there has been a rise in sown area by 3.7% (from 10,366 to 10,757 thousand ha) [68]. Since 1999 the share of the above crops has increased from 75.02% to 81.25%.
Crop production is growing (Figure 2). Gross grain crop production ranged from 21.34 to 31.79 Mt [82]. Average, minimum and maximum grain crop harvests over the years 1999–2018 are listed in Table 1. The main crops are wheat and triticale. Their average harvest was 13.49 Mt or 49.87% of the national harvest.
Applying Ward’s method, clusters of voivodships were identified for the year 2018. The cluster analysis was based on official statistical data on crop harvest [72,82], the Residue-to-Crop Ratios [65,69,70,71], quantity of straw for animal feeding and bedding [72,73,74,75,76]. The crop residue energy potential is calculated by the Equation (2). Since 1999 the total energy potential has increased by 168.55 PJ. It is the result of an increase in the total harvest (Figure 2) and a decrease in the livestock population [81].
The average national density of crop residue energy potential is 13.62 GJ/ha. This value is somewhat higher compared to Ukraine (13.45 GJ/ha) [66]. The potential power generation of straw-based power plants was estimated at 14.99 TWh of 8.82% of the total national generation. Potential power generation is determined by the Equation (3).
Biogas production from livestock waste can increase the energy potential and, therefore, power generation.

4.2. Biogas Production

Since 1999 animal population has decreased from 9.24 to 8.90 million LSU (Figure 3) [82]. It has resulted in changing the spatial distribution of livestock unit. Greater Poland and Podlaskie voivodships have 104.02 and 93.4 LSU per km2. It means that animal concentration has been increased in separate regions.
Biogas production potential is calculated by the Equation (4). In 2018 the energy potential of biogas production was 104.45 PJ. The potential power generation is determined at 11.61 TWh (the Equation (5) is used) or 6.83% of the national electricity generation. It is lower compared to straw based power generation.
Maize silage is the most popular feedstock for biogas production in the EU including Germany and Poland. For example, in Germany over 10% of arable land is used to cultivate maize silage [68].
Over the last decade a number of countries of the EU have introduced limitations for cultivation of energy crops. Moreover, maize silage prices are growing. This feedstock has rather a high price. This phenomenon results in worsening the economic indicators of biogas plants. This fact forces potential investors to look for alternative substrates [5]. That is why agricultural crop residues are in the spotlight for biogas production. Corn straw is half the cost of maize silage [83,84]. Moreover, this crop residue is not currently widely used by industry in Poland [85]. The cost of methane produced from corn straw (only at the cost of raw materials) ranges from EUR 1.61/GJ to EUR 2.78/GJ. It is much less compared to maize silage (EUR 6.42/GJ). The efficiency of corn straw-based biogas plants has been confirmed by Chinese experiences [86,87]. The pretreatment of lignocellulosic substrate (corn straw) before anaerobic digestion results in the increase of biogas yield [88].
The use of corn straw can increase the biogas production up to 115.64 PJ. The average increment is 10.71%. The best result can be achieved in Lower Silesian voivodship—57.68% (Figure 4). Opole and Subcarpathian voivodships have high results too. Therefore, the above three regions may be recommended to use the corn straw for co-digestion to produce biogas.
Spatial agricultural residue (crop and livestock) distribution is presented in Figure 5.
Six clusters emerged. The total agricultural residues have the energy potential of 273.23 PJ (Table 2) and they can generate up to 26.60 TWh or 15.65% of the national electricity production. Lublin voivodship maintains a leading position.
Some crop residues, for example, sugar beet leaves, cannot be directly burnt for power generation. However, they can be feedstock for biogas production. Poland farmers produce sugar beet over 12 Mts per year [82]. Thus, biogas production from sugar beet leaves should be studied.

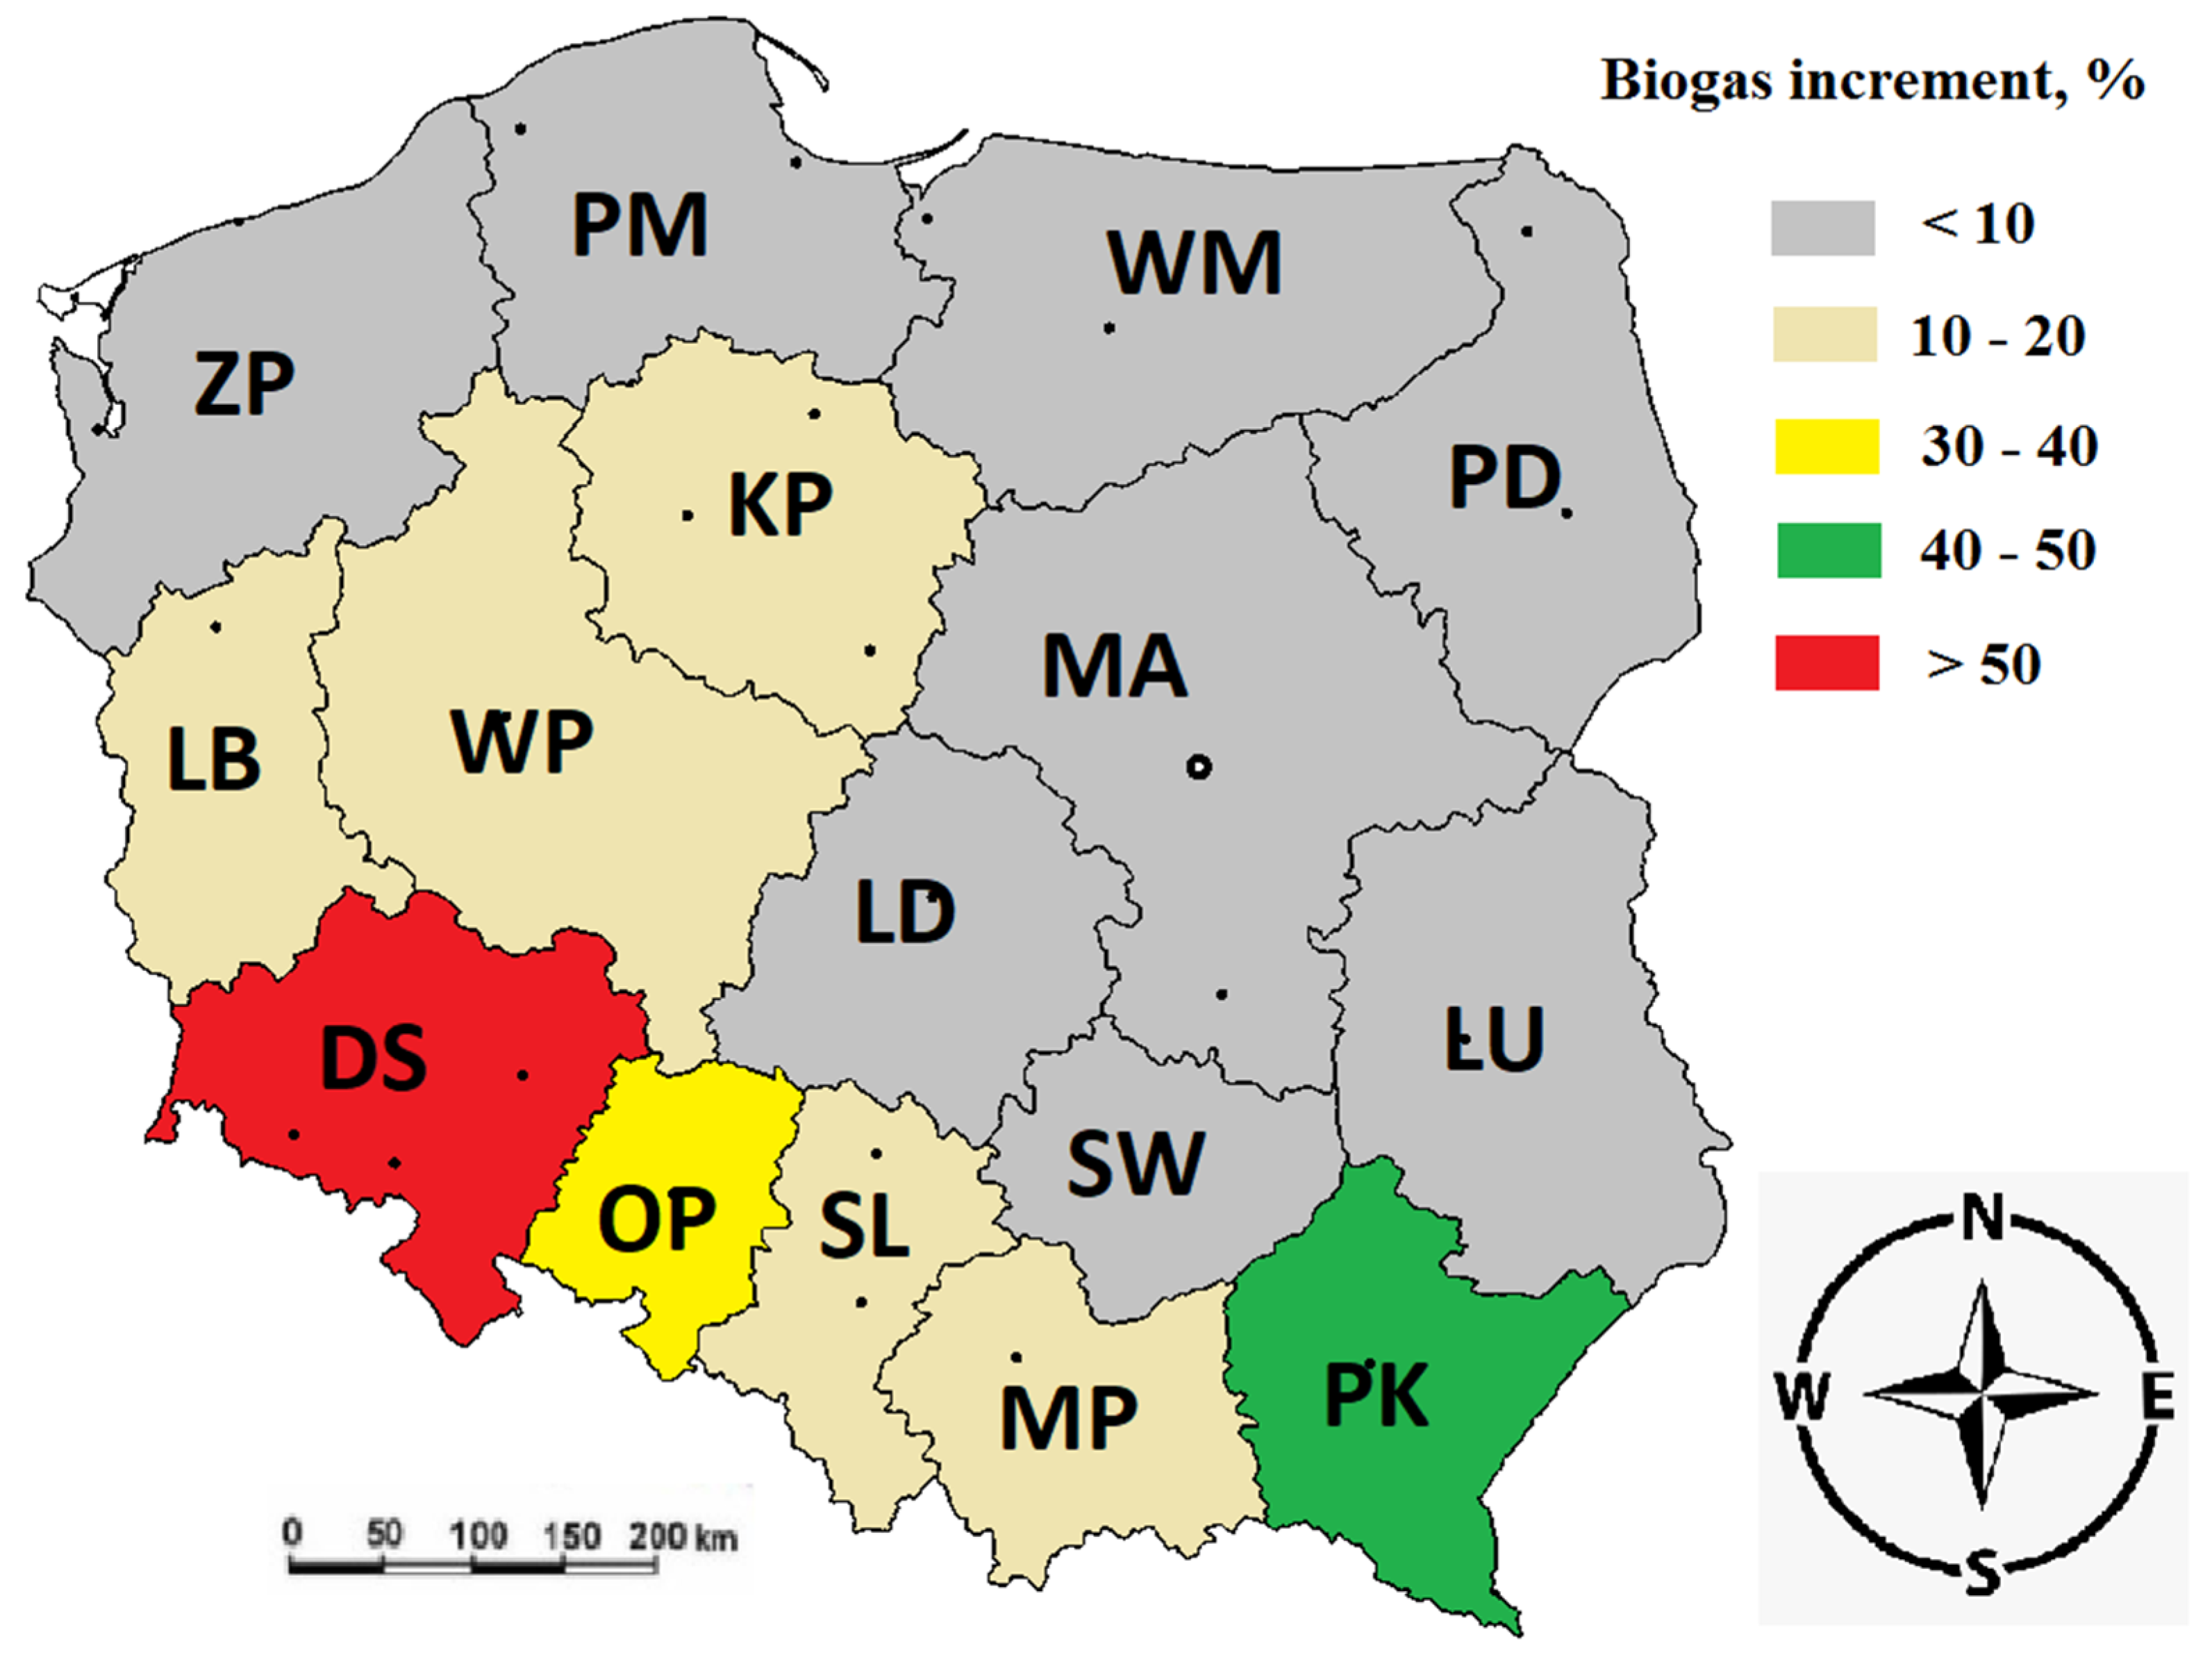
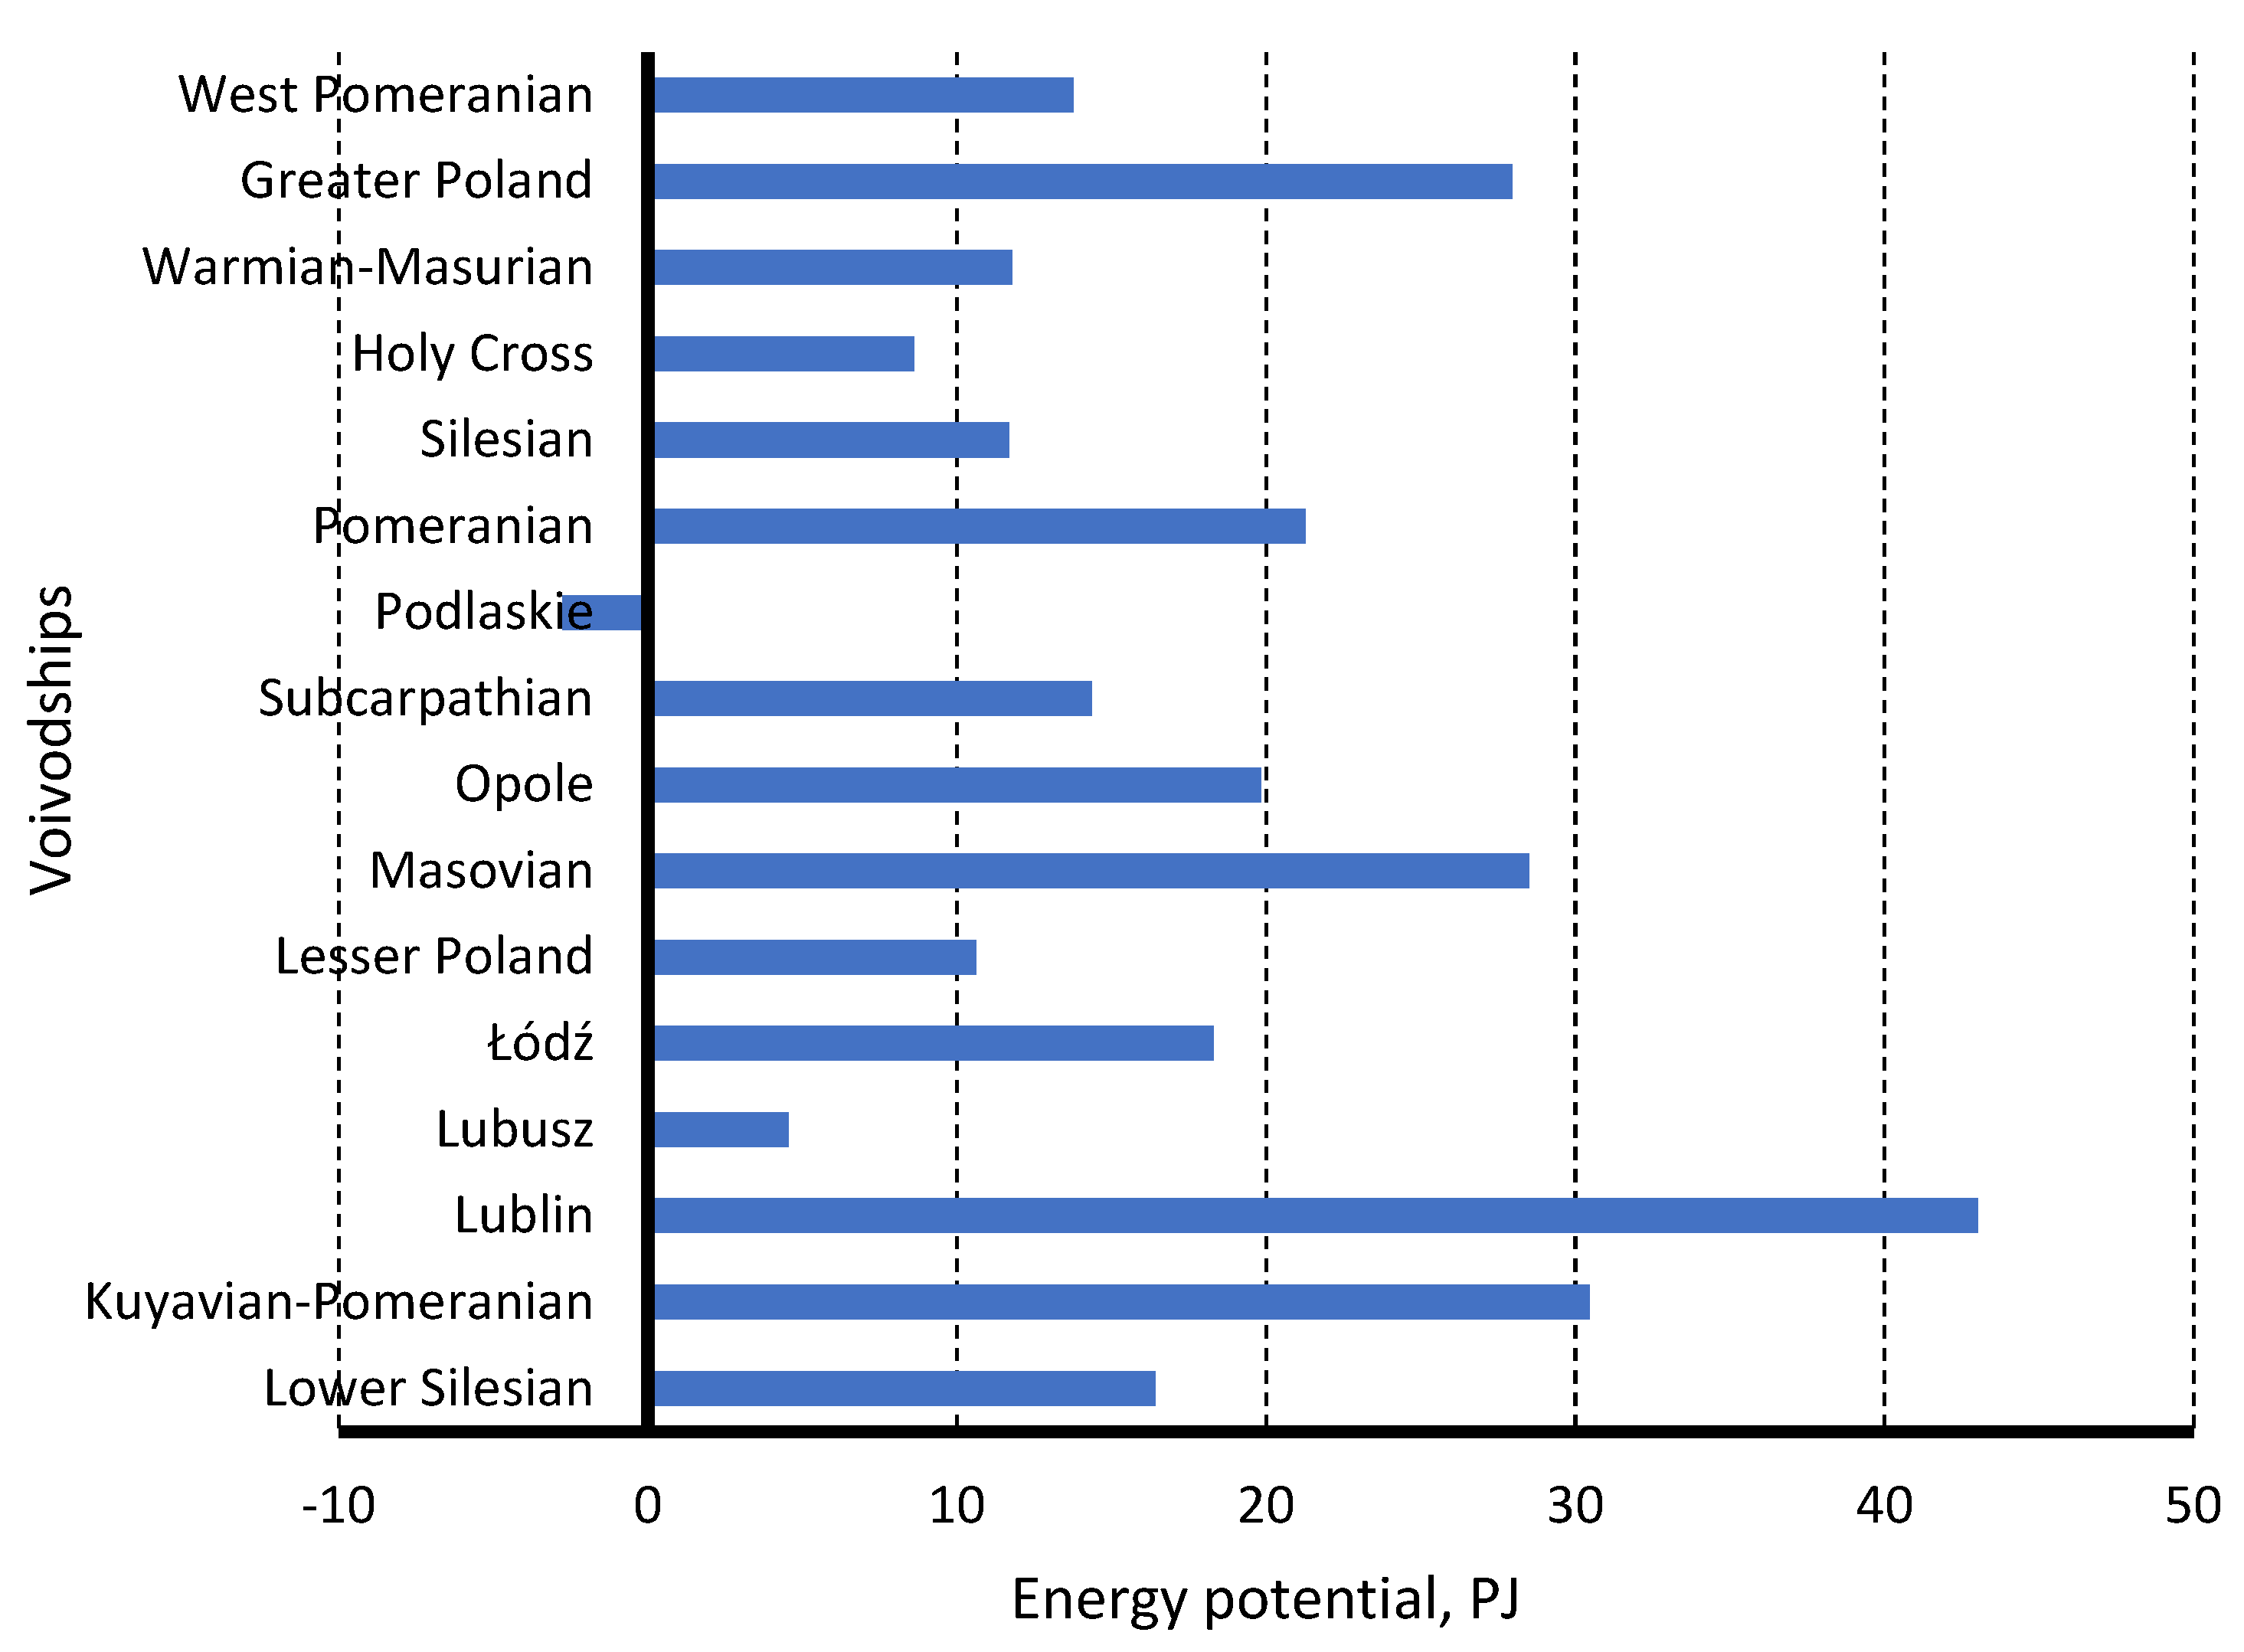
4.3. Sugar Beet Leaf Based Biogas Production

Maize silage is a valuable substrate for biogas production, but despite this, its acceptance in society is declining. The amendment to the German Renewable Energy Act has restricted its application [89]. Similar documents have been introduced in Poland [37]. Animal manure has high water content and its organic matter is not easily digestible. To improve this anaerobic process, easily digestible feedstock (organic matter) should be added [90,91,92]. Therefore, alternative substrates are currently being sought. According to studies, sugar beet and its by-product (leaves) are an acceptable co-substrate [93,94].
Fibre-rich feedstock like straw and silage have low biogas yields [95]. Their co-digestion with sugar beet or its leaves makes the digestion process easy. Moreover, this co-digestion process has advantages in terms of positive synergetic effects (increasing in a methane yield) [96,97].
In Poland sugar beet yield is increasing. It results in an increase in the gross harvest of sugar beet and its by-product (leaf) (Figure 6) [82]. Therefore, biogas industry can get from 2 to 3 Mt of leaves to be used as substrate. The use of this by-product can allow biogas plants to produce additionally from 87.8 to 158.5 million cubic meters of biomethane or from 3.16 to 5.71 PJ. It constitutes from 3.02 to 5.46% of the manure biogas energy potential. Thus, the total energy potential increases up to 279.94 PJ.
The total bioenergy potential (crop residues and manure) of voivodships is depicted in Figure 7. Greater Poland, Masovian, Lublin, and Kuyavian-Pomeranian are the top four voivodships, whose collectible biomass potential totaled 46.68% of national biomass resource potential. The demand of farmers in Podlaskie Voivodeship for straw (soil conservation, bedding and feed consumption for livestock) exceeds its production. As a result, the voivodeship has negative energy potential and is forced to import straw. The share of crop residues is the highest and constitutes 60.62%. Sugar beet leaves have the lowest value of 1.87% (Figure 8).
The use of agricultural residues for power and heat generation results in a reduction of carbon dioxide emissions. Its value is determined in the following subsection.

4.4. Carbon Dioxide Emission

This study is focused on carbon dioxide emissions. This emission is a result of power and heat generation based on hydrocarbon fuels burning. Crop residues (straw and sugar beet leaves) and manure are examined as feedstock for energy generation and substitution of fossil fuels. A decrease in carbon dioxide emissions is calculated by the Equation (6).
During 2011–2018, the shares of hard coal and lignite ranged from 88 to 94% in power generation. In the above period Poland consumed 796–908 PJ of hard coal and 466–539 PJ of lignite [98,99]. Their lower heating values ranged: from 21.072 to 21.673 MJ kg−1 for hard coal, and from 8.022 to 8.365 MJ kg−1 for lignite. A lower heating value of biomass is less compared to coal; therefore, biomass needs to be burned in more amount than coal to produce the same quantity of energy.
Our calculations indicate that one ton of straw (used for power or heat production) reduces carbon dioxide emission by 1417.8 kg for hard coal and 1578.15 kg for lignite. The theoretical potential of carbon dioxide emission reduced by straw utilization is around 13.91 Mt for hard coal and 15.72 Mt for lignite (Table 3).
Biogas can be used for both power generation and cogeneration. Cogeneration reduces the consumption of electricity and heat produced by coal based power and heat plants. It results in improving a carbon dioxide emission indicator and more effective than sole biogas based power generation (Table 3).

5. Conclusions

Power generation in Poland is based on the use of hard coal and lignite. Their burning results in significant carbon dioxide emissions. To reduce harmful emissions and to increase energy security, agricultural residues should be used.
One significant result is the evaluation of two types of energy potentials (straw and biogas). Poland agriculture generates abundant organic residue (crop and livestock), which an energy potential is around 279.94 PJ. This energy potential is a significant reserve for power generation. The share of livestock residues exceeds 39%. The use of livestock waste could increase the total energy potential of agricultural residues by 50–60%.
The second contribution is the identification of areas with considerable renewable energy potential. Masovian, Greater Poland, and Podlaskie voivodships are the best locations for biogas plants. Their biogas energy potential is 53.1 PJ.
The total power generation potential may be estimated at 26.6 TWh or 15.7% of the national electricity production. According to the cluster analysis, large-scale straw co-firing with coal is possible in the following voivodships: Lesser Poland, Lower Silesian, Opole, West Pomeranian, Łódź, Masovian, Silesian, Holy Cross, and Greater Poland. Their total energy potential was 89 PJ. It allows power plants to generate 8.9 TWh of electricity. The first four voivodships (Lesser Poland, Lower Silesian, Opole, and West Pomeranian) can produce 55.22% of the above energy. The rest of the voivodships (except Podlaskie) should develop autonomous power supply systems.
The third significant result is the evaluation of carbon dioxide emission saving, taking into account carbon dioxide emission associated with straw formation. The use of agricultural residues for power generation ensures the saving potential in the range from 25.75 to 33.52 Mt per year. The share of biogas plants could vary from 45 to 53%. The greatest reduction in carbon dioxide emissions occurs when straw and biogas substitute low-quality fossil solid fuels such as lignite. Biogas-based cogeneration plants have higher carbon dioxide saving potential.
The obtained results provide a scientific foundation for the transition of agriculture from a food producer to an energy supplier. They may be used for creating green power generation zones. Authorities and investors can use the above results when making decisions concerning environmentally clean power generation policy. For now, there are many risks caused by significant fluctuations in agricultural residue production, transportation costs, and energy prices, which negatively affect the attractiveness of environmentally clean power generation. The forecast of the above indicators will be carried out by application of the Polynomial Canonical Expansion of Random Sequences [100,101].

Author Contributions

Conceptualization, V.H. and A.K.; methodology, V.H., A.K., A.B., J.S.; software, A.B. validation, V.H.; formal analysis, A.K.; investigation, V.H., A.K.; resources, A.K.; writing—original draft preparation, V.H., A.K., A.B., J.S.; writing—review and editing, A.K., J.S.; funding acquisition, A.B. All authors have read and agreed to the published version of the manuscript.

Funding

This research received no external funding.

Institutional Review Board Statement

Not applicable.

Informed Consent Statement

Not applicable.

Data Availability Statement

Not applicable.

Conflicts of Interest

The authors declare no conflict of interest.

References

  1. Desai, B.G. CO2 emissions—Drivers across time and countries. Curr. Sci. 2018, 115, 386–387. Available online: https://www.currentscience.ac.in/Volumes/115/03/0386.pdf (accessed on 25 July 2020). [CrossRef]
  2. International Renewable Energy Agency (IRENA). Renewable Energy in Cities. 2016. Available online: https://www.irena.org/publications/2016/Oct/Renewable-Energy-in-Cities (accessed on 25 July 2020).
  3. Ik, M.; Azeez, A.A. Organisational green behavioural change: The role of Change Management. Int. J. Entrepren. Knowl. 2020, 8, 34–48. [Google Scholar] [CrossRef]
  4. Neverauskiene, L.O.; Rakauskiene, O.G. Identification of employment increasing possibilities in the context of the EU socioeconomic environment evaluation: The case of Lithuania. Econ. Sociol. 2018, 11, 51–68. [Google Scholar] [CrossRef]
  5. Dach, J.; Boniecki, P.; Przybył, J.; Janczak, D.; Lewicki, A.; Czekał, W.; Witaszek, K.; Carmona, P.C.R.; Cieślik, M. Energetic efficiency analysis of the agricultural biogas plant in 250 kW (e) experimental installation. Energy 2014, 69, 34–38. [Google Scholar] [CrossRef]
  6. Renewables Information: Overview. Statistics Report. 2020. Available online: https://nangs.org/analytics/download/5637_abbf6222a692d2f1cd08a730091475cc (accessed on 6 March 2021).
  7. Slade, R.; Bauen, A.; Gross, R. Global bioenergy resources. Nat. Clim. Chang. 2014, 4, 99–105. [Google Scholar] [CrossRef]
  8. IEA. Energy Technology Perspectives. 2014. Available online: https://www.iea.org/etp/etp2014 (accessed on 18 April 2020).
  9. Staples, M.; Malina, R.; Barrett, S. The limits of bioenergy for mitigating global life cycle greenhouse gas emissions from fossil fuels. Nat. Energy 2017, 2, 16202. [Google Scholar] [CrossRef]
  10. Bazzanella, A.M.; Ausfelder, F. Low Carbon Energy and Feedstock for the European Chemical Industry; Dechema: Frankfurt am Main, Germany, 2017; Available online: https://dechema.de/dechema_media/Downloads/Positionspapiere/Technology_study_Low_carbon_energy_and_feedstock_for_the_European_chemical_industry.pdf (accessed on 18 July 2020).
  11. Carus, M.; Dammer, L. The “Circular Bioeconomy”—Concepts, Opportunities, and Limitations. 2018. Available online: https://ec.europa.eu/knowledge4policy/publication/circular-bioeconomy-concepts-opportunities-limitations_en (accessed on 17 July 2020).
  12. Jong, S.; Stralen, J.; Londo, M.; Hoefnagels, R.; Faaij, A.; Junginger, M. Renewable jet fuel supply scenarios in the European Union in 2021-2030 in the context of proposed biofuel policy and competing biomass demand. GCB Bioenergy 2018, 10, 661–682. [Google Scholar] [CrossRef]
  13. Svazas, M.; Navickas, V.; Krajnakova, E.; Nakonieczny, J. Sustainable supply chain of the biomass cluster as a factor for preservation and enhancement of forests. J. Int. Stud. 2019, 12, 309–321. [Google Scholar] [CrossRef]
  14. Daioglou, V.; Doelman, J.C.; Wicke, B.; Faaij, A.; van Vuuren, D.P. Integrated assessment of biomass supply and demand in climate change mitigation scenarios. Glob. Environ. Chang. 2019, 54, 88–101. [Google Scholar] [CrossRef] [Green Version]
  15. Creutzig, F.; Ravindranath, N.H.; Berndes, G.; Bolwig, S.; Bright, R.; Cherubini, F.; Chum, H.; Corbera, E.; Delucchi, M.; Faaij, A.; et al. Bioenergy and climate change mitigation: An assessment. GCB Bioenergy 2015, 7, 916–944. [Google Scholar] [CrossRef] [Green Version]
  16. Kang, Y.; Yang, Q.; Bartocci, P.; Wei, H.; Liu, S.S.; Wu, Z.; Zhou, H.; Yang, H.; Fantozzi, F.; Chen, H. Bioenergy in China: Evaluation of domestic biomass resources and the associated greenhouse gas mitigation potentials. Renew. Sustain. Energy Rev. 2020, 127, 109842. [Google Scholar] [CrossRef]
  17. Stegmanna, P.; Londob, M.; Junginger, M. The circular bioeconomy: Its elements and role in European bioeconomy clusters. Resour. Conserv. Recycl. X 2020, 6, 100029. [Google Scholar] [CrossRef]
  18. Perea-Moreno, M.-A.; Samerón-Manzano, E.; Perea-Moreno, A.-J. Biomass as renewable energy: Worldwide research trends. Sustainability 2019, 11, 863. [Google Scholar] [CrossRef] [Green Version]
  19. Kalinichenko, A.; Havrysh, V.; Hruban, V. Heat recovery systems for agricultural vehicles: Utilization ways and their efficiency. Agriculture 2018, 8, 199. [Google Scholar] [CrossRef]
  20. European Commission. Innovating for Sustainable Growth: A Bioeconomy for Europe. Brussels. 2012. Available online: https://www.eea.europa.eu/policy-documents/innovating-for-sustainable-growth-a (accessed on 19 July 2020).
  21. Fund, C.; El-Chichakli, B.; Patermann, C. Bioeconomy Policy (Part III): Update Report of National Strategies around the World. Berlin. 2018. Available online: https://biooekonomierat.de/fileadmin/Publikationen/berichte/GBS_2018_Bioeconomy-Strategies-around-the_World_Part-III.pdf (accessed on 18 July 2020).
  22. Mezuláník, J.; Durda, L.; Civelek, M.; Malec, L. Ride-hailing vs. taxi services: A survey-based comparison. J. Tour. Serv. 2020, 20, 170–186. [Google Scholar] [CrossRef]
  23. Srovnalíková, P.; Semionovaitė, E.; Baranskaitė, E.; Labanauskaitė, D. Evaluation of the impact of sharing economy on hotel business. J. Tour. Serv. 2020, 20, 150–169. [Google Scholar] [CrossRef]
  24. Sansyzbayeva, G.; Temerbulatova, Z.; Zhidebekkyzy, A.; Ashirbekova, L. Evaluating the transition to green economy in Kazakhstan: A synthetic control approach. J. Int. Stud. 2020, 13, 324–341. [Google Scholar] [CrossRef]
  25. Brzozowska, A.; Bubel, D.; Kalinichenko, A.; Nekrasenko, L. Transformation of the agricultural financial system in the age of globalisation. Agric. Econ. 2017, 63, 548–558. [Google Scholar] [CrossRef] [Green Version]
  26. Eurostat. NACE Rev. 2 Statistical Classification of Economic Activities in the European Community; Eurostat Methodologies and Working Papers; Eurostat: Luxembourg, 2008; Available online: https://ec.europa.eu/eurostat/web/nace-rev2 (accessed on 24 July 2020).
  27. European Commission. COM/2015/0614 Final. Communication from the Commission to the European Parliament, the Council, the European Economic and Social Committee and the Committee of the Regions. Closing the Loop—An EU Action Plan for the Circular Economy; European Commission: Brussels, Belgium, 2015; Available online: https://eur-lex.europa.eu/legal-content/EN/TXT/?uri=CELEX:52015DC0614 (accessed on 24 July 2020).
  28. European Commission. COM 398 Final. Communication from the Commission to the European Parliament, the Council, the European Economic and Social Committee and the Committee of the Regions. Towards a Circular Economy: A Zero Waste Programme for Europe; European Commission: Brussels, Belgium, 2014; Available online: https://eur-lex.europa.eu/resource.html?uri=cellar:50edd1fd-01ec-11e4-831f-01aa75ed71a1.0001.01/DOC_1&format=PDF (accessed on 24 July 2020).
  29. European Commission. Roadmap. Update of the 2012 Bioeconomy Strategy; European Commission: Brussels, Belgium, 2018; Available online: https://ec.europa.eu/info/law/better-regulation/have-your-say/initiatives/1599-Update-of-the-2012-Bioeconomy-Strategy (accessed on 20 June 2020).
  30. Ronzon, T.; M’Barek, R. Socioeconomic indicators to monitor the EU’s bioeconomy in transition. Sustainability 2018, 10, 1745. [Google Scholar] [CrossRef] [Green Version]
  31. Energy Statistics in 2017 and 2018. Statistics Poland. Warsaw; 2019. Available online: https://stat.gov.pl/en/topics/environment-energy/ (accessed on 6 June 2020).
  32. Renewable Energy in Poland. Flanders Investment & Trade in Poznan. Poland. June 2019. Available online: https://www.flandersinvestmentandtrade.com/export/sites/trade/files/market_studies/2019-Poland-Renewable_Energy.pdf (accessed on 24 July 2020).
  33. Energy Law Act. 10 April 1997. Available online: https://www.ure.gov.pl/download/2/2/Law.pdf (accessed on 24 July 2020).
  34. National Renewable Energy Action Plans; Ministry of Economy: Warsaw, Poland, 2010. Available online: https://www.ebb-eu.org/legis/ActionPlanDirective2009_28/national_renewable_energy_action_plan_poland_pl.pdf (accessed on 26 July 2020). (In Polish)
  35. National Energy Efficiency Action Plan for Poland; Ministry of Economy: Warsaw, Poland, 2014. Available online: https://ec.europa.eu/energy/sites/ener/files/documents/NEEAP_Poland_ENG_2014.pdf (accessed on 26 July 2020).
  36. Energy Policy of Poland until 2030: Appendix to Resolution No. 202/2009 of the Council of Ministers of 10 November 2009; Ministry of Economy: Warsaw, Poland, 2009. Available online: https://www.lse.ac.uk/GranthamInstitute/wp-content/uploads/laws/1564%20English.pdf (accessed on 26 July 2020).
  37. Law of Agricultural and Forest Land Protection. Act No 16 Item 78; The Polish Parliament: Warsaw, Poland, 1995. Available online: http://isap.sejm.gov.pl/isap.nsf/DocDetails.xsp?id=WDU19950160078 (accessed on 26 July 2020). (In Polish)
  38. Havrysh, V.; Kalinichenko, A.; Minkova, O.; Lyashenko, S. Agricultural feedstock for solid and liquid biofuel production in Ukraine: Cluster analysis. Proc. Environ. Sci. Eng. Manag. 2019, 6, 649–658. Available online: http://procedia-esem.eu/pdf/issues/2019/no4/73_Havrysh_19.pdf (accessed on 29 July 2020).
  39. Havrysh, V.; Kalinichenko, A.; Brzozowska, A.; Stebila, J. Life cycle energy consumption and carbon dioxide emissions of agricultural residue feedstock for bioenergy. Appl. Sci. 2021, 11, 2009. [Google Scholar] [CrossRef]
  40. Hrabec, D.; Kůdela, J.; Šomplák, R.; Nevrlý, V.; Popela, P. Circular economy implementation in waste management network design problem: A case study. Cent. Eur. J. Oper. Res. 2020, 28, 1441–1458. [Google Scholar] [CrossRef]
  41. Hrabec, D.; Šomplák, R.; Nevrlý, V.; Viktorin, A.; Pluháček, M.; Popela, P. Sustainable waste-to-energy facility location: Influence of demand on energy sales. Energy 2020, 207, 118257. [Google Scholar] [CrossRef]
  42. Brezina, I.; Dupal, A.; Pekar, J. Green and reverse logistics as streamlining instrument of waste combustion in Slovak Republic. Ekon. Casopis 2011, 59, 132–147. Available online: https://www.sav.sk/?lang=en&doc=journal-list&part=article_response_page&journal_article_no=6689 (accessed on 16 June 2021).
  43. Cyranka, M.; Jurczyk, M.; Pająk, T. Municipal waste-to-energy plants in Poland—Current projects. Proc. E3S Web Conf. 2016, 10, 00070. [Google Scholar] [CrossRef] [Green Version]
  44. Navickas, V.; Vojtovic, S.; Svazas, M. Biomass clusters influence on business competitiveness. Pol. J. Manag. Stud. 2017, 16, 188–197. [Google Scholar] [CrossRef]
  45. Lowitzsch, J.; Hoicka, C.E.; van Tulder, F.J. Renewable energy communities under the 2019 European Clean Energy Package—Governance model for the energy clusters of the future? Renew. Sustain. Energy Rev. 2020, 122, 109489. [Google Scholar] [CrossRef]
  46. Directive (EU) 2018/2001 of the European Parliament and of the Council of 11 December 2018 on the Promotion of the Use of Energy from Renewable Sources (Recast). Off. J. Eur. Union 2018, L 328, 82–209. Available online: https://eur-lex.europa.eu/legal-content/EN/TXT/PDF/?uri=CELEX:32018L2001&from=EN (accessed on 24 July 2020).
  47. Directive (EU) 2019/944 of the European Parliament and of the Council of 5 June 2019 on Common Rules for the Internal Market for Electricity and Amending Directive 2012/27/EU (Recast). Off. J. Eur. Union 2019, L 158, 125–199. Available online: https://eur-lex.europa.eu/legal-content/EN/TXT/PDF/?uri=CELEX:32019L0944&from=EN (accessed on 24 July 2020).
  48. Regulation (EU) 2019/943 of the European Parliament and of the Council 5 June 2019 on the Internal Market for Electricity (Recast). Off. J. Eur. Union 2019, 158, 54–124. Available online: https://eur-lex.europa.eu/legal-content/EN/TXT/PDF/?uri=CELEX:32019R0943&from=EN (accessed on 24 July 2020).
  49. Camargo, R.L.; Gruber, K.; Nitsch, F.; Dorner, W. Hybrid renewable energy systems to supply electricity self-sufficient residential buildings in Central Europe. Energy Procedia 2019, 158, 321–326. [Google Scholar] [CrossRef]
  50. Mancarella, P. MES (multi-energy systems): An overview of concepts and evaluation models. Energy 2014, 65, 1–17. [Google Scholar] [CrossRef]
  51. Kyriakarakos, G.; Piromalis, D.D.; Dounis, A.I.; Arvanitis, K.G.; Papadakis, G. Intelligent demand side energy management system for autonomous polygeneration microgrids. Appl. Energy 2013, 103, 39–51. [Google Scholar] [CrossRef]
  52. Bracco, S.; Delfino, F.; Ferro, G.; Pagnini, L.; Robba, M.; Rossi, M. Energy planning of sustainable districts: Towards the exploitation of small size intermittent renewables in urban areas. Appl. Energy 2018, 228, 2288–2297. [Google Scholar] [CrossRef]
  53. McCauley, S.M.; Stephens, J.C. Green energy clusters and socio-technical transitions: Analysis of a sustainable energy cluster for regional economic development in Central Massachusetts, USA. Sustain. Sci. 2012, 7, 213–225. [Google Scholar] [CrossRef]
  54. Wiktor-Sułkowska, A. Do the Polish energy clusters have a chance to become units independent from external energy supplies and can they operate as self-financing bodies? J Pol. Miner. Eng. Soc. 2018, 20, 123–128. [Google Scholar] [CrossRef]
  55. Baum, R.; Wajszczuk, K.; Pepliński, B.; Wawrzynowicz, J. Potential for agricultural biomass production for energy purposes in Poland: A review. Contemp. Econ. 2013, 7, 63–74. [Google Scholar] [CrossRef] [Green Version]
  56. Einarsson, R.; Persson, U.M. Analyzing key constraints to biogas production from crop residues and manure in the EU-A spatially explicit model. PLoS ONE 2017, 12, e0171001. [Google Scholar] [CrossRef] [Green Version]
  57. Zubaryeva, A.; Zaccarelli, N.; Del Giudice, C.; Zurlini, G. Spatially explicit assessment of local biomass availability for distributed biogas production via anaerobic co-digestion—Mediterranean case study. Renew. Energy 2012, 39, 261–270. [Google Scholar] [CrossRef]
  58. Ericsson, K.; Rosenqvist, H.; Ganko, E.; Pisarek, M.; Nilsson, L. An agro-economic analysis of willow cultivation in Poland. Biomass Bioenergy 2006, 30, 16–27. [Google Scholar] [CrossRef]
  59. Kuś, J.; Faber, A. Alternative directions in agricultural production (Alternatywne kierunki produkcji rolniczej). Studia Rap. IUNG-PIB 2007, 7, 139–149. Available online: http://www.iung.pulawy.pl/index.php?option=com_content&view=article&id=123&Itemid=67&limitstart=1 (accessed on 26 July 2020).
  60. Kamran, M. Current status and future success of renewable energy in Pakistan. Renew. Sustain. Energy Rev. 2018, 82, 609–617. [Google Scholar] [CrossRef]
  61. Stefanelli, R.D.; Walker, C.; Kornelsen, D.; Lewis, D.; Martin, D.H.; Masuda, J.; Castleden, H. Renewable energy and energy autonomy: How Indigenous peoples in Canada are shaping an energy future. Environ. Rev. 2019, 27, 95–105. [Google Scholar] [CrossRef]
  62. Burke, M.J.; Stephens, J.C. Political power and renewable energy futures: A critical review. Energy Res. Soc. Sci. 2018, 35, 78–93. [Google Scholar] [CrossRef]
  63. Blazquez, J.; Fuentes-Bracamontes, R.; Bollino, C.A.; Nezamuddin, N. The renewable energy policy Paradox. Renew. Sustain. Energy Rev. 2018, 82, 1–5. [Google Scholar] [CrossRef]
  64. Shah, I.H.; Hiles, C.; Morley, B. How do oil prices, macroeconomic factors and policies affect the market for renewable energy? Appl. Energy 2018, 215, 87–97. [Google Scholar] [CrossRef] [Green Version]
  65. Simionescu, M.; Strielkowski, W.; Tvaronavičiene, M. Renewable energy in final energy consumption and income in the EU-28 countries. Energies 2020, 13, 2280. [Google Scholar] [CrossRef]
  66. Zaliwski, A.S.; Faber, A.; Pudełko, R.; Biberacher, M.; Gadocha, S. Biomass supply for co-firing in main-network power stations in Poland. J. Food Agric. Environ. 2013, 11, 2031–2035. Available online: https://www.academia.edu/27427673/Biomass_supply_for_co_firing_in_main_network_power_stations_in_Poland (accessed on 26 July 2020).
  67. Rozakis, S.; Kremmydas, D.; Pudełko, R.; Borzęcka-Walker, M.; Faber, A. Straw potential for energy purposes in Poland and optimal allocation to major co-firing power plants. Biomass Bioenergy 2013, 58, 275–285. [Google Scholar] [CrossRef]
  68. Varga, I.; Lončarić, Z.; Pospišil, M.; Rastija, M.; Antunović, M. Dynamics of sugar beet root, crown and leaves mass with regard to plant densities and spring nitrogen fertilization. Poljoprivreda 2020, 26, 32–39. [Google Scholar] [CrossRef]
  69. Jelić, S.; Antunović, M.; Kristek, A.; Varga, I. Variranje težinskog odnosa mase lista i korijena tijekom vegetacije šećerne repe pri različitim gustoćama sjetve. Pospišil M. (ur.). In Proceedings of the 50th Croatian and 10th International Symposium on Agriculture, Opatija, Croatia, 16–20 February 2015; Faculty of Agriculture in Zagreb, University of Zagreb: Zagreb, Croatia, 2015; pp. 309–313. Available online: http://sa.agr.hr/pdf/2015/sa2015_p0503.pdf (accessed on 21 July 2020).
  70. Pospišil, M.; Brčić, M.; Pospišil, A.; Butorac, J.; Tot, I.; Žeravica, A. Root yield and quality of investigated sugar beet hybrids in northwest Croatia in the period from 2010 to 2013. Poljoprivreda 2016, 22, 10–16. [Google Scholar] [CrossRef]
  71. IRENA. Renewable Power Generation Costs in 2014. Available online: https://www.irena.org/documentdownloads/publications/irena_re_power_costs_2014_report.pdf (accessed on 29 July 2020).
  72. Statistics Poland. Statistical Yearbook of Agriculture, Warsaw. 2018. Available online: https://stat.gov.pl/en/topics/statistical-yearbooks/statistical-yearbooks/statistical-yearbook-of-agriculture-2018,%206,%2013.html (accessed on 6 June 2020).
  73. Angelis-Dimakis, A.; Biberacher, M.; Dominguez, J.; Fiorese, G.; Gadocha, S.; Gnansounou, E.; Guariso, G.; Kartalidis, A.; Panichelli, L.; Pinedo, I.; et al. Methods and tools to evaluate the availability of renewable energy sources. Renew. Sustain. Energy Rev. 2011, 15, 1182–1200. [Google Scholar] [CrossRef]
  74. Batzias, F.A.; Sidiras, D.K.; Spyrou, E.K. Evaluating livestock manures for biogas production: A GIS based method. Renew. Energy 2005, 30, 1161–1176. [Google Scholar] [CrossRef]
  75. Monteiro, E.; Mantha, V.; Rouboa, A. Prospective application of farm cattle manure for bioenergy production in Portugal. Renew. Energy 2011, 36, 627–631. [Google Scholar] [CrossRef]
  76. Scarlat, N.; Fahl, F.; Dallemand, J.-F.; Monforti, F.; Motola, V. A spatial analysis of biogas potential from manure in Europe. Renew. Sustain. Energy Rev. 2018, 94, 915–930. [Google Scholar] [CrossRef]
  77. Wellinger, A.; Murphy, J.; Baxter, D. (Eds.) The Biogas Handbook. Science, Production and Applications; Woodhead Publishing Limited: Cambridge, UK, 2013; ISBN 9780857094988. [Google Scholar]
  78. Mazurkiewicz, J.; Marczuk, A.; Pochwatka, P.; Kujawa, S. Maize straw as a valuable energetic material for biogas plant feeding. Materials 2019, 12, 3848. [Google Scholar] [CrossRef] [Green Version]
  79. Starke, P.; Hoffmann, C.M. Yield parameters of Beta beets as a basis to estimate the biogas yield. Sugar Ind. 2014, 139, 169–176. [Google Scholar] [CrossRef]
  80. Bazaluk, O.; Havrysh, V.; Nitsenko, V.; Baležentis, T.; Streimikiene, D.; Tarkhanova, E.A. Assessment of green methanol production potential and related economic and environmental benefits: The case of China. Energies 2020, 13, 3113. [Google Scholar] [CrossRef]
  81. The National Center for Emissions Management. Institute of Environmental Protection—National Research Institute, Poland’s National Inventory Report. Greenhouse Gas Inventory for 1988–2017. 2019. Available online: https://www.kobize.pl/uploads/materialy/materialy_do_pobrania/krajowa_inwentaryzacja_emisji/NIR_POL_2019_23.05.2019.pdf (accessed on 30 June 2020).
  82. Bank Danych Lokalnych, Główny Urząd Statystyczny. Available online: https://bdl.stat.gov.pl/BDL/dane/podgrup/temat (accessed on 6 June 2020).
  83. Mo, Z.; Pilarski, K. Preliminary comparison of biogas productivity from maize silage and maize straw silage. J. Res. Appl. Agric. Eng. 2011, 56, 108–110. Available online: https://yadda.icm.edu.pl/baztech/element/bwmeta1.element.baztech-article-BAR8-0012-0023 (accessed on 20 June 2020).
  84. Dankevych, L.; Leonova, N.; Dragovoz, I.; Patyka, V.; Kalinichenko, A.; Wlodarczyk, P.; Wlodarczyk, B. The synthesis of plant growth stimulators by phytopathogenic bacteria as factor of pathogenicity. Appl. Ecol. Environ. Res. 2018, 16, 1581–1593. [Google Scholar] [CrossRef]
  85. Przybył, J.; Wojcieszak, D.; Mioduszewska, N.; Durczak, K. Biogas yield of maize straw. Agric. Eng. 2013, 4, 103–111. Available online: http://ir.ptir.org/artykuly/en/148/IR(148)_3522_en.pdf (accessed on 20 June 2020).
  86. Sun, H.; Cui, X.; Stinner, W.; Shah, G.M.; Cheng, H.; Shan, S.; Guo, J.; Dong, R. Synergetic effect of combined ensiling of freshly harvested and excessively wilted maize stover for efficient biogas production. Bioresour. Technol. 2019, 285, 121338. [Google Scholar] [CrossRef] [PubMed]
  87. Yu, Q.; Liu, R.; Li, K.; Ma, R. A review of crop straw pretreatment methods for biogas production by anaerobic digestion in China. Renew. Sustain. Energy Rev. 2019, 107, 51–58. [Google Scholar] [CrossRef]
  88. Zhang, Q.; Hu, J.; Lee, D.J. Biogas from anaerobic digestion processes: Research updates. Renew. Energy 2016, 98, 108–119. [Google Scholar] [CrossRef]
  89. Bundesministerium der Justiz: Gesetz für den Vorrang erneuerbarer Energien (Erneuerbare-Energien-Gesetz—EEG). 2012. Available online: https://www.wind-energie.de/fileadmin/redaktion/dokumente/formalien-oeffentlich/themen/04-politische-arbeit/eeg2012-juris-120817.pdf (accessed on 20 June 2020).
  90. Holm-Nielsen, J.B.; Seadi, T.; Oleskowicz-Popiel, P. The future of anaerobic digestion and biogas utilization. Bioresour. Technol. 2009, 100, 5478–5484. [Google Scholar] [CrossRef]
  91. Abouelenien, F.; Namba, Y.; Kosseva, M.R.; Nishio, N.; Nakashimada, Y. Enhancement of methane production from co-digestion of chicken manure with agricultural wastes. Bioresour. Technol. 2014, 159, 80–87. [Google Scholar] [CrossRef]
  92. Vazifehkhoran, A.H.; Triolo, J.M.; Larsen, S.U.; Stefanek, K.; Sommer, S.G. Assessment of the variability of biogas production from sugar beet silage as affected by movement and loss of the produced alcohols and organic acids. Energies 2016, 9, 368. [Google Scholar] [CrossRef] [Green Version]
  93. Brooks, L.; Parravicini, V.; Svardal, K.; Kroiss, H.; Prendl, L. Biogas from sugar beet press pulp as substitute of fossil fuel in sugar beet factories. Water Sci. Technol. 2008, 58, 1497–1504. [Google Scholar] [CrossRef]
  94. Umetsu, K.; Yamazaki, S.; Kishimoto, T.; Takahashi, J.; Shibata, Y.; Zhang, C.; Misaki, T.; Hamamoto, O.; Ihara, I.; Komiyama, M. Anaerobic co-digestion of dairy manure and sugar beets. Int. Congr. Ser. 2006, 1293, 307–310. [Google Scholar] [CrossRef]
  95. Hensgen, F.; Bühle, L.; Donnisonm, I.; Heinsoo, K.; Wachendorf, M. Energetic conversion of European semi-natural grassland silages through the integrated generation of solid fuel and biogas from biomass: Energy yields and the fate of organic compounds. Bioresour. Technol. 2014, 154, 192–200. [Google Scholar] [CrossRef]
  96. Ahmed, S.; Einfalt, D.; Kazda, M. Co-digestion of sugar beet silage increases biogas yield from fibrous substrates. BioMed Res. Intern. 2016, 2016, 2147513. [Google Scholar] [CrossRef] [PubMed] [Green Version]
  97. Böttcher, R.; Smieszek, M.; Stollberg, C.; Gerath, H. Biogas production by co-fermentation of fodder and sugar beet as part of a holistic energy concept in a new greenhouse generation. Agric. Eng. 2013, 45, 28–32. Available online: http://ageng.asu.lt/ae/article/view/16 (accessed on 29 June 2020).
  98. Nyga-Łukaszewska, H.; Aruga, K.; Stala-Szlugaj, K. Energy security of Poland and coal supply: Price analysis. Sustainability 2020, 12, 2541. [Google Scholar] [CrossRef] [Green Version]
  99. Statista, Coal Prices in Poland (PSCMI1 Index) and Worldwide (APA Index) from 2011 to 2019. 2020. Available online: https://www.statista.com/statistics/1124875/poland-coal-prices/ (accessed on 29 July 2020).
  100. Atamanyuk, I.; Havrysh, V.; Shebanin, V.; Volosyuk, Y.; Kondratenko, Y.; Sheptylevskyi, O. Algorithm of pre-whitening on the basis of the polynomial canonical expansion of random sequences. In Proceedings of the 2020 IEEE 15th International Conference on Advanced Trends in Radioelectronics, Telecommunications and Computer Engineering (TCSET), Lviv-Slavske, Ukraine, 25–29 February 2020; pp. 107–112. [Google Scholar] [CrossRef]
  101. Atamanyuk, I.P. Algorithm of extrapolation of a nonlinear random process on the basis of its canonical decomposition. Cybern Syst. Anal. 2005, 41, 267–273. [Google Scholar] [CrossRef]
Figure 1. Renewable electricity generation.
Applsci 11 05907 g001
Figure 2. Total cereal production.
Applsci 11 05907 g002
Figure 3. Animal population history.
Applsci 11 05907 g003
Figure 4. Increment of biogas production: DS—Lower Silesian; KP—Kuyavian-Pomeranian; LU—Lublin; LB—Lubusz; LD—Łódź; MP—Lesser Poland; MA—Masovian; OP—Opole; PK—Subcarpatian; PD—Podlaskie; PM—Pomeranian; SL—Silesian; SW—Holy Cross; WM—Warmian-Masurian; WP—Greater Poland; ZP—West Pomeranian.
Applsci 11 05907 g004
Figure 5. Dendrogram of crop and livestock residues energy potential distribution (2018).
Applsci 11 05907 g005
Figure 6. Sugar beet and its leaf yield and production history.
Applsci 11 05907 g006
Figure 7. Voivodship bioenergy potential in 2018.
Applsci 11 05907 g007
Figure 8. Structure of energy potential, %.
Applsci 11 05907 g008
Table 1. Average, minimum and maximum grain crop harvests over the past 20 years, Mt (from 1999 to 2018).
CropAverageMaximumMinimum
Wheat9.4611.677.06
Triticale4.035.341.90
Rye3.164.862.01
Cereals mixed for grain3.404.322.25
Oats1.331.521.03
Barley3.404.162.78
Corn2.874.471.26
Total27.0531.7921.34
Table 2. Energy potential by clusters (crop residues and manure biogas), PJ (2018).
GroupVoivodshipSumShare of Biomass,%AverageMinimumMaximum
ALublin42.15-42.1542.1542.15
BKuyavian-Pomeranian, Masovian, Greater Poland84.53-28.1826.9729.48
CŁódź, Opole, Pomeranian58.63-19.5418.1721.02
DLower Silesian, Subcarpathian, West Pomeranian, Lesser Poland, Warmian-Masurian, Silesian, Holy Cross86.18-12.318.5115.95
ELubusz4.52-4.524.524.52
FPodlaskie−2.77-−2.77−2.77−2.77
Total 273.2361.7717.08−2.7742.15
Table 3. A decrease in carbon dioxide emission.
ParameterUnitHard CoalLignite
Initial data
Carbon dioxide emission factorkg GJ−194.52105.21
Carbon dioxide emission factor associated with straw formationkgCO2⋅GJ−112.1
Total annual consumption for power and heat productionPJ867.00466.00
Straw-based power generation
Volume of fossil fuel substituted by one ton of strawt0.711.84
Carbon dioxide emission reduced, kg per ton of strawkg t−11417.801578.15
Theoretical energy potential of strawPJ168.78168.78
Theoretical share of fossil fuel substituted%19.4736.22
Theoretical potential of carbon dioxide emission reducedMt year−113.9115.72
Biogas-based power generation
Volume of fossil fuel substituted by one 1000 cubic meters of biogast1.142.94
Carbon dioxide emission reduced, kg per m3 of biogaskg t −12268.482525.04
Theoretical energy potential of biogasPJ109.64109.64
Theoretical share of fossil fuel substituted%12.6523.53
Theoretical potential of carbon dioxide emission reduced (power generation only)Mt year−111.8413.18
Theoretical potential of carbon dioxide emission reduced (cogeneration)Mt year−115.9917.800
Total straw and biogas
Theoretical energy potentialPJ278.42
Theoretical potential of carbon dioxide emission saving (biogas for power generation only)Mt year−125.7528.90
Theoretical potential of carbon dioxide emission saving (biogas for cogeneration)Mt year−129.9033.52
Publisher’s Note: MDPI stays neutral with regard to jurisdictional claims in published maps and institutional affiliations.

