Article

Experimental Study of Coflow Propane—Air Laminar Diffusion Flames at Subatmospheric Pressures

1
School of Materials Engineering, Changshu Institute of Technology, Changshu 215500, China
2
College of Ocean Science and Engineering, Shanghai Maritime University, Shanghai 201306, China
3
State Key Laboratory of Fire Science, University of Science and Technology of China, Hefei 230026, China
*
Author to whom correspondence should be addressed.
Appl. Sci. 2021, 11(13), 5979; https://doi.org/10.3390/app11135979
Submission received: 27 May 2021 / Revised: 19 June 2021 / Accepted: 24 June 2021 / Published: 27 June 2021
(This article belongs to the Section Energy Science and Technology)

Abstract

:
The effect of pressure on the flame’s physical structure and soot formation of the coflow propane—air laminar diffusion flames was studied experimentally at subatmospheric pressures from 30 to 101 kPa. Flames with a constant fuel mass flow rate combined with two different coflow air mass flow rates were investigated at different pressures. The spatially resolved relative soot volume fraction was measured using the laser-induced incandescence (LII) method. The height of the visible flame decreased moderately as the pressure (p) reduced from 101 to 30 kPa. The maximum flame diameter increased proportionally to p n , where the exponent changed from −0.4 to −0.52 as the air-to-fuel velocity ratio decreased from 1.0 to 0.5. Strong pressure dependence of the maximum relative soot volume fraction and the normalized maximum soot mass flow were observed and could be described by a power law relationship. However, a nonmonotonic dependence of soot formation on the air-to-fuel velocity ratio was observed at all the considered pressures.

1. Introduction

Soot formation within flames is an important factor that impacts practical combustion systems as well as unwanted fires. Soot particles associated with strong radiation energy affects the performance and durability of combustion equipment and promote fire spread. Soot emissions from the combustion of fuels and fires have been widely recognized as hazards to the environment and human health [1,2]. Fully understanding the mechanism of soot formation in flames is critical to predict and control soot emissions in combustion devices and fires.
As an important environmental condition, the pressure effects on soot formation are of significance [3,4]. Numerous experimental and numerical studies have been conducted on laminar diffusion flames at various pressures. Laminar diffusion flames are widely adopted in the studies of soot formation for the reasons of reliability and relative ease of use in spatial and temporal measurements. In this study, the soot volume fraction ( f v ) was measured to evaluate the pressure effect on soot formation. Power law relationships have generally been observed between pressure and f v . Flower and Bowman studied coflow ethylene–air laminar diffusion flames at pressures from 1 to 10 atm and observed that the maximum integrated soot volume fraction is proportional to p n , where n is 1.2 ± 0.1. An almost identical result was reported by McCrain and Roberts at pressures up to 16 atm. Gülder et al. continued studying the flames fueled by simple aliphatic fuels such as methane [5,6], ethane [7] and propane [8] at elevated pressures and showed that the exponent in the pressure scaling law between the maximum integrated soot volume fraction and pressure changes at different pressure ranges. The exponent decreases at higher pressure ranges for all kinds of fuels. The exponent is also influenced by the fuel type, and fuels with larger molecular weight (M) are more sensitive to pressure. Commodo et al. employed the Raman spectroscopy method to investigate the soot originating from the ethylene laminar diffusion flames in the pressure range from 1 to ca. 12 bar and found that soot maturity increases with pressure [9]. Based on serial measurements [10], a universal empirical equation was presented to describe the dependence between the maximum soot yield and pressure. Mi et al. studied soot formation using a time-resolved LII method and found a relationship between the measured soot diameter and pressure [11]. Except for the flames of pure fuel, the flames of the fuel diluted with nitrogen or carbon dioxide were measured [12,13], and it was found that carbon dioxide and nitrogen can suppress soot formation at atmospheric and higher pressures. Most of the studies investigating the pressure effects on soot formation were conducted at pressures higher than the atmospheric pressure; studies at subatmospheric pressures are not frequently observed [14,15,16]. Soot formation study at low pressures is important to understand the combustion processes at high altitudes [17,18,19].
In this study, soot formation at low pressures ranging from 30 to 100 kPa was examined for coflow propane–air laminar diffusion flames. Two different air-to-fuel velocity ratios were investigated to observe their influence on the sooting tendency. Propane was selected to mimic large-molecule hydrocarbons. Two-dimensional (2D) distributions of the relative soot volume fraction were measured using laser-induced incandescence (LII) [20].

2. Experimental Apparatus

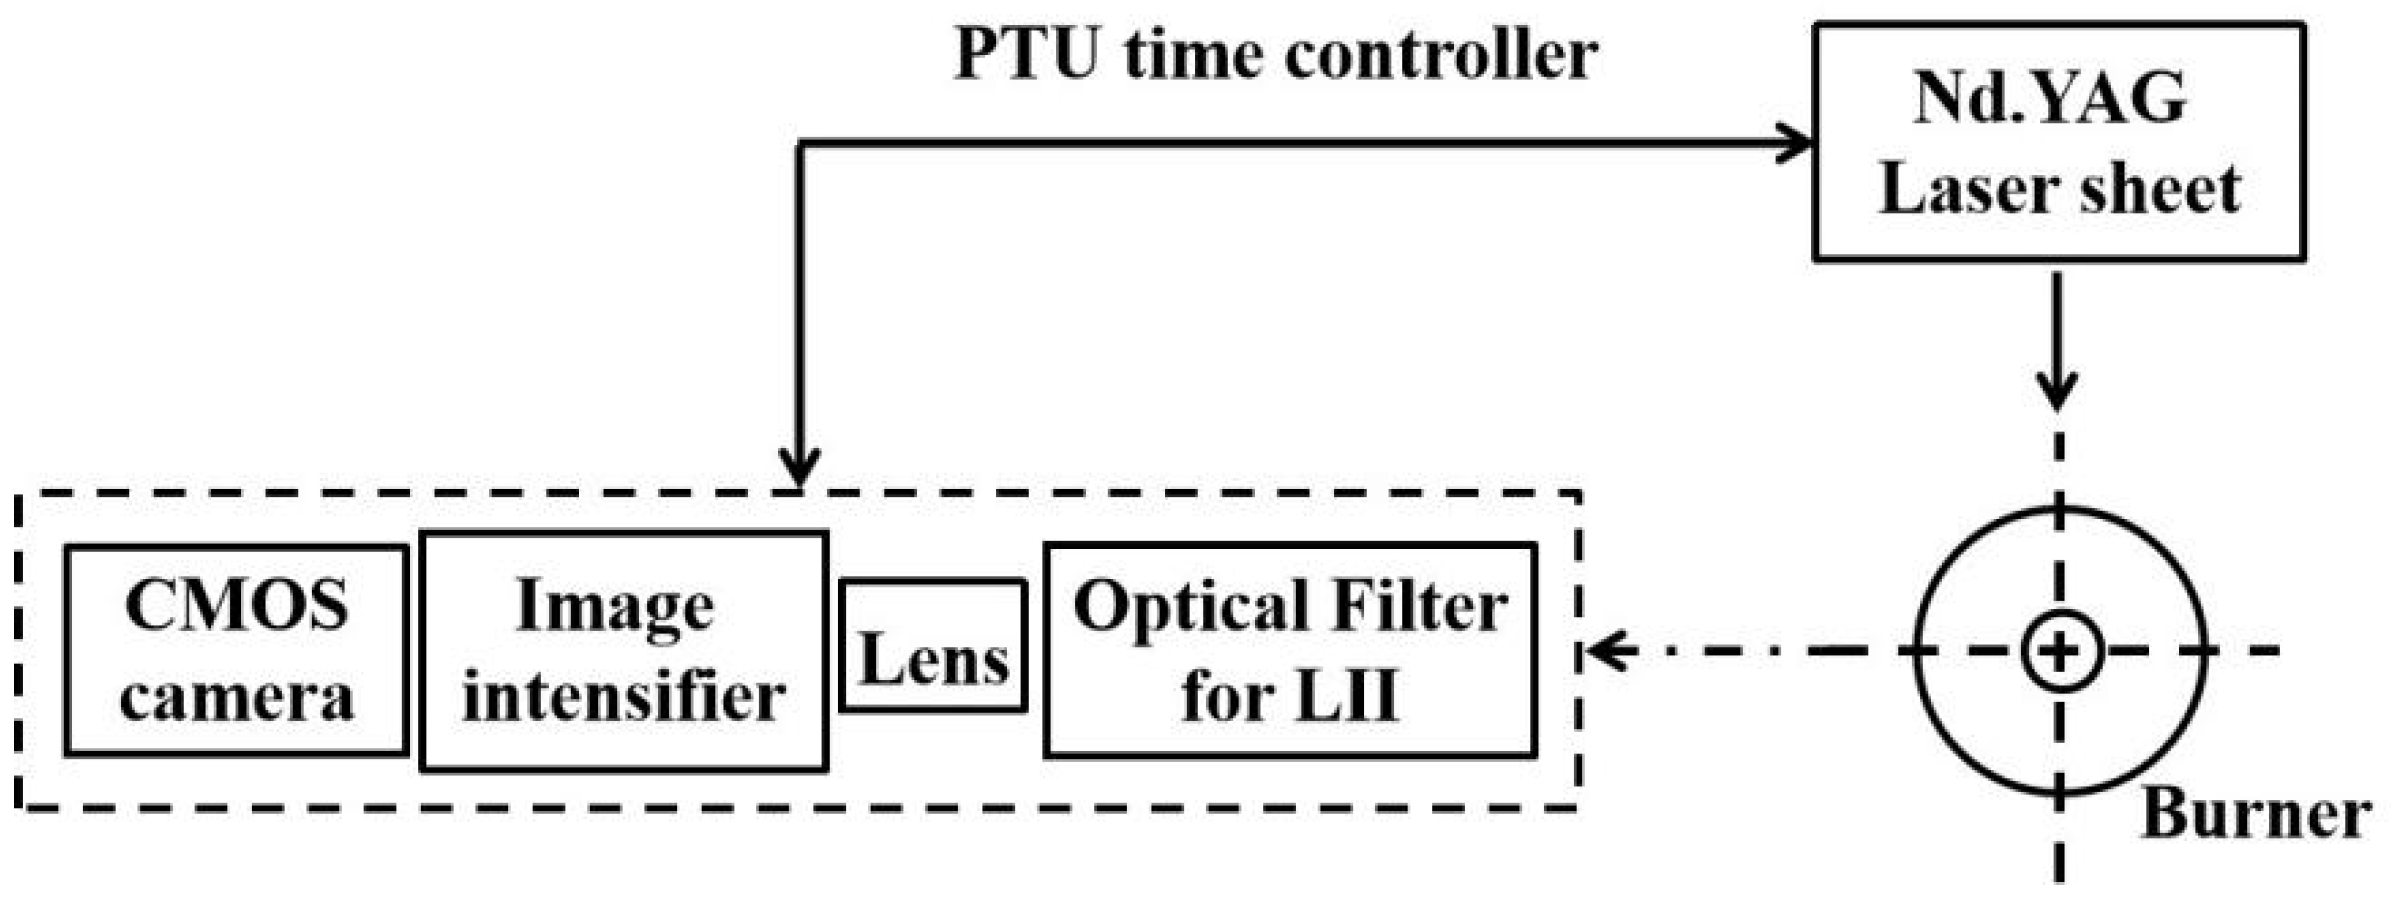
2.1. Optical Apparatus

LII detection was conducted with a LaVision LII module. There are three major parts in the LII method:
(1)
A pulsed laser and a light sheet. An Nd:YAG double-cavity laser, 135 mJ/pulse, was used. To avoid LIF signals, a 1064-nm laser was applied. A 0.48 mJ/mm2 laser fluence was applied.
(2)
A CMOS camera and an image intensifier. A CMOS digital camera was used together with a 25-mm intensifier with a gate–delay controller. The duration of the camera gate was 100 ns with a delay of 40 ns after the occurrence of the laser pulse. Besides, a 500-nm filter with half bandwidth of 10 nm was applied to remove other noise signals.
(3)
A programmable timing unit.
The schematic of how the LII detection module works is shown in Figure 1.
The LII theory was briefly introduced. The proper sheet laser source irradiated the flame; then, the soot inside the flame was heated to incandescence. The incandescence signal was captured by the CMOS camera through the image intensifier. The intensities at each point were marked as a count number range from 0 to 4095. The interval count value was determined by the camera. The soot volume fraction contour was represented by different count values.
Visible flame images were captured using another high-quality CMOS digital camera (model number: JVC GC-P100). The aperture and the exposure time were set to F 4.5 and 1/200 respectively.

2.2. Pressure Combustion Chamber

A stainless-steel pressure chamber controlled by a pump and a PLC (Programmable Logic Controller) system was employed. The working pressure ranged from 30 kPa to 101 kPa. Figure 2 shows the schematic of the pressure chamber from the front. The inner diameter and the inner height of the chamber were 240 mm and 600 mm, respectively. There were three observation ports with the diameter of 100 mm at the 0°, 90° and 180° locations. The 0° and 180° ports were used for the LII measurements while the 90° port was used for image-taking.
The dimensions of the chamber and the observation ports used here were very similar to those described by Thomson et al. [21]. The dimensions of the chamber were determined by the air exchange required for the combustion process. The position of the observation ports was determined by the visible flame height, which may vary with pressure. A vacuum pump was used to pump air from the chamber, and an air channel at the bottom of the flange was used to supply air to maintain scheduled pressure dynamically.
A coflow burner was mounted in the middle of the chamber 170 mm above the chamber floor. A 3-mm capillary stainless-steel pipe was used to supply the fuel. The coaxial coflow air inlet had a diameter of 25 mm. Both the fuel and air inlet tubes were filled with sintered copper to stabilize the flow and create a top hat exit velocity profile. The fuel nozzle was tapered to stabilize the flow around the nozzle [19]. The detailed draft of the coflow burner is shown in Figure 3.
The fuel was propane of 99% purity in the volume fraction. The fuel flow rate was set to 0.93 mg/s to ensure that the soot could be completely oxidized at all the pressures considered. The coflow air flow rates of 40 mg/s and 20 mg/s were used to achieve the air-to-fuel velocity ratios of r v ( f u e l / a i r ) = 1 and 0.5, respectively. Thus, the total carbon released from the nozzle remained the same at all the pressures. The Froude numbers of the tested flames were in the range from 0.15 to ca. 1.73, with the fuel nozzle diameter as the characteristic dimension. Therefore, jet diffusion was still in the buoyancy-dominated mode. The accuracy of pressure measurements could reach ±3%, and the mass flowmeter had a maximum error of 2%.

3. Results and Discussion

3.1. Physical Flame Structure

The images of visible flames at different pressures ranging from 30 kPa to 101 kPa are shown in Figure 3. Flame shape changes significantly with the declining pressure. There were two distinct parts: the yellow luminous region (i.e., the sooting region) and the blue luminous region (i.e., the premixed region). As the pressure decreased, the sooting region moved upward and the blue premixed region expanded, as also observed in the previous high pressure [8,21] and low pressure [15] studies. This observation indicates that soot yield was suppressed by the reduction in pressure.
For the diffusion flames produced by a circular burner, flame height can be predicted using Roper’s [22] correlation:
H f = Q ( T 0 / T f ) 0.67 4 · π · D 0 · I n ( 1 + 1 s )
where Q is the volumetric fuel flow rate, T 0 is the ambient temperature, T f is the average flame temperature, D 0 is the diffusion coefficient at ambient temperature and S is the stoichiometric molar oxidizer-to-fuel ratio. Considering the trivial pressure dependence of T 0 / T f , Equation (1) can be simplified as:
H f Q D 0 u f · A D 0
where u f is the mean velocity of the fuel flow, which is proportional to pressure, and A is the area of the fuel nozzle. Since D 0 is proportional to 1 / P , according to Equation (2), flame height is independent from pressure. With T f = 1800   K , D 0 = 11.1   mm 2 / s   and S = 25, H f     25   mm . This calculated value is slightly different from the experimental flame height which moderately increased with pressure from about 23 mm to 27 mm. Such a tendency of flame height to slightly increase with the increase in pressure can be attributed to soot formation in flames since soot radiation reduces flame temperature T f and the soot oxidation region extends the visible flame height.
As shown in Figure 4, the maximum diameter ( D f ) of the flame’s cross-section expanded as pressure decreased. The dependence of the maximum flame diameter on pressure for r v ( fuel / air ) = 1 and 0.5 is shown in Figure 4. The maximum diameter could be fitted with a power law function of pressure (excluding the pressure of 30 kPa for r v ( fuel / air ) = 0.5 where the flame was lifted off), where exponent n = −0.4 and −0.53, respectively, for r v ( fuel / air ) = 1 and 0.5 . Those exponents are similar to the results of the experimental study by Thomson [19] and Joo [6] for coflow methane–air diffusion flames at high pressure; they noted that the flame’s cross-section area was proportional to p 1 . Such an inverse dependence of the flame’s cross-section area on pressure implies that the average velocity along the flame’s axis direction is independent from pressure. Therefore, the residence time of reactants moving from the nozzle to the flame tip is considered identical at different pressures, in consideration of the nearly fixed flame length. The reduction in soot formation results mainly from suppression of the soot production rate at low pressures [16].
Remarkable differences in flame shape were observed between the flames at r v ( fuel / air ) = 1 and r v ( fuel / air ) = 0.5 , as shown in Figure 4. Flame diameter grew with r v ( fuel / air ) decreasing from 1 to 0.5 and the increment became more observable as the pressure decreased to a low level, as shown in Figure 5. For r v ( fuel / air ) = 0.5, the sooting region shrunk in the low-pressure range from 50 kPa to 40 kPa, which corresponds to a rapid expansion in flame diameter. As the pressure decreased from 40 kPa to 30 kPa, the flame lifted off at r v ( fuel / air ) = 0.5. The lifted flame had a unique appearance, with the sooting region completely covered by the premixed blue flame sheet. At the same time, it revealed that increasing the coflow air velocity strengthens flame stability, contrary to the tendency reported by Takahashi [23]. Further studies are needed to investigate the influence of the coflow air velocity on flame liftoff at low pressures.

3.2. Soot Formation

The LII signals obtained at pressures ranging from 50 kPa to 101 kPa are shown in Figure 6. Note that the flames at pressures lower than 50 kPa were not measured for the LII signal as it becomes too weak to be distinguished from the noise signal at very low pressures. Given that the intensity of LII signal is proportional to the soot volume fraction, the contour of the relative soot volume fraction ( f v * ) could be obtained, as in Figure 6. The contour of f v * showed the general tendency that the soot yield increased and the sooting region moved upstream as the pressure increased. These tendencies coincide with the observations from Figure 4.
The f v * value along the center line is presented in Figure 7. Nonmonotonic influence of r v ( fuel / air ) = 1 on f v * was observed at different pressures. At pressures higher than 60 kPa, the soot yield increased firstly with the increase in the r v ( fuel / air ) , whereas below 60 kPa, an inverse tendency occurred (see also in Figure 4). Yelverton et al. [24] observed that the smoke point increased with the increase in the r v ( fuel / air ) to < 1 . Their conclusions are in agreement with the tendency observed at the high-pressure range in this study. The peak delimits the soot production-dominated region and the soot oxidation-dominated region. Flames at r v ( fuel / air ) = 0.5 have a larger soot production-dominated region than that of the flames at r v ( fuel / air ) = 1. Therefore, the residence time for soot formation increased at lower r v ( fuel / air ) , which would contribute to the increased relative soot volume fraction (LII signal intensity).
The peak relative soot volume fraction ( f v , m a x * ) versus pressure is plotted in Figure 8. A power law relationship was fitted to seek the dependence of f v , m a x * on p n , with the exponents of n = 1.7 and 2.8 for r v ( fuel / air ) = 1 and r v ( fuel / air ) = 0.5 , respectively. The soot formation rate decreases at lower pressures, therefore, at both conditions, the peak relative soot volume fraction decreased with the decrease in pressure. However, at a lower r v ( fuel / air ) , the soot yield decreased more quickly with the decrease in pressure. This was possibly related to the decrease in the fuel burning rate at a lower r v ( fuel / air ) . The fuel burning rate was mainly controlled by forced convection and buoyance-induced natural convection. The former was due to the momentum exchange between the fuel and air streams and was stronger at a higher r v ( fuel / air ) . The latter was significantly determined by the environmental pressure and would decrease to a lower level at low pressures, thus forming a more spherical flame, as in Figure 4. At the normal pressure, 101 kPa, buoyance-induced convection was strong enough to compensate for the weakness of forced convection and ensure complete mixing and burning of the fuel. However, the mixture was still fuel-rich at the flame base for r v ( fuel / air ) = 0.5 as forced convection was dominant there. Therefore, flames at a lower r v ( fuel / air ) have higher sooting propensity and presented a larger soot volume fraction. With the decrease in pressure, the fuel burning rate decreased since forced convection was insufficient to mix all the fuel, and the fuel burning rate decreased more quickly at a lower r v ( fuel / air ) . Considering that the conversion ratio of carbon into soot was approximately constant, the quick decrease in f v , m a x * in Figure 8 was the expected consequence. A clear evidence of the reduction in the fuel burning rate is that the flame started to lift off at 30 kPa, and blowout could occur if the pressure was further reduced.
To evaluate the influence of pressure on the sooting propensity, the relative soot mass flow rate m s ˙ was calculated as follows:
m ˙ s = 2 π ρ s   v z ( z ) f v * ( x , z ) r d r
where v z is the axial velocity, z is the axial height, ρ s is the soot density assumed to be constant and r is the radius of the flame’s cross-section. Therefore, m ˙ s is the scaled value of the real soot mass flow rate. The axial velocity is estimated by v z = ( z a z ) 1 / 2 , where a is an acceleration constant proportional to p 2 , which is assumed to be 25 m/s2 at the atmospheric pressure [15].
Figure 9 shows the maximum relative soot mass flow rate ( m ˙ s , max ) for each test versus pressure. All the values were normalized by the largest value at 101 kPa and r v ( fuel / air ) = 1 . A power law fit was applied, and the exponents obtained were 3.4 and 3.7, respectively, for r v ( fuel / air ) = 1 and 0.5. These values are close to the value of 3.3 reported by Bento et al. [8], whose experiment was conducted at pressures between 1 atm and 2 atm with r v ( f u e l / a i r ) > 1 . As shown in Figure 8, m ˙ s , max for r v ( fuel / air ) = 0.5 was larger than r v ( fuel / air ) = 1 under pressures higher than 50 kPa. As pressure decreased further, the difference would become less distinguishable. As pressure decreased to 50 kPa, m ˙ s at r v ( fuel / air ) = 1 became lower than that at r v ( fuel / air ) = 0.5 . This nonmonotonic tendency of m ˙ s , max versus r v ( fuel / air ) for both conditions was in accordance with the trend shown in Figure 8. To sum sup, both m ˙ s , max and f v , m a x * decrease with the increase in pressure; however, the pressure influence was more remarkable at r v ( fuel / air ) = 0.5 .

4. Conclusions

In this paper, soot formation of coflow propane–air laminar diffusion flames was experimentally investigated at subatmospheric pressures from 30 to 101 kPa. Two different air-to-fuel ratios were tested. Spatially resolved measurements of the relative soot volume fraction ( f v ) were performed using laser-induced incandescence. The main observations are as follows.
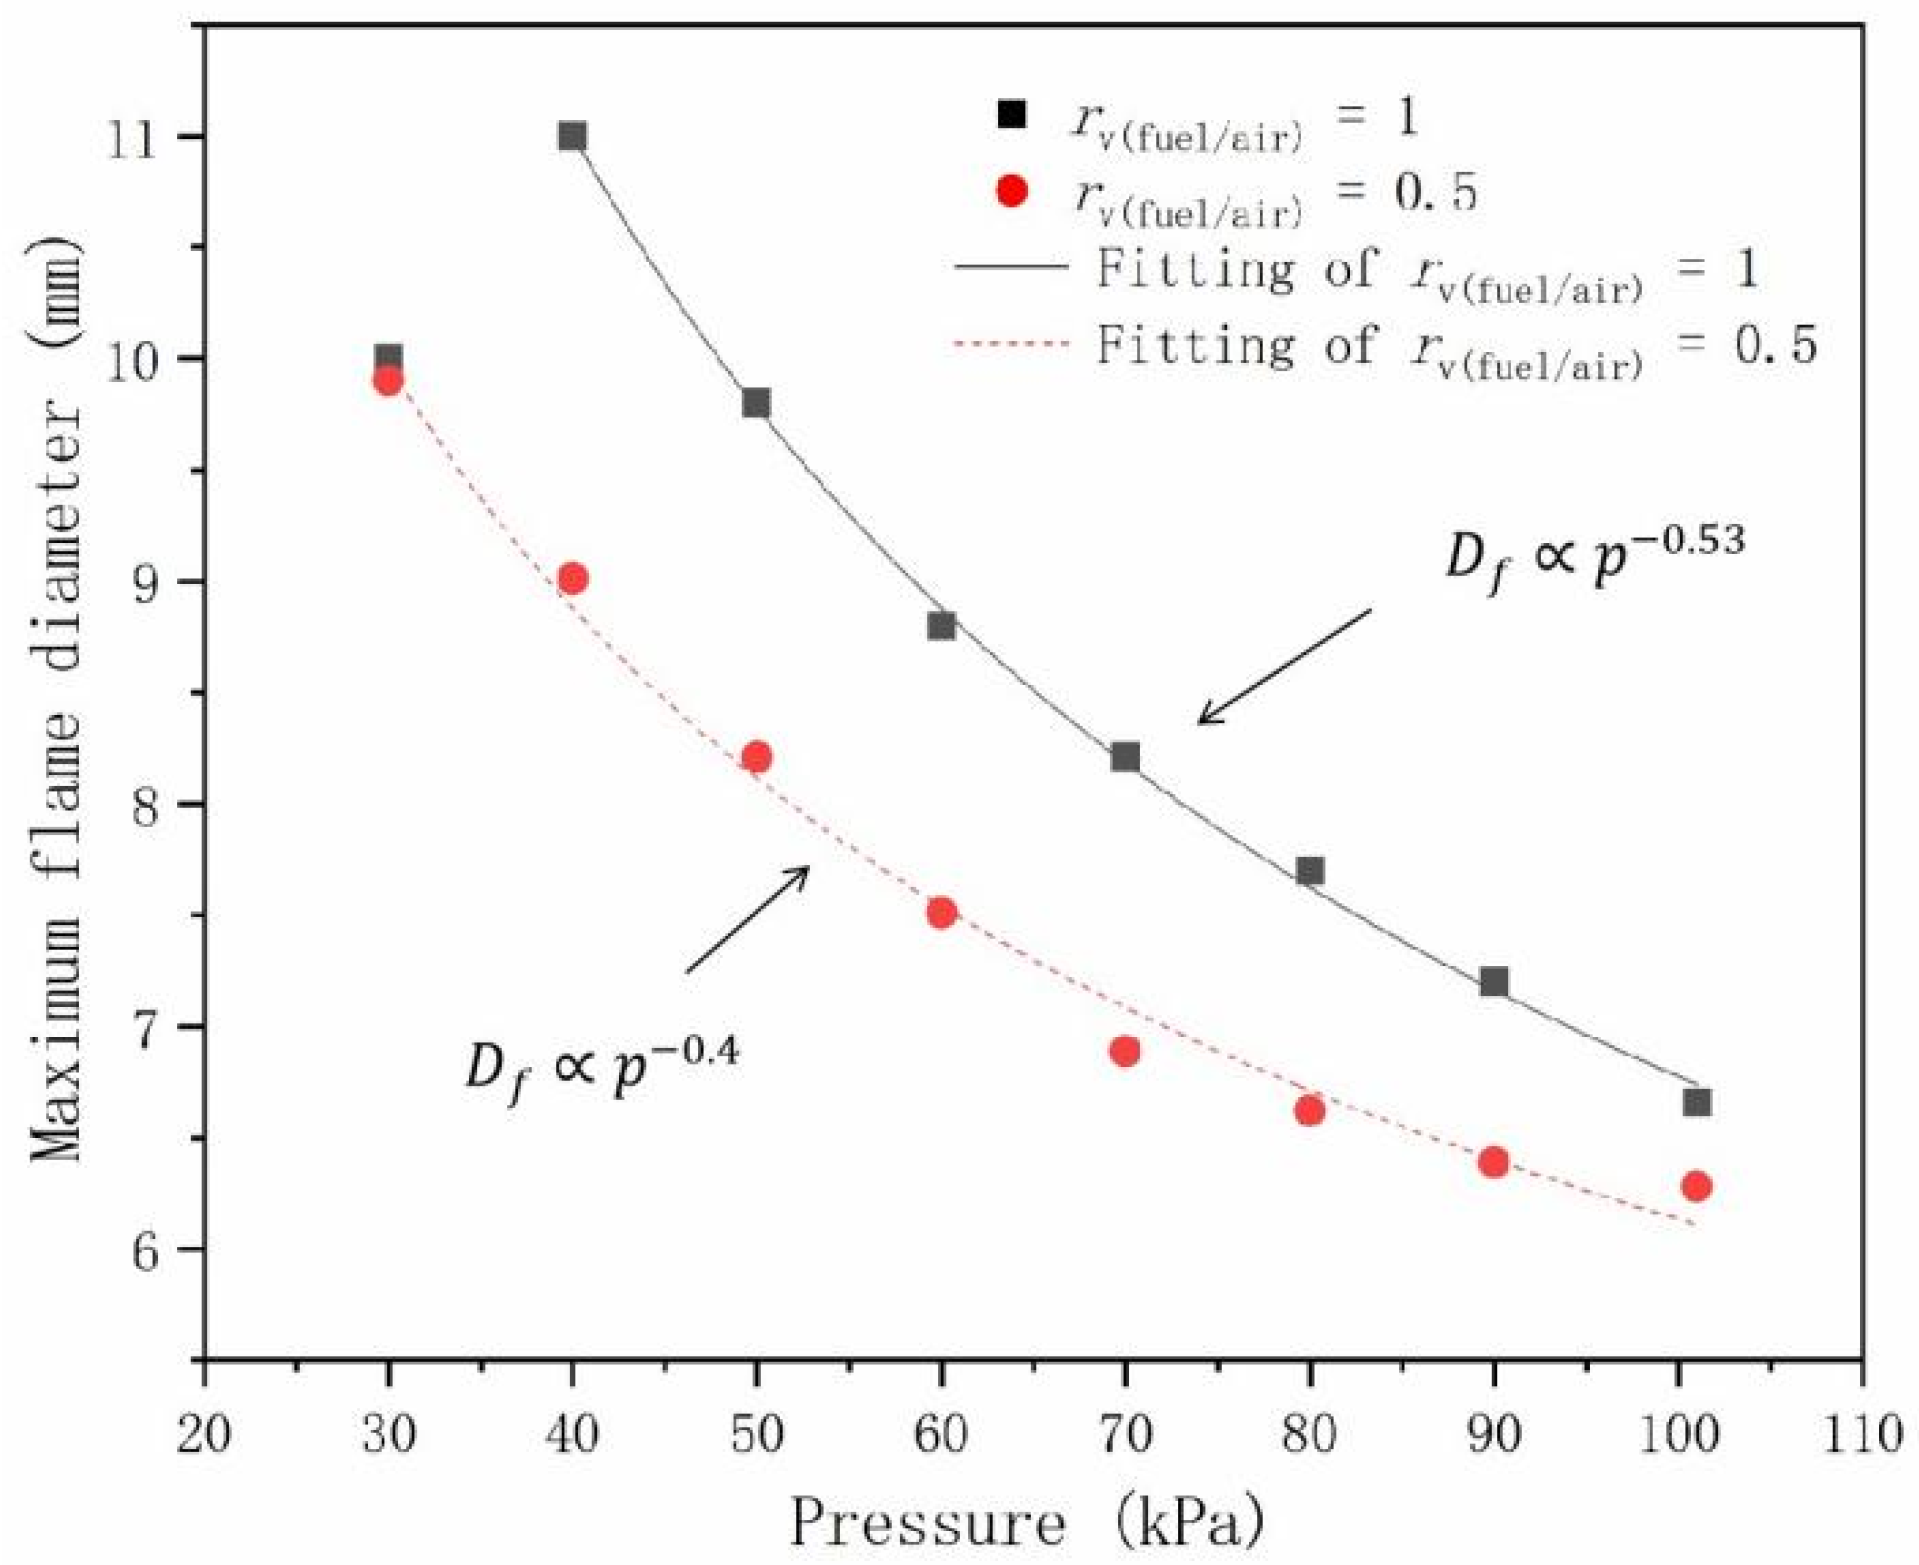
  • As pressure decreases, the visible flame height decreases and flame diameter expands. The maximum flame diameter was found to scale with pressure, with n = 0.4 and 0.53 for r v ( fuel / air ) = 1 and 0.5, respectively.
2.
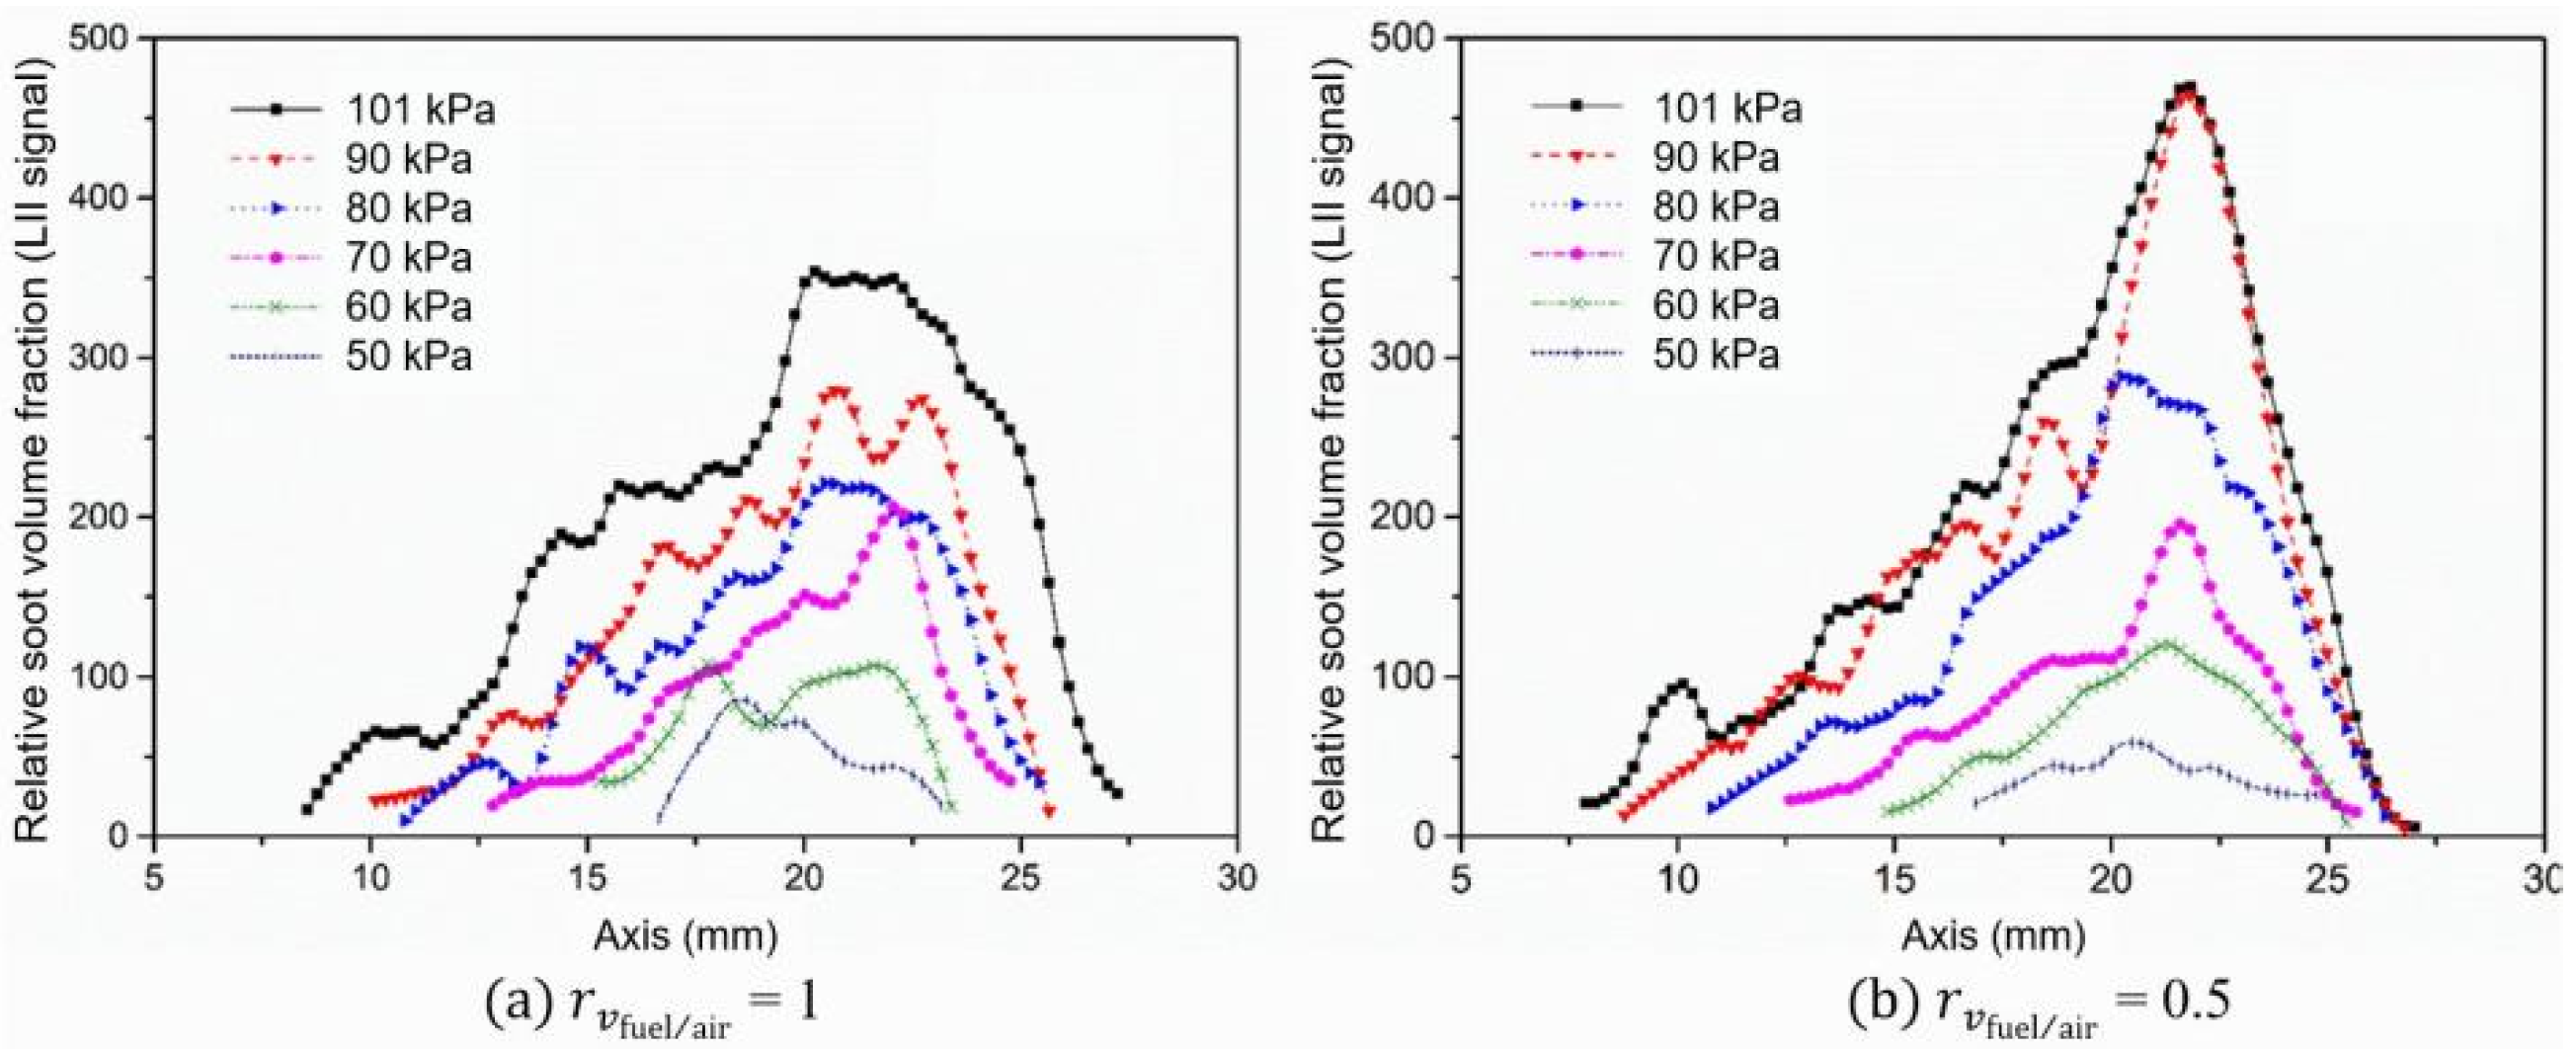
The relative soot volume fraction represented by the LII signal intensity ( L I I m a x f v ) decreases at lower pressures. However, at a lower air-to-fuel ratio, the soot volume fraction decreases more quickly with the decrease in pressure.
3.
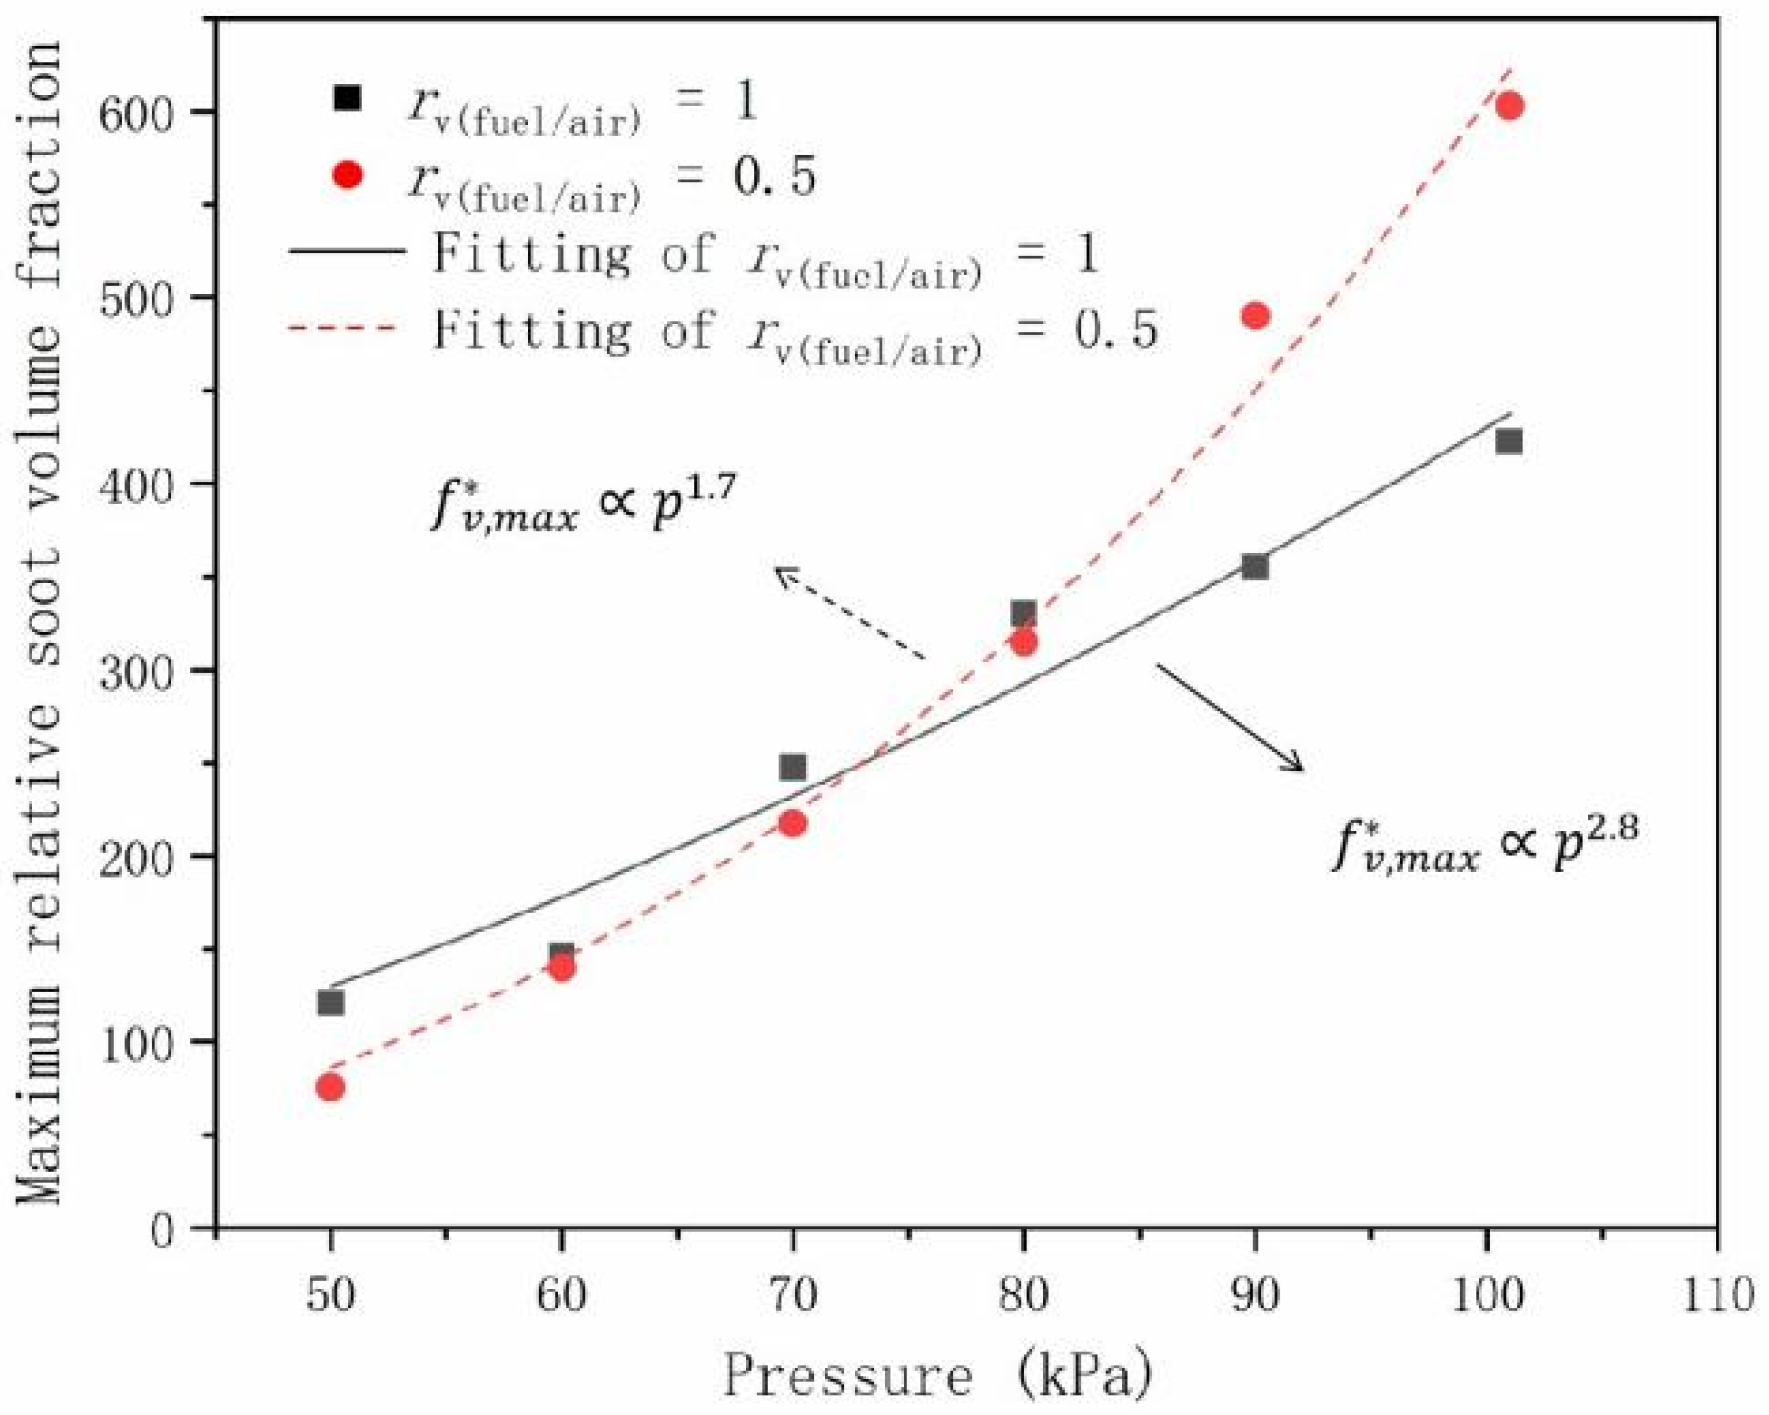
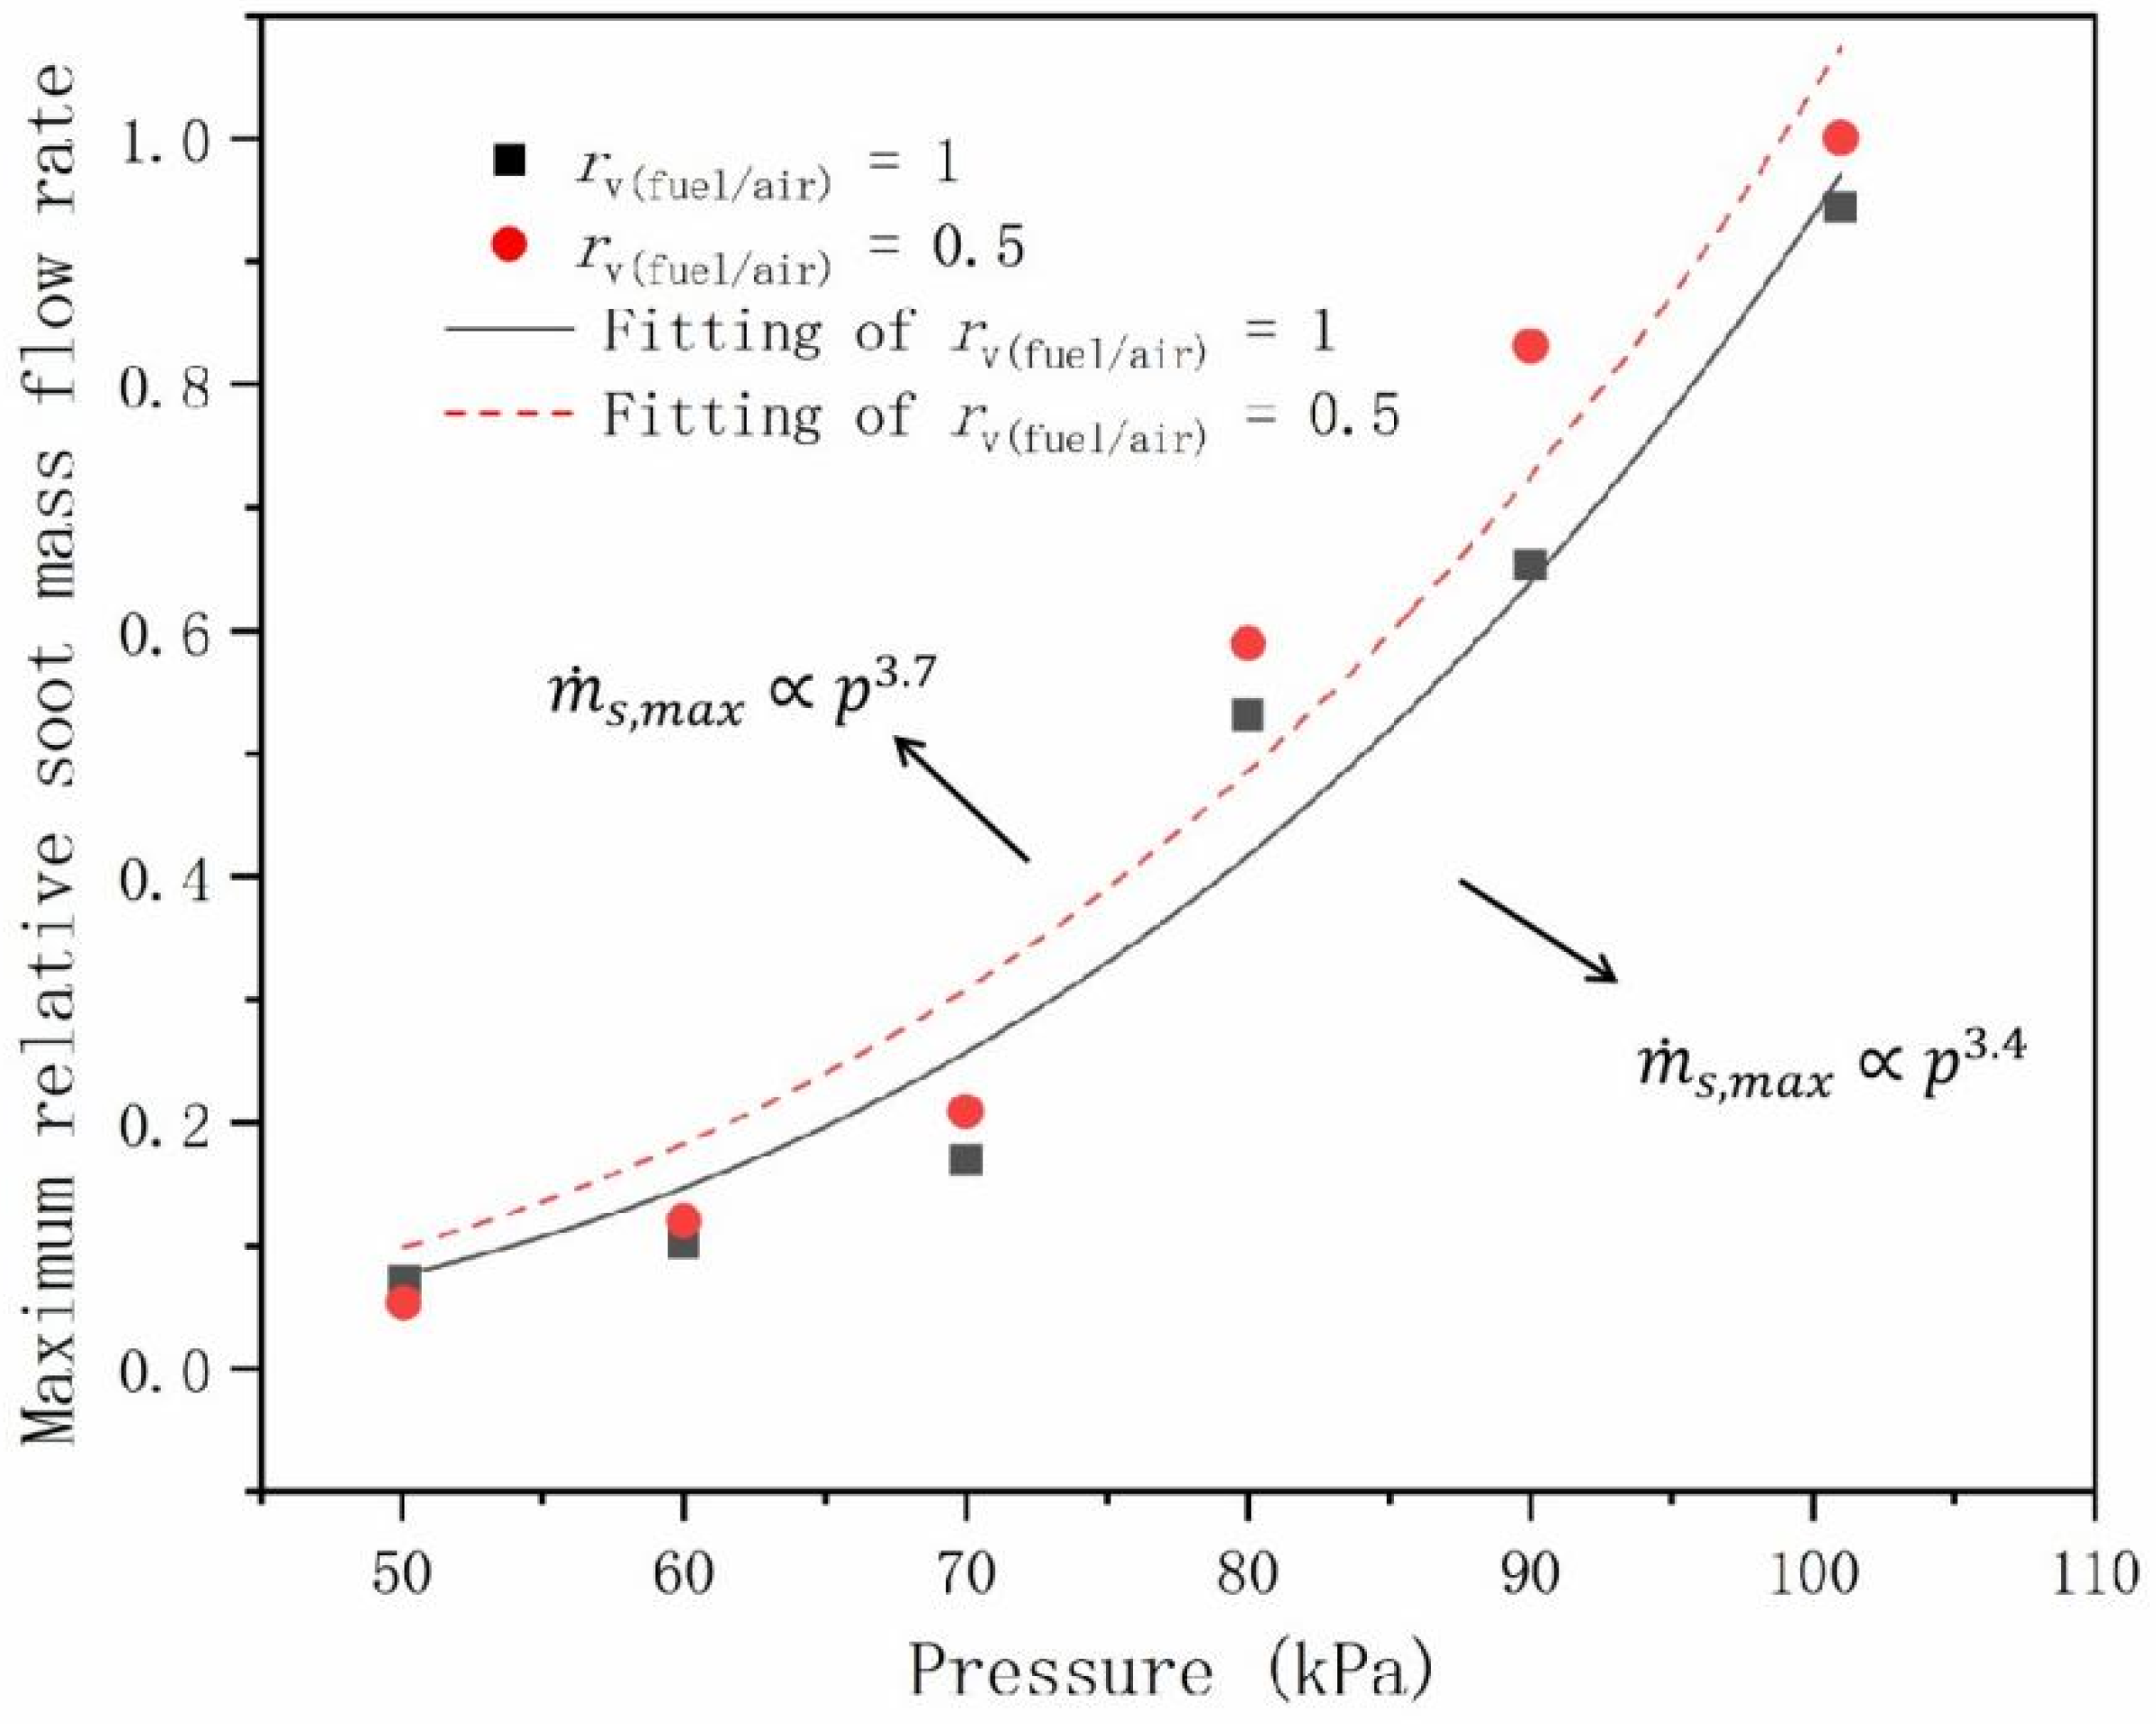
The maximum relative soot volume fraction and the maximum relative soot mass flow rate have a power law relationships with pressure. The exponents were 1.7 and 2.8 for f v , m a x * and 3.4 and 3.7 for m ˙ s , max , with r v ( fuel / air ) = 1 and 0.5, respectively.

Author Contributions

Conceptualization, J.Y. and J.W.; methodology, J.Y.; software, Not involved; validation, J.Y., J.L. and J.W.; formal analysis, J.Y.; investigation, J.Y.; resources, J.Y.; data curation, J.Y.; writing—original draft preparation, J.Y.; writing—review and editing, J.Y., J.L. and J.W.; visualization, J.Y.; supervision, J.W.; project administration, J.Y., J.L. and J.W.; funding acquisition, J.Y., J.L. All authors have read and agreed to the published version of the manuscript.

Funding

This research was funded by National Natural Science Foundation of China (No. 51909152), the Open Project of the State Key Laboratory of Fire Science (HZ2021-KF07), and Science Research Project of Changshu institute of Technology (KYZ2016088Z).

Institutional Review Board Statement

The study did not involve humans or animals.

Informed Consent Statement

The study did not involve humans.

Data Availability Statement

The study did not report any data.

Acknowledgments

This work was supported by the National Natural Science Foundation of China (No. 51909152), the Open Project of the State Key Laboratory of Fire Science (HZ2021-KF07), and the Science Research Project of Changshu institute of Technology (KYZ2016088Z).

Conflicts of Interest

The authors declare no conflict of interest.

References

  1. Bartholet, D.L.; Arellano-Trevino, M.A.; Chan, F.L.; Lucas, S.; Zhu, J.Q.; John, P.C.S.; Alleman, T.L.; McEnally, C.S.; Pfefferle, L.D.; Ruddy, D.A.; et al. Property predictions demonstrate that structural diversity can improve the performance of polyoxymethylene ethers as potential bio-based diesel fuels. Fuel 2021, 295, 120509. [Google Scholar] [CrossRef]
  2. Jiang, B.; Jia, P.H.; Liu, D. Comparative study on soot characteristics of non-swirling and swirling inverse diffusion iso-octane flames with biofuel 2,5-dimethylfuran addition. J. Energy Inst. 2020, 93, 2108–2123. [Google Scholar] [CrossRef]
  3. Karataş, A.E.; Gülder, Ö.L. Soot formation in high pressure laminar diffusion flames. Prog. Energy Combust. Sci. 2012, 38, 818–845. [Google Scholar] [CrossRef]
  4. Glassman, I.; Yetter, R.A. Chapter 8—Environmental combustion considerations. In Combustion, 5th ed.; Glassman, I., Yetter, R.A., Glumac, N.G., Eds.; Academic Press: Boston, MA, USA, 2015; pp. 393–475. [Google Scholar]
  5. McCrain, L.L.; Roberts, W.L. Measurements of the soot volume field in laminar diffusion flames at elevated pressures. Combust. Flame 2005, 140, 60–69. [Google Scholar] [CrossRef]
  6. Joo, H.I.; Gülder, Ö.L. Soot formation and temperature field structure in co-flow laminar methane–air diffusion flames at pressures from 10 to 60atm. Proc. Combust. Inst. 2009, 32, 769–775. [Google Scholar] [CrossRef]
  7. Mandatori, P.M.; Gülder, Ö.L. Soot formation in laminar ethane diffusion flames at pressures from 0.2 to 3.3 MPa. Proc. Combust. Inst. 2011, 33, 577–584. [Google Scholar] [CrossRef]
  8. Bento, D.S.; Thomson, K.A.; Gülder, Ö.L. Soot formation and temperature field structure in laminar propane–air diffusion flames at elevated pressures. Combust. Flame 2006, 145, 765–778. [Google Scholar] [CrossRef] [Green Version]
  9. Commodo, M.; Karata, A.E.; Falco, G.D.; Minutolo, P.; D’Anna, A.; Gülder, Ö.L. On the effect of pressure on soot nanostructure: A Raman spectroscopy investigation. Combust. Flame 2020, 219, 13–19. [Google Scholar] [CrossRef]
  10. Gülder, Ö.L.; Intasopa, G.; Joo, H.I.; Mandatori, P.M.; Bento, D.S.; Vaillancourt, M.E. Unified behaviour of maximum soot yields of methane, ethane and propane laminar diffusion flames at high pressures. Combust. Flame 2011, 158, 2037–2044. [Google Scholar] [CrossRef]
  11. Mi, X.T.; Saylam, A.; Endres, T.; Schulz, C.; Dreier, T. Near-threshold soot formation in premixed flames at elevated pressure. Carbon 2021, 181, 143–154. [Google Scholar] [CrossRef]
  12. Dou, Y.L.; Liu, H.Q.; Liu, B.; Zhang, Y.; Liu, Y.Q.; Cheng, X.Z.; Tao, C.F. Effects of carbon dioxide addition to fuel on flame radiation fraction in propane diffusion flames. Energy 2021, 218, 119552. [Google Scholar] [CrossRef]
  13. Tao, C.F.; Liu, B.; Dou, Y.L.; Qian, Y.J.; Zhang, Y.; Meng, S. The experimental study of flame height and lift-off height of propane diffusion flames diluted by carbon dioxide. Fuel 2021, 290, 119958. [Google Scholar] [CrossRef]
  14. Charest, M.R.J.; Groth, C.P.T.; Gülder, Ö.L. A numerical study on the effects of pressure and gravity in laminar ethylene diffusion flames. Combust. Flame 2011, 158, 1933–1945. [Google Scholar] [CrossRef]
  15. Panek, N.; Charest, M.R.; Gülder, Ö.L. Simulation of microgravity diffusion flames using sub-atmospheric pressures. AIAA J. 2012, 50, 976–980. [Google Scholar] [CrossRef]
  16. Kim, C.H.; El-Leathy, A.M.; Xu, F.; Faeth, G.M. Soot surface growth and oxidation in laminar diffusion flames at pressures of 0.1–1.0 atm. Combust. Flame 2004, 136, 191–207. [Google Scholar] [CrossRef]
  17. Liu, J.H.; Zhou, Z.H. Examination of radiative fraction of small-scale pool fires at reduced pressure environments. Fire Saf. J. 2019, 110, 102894. [Google Scholar] [CrossRef]
  18. Li, P.; Liu, J.H.; Zhang, D.M.; Chen, G.F.; Wang, J. Experimental study of reduced pressure effect on radiation feedback to the fuel surface of pools fires. J. Therm. Anal. Calorim. 2021, 144, 883–893. [Google Scholar] [CrossRef]
  19. Wang, J.W.; Fang, J.; Guan, J.F.; Zeng, Y.; Zhang, Y.M. Flame volume and radiant fraction of jet diffusion methane flame at sub-atmospheric pressures. Fuel 2016, 167, 82–88. [Google Scholar] [CrossRef]
  20. Michelsen, H.A.; Schulz, C.; Smallwood, G.J.; Will, S. Laser-induced incandescence: Particulate diagnostics for combustion, atmospheric, and industrial applications. Prog. Energy Combust. Sci. 2015, 51, 2–48. [Google Scholar] [CrossRef] [Green Version]
  21. Thomson, K.A.; Gülder, Ö.L.; Weckman, E.J.; Fraser, R.A.; Snelling, D.R. Soot concentration and temperature measurements in co-annular, nonpremixed CH4/air laminar flames at pressures up to 4 MPa. Combust. Flame 2005, 140, 222–232. [Google Scholar] [CrossRef]
  22. Roper, F.G. The prediction of laminar jet diffusion flame sizes: Part I. Theoretical model. Combust. Flame 1977, 29, 219–226. [Google Scholar] [CrossRef]
  23. Takahashi, F.; Katta, V.R. A reaction kernel hypothesis for the stability limit of methane jet diffusion flames. Proc. Combust. Inst. 2000, 28, 2071–2078. [Google Scholar] [CrossRef]
  24. Yelverton, T.L.B.; Roberts, W.L. Effect of dilution, pressure, and velocity on smoke point in laminar jet flames. Combust. Sci. Technol. 2008, 180, 1334–1346. [Google Scholar] [CrossRef]
Figure 1. A schematic of the LII components.
Applsci 11 05979 g001
Figure 2. A schematic of the low-pressure combustion chamber.
Applsci 11 05979 g002
Figure 3. A schematic of the coflow burner.
Applsci 11 05979 g003
Figure 4. Pictures of coflow laminar diffusion flames from 101 kPa to 30 kPa. Propane flow rate was constant at 0.93 m/s; (a) r v ( fuel / air ) = 1 ; (b) r v ( fuel / air ) = 0.5 .
Applsci 11 05979 g004
Figure 5. Power law fit for the maximum flame’s cross-section diameter ( r v ( fuel / air ) = 1   and   0.5 , ambient pressure = 30–101 kPa).
Applsci 11 05979 g005
Figure 6. Signal intensities from LII measurements at various ambient pressures with r v ( fuel / air ) = 1 (top) and r v ( fuel / air ) = 0.5 (bottom). HAB (height above the burner).
Applsci 11 05979 g006
Figure 7. Relative soot volume fraction along the axis of the flame with r v ( fuel / air ) = 1 (a) and 0.5 (b).
Applsci 11 05979 g007
Figure 8. Maximum relative soot volume fraction as a function of pressure.
Applsci 11 05979 g008
Figure 9. Power law fit of the maximum relative soot mass flow rate and pressure.
Applsci 11 05979 g009
Publisher’s Note: MDPI stays neutral with regard to jurisdictional claims in published maps and institutional affiliations.

