
CPT Parameters of Loess Subsoil in Lublin Area


Department of Geotechnical Engineering, Faculty of Civil Engineering and Architecture, Lublin University of Technology, 20-618 Lublin, Poland
*
Authors to whom correspondence should be addressed.
Appl. Sci. 2021, 11(13), 6020; https://doi.org/10.3390/app11136020
Submission received: 12 May 2021
/
Revised: 14 June 2021
/
Accepted: 15 June 2021
/
Published: 28 June 2021
(This article belongs to the Section Earth Sciences)
Abstract
:Loess soils were created by the wind transporting particles with later or in parallel occurred protogenetic, syngenetic and epigenetic processes. As a result, various genetic processes affected loesses strength and deformability characteristics. The aim of the study is to estimate the main CPT parameters of loess subsoil in Lublin area according to divided facies. The subsoil in the area of the Nałęczowski Plateau, where Lublin is located, consists mainly of loess from aeolian and aeolian–diluvial facies, and in the deeper parts—from aeolian–alluvial facies. Most of the results obtained for the aeolian facies at the level of qc in the range from 4.5 to 8.0 MPa indicate that these soils are a good load-bearing substrate for building structures. Cone resistances mostly at the level of 1.5–4.0 MPa for the diluvial and alluvial facies confirm that these facies constitute less favorable foundation conditions. The reduced resistance results mainly from the increased water content in ground pores. It is especially the soils of the diluvial facies that provide unfavorable foundation conditions, as they occur near the surface. Genetic processes are a very important element that should be taken into account in engineering research.

1. Introduction
Loess soils are found in many regions of the world and constitute the subject of research by geotechnicians, geologists (often in terms of stratigraphy), paleopedologists and scientists from other fields [1,2,3]. These soils are aeolian deposits, formed as a result of the accumulation of dust particles of the soil moved by the wind. In macroscopic evaluation, loess is a relatively homogeneous, macroporous sediment, most often of a light yellow or beige color [4]. Polish loess soils are mostly composed of coarse silt (10–50 µm). The clay and find sand fractions range from 5 to 25%. They contain an average of 60–70% of quartz and feldspars, calcium carbonate and dolomite in varying proportions. Loess soils are partially aggregated, with a porosity index ranging on average between 45% and 55% [5,6].
The research approach to the study of loess deposits varies depending on the type of expected results. Many studies refer to particular features of soils without a detailed analysis of their genesis [7]. As a rule, loess soils were created by the wind transporting particles. However, very often other genetic processes, such as runoff, slide or accumulation through the action of water, occurred in parallel or later. Therefore, loess soils should be divided into facies taking into consideration their genesis, which has long been emphasized in the most important publications on loess [1,2,5,8,9,10,11]. According to the authors of the present publication, the clearest classification of loess is that proposed by Maruszczak [2]. Apart from the genetic-facies classification, Maruszczak also divides loess according to the grain size, distribution and topography. The three types of classifications he uses are listed in Table 1, while Figure 1 shows an ideogram illustrating the structure and division of loess deposits. When describing the genetic and facies variations, the protogenetic role of the wind is emphasized, therefore the name of each facies includes the word aeolian. However, it should be emphasized that genetic divisions should not be considered as rigid, but only as indicating the leading factor. Genetic processes often occur in parallel and are not always clearly identifiable. For example, diluvia are combined with colluvia, alluvia with diluvia or alluvia with limnic processes. As a result of additional processes shaping the subsoil, the influence of the protogenetic factor of the wind on soil properties decreases, and in the genetic context these deposits are often referred to as loess-like [2].
The variety of loess soils results from protogenetic, syngenetic and epigenetic processes, which, depending on the dominance of a given process, shaped their features and translated, among other things, into strength and deformability characteristics. Genetic processes are a very important element that should be taken into account in engineering research. The subsoil in the area of the Nałęczowski Plateau, where Lublin is located, consists mainly of loess from aeolian and aeolian–diluvial facies, and in the deeper parts, from aeolian–alluvial facies.
Aeolian (subaerial), so-called typical loesses, sedimented in dry periods and areas, are the dominant facies. In Poland, their formation is dated to the period of the Weichselian glaciation, but older loess soils are also found, which also occur in the area of Lublin. The subaerial loess covers usually have 90% of the silt fraction, and their characteristic color is yellow-grey, light brown or beige. They are located mainly on the uplands and partly on the slopes of valleys. They usually reach a thickness of up to 20 m, but locally they can reach even 30 m. The strength and deformability characteristics of this facies are the most favorable among all loess materials. However, the phenomenon of collapse may still occur within this facies [2,5,6,12].
The second facies representing the Lublin subsoil is aeolian–diluvial loess soils, which are characterized by less favorable geotechnical parameters. This is mainly due to the action of postgenetic factors, especially in the form of rainwater, rinsing and washing the aeolian sediment into the lower parts of the slopes. On large plains without a clear slope of the terrain, diluvia are evenly distributed in the subsurface layers of the subsoil. On hilltops, they form enclosed depressions, which during periods of long rainfall show the ability to retain water, while losing the features of a load-bearing soil. Within this facies, the content of the clay fraction is increased, which makes these loess soils more clayey. This facies also occurs in deeper parts, sometimes separating the typical younger aeolian loess from the older ones. In the upper part of older diluvia, which used to be the topsoil, traces of organic matter can also be encountered, they are the so-called paleosols [2,5,6,12].
Another facies found in Lublin is the aeolian–alluvial valley loess. This facies was formed as a result of the sedimentation of wind-transported silt in water conditions and the redeposition of older aeolian sediments and diluvia. It is located mainly in river valleys, old denudation and erosion valleys. It is characterized by brick-yellow, yellow-grey or grey color. It contains numerous beds in it and it is sometimes lithologically heterogeneous. In terms of particle size distribution, it should be classified as clayey silt and silty clay, with a significantly higher content of clay particles compared to aeolian loess (up to 20%) [2,5,6,12].
Loess soils cover over 50% of Lublin’s area and determine the geotechnical conditions of the left-bank basin of the Bystrzyca River. In the Lublin region, they cocreate a foundation soil with usually favorable geotechnical parameters; however, an analysis of local conditions is necessary. Currently, one of the most popular field studies is CPT static sounding, which due to its specificity provides rich quasicontinuous data at depth. It makes it possible to examine the soil profile to considerable depths, to derive many geotechnical parameters of the soil from the measured values, and at the same time it remains a relatively economical and quick test [13,14]. CPT sounding is currently the most universal soil test and there are numerous correlations both for deriving soil parameters from the data recorded during the test and for recognizing the type of soil [14,15,16,17,18,19,20]. In Poland, Robertson’s SBT (soil behavior type) [21] chart is widely used for the interpretation of soil type, modified and adapted to Polish conditions by Młynarek et al. [22].
The results presented in the article add new data to the documented knowledge. The results of field studies and guidelines for conducting them on the loess of the Lublin region have been described in publications [23,24,25,26,27], and the data from soundings are the basis for determining soil parameters [17,28,29,30,31] and engineering calculations [12,32,33]. In the light of the above, linking the numerical results of CPT static sounding to the genesis of loess will bring significant benefits to geotechnicians and engineering geologists in terms of data interpretation.
2. Materials and Methods
The basis for the characterization of Lublin loess soils was the results of in-situ tests—CPT and CPTU static soundings carried out in the years 2015–2020 by GeoNep company. As part of the analysis of static soundings, the geotechnical documentation prepared for 152 locations was reviewed (Figure 2), from among which data were collected from a total of 1136 CPT and CPTU soundings with a total length of approximately 8385 m, including loess and loess-like deposits.
Static soundings were performed with a penetrometer Pagani T63-200 with a maximum pressure of 200 kN, which was used to press the measuring cone at a speed of 2 cm/s. In the tests, mainly a piezocone with an electronic measurement system (CPT/CPTU test) was used, with automatic data recording every 1 cm. In some tests, a mechanical cone (CPTM test) was used in which readings were taken manually at 20 cm intervals. In the case of both types of tests, the recorded values were the cone resistance qc and the friction on the friction sleeve fs. The cones used for the tests had standard geometry, which corresponded to the base surface of 10 cm2, the friction sleeve surface—150 cm2 and the cone tip angle of 60 degrees. All test parameters were compliant with the standards of ISO 22476-1 [34] and ISO 22476-12 [35]. The analyzed results relate to 2287.2 m of soundings with a mechanical cone and 6097.6 m of soundings with the use of an electric cone, of which 1997.25 m of testing were CPTU soundings during which pore water pressure u2 was additionally measured.
The type of cone (electrical or mechanical) used in CPT testing affects the value of the qc and fs results recorded. This statement is confirmed by the results of many studies and described, e.g., in [36]. Based on the comparative analysis [37], it was found that for typical aeolian loess soils, the qc values obtained from the mechanical cone test constitute about 93% of the qc value obtained when measured with an electric cone. On the other hand, the fs values obtained from the mechanical cone soundings are more than twice as high as those indicated by electric cone readings. While the difference in the qc readings can be considered small, the difference in fs is significant. Taking into account that the friction ratio Rf, which is used to identify the type of soil, is determined on the basis of fs, the type of cone used should be taken into account when interpreting the results. The Rf coefficient for aeolian loess determined with a mechanical cone is 2.22 times greater than that determined from the electric cone test [37].
The value of pore water pressure u2 recorded in CPTU tests for aeolian and diluvial loess was close to zero or slightly negative, so there was little suction, which is typical for unsaturated soils. The increase in pore pressure u2 was significant only in the case of alluvial loess. It is also a guideline when identifying facies from CPT soundings. Taking into account the obtained relatively high values of cone resistance qc and the values of u2 close to zero, for loess soils it can be assumed as a simplification that qc = qt. Only in the rare case of alluvial and older diluvial loess facies, when values of cone resistance qc are very low, e.g., 0.7 MPa, and values of u2 are relatively high, the difference between qc and qt values becomes noticeable, but still remains insignificant. It is very infrequent that SBT chart analysis identifies alluvial and older diluvial loess with very low qc and high u2 as more sandy soil.
Having a large amount of data and referring to the division of loess according to Maruszczak, the authors of the present publication developed an own representative cross-section showing the geological structure of Lublin on the western side of Bystrzyca. Identification of subsoil layers was based on data from selected geotechnical documentation in terms of the values recorded during static soundings tests and soil identification from boreholes. The obtained cross-section representing schematically the geological structure of Lublin is presented in Figure 3.
Among the studied loess deposits, the most characteristic facies of the region can be distinguished, i.e., aeolian (older and younger), aeolian–diluvial (older and younger) and aeolian–alluvial facies. The results of in-situ research in the form of CPT soundings carried out in the western part of Lublin were analyzed for each facies. In the further part of the study, the two-part names of facies, for the sake of simplicity, are written without the “aeolian” part, which is intended to emphasize the overriding impact of the wind in the process of loess genesis.
Correct interpretation of the results of static soundings is only possible when the results of borehole are taken into consideration. In order to identify the type of soil, test boreholes were also drilled in the immediate vicinity of the selected soundings. Traditionally used classification diagrams, e.g., by Robertson [21,38] or Schmertman [39], ascribe soil behavior type (SBT) to a given soil, which is why there are sometimes discrepancies between the type of soil interpreted and identified from the borehole. The proper lithological classification can only be performed macroscopically, and the results of the in situ examination reflect the engineering features of the identified geotechnical layers.
The profiles obtained from static soundings were divided into smaller layers distinguished due to the averaged values of cone resistance qc. Ultimately, 6855 layers with a thickness in range from 0.10 to 15.5 m were obtained that were considered to be uniform in terms of parameters. Each time, weighted averages were used for statistical analysis; these refer to the thickness of the identified layers. A sample representative loess profile is shown in Figure 4.
The analysis allowed the authors to determine the typical values of the registered cone resistance qc and friction on the friction sleeve fs for particular facies. In the considerations, the friction on the friction sleeve was replaced by the Rf parameter (Equation (1)), which in practice is more often used to classify the type of soil based on the results of the CPT test.
In the paper, the authors focused on two main measurements from the cone penetration test without drawing a correlation with other interpreted parameters like soil stress history or OCR.
3. Results
Each of the CPT soundings was interpreted only in terms of loess soils. The older subsoil, below the loess deposits, was excluded from the analysis. The identified layers were assigned to the appropriate facies: aeolian, older aeolian, diluvial, older diluvial and alluvial. In terms of grain size distribution, these were mainly silts and sandy silts and, to a lesser extent, clayey silt and silty clay, and also very locally silty sand. The data are presented in intervals of 0.5 MPa.
3.1. Diluvial Facies
The data for the diluvial facies comprised 8.6% of the results. Loess diluvia are dark beige and brown clayey silts and silts. The distribution of qc values obtained from static tests is shown in Figure 5a. The results in the form of qc-Rf were plotted on Robertson’s classification chart (Figure 5b).
Within the diluvial facies, cone resistances fluctuated in the range from 0.3 to 7.0 MPa, with 81% of the results being values in the range from 0.3 to 4.0 MPa with a median of 2.6 MPa. The average cone resistance qc for this facies was 2.88 MPa with a standard deviation σ = 1.29 MPa. The average friction ratio was Rf = 3.77% with a standard deviation of 1.65%.
3.2. Older Diluvial Facies
Older diluvial facies constitutes the smallest sample. The soils with the total length of the tested profiles of 31.9 m were assigned to it, which in relation to the total length of the tests was only 0.4%. Older diluvia appeared in the form of interbeddings in the deeper parts of the subsoil, separating younger aeolian loess deposits from the older ones.
Cone resistances qc fluctuated in the range from 0.3 to 5.4 MPa, with 73% of the results being values in the range from 0.3 to 4.0 MPa with a median of 3.0 MPa. The average cone resistance qc for this facies was 3.11 MPa with a standard deviation σ = 1.13 MPa. The average friction ratio was Rf = 4.09% with a standard deviation of σ = 1.20%. Due to a relatively small sample, these data should be treated as illustrative in statistical terms. After collecting more data, changes in the distribution can be expected, which was suggested, inter alia, by the lack of results for the older diluvial facies in the qc range from 4.0 to 4.5 MPa. The above data are compiled in a diagram showing the distribution of qc values (Figure 6a) and on Robertson’s chart (Figure 6b)
3.3. Alluvial Facies
A total of 6.3% of the analyzed loess formations belong to the alluvial facies. This facies most often occurs in the deeper layers of the subsoil, in particular in areas of uplands. On the slopes and in dry valleys, alluvia are much shallower and are covered with only a small layer of typical loess soils. Alluvia had a significantly higher content of clay fraction and were classified as silty clay and clayey silt. For the most part, they were plasticized, and in CPTU soundings there was an increase in pore pressure u2.
Cone resistances qc fluctuated in the range from 0.3 to 10 MPa, with 72% of the results being values in the range from 0.3 to 4.0 MPa with a median of 2.7 MPa. The average cone resistance qc for this facies was 2.98 MPa with a standard deviation σ = 1.27 MPa. The average friction ratio was Rf = 4.68% with a standard deviation of σ = 1.62%. The data for alluvia were compiled in the diagram showing the distribution of qc values (Figure 7a) and on Robertson’s chart (Figure 7b).
3.4. Aeolian Facies—Typical Loess
The most numerous sample among the analyzed deposits is the typical loess of the aeolian facies. The total length of the tests within this facies was 6796.9 m, which was 81.0% of the total test run. The results discussed for this facies were therefore most representative. The influence of the cone used is also important. While in the light of the performed analyses [37] the difference in cone resistance qc was approximately 7%, the Rf values were more than twice as high when using a mechanical cone. Therefore, for the aeolian facies, the results taking into account Rf were additionally separated according to the type of cone.
Cone resistances qc fluctuated in the wide range from 0.9 to 23.6 MPa; however, 67% of the results were values in the range from 4.5 to 8.0 MPa with a median of 6.5 MPa. The average cone resistance qc for this facies was 6.68 MPa with a standard deviation σ = 2.15 MPa, with the average qc = 6.48 MPa for the electric cone (CPT/CPTU) and a standard deviation σ = 2.20 MPa and qc = 7.23 MPa for the mechanical cone (CPTM) and a standard deviation σ = 1.81 MPa. The average friction ratio was Rf = 2.44% with a standard deviation of σ = 0.65% for the electric cone (CPT/CPTU) and Rf = 4.48% with a standard deviation of σ = 1.12% for the mechanical cone (CPTM). The data for the aeolian facies were compiled in a diagram showing the distribution of qc values (Figure 8a) and on Robertson’s chart (Figure 8b).
3.5. Older Aeolian Facies
The total length of the tests within the older aeolian facies was 228.4 m, which was about 2.7% of the examined deposits. Cone resistance qc varied in a very wide range from 1.6 to 21.8 MPa. About 69% of the results were in the range from 6.0 to 11.5 MPa with a median of 8.7 MPa. The average cone resistance qc for this facies was 8.87 MPa with a standard deviation σ = 3.12 MPa. The average friction ratio was Rf = 2.82% with a standard deviation of σ = 0.86%. The data for the older aeolian facies were compiled in a diagram showing the distribution of qc values (Figure 9a) and on Robertson’s chart (Figure 9b).
4. Discussion
The obtained results allowed the authors to characterize loess soils from the Lublin area. Cumulative data from soundings are presented in the diagram (Figure 10), while Table 2 includes characteristic values of each loess facies. The analyzed data show that the vast majority of loess soils belong to the aeolian facies and its parameters were crucial for the foundation of building structures. The highest qc values were obtained for this facies. The diluvial and alluvial facies occurred to a much smaller extent and the obtained results constituted a similar percentage. It should be borne in mind that diluvia were found in the upper parts of the subsoil and this zone was included in each sounding. Alluvia were most often found in the deeper parts of the subsoil and not all of the soundings covered this zone. The same applies to the older aeolian facies, the parameters of which were only examined in some of the tests. According to the authors, the particular facies of the loess subsoil in the Lublin area were distributed as follows: aeolian facies in a range from 75 to 80%, alluvial facies in a range from 8 to 15% and diluvial facies in a range from 8 to 10%.
Most of the results obtained for the aeolian facies at the level of qc in range from 4.5 to 8.0 MPa indicate that these soils were a good load-bearing substrate for building structures. Cone resistances mostly at the level of 1.5–4.0 MPa for the diluvial and alluvial facies confirm that these facies constituted less favorable foundation conditions. The reduced resistance results mainly from the increased water content in ground pores. This results in lower soil strength, but above all in increased deformability. Cone resistances qc were the basis for the interpretation of the constrained modulus M. It is especially the soils of the diluvial facies that provide unfavorable foundation conditions, as they occur near the surface. The deeper alluvia were partially consolidated by the soils lying on them.
A common problem for loess is collapsibility [40,41,42,43,44]. Although this behavior is strongly associated with this soil, in practice it only affects a small part of it. According to the research by Frankowski [25], collapsible loess soils are solid loess from the aeolian facies whose cone resistance is qc < 3.0 MPa. This is an approximate criterion as the actual collapsibility test is performed with an oedometer. However, the oedometer test is performed on selected samples, and CPT sounding gives as many as 100 measurements per 1 m of the test. In the light of the presented research, only 3.0–4.0% of loess within Lublin may be collapsible. Despite the small range of collapsible loess, it is very important to perform CPT soundings in these soils. The diagrams of sounding parameters give a very good picture of the soil stiffness and make it possible to identify zones that are prone to collapsibility. As it can be seen, the dispersion of the cone resistance qc values is very high. The diagrams from CPT soundings are a very good basis for the development of geotechnical cross-sections for design purposes. It is not possible to develop a correct model of the loess subsoil based on the boreholes alone. An example of the division of the loess subsoil based on the results of static soundings is shown in Figure 11.
SBT charts (e.g., Robertson’s chart) classify soils in terms of their behavior and are widely used to interpret the soil profile [20,38,45,46,47]. For aeolian loess soils, Rf values most often range from 1.7 to 3.2%, which, with relatively high cone resistances qc, locates them in the area on the border between silty and sandy loess, and very often they are classified as sandy. Silt are soils classified on the border between cohesive and non-cohesive, and such soils are often referred to as “transitional”. SBT charts confirm that loess silt are transitional soils. Aeolian loess soils resemble non-cohesive deposits in their behavior, and the cohesion that occurs in them is largely the result of cementation with lime carbonate. Diluvial and alluvial loess soils are characterized by an increased content of clay fraction and are referred to as “clayey loess”. Rf values in the range from 2.8 to 6.2% and lower qc values locate the soils of this facies within clayey silt and silty clay. Moreover, increased pore water pressure u2 is observed within the alluvial facies.
5. Conclusions
The aim of the paper was to estimate the statistical distribution of the Lublin loess CPT results. The presented analysis is a continuation of previously published studies [12,37]; it provides an extended range of data and offers a division of results into particular facies. These data confirmed the previous findings and decreased the statistical error. Due to the large number of CPT records, each considerable Lublin loess facies was characterized and the values of parameters from static soundings were determined. The description of the characteristic features of facies allows for using future CPT results not only to find values of geotechnical parameters but also to determine loess soil genesis. The distribution of particular facies in the Lublin subsoil and the probability of the occurrence of collapsible loess soils constitute important findings of the study. After the analysis, it can be assumed that only 3.0–4.0% loess soils in Lublin can be collapsible. CPT and CPTU soundings provide a very large amount of data and should constitute the basic tool in loess subsoil identification. Moreover, apart from the numerical data, these tests provide a very good material for genetic classification, but the results should be correlated with the observations from boreholes and regional dependencies. Parameters from soundings may constitute both direct data for determining the bearing capacity of the subsoil and designing foundations, and the basis for deriving other parameters using conversion formulas. The main example of a parameter obtained using CPT records is constrained modulus that is essential for predicting building settlement. The obtained database enables not only predicting the settlement of a future building located on the loess subsoil but also the usefulness of the loess subsoil for civil engineering investments in general.
Author Contributions
Conceptualization, K.N.; Data curation, K.N.; Formal analysis, K.N. and A.L.; Investigation, K.N. and A.L.; Methodology, K.N.; Supervision, K.N.; Validation, K.N.; Visualization, A.L.; Writing—original draft, A.L.; Writing—review and editing, K.N. and A.L. All authors have read and agreed to the published version of the manuscript.
Funding
This research received no external funding.
Institutional Review Board Statement
Not applicable.
Informed Consent Statement
Not applicable.
Data Availability Statement
Not applicable.
Conflicts of Interest
The authors declare no conflict of interest.
References
- Malicki, A. Geneza i rozmieszczenie lessów w środkowej i wschodniej Polsce (The origin and distribution of loess in Central and Eastern Poland). Ann. UMCS Lublin 1949, IV, 195–228. [Google Scholar]
- Maruszczak, H. Definicja i klasyfikacja lessów oraz utworów lessopodobnych (Loess and loess-like soil definition and classification). Prz. Geol. 2000, 48, 580–586. [Google Scholar]
- Różycki, S.Z. Pyłowe Utwory Typu Lessowego na Świecie ich Występowanie i Geneza; Wydawnictwo Geologiczne: Warszawa, Poland, 1986; Volume LXXXV. [Google Scholar]
- Frankowski, Z. The influence of lithogenesis on physico-mechanical properties as determined by field methods. Prz. Geol. 1979, 27, 31–36. [Google Scholar]
- Jahn, A. Less, jego pochodzenie i związek z klimatem epoki lodowej (Loess, its genesis and conection with ice age climate). Acta Geol. Pol. 1950, 1, 257–302. [Google Scholar] [CrossRef]
- Malinowski, J. Badania Geologiczno-Inżynierskie Lessów (Geological-Engineering Loess Investigation); Wydawnictwo Geologiczne: Warszawa, Poland, 1971. [Google Scholar]
- Smalley, I.; Marković, S.B.; Svirčev, Z. Loess is [almost totally formed by] the accumulation of dust. Quat. Int. 2011, 240, 4–11. [Google Scholar] [CrossRef]
- Grahmann, R. Der Löss in Europa (The Loess in the Europe); Mitteilungen Gesellschaft für Erdkunde, Duncker & Humblot: Leipzig, Germany, 1931. [Google Scholar]
- Mojski, J.E. Podstawy podziału zlodowacenia północnopolskiego (Principles for division of the north-polish glaciation). Geol. Q. 1968, 12, 665–679. [Google Scholar]
- Pécsi, M. Lösse und lössartige Sedimente im Karpatenbecken und ihre lithostratigraphische Gliederung. Ptermanss Geogr. Mitteilungen 1966, 110, 176–189, 241–252. [Google Scholar]
- Tutkowskyj, P. K voprosu o sposobe obrazovaniy a lessa. Zemlevedeniye 1899, 6, 213–311. [Google Scholar]
- Nepelski, K. Numeryczne Modelowanie Pracy Konstukcji Posadowionej na Lessowym Podłożu Gruntowym. Rozprawa Doktorska (Numerical Modelling of the Behaviour of a Structure Situated on a Loess Subsoil). Ph.D. Thesis, Lublin University of Technology, Lublin, Poland, 2019. [Google Scholar]
- Kulhawy, F.H.; Mayne, P.W. Manual on Estimating Soil Properties for Foundation Design; OSTI.GOV: Oak Ridge, TN, USA, 1990.
- Mayne, P.W. Use of in-situ geotechnical tests for foundation systems. In Proceedings of the Széchy Károly Emlékkonferencia, Hungarian Geotechnical Society, Budapest, Hungary, 11 December 2020; pp. 12–73. [Google Scholar]
- Fellenius, B.H.; Eslami, A. Soil Profile Interpreted from CPTu data. In Proceedings of the “Year 2000 Geotechnics” Geotechnical Engineering Conference, Asian Institute of Technology, Bangkok, Thailand, 27–30 November 2000. [Google Scholar]
- Godlewski, T. Interpretacja badań polowych a Eurokod 7 (Interpretation of in situ tests vs. Eurokod 7). Acta Sci. Pol. Archit. 2013, 12, 61–72. [Google Scholar]
- Nepelski, K.; Rudko, M. Identyfikacja parametrów geotechnicznych lessów lubelskich na podstawie sondowań statycznych CPT (Identification of geotechnical parameters of Luboin loess subsoil based on CPT tests). Przegląd Nauk. Inżynieria Kształtowanie Sr. 2018, 27, 186–198. [Google Scholar] [CrossRef]
- Powell, J.J.M.; Lunne, T. Use of CPTU data in clays/fine grained soils. Stud. Geotech. Mech. 2005, 27, 29–66. [Google Scholar] [CrossRef]
- Rabarijoely, S. Evaluation of correlation between parameters from CPTU and DMT tests and soil type behavior chart. Ann. Warsaw Univ. Life Sci. SGGW. L. Reclam. 2019, 50, 313–326. [Google Scholar] [CrossRef]
- Robertson, P. Interpretation of cone penetration tests—A unified approach. Can. Geotech. J. 2009, 46, 1337–1355. [Google Scholar] [CrossRef] [Green Version]
- Robertson, P.K.; Campanella, R.G.; Gillespie, D.; Greig, J. Use of piezometer cone data. In Proceedings of the ASCE Specialty Conference on In Situ ’86: Use of In Situ Tests in Geotechnical Engineering, Blacksburg, VA, USA, 23–25 June 1986; pp. 1263–1280. [Google Scholar]
- Młynarek, Z.; Tschuschke, W.; Wierzbicki, J. Example of application of cone penetration test to shallow foundation design. Mater. 11 Kraj. Konf. Mech. Gruntów Fundam. 1997, 2, 119–126. [Google Scholar]
- Borowczyk, M.; Frankowski, Z. Zmienność właściwości geotechnicznych lessów w świetle współczesnych metod badań (Variability in geotechnic properties of loesses in the light of modern studies). Geol. Q. 1977, 23, 447–461. [Google Scholar]
- Borowczyk, M.; Frankowski, Z. Badania gruntow statyczną sondą wkręcaną (Soil studies with the use of static screw sound). Prz. Geol. 1978, 26, 374–380. [Google Scholar]
- Frankowski, Z.; Borowczyk, M. Wytyczne Wykonywania Badań Lessowych (The Loess Studies by Field Methods Guidelines); Instrukcje i Metody Badań Geologicznych: Warszawa, Poland, 1979. [Google Scholar]
- Młynarek, Z.; Wierzbicki, J.; Mańka, M. Geotechnical Parameters of Loess Soils from CPTU and SDMT. In Proceedings of the International Conference on the Flat Dilatometer DMT’15, Roma, Italy, 14–16 June 2015; pp. 481–489. [Google Scholar]
- Nepelski, K. Interpretation of CPT and SDMT tests for Lublin loess soils exemplified by Cyprysowa research site. Bud. Archit. 2020, 18, 063–072. [Google Scholar] [CrossRef] [Green Version]
- Mayne, P.W. Evaluating effective stress parameters and undrained shear strengths of soft-firm clays from CPTu and DMT. In Proceedings of the 5th International Conference on Geotechnical and Geophysical Site Characterisation, ISC 2016, Queensland, Australia, 5–9 September 2016; Volume 1, pp. 19–39. [Google Scholar]
- Młynarek, Z.; Wierzbicki, J.; Mańka, M. Moduły ściśliwości i ścinania lessów z badań CPTU i SDMT (Constrained deformation and shear moduli of loesses from CPTU and SDMT tests). Inżynieria Morska Geotech. 2015, nr 3, 193–199. [Google Scholar]
- Nepelski, K. Deformation Parameters of Lublin Loess Determined from CPTU, SDMT Tests and Menard Pressuremeter; Wydawnictwo Politechniki: Poznań, Poland, 2020; pp. 47–60. [Google Scholar]
- Nepelski, K.; Lal, A.; Franus, M. Analiza wyznaczania konsystencji lessów lubelskich na podstawie wyników sondowań statycznych CPT (The analysis of consistency evaluation of the loess in Lublin based on CPT tests). Bud. Archit. 2016, 15, 183–194. [Google Scholar] [CrossRef]
- Nepelski, K. A FEM analysis of the settlement of a tall building situated on loess subsoil. Open Eng. 2020, 10, 519–526. [Google Scholar] [CrossRef]
- Nepelski, K. Dobór parametrów modelu Cam-Clay dla podłoża lessowego na przykładzie analizy MES 3D budynku rozległego (Selection of cam-clay model parameters for loess subsoil as exemplified by a FEM 3D analysis of a wide building). ACTA Sci. Pol. Archit. Bud. 2020, 19, 67–81. [Google Scholar] [CrossRef]
- ISO. ISO 22476-1:2012 Geotechnical Investigation and Testing–Field Testing–Part 1: Electrical Cone and Piezocone Penetration Test; International Organization for Standardization: Geneva, Switzerland, 2012. [Google Scholar]
- ISO. PN-EN ISO 22476-12: 2009 Geotechnical Investigation And Testing–Field Testing–Part 12: Mechanical Cone Penetration Test (CPTM); International Organization for Standardization: Geneva, Switzerland, 2009. [Google Scholar]
- Briaud, J.L.; Miran, J. The Cone Penetrometer Test; Report No. FHWA-SA-91-043.FHA; Federal Highway Administration, Office of Technology Applications: Washington, DC, USA, 1992.
- Nepelski, K.; Lal, A.; Grzegorczyk, M. Comparative analysis of the CPT results obtained with the use of electric and mechanical penetrometer cone. In Proceedings of the XVII European Conference on Soil Mechanics and Geotechnical Engineering, Reykjavik, Iceland, 1–6 September 2019; pp. 1–7. [Google Scholar] [CrossRef]
- Robertson, P.K. Cone penetration test (CPT)-based soil behaviour type (SBT) classification system–An update. Can. Geotech. J. 2016, 53, 1910–1927. [Google Scholar] [CrossRef]
- Schmertmann, J.H. Guidelines for Cone Penetration Test, Performance, and Design; Report FHWA-TS-78-209; U.S. Federal Highway Administration: Washington, DC, USA, 1978; 145 p.
- Howayek, A.E.; Huang, P.-T.; Bisnett, R.; Santagata, M.C. Identification and Behavior of Collapsible Soils; Indiana Department of Transportation and Purdue University: West Lafayette, IN, USA, 2011; ISBN 1288284314. [Google Scholar]
- Lal, A. Research of the collapsibility of the European loess–review. Bud. Archit. 2019, 18, 5–10. [Google Scholar] [CrossRef]
- Luo, H.; Wu, F.; Chang, J.; Xu, J. Microstructural constraints on geotechnical properties of Malan Loess: A case study from Zhaojiaan landslide in Shaanxi province, China. Eng. Geol. 2018, 236, 60–69. [Google Scholar] [CrossRef]
- Miller, H.; Djerbib, Y.; Jefferson, I.F.; Smalley, I.J. Collapse Behaviour Of Loess Soils. In Proceedings of the in ISRM International Symposium, Melbourne, Australia, 19–24 November 2000. [Google Scholar]
- Pająk-Komorowska, A. Osiadanie zapadowe lessów Wzgórz Trzebnickich i Płaskowyżu Głubczyckiego (Collapsing losses of Wzgórza Trzebnickie and Płaskowyż Głubczycki). Geol. Proccedings Mater. Ogólnopolskie Symp. Współczesne Probl. Geol. Inżynierskiej Polsce Puszczykowo 2007, 11, 375–382. [Google Scholar]
- Abbaszadeh Shahri, A.; Malehmir, A.; Juhlin, C. Soil classification analysis based on piezocone penetration test data—A case study from a quick-clay landslide site in southwestern Sweden. Eng. Geol. 2015, 189, 32–47. [Google Scholar] [CrossRef]
- Mayne, P.W.; Saftner, D.; Dagger, R.; Dasenbrock, D. Cone Penetration Testing Manual for Highway Geotechnical Engineers; MnDOT Manual on CPT, Minnesota Department of Transportation: Duluth, MN, USA, 2019. [Google Scholar]
- Robertson, P.; Cabal, K.L. Guide to Cone Penetration Testing for Geotechnical Engineering; Gregg Drilling & Testing, Inc.: Signal Hill, CA, USA, 2015. [Google Scholar]
Figure 1.
Ideogram of the facial–genetic division of loess [2].
Figure 1.
Ideogram of the facial–genetic division of loess [2].
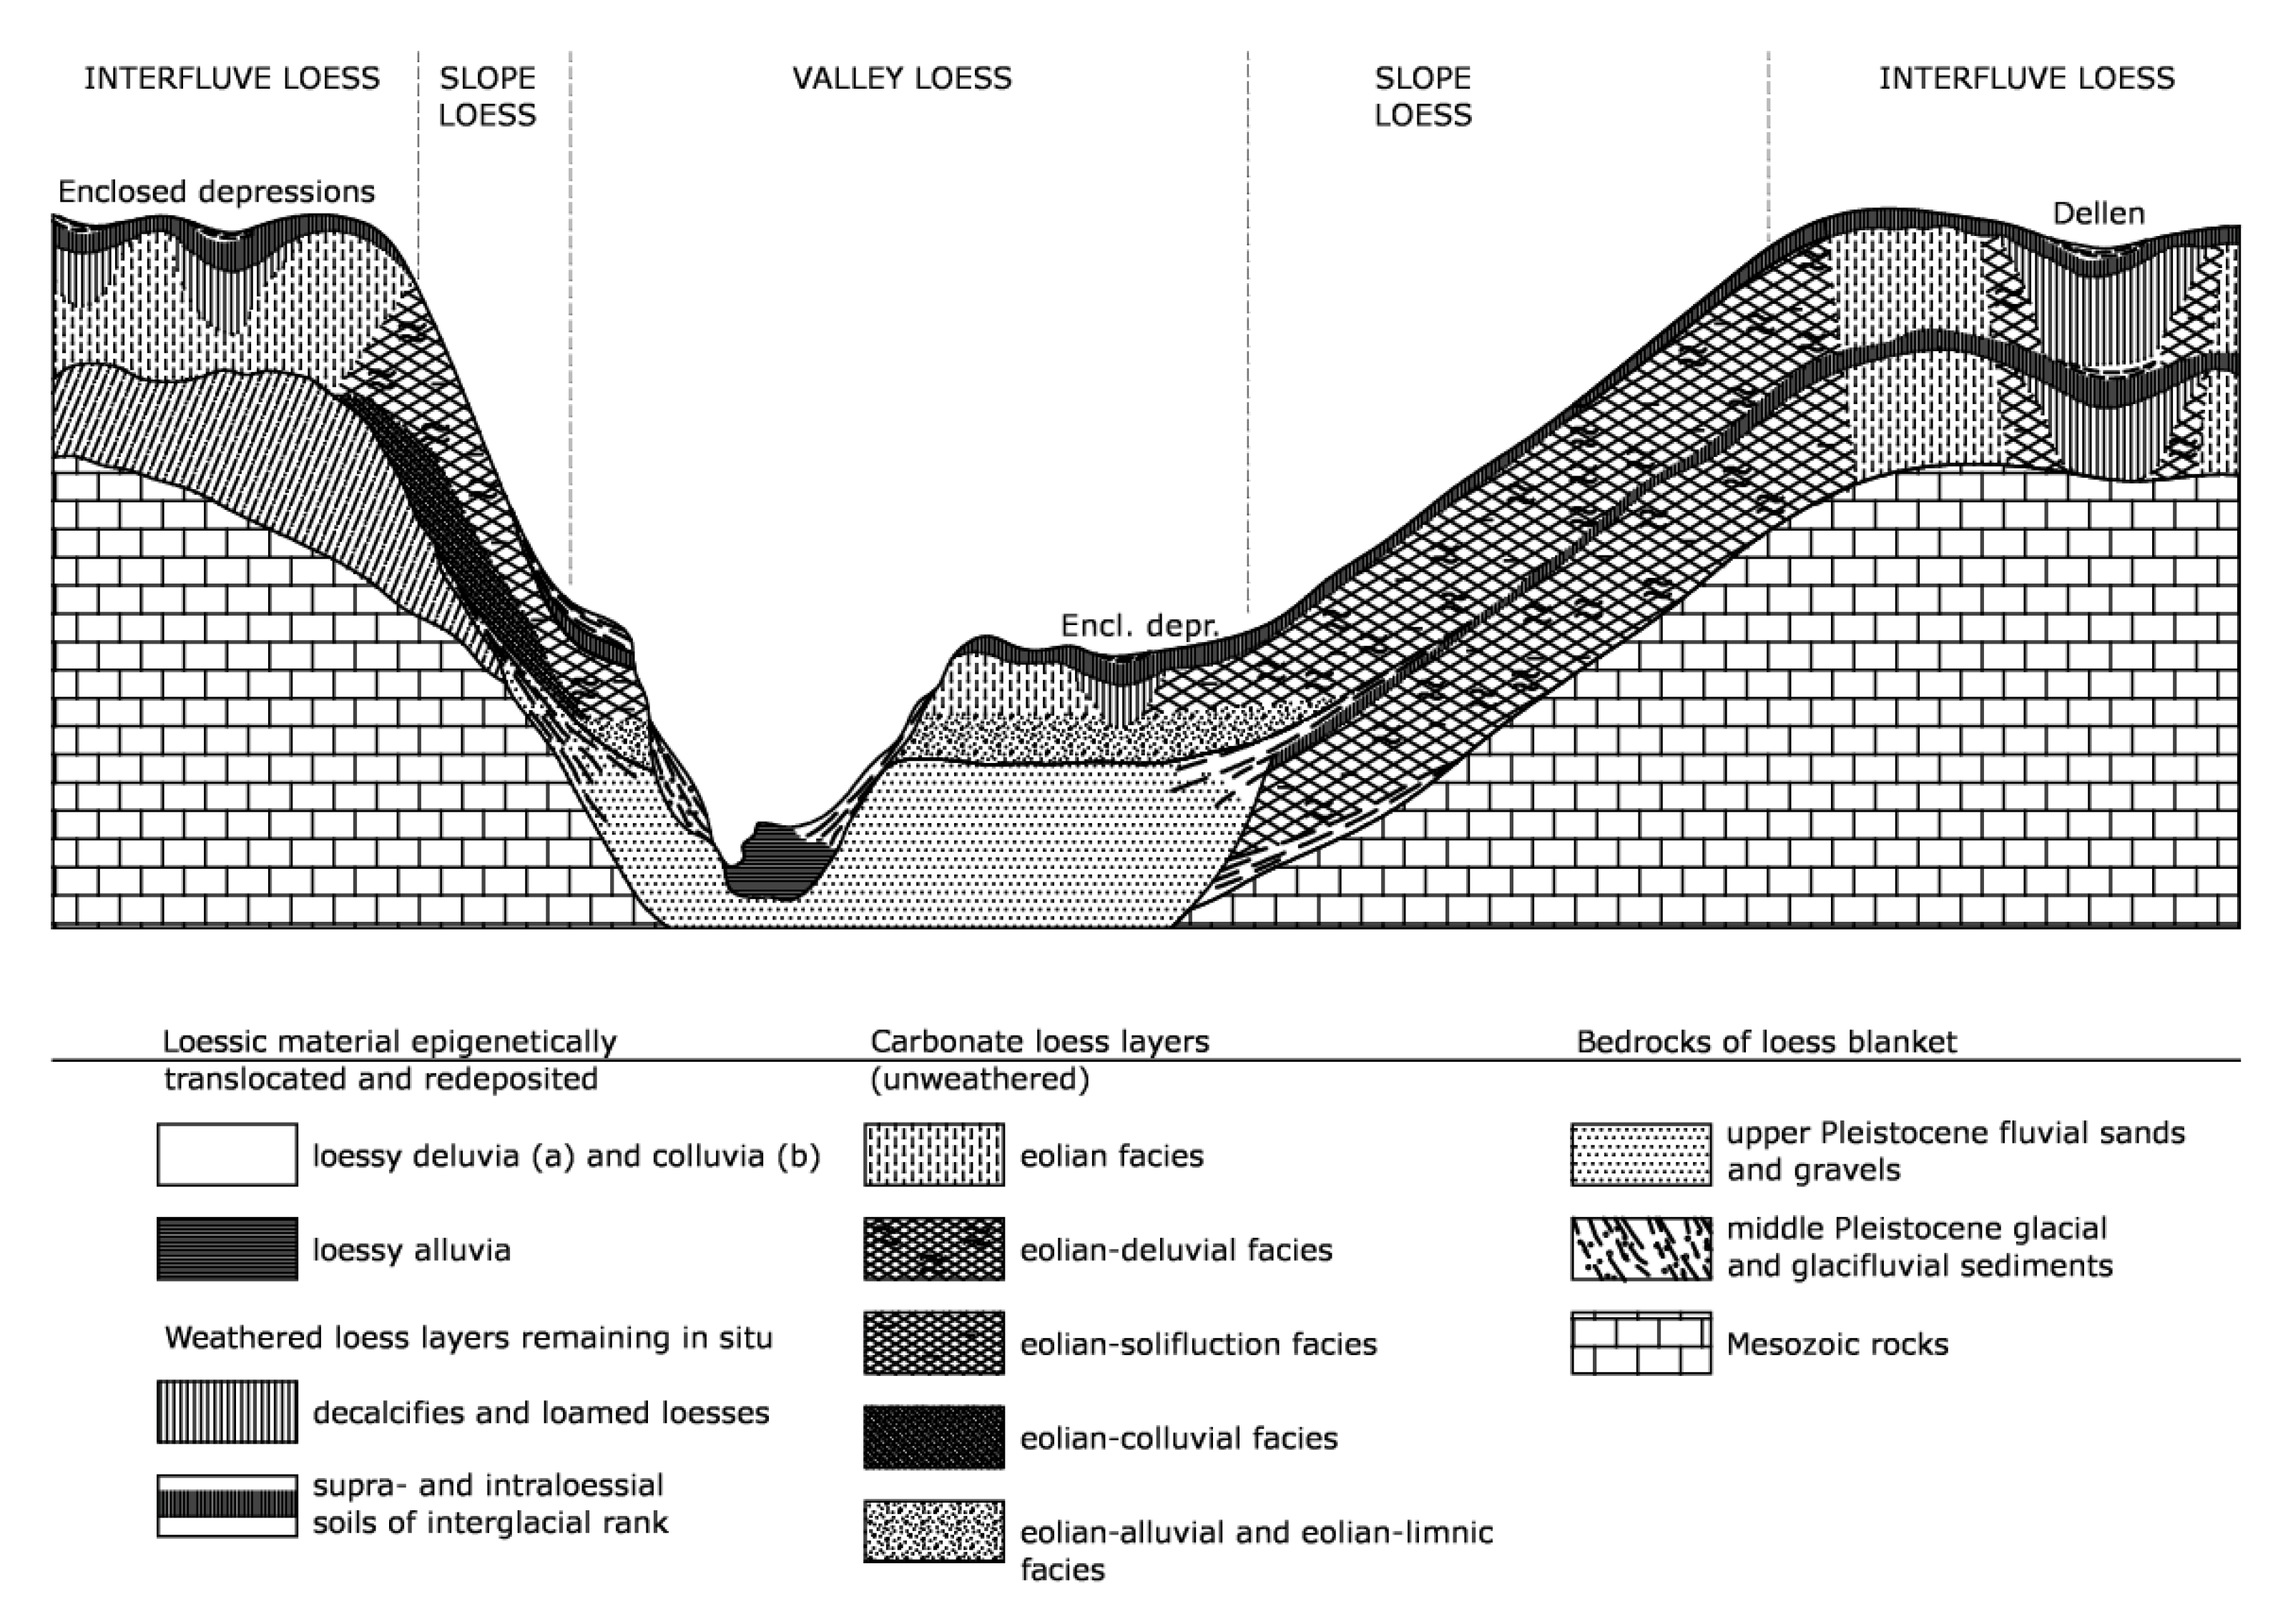
Figure 2.
Location of test points used to plot the subsoil cross-section.

Figure 3.
The geological structure of Lublin—a representative cross-section.

Figure 4.
Representative CPTU profile from the Lublin.

Figure 5.
Summary of results for the diluvial facies (a) distribution of qc values (b) sounding parameters plotted against Robertson’s chart (1—sensitive fine grained; 2—organic material; 3—clay; 4—silty clay to clay; 5—clayey silt to silty clay; 6—sandy silt to clayey silt; 7—silty sand to sandy silt; 8—sand to silty sand; 9—sand; 10—gravely sand to sand; 11—very silty fine grained; 12—sand to clayey sand; Dr—density ratio; OCR—overconsolidation ratio; Sf—sensitivity factor; e—void ratio).

Figure 6.
Summary of results for the older diluvial facies: (a) distribution of qc values and (b) sounding parameters plotted against Robertson’s chart (1—sensitive fine grained; 2—organic material; 3—clay; 4—silty clay to clay; 5—clayey silt to silty clay; 6—sandy silt to clayey silt; 7—silty sand to sandy silt; 8—sand to silty sand; 9—sand; 10—gravely sand to sand; 11—very silty fine grained; 12—sand to clayey sand; Dr—density ratio; OCR—overconsolidation ratio; Sf—sensitivity factor; e—void ratio).

Figure 7.
Summary of results for the alluvial facies: (a) distribution of qc values and (b) sounding parameters plotted against Robertson’s chart (1—sensitive fine grained; 2—organic material; 3—clay; 4—silty clay to clay; 5—clayey silt to silty clay; 6—sandy silt to clayey silt; 7—silty sand to sandy silt; 8—sand to silty sand; 9—sand; 10—gravely sand to sand; 11—very silty fine grained; 12—sand to clayey sand; Dr—density ratio; OCR—overconsolidation ratio; Sf—sensitivity factor; e—void ratio).

Figure 8.
Summary of results for the aeolian facies: (a) distribution of qc values and (b) sounding parameters plotted against Robertson’s chart (1—sensitive fine grained; 2—organic material; 3—clay; 4—silty clay to clay; 5—clayey silt to silty clay; 6—sandy silt to clayey silt; 7—silty sand to sandy silt; 8—sand to silty sand; 9—sand; 10—gravely sand to sand; 11—very silty fine grained; 12—sand to clayey sand; Dr—density ratio; OCR—overconsolidation ratio; Sf—sensitivity factor; e—void ratio).

Figure 9.
Summary of results for the older aeolian facies: (a) distribution of qc values and (b) sounding parameters plotted against Robertson’s chart (1—sensitive fine grained; 2—organic material; 3—clay; 4—silty clay to clay; 5—clayey silt to silty clay; 6—sandy silt to clayey silt; 7—silty sand to sandy silt; 8—sand to silty sand; 9—sand; 10—gravely sand to sand; 11—very silty fine grained; 12—sand to clayey sand; Dr—density ratio; OCR—overconsolidation ratio; Sf—sensitivity factor; e—void ratio).

Figure 10.
Distribution of qc values from CPT static soundings in the Lublin area with division into facies.
Figure 10.
Distribution of qc values from CPT static soundings in the Lublin area with division into facies.

Figure 11.
Geotechnical cross-section developed on the basis of CPTU soundings.


Table 1.
Division of loess according to Maruszczak [2].
Table 1.
Division of loess according to Maruszczak [2].
| Granular Type of the Loess | Facies Type of the Loess | Landform Type of the Loess |
|---|---|---|
|
|
|
Table 2.
Characteristic values of CPTU parameters for loess facies.
| Characteristic Values | qc,mean/σ (MPa) | Rf,mean/σ (%) | u2 | |
|---|---|---|---|---|
| Facies | ||||
| Diluvial (younger) | 2.88/1.29 | 3.77/1.65 | close to zero | |
| Diluvial (older) | 3.11/1.13 | 4.09/1.20 | >0 kPa | |
| Alluvial | 2.98/1.27 | 4.68/1.62 | >0 kPa | |
| Aeolian (mechanical cone) | 7.23/1.81 | 4.48/1.12 | - | |
| Aeolian (electric cone) | 6.48/2.20 | 2.44/0.65 | close to zero or slightly negative | |
| Aeolian (older) | 8.87/3.12 | 2.82/0.86 | ||
Publisher’s Note: MDPI stays neutral with regard to jurisdictional claims in published maps and institutional affiliations. |
© 2021 by the authors. Licensee MDPI, Basel, Switzerland. This article is an open access article distributed under the terms and conditions of the Creative Commons Attribution (CC BY) license (https://creativecommons.org/licenses/by/4.0/).
Share and Cite
MDPI and ACS Style
Nepelski, K.; Lal, A. CPT Parameters of Loess Subsoil in Lublin Area. Appl. Sci. 2021, 11, 6020. https://doi.org/10.3390/app11136020
AMA Style
Nepelski K, Lal A. CPT Parameters of Loess Subsoil in Lublin Area. Applied Sciences. 2021; 11(13):6020. https://doi.org/10.3390/app11136020
Chicago/Turabian StyleNepelski, Krzysztof, and Agnieszka Lal. 2021. "CPT Parameters of Loess Subsoil in Lublin Area" Applied Sciences 11, no. 13: 6020. https://doi.org/10.3390/app11136020
Note that from the first issue of 2016, this journal uses article numbers instead of page numbers. See further details here.