Article

Online Prognosis of Bimodal Crack Evolution for Fatigue Life Prediction of Composite Laminates Using Particle Filters

by
Karkulali Pugalenthi
1,
Pham Luu Trung Duong
1,
Jaehyeok Doh
2,
Shaista Hussain
3,
Mark Hyunpong Jhon
3 and
Nagarajan Raghavan
1,*
1
Engineering Product Development (EPD) Pillar, Singapore University of Technology & Design (SUTD), 8 Somapah Road, Singapore 487 372, Singapore
2
School of Mechanical Engineering, Gyeongsang National University, Jinju 52725, Korea
3
Institute of High Performance Computing (IHPC), A*STAR, Fusionopolis Way, Singapore 138 632, Singapore
*
Author to whom correspondence should be addressed.
Appl. Sci. 2021, 11(13), 6046; https://doi.org/10.3390/app11136046
Submission received: 21 May 2021 / Revised: 18 June 2021 / Accepted: 24 June 2021 / Published: 29 June 2021

Abstract

:
Composite materials are extensively used in aircraft structures, wherein they are subjected to cyclic loads and subsequently impact-induced damages. Progressive fatigue degradation can lead to catastrophic failure. This highlights the need for an efficient prognostic framework to predict crack propagation in the field of structural health monitoring (SHM) of composite structures to improve functional safety and reliability. However, achieving good accuracy in crack growth prediction is challenging due to uncertainties in the material properties, loading conditions, and environmental factors. This paper presents a particle-filter-based online prognostic framework for damage prognosis of composite laminates due to crack-induced delamination and fiber breakage. An optimized Paris law model is used to describe the damage propagation in glass-fiber-reinforced polymer (GFRP) laminates subject to low-velocity impacts. Our proposed methodology deduces the jump energy/inflection point online wherein the damage growth switches from rapid degradation to slow degradation. The prediction results obtained are compared with the conventional Paris law model to validate the need for an optimized bimodal crack growth propagation model. The root mean square error (RMSE) and remaining useful life (RUL) prediction errors are used as the prognostic metrics.

1. Introduction

Composite materials are extensively used in advanced engineering structures such as aircrafts, automobiles, manufacturing equipment, and civil infrastructures due to their high strength-to-weight ratio and high corrosion resistance. However, these materials are susceptible to structural deterioration due to aging or fatigue, which can eventually even lead to structural failure. Hence, adopting advanced maintenance strategies to diagnose and prognose such failures is imperative. Extensive studies have been carried out to categorize different types of damages in composite materials such as cracks, delamination, matrix cracking, and fiber breakage damages, along with development of physical/phenomenological damage evolution models incorporating the above-mentioned damages for fatigue life prediction [1,2,3,4].
For composite structures, damage prognosis is very challenging as fatigue in composite materials is influenced by several complex internal fracture events. The inherent complexity of composite materials makes the formulation of accurate degradation models onerous. An effective prognostic method should possess the ability to handle process stochasticity and predict the remaining useful life of materials. In general, damage prognosis methodologies are broadly categorized as physics-based, data-driven, and hybrid methods. Physics-based methods rely on mathematical/physical models formulated by understanding the root cause of the underlying failure mechanisms. These models help to forecast the failure progression by estimating the model parameters. The accuracy of the model-based methods depends on the relevance of the physical model (and its inherent assumptions and hypothesis) that best describes the failure/degradation mechanism.
In literature, there are several research works on probability-based methods for structural prognosis. Bayesian estimation techniques are popular choices for prognosis for non-linear components/devices owing to their ability to address uncertainties. Additionally, Bayesian estimation methods do not make assumptions of linearity and Gaussian noise [5,6]. To list a few, Chiachio et al. [7] considered two degradation parameters, namely, micro-crack density and stiffness loss simultaneously, and formulated a damage propagation model for the composite laminate structures. Subsequently, a particle-filter-based prognostic approach with stochastic embedding was used to deduce the remaining useful life (RUL). The proposed methodology was tested on data collected from run-to-failure tension-tension experiments on carbon-fiber-reinforced polymer (CFRP) cross-ply laminates. The authors further extended their work to address the model uncertainty by choosing five different candidate models [8]. These models were parameterized using global sensitivity analysis and then ranked based on the accuracy of predictions using a Bayesian framework. The authors concluded from their investigation that a simple shear-lag model was the most effective. Similarly, Nguyen et al. [9] considered four different degradation models for fatigue crack growth: Paris–Erdogan, polynomial, global function-based, and curve fitting models. The authors proposed an ensemble strategy to combine all the four degradation models using Best–Worst Weighted Vote (BWWV) strategy and then predicted the remaining fatigue life using the particle filter framework once again. However, their methodology has not been tested and validated on a real dataset to evaluate its robustness and prediction accuracy.
In contrast, data-driven methods rely on available condition monitoring data and do not require any physical model for RUL prediction. In other words, data-driven methods do not require knowledge of the underlying degradation mechanisms. They identify features and characteristics that define the damage initiation and degradation process and use that information to predict the future state of the system. In short, data-driven methods aim to model the non-linear relationship between the system behavior, the aging process, condition monitoring data, and RUL.
To mention a few, Loutas et al. [10] proposed a data-driven probabilistic framework for RUL prediction of composite materials. The real-time degradation data of composite materials under different loading conditions was obtained based on acoustic emission data. A Non-Homogeneous Hidden Semi Markov Model (NHHSMM) and a Bayesian version of Feedforward Neural Networks (BFFNN) were used for the purpose of RUL prediction. In both the methods, sufficient amount of historical training data was required to train the model. The authors concluded that the NHHSMM method performed better in terms of accuracy. They also suggested that the accuracy of BFFNN can be further improved with a larger amount of training data used for training the neural network model with all possible failure mechanisms incorporated into it. However, obtaining such an extensive dataset would be challenging, especially for mechanical failure modes that involve crack nucleation and growth. Another study by Chen et al. [11] addressed the issue of correlating the extracted features from the degradation data to that of the crack size, inclusive of the uncertainties due to damage geometries, sensor placement, and boundary conditions. In order to achieve this, the authors used a Gaussian process measurement model within a particle filter-based framework. When a new sensor signal is available from the target structure, the measurement model is updated online, and the updated model parameters are used to predict the next state. The proposed methodology was tested on fatigue data from an attachment lug made of LY12 aluminum. Even though the proposed method proves to be effective for online prognostic applications, the results indicate a large prediction error in the early cycles. The prediction error decreases to 3% after more than 20,000 cycles, and hence adequate modifications are required to reduce the prediction error in the initial stages of degradation.
Based on most of the studies in literature in the field of Structural Health Management (SHM), the Paris–Erdogan model is the most popular damage evolution model used to quantify the evolution of crack growth. The Paris model is extensively used for prognosis of crack growth in other systems as well such as defect propagation in rolling element bearings [12,13,14], wind turbine blades [15,16,17], and flight control actuators [18,19]. However, the crack growth behavior in all the aforementioned works has been approximated ignoring the uncertainties due to material properties, environmental conditions, and cyclic mechanical loads. Abdessalem et al. [20,21] considered the above-mentioned uncertainties and categorized the fatigue crack growth trend into two regimes, namely, crack initiation and crack growth. In the first regime, a micro-crack is triggered due to material surface qualities such as surface irregularities, surface damage, and inhomogeneities. Subsequently in the second regime, the crack grows depending on the applied load and mechanical properties etc. Thus, it is important to model both the regimes and determine the regime-switching transition zone or period to be able to deduce the remaining fatigue life more accurately. The authors in Refs. [20,21] used a piecewise-deterministic Markov process to combine the Paris model describing the initial stable region of crack propagation and the Forman law model describing the subsequent rapid crack propagation regime.
Taking the work of Abdessalem et al. [21] as a motivation, Banerjee et al. [22] proposed a two-stage damage propagation model for determining the delamination growth area in glass-fiber-reinforced polymer (GFRP) due to low-velocity impacts. The authors used an optical transmission scanning (OTS) method to examine the delamination growth due to repeated low velocity impacts. The damage area was found to increase rapidly in the first few impacts and slow down beyond a particular threshold. Therefore, the damage propagation was divided into two regions. Paris model was used to represent both the regions with different set of parameters without changing the underlying failure mechanism. The particle filter framework was used for predicting the future degradation state. The slope difference between the last two predicted values was evaluated, and the jump energy was determined to be at the instant where the slope difference was maximum. Therefore, the prediction accuracy primarily depends on the initial distribution of the jump energy, and a minimum of seven measurements were needed to deduce the jump energy. The model proved to be inaccurate in the first region, and the prediction accuracy improved only in the second region, with more measurement data being available to capture the degradation trend better. Since the methodology proposed in Refs. [22,23] is a promising approach for long-term reliability studies and real-time applications, we have adopted their methodology and intend to further improve upon it.
The aim of this paper is therefore to perform an online prognostic study on the GFRP laminate delamination growth. We propose a prognostic framework wherein the jump energy is deduced on the go and also the initial distribution for the damage state is varied depending on the measurement data available from the sensor. The novelty of the proposed prognostic framework lies in its ability to deduce the point of inflection from rapid to slow crack propagation on the fly. This approach provides an advantage for damage prognosis of composite materials wherein multiple failure mechanisms coexist and very limited knowledge of the underlying failure mechanism is available for the purpose of remaining fatigue life estimation. We intend to compare our prediction results with that of Ref. [22] and validate the effectiveness of our proposed method.
The paper is organized as follows: Section 2 describes the degradation data used in this study along with an appropriate damage propagation model which best represents the degradation data. A particle-filter-based prognostic framework is also explained along with the proposed online prognostic framework adopted in this study. Section 3 compares the prediction results obtained from the optimized Paris–Paris model to that of the conventional Paris model using the proposed methodology. Section 4 compares the prediction results between the proposed method and the results from Ref. [22]. Lastly, the final section of the study provides some concluding remarks along with possible suggestions for future work.

2. Proposed Prognostic Framework

2.1. Degradation Dataset

Mechanical systems are subjected to repeated cyclic loading under real-time scenarios which leads to failure over time. When the structure is subjected to cyclic loading, stress gets concentrated at the location of impact, resulting in a crack. Even though the crack propagates at a slow rate, it can eventually lead to failure of the structure. Therefore, it is essential to monitor the structure for crack propagation and ensure proper maintenance strategies are adopted to improve the lifetime of the mechanical structure. Many researchers are focusing on understanding the fatigue mechanisms of composite materials used in mechanical structures to achieve higher reliability and accurate damage prognosis.
Banerjee et al. [22] assessed the delamination growth in GFRP materials using an optical transmission system (OTS). The OTS setup used by the authors comprised a laser source and a photodetector. The GFRP samples were illuminated using the laser source, and the photodetector recorded the power transmitted through the samples. In the presence of deformities in the sample such as delamination (air gap), the transmitted radiation gets altered. The images obtained from the OTS setup were analyzed comparing a healthy sample and an impacted sample. The authors further adopted advanced signal processing methods to obtain the damage growth trend of the impacted samples shown in Figure 1. Here, three eight layered S2 GFRP laminates were subjected to repeated cycles of low-velocity impacts. Of the three laminates, one was subject to 15 impacts and scanned at every interval using the OTS technique. All the fifteen scans were processed using image segmentation, and the delamination severity was categorized as 1, 2, and 3+.
The extracted trend of damage growth area with respect to the cumulative impact energy of sample S1 (defined as the summation of energy transferred from all the impact cycles; note, however, that the incremental change in impact energy for every additional impact cycle is not constant, which is why the artificial unit of “time” here is “impact energy” and not number of cycles) is shown in Figure 1. It is evident from Figure 1 that the crack nucleation, growth, and delamination process have two distinct regions and the knee point (change point) falls at 20 J for all the three cases. The authors considered the initial distribution of jump energy based on the experimental data. However, the jump energy can vary for other specimens or if the sequence of low-velocity impacts is altered. In order to overcome this drawback, we intend to perform an online prognostic study on this data and deduce the jump energy online and also estimate the remaining useful life.

2.2. Damage Propagation Model

The rate of growth of a fatigue crack can be expressed using the Paris–Erdogan equation as:
d a d N = C ( Δ K ) m
Δ K = Y π a
where a is the crack size, d a d N is the crack growth rate per load/impact, N is the cumulative impact/load, m and C are Paris model parameters, Δ K is the range of stress intensity factor, and Y is a dimensionless constant for a given stress range. The Paris model expressed in Equation (1) can be rewritten as a state transition function by Equation (3):
a k = C k ( Y π a k 1 ) m k   d N + a k 1
where k is the impact index at which the sample is scanned using the OTS technique and a k represents the damage state.
Since the damage growth area was split into two regions, two different exponential models with different parameters are necessary to represent the damage propagation. Hence Equation (3) is modified as:
a k = { C 1 k ( Y π a k 1 ) m 1 k   d N + a k 1 ;   i f   N k N C 2 k ( Y π a k 1 ) m 2 k   d N + a k 1 ;   i f   N k N
where N k is the current cumulative impact energy and N is the threshold jump energy beyond, which the temporal dynamics of damage area evolution turn into Region 2.

2.3. Particle Filter Based Prognosis

Particle filters (PF) or Sequential Monte Carlo (SMC) methods are based on Bayesian inference and are widely used in the field of Prognostics and Health Management (PHM). The main advantage of PFs is that they can be readily applied to non-linear systems with non-Gaussian noise present in them. The basic idea of PFs is to represent the unknown model parameters by a set of weighted particles that describe the state of the system. The particle weights are recursively updated using Bayes theorem. The state space model of the system used in PFs can be represented as:
a k = f k ( a k 1 , v k 1 )
z k = h ( a k , n k )
where k is the impact index at which the sample is scanned using the OTS technique; a k and a k 1 represents the current and previous damage states respectively; v k 1 and n k represent the process and measurement noise, respectively; and z k represents the new measurement data. The state-transition function f ( . ) contains information about the damage propagation model, and h (.) represents the measurement function that provides the mapping between the damage state and the new measurement data. The PF algorithm estimates the damage evolution process in two steps.

2.3.1. State Estimation

At the k = 1 step, number of samples/particles are drawn from the initial prior distribution. The initial prior distribution is assumed based on the user’s knowledge of the underlying failure mechanism. For subsequent time steps, the posterior distribution of the ( k 1 ) th step is used as the prior distribution of the current time instant k .
p ( a k | z 1 : k 1 ) =   p ( a k | a k 1 ) p ( a k 1 | z 1 : k 1 ) d a k 1
At time k , when new measurement data are available, the posterior distribution obtained is expressed as
p ( a k | z 1 : k ) = p ( z k | a k ) p ( a | z 1 : k 1 )   p ( z k | a k ) p ( a k | z 1 : k 1 ) d a k
Assuming that the measurement noise n k is normally distributed, the likelihood function can be expressed as
L ( z k | a k i , m k i , C k i ) = 1 z k 2 π δ k i e x p [ 1 2 [ l n z k λ k i δ k i ] 2 ]
where
  δ k i = l n [ 1 + [ σ a k i ( m k i , C k i ) ] 2 ]
and
λ k i = l n [ a k i ( m k i , C k i ) ] 1 2 ( δ k i ) 2

2.3.2. Prognosis

After the model parameters are estimated, the future state of the system is predicted by projecting these model parameters using the damage propagation model till a certain failure threshold is reached. The remaining useful life of the system is then estimated by:
R U L k = N E O L N k
where   N E O L is the overall impact energy corresponding to end-of-life of the system and N k is the current cumulative impact energy transferred to the sample under stress test.

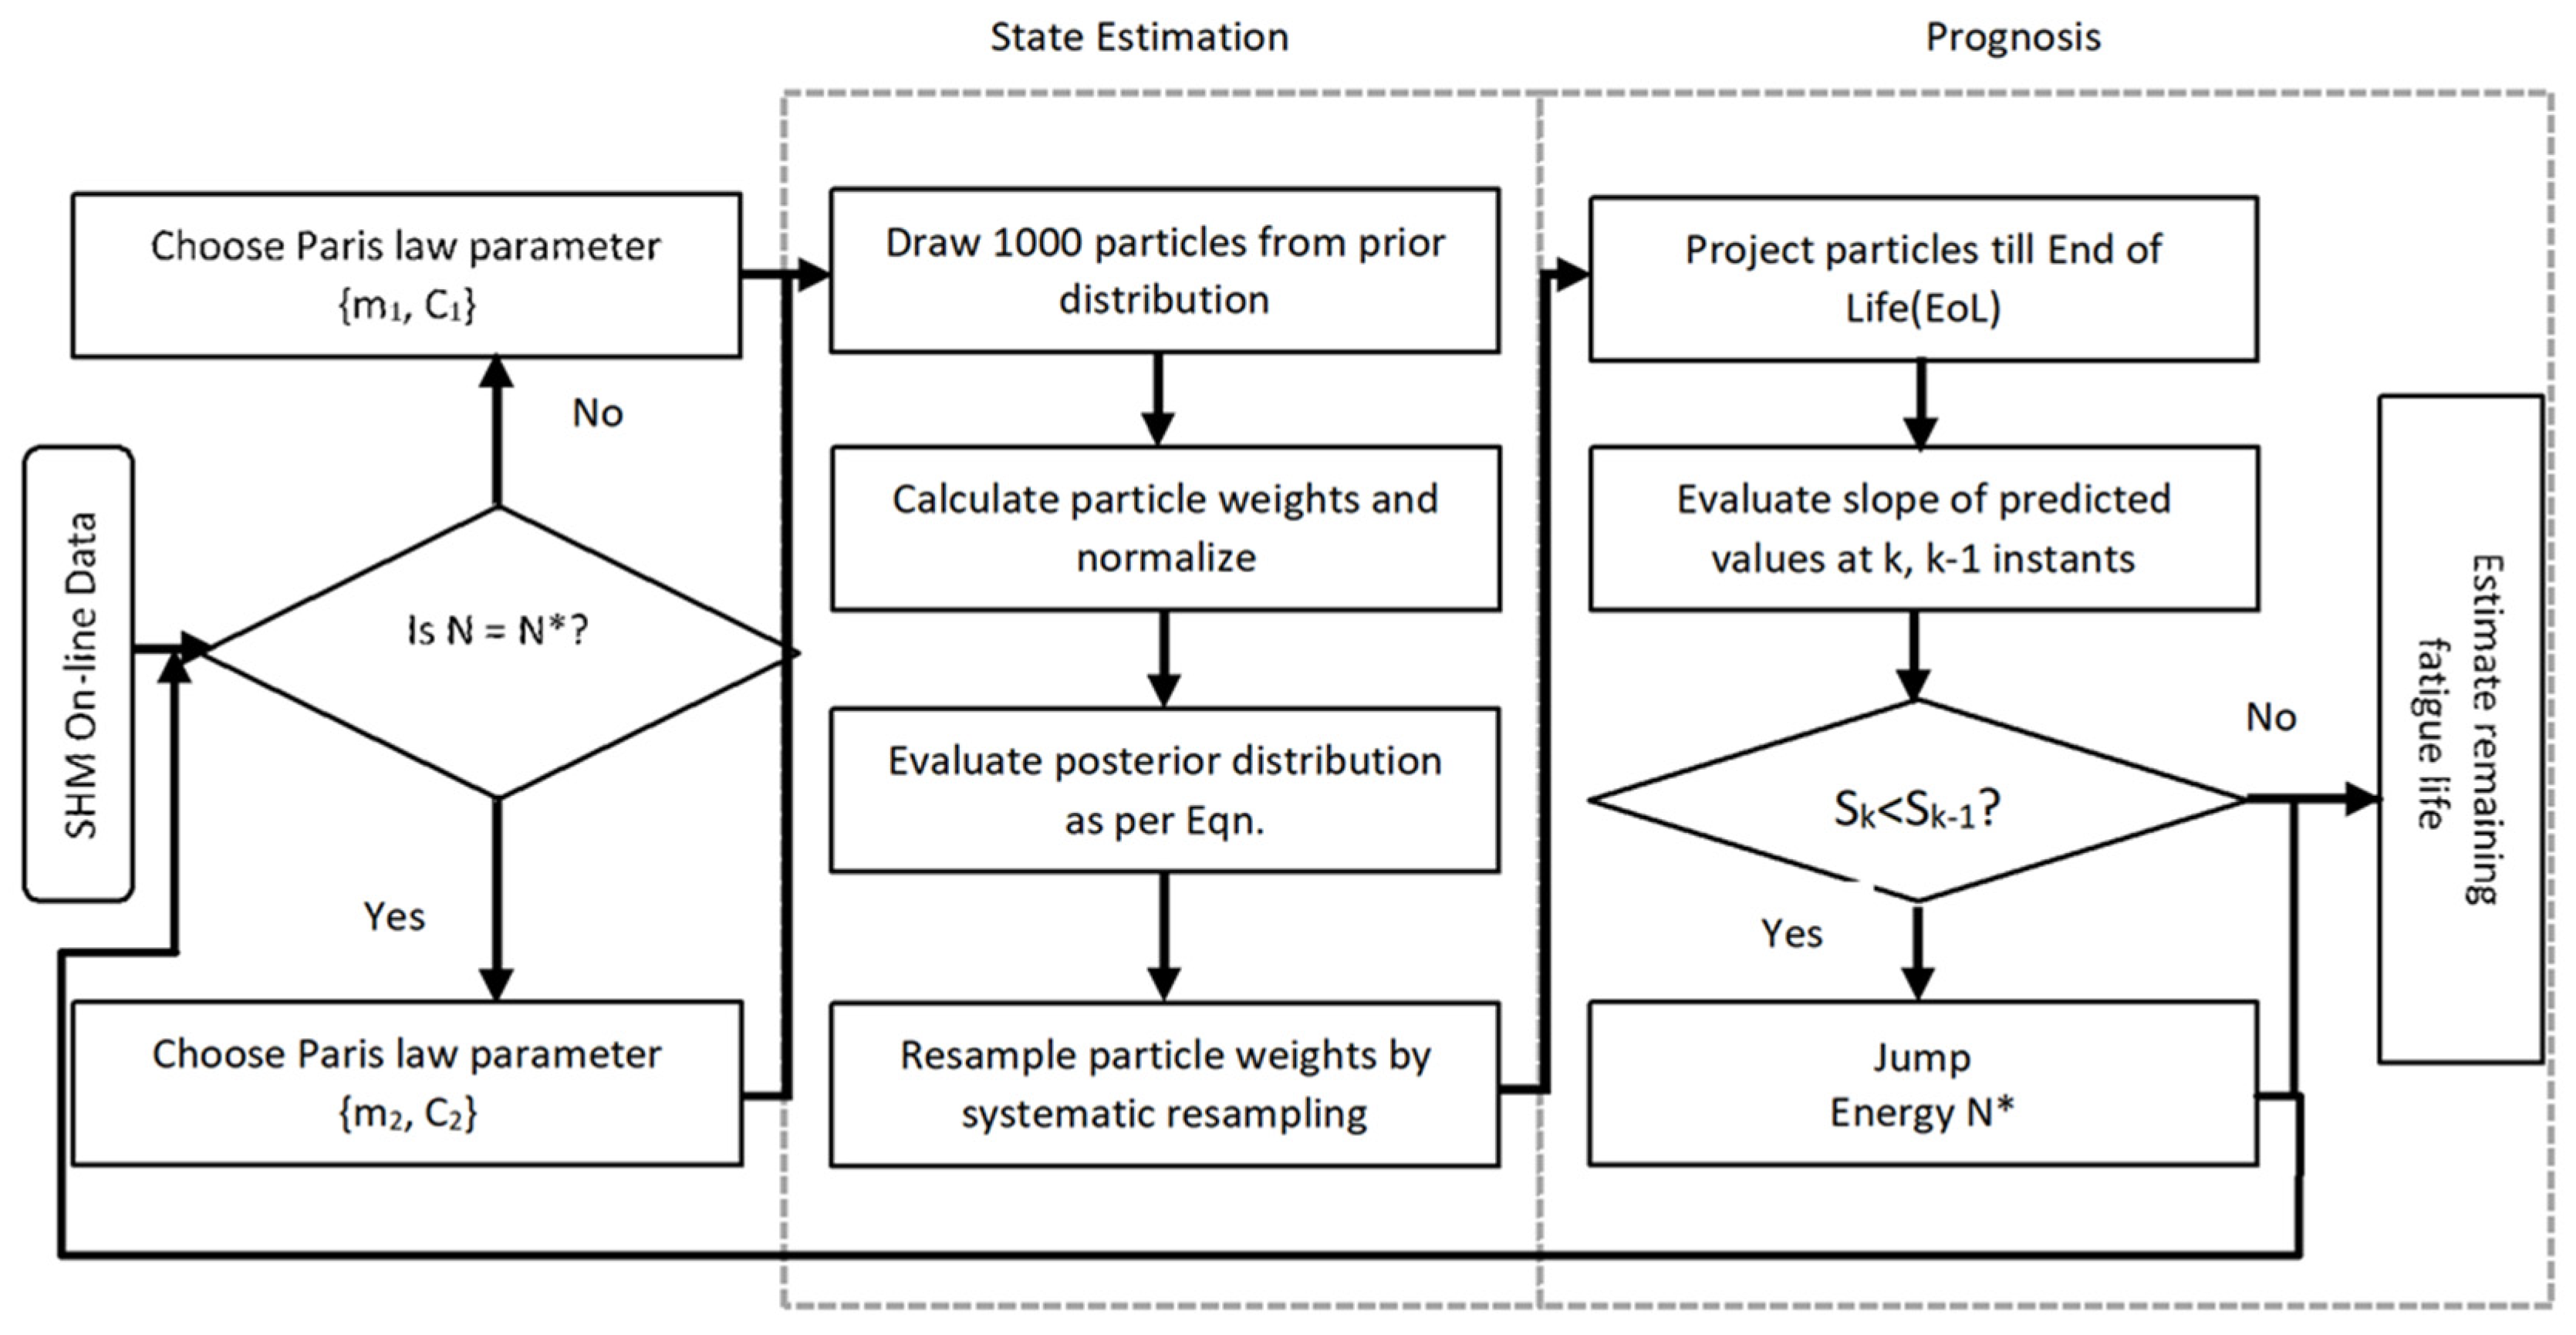
2.4. Online Real-Time Prognostic Framework

The overall flow of the proposed online prognostic framework using particle filter algorithm is shown in Figure 2. When a minimum of two new measurement datapoints are available post image segmentation, the prediction algorithm begins to predict the damage evolution due to delamination. The Paris law parameters for both the regions in Figure 1 are represented as (m1, C1) and (m2, C2), respectively.
When a new measurement data is available for prediction, the algorithm evaluates whether the cumulative impact energy, N k , crosses the jump energy so as to choose different Paris law parameters. The slope of the predicted values at every measurement cycle was calculated and compared with the slope of the previous prediction instant. The initial slope value was assumed to be zero. The time instant at which the current slope value was found to be less than the previous time instant slope values was assumed to be the jump energy and can be expressed as:
N :   a k a k 1   N k N k 1 < a k 1 a k 2   N k 1 N k 2
As per Equation (13), the jump energy N* is deterministic. Once the jump energy is detected, the algorithms identify that the second region of the degradation has kicked in and switches the Paris law parameters from (m1, C1) to (m2, C2).
A particle-filter-based prognostic framework was employed to predict the damage evolution. Based on Ref. [22], the initial distributions for the parameters were assumed to be
m1 ∼ U (0,4.05), C1 ∼ U (−22.33,0)
m2 ∼ U (0,3.6), C2 ∼ U (−22.2,0)
The initial parameter distribution for the damage stage was assumed to vary online between the current measurement data available for prediction and zero as shown below.
a 0     U   ( z k , 0 )
The proposed framework is an extension of the methods adopted in Ref. [22]. For simplicity, we label the method/results used in Ref. [22] as M1. In M1, jump energy, N*, was found to be 20 J based on the experimental results. Additionally, the damage growth curves of three different GFRP samples were analyzed, and mean and sample variance were used to define the initial parameter distribution for jump energy, which was used in the particle filter algorithm. In our proposed method, since we perform an online prognostic study, the jump energy is deduced on-the-fly based on the predicted damage area. Hence, the proposed method overcomes the dependency on the initial distribution of jump energy compared to M1 and can easily be applied to samples that have a different damage area propagation trend (trace) than Sample S1 used in this work. Based on the initial parameter distribution, the model parameters were estimated using the particle filtering framework and the damage state was projected from the current state till the end of life (EOL) of the sample to estimate the remaining useful life (RUL).

3. Results and Discussion

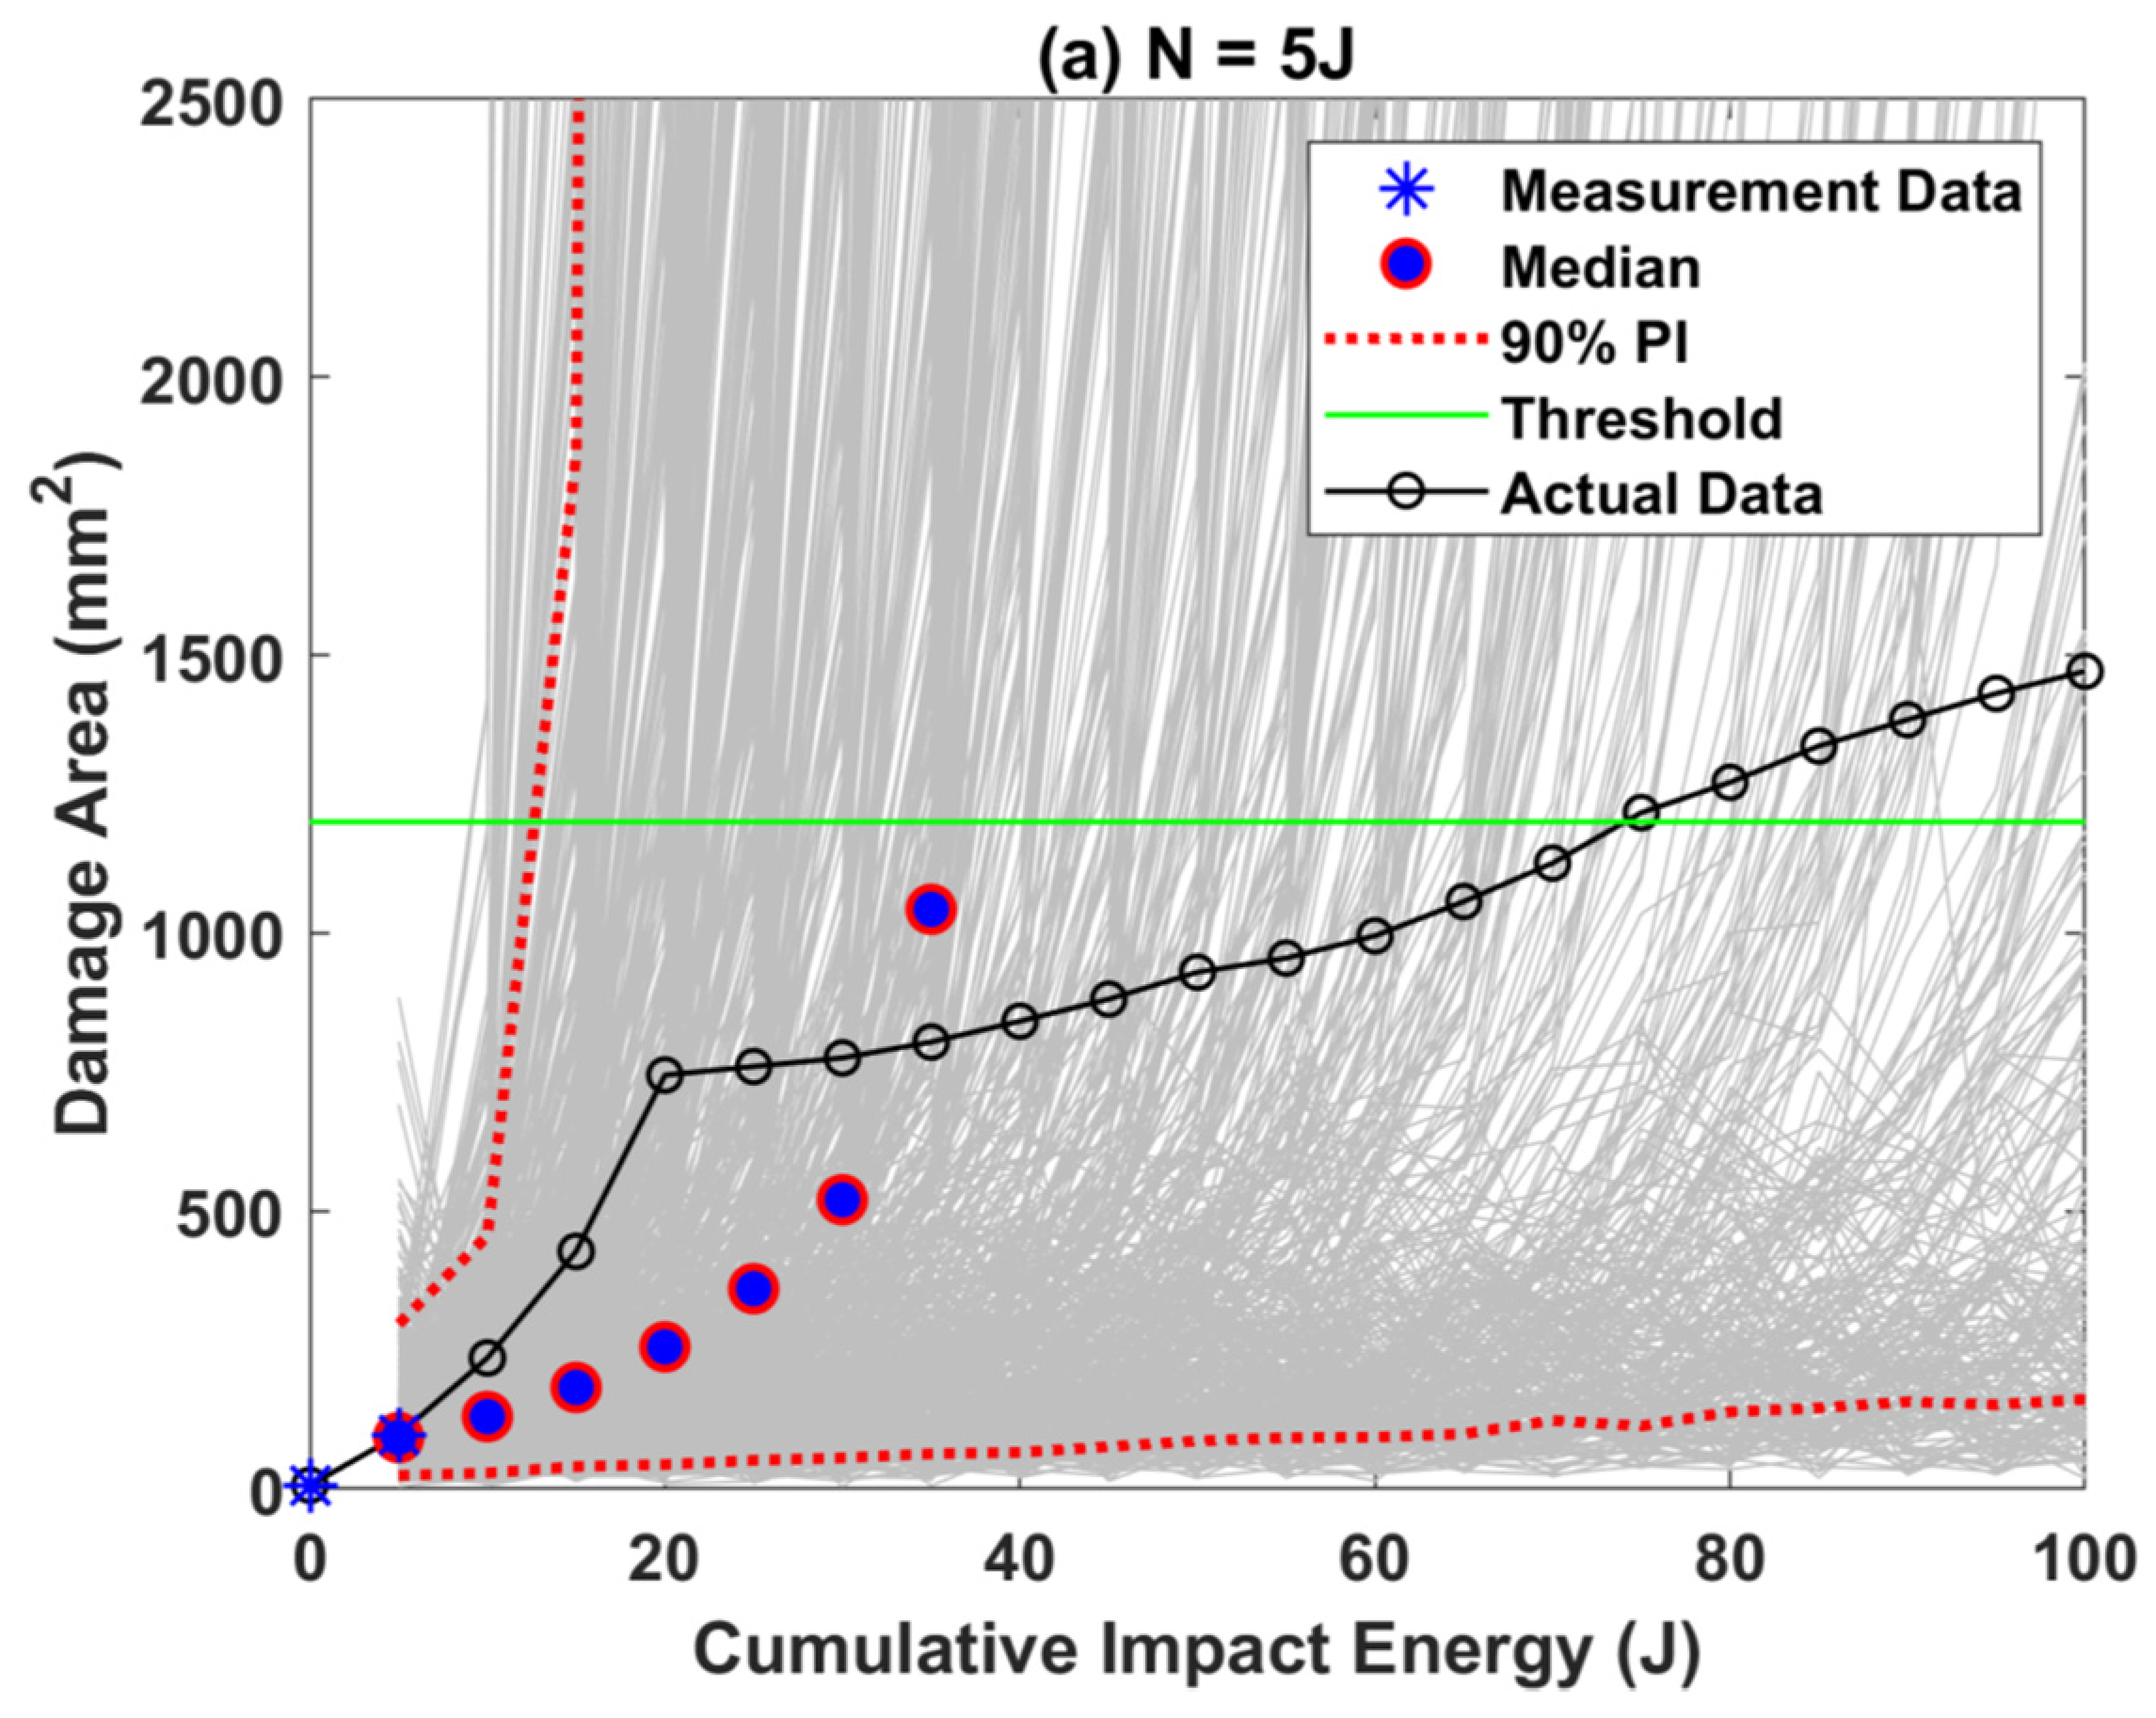
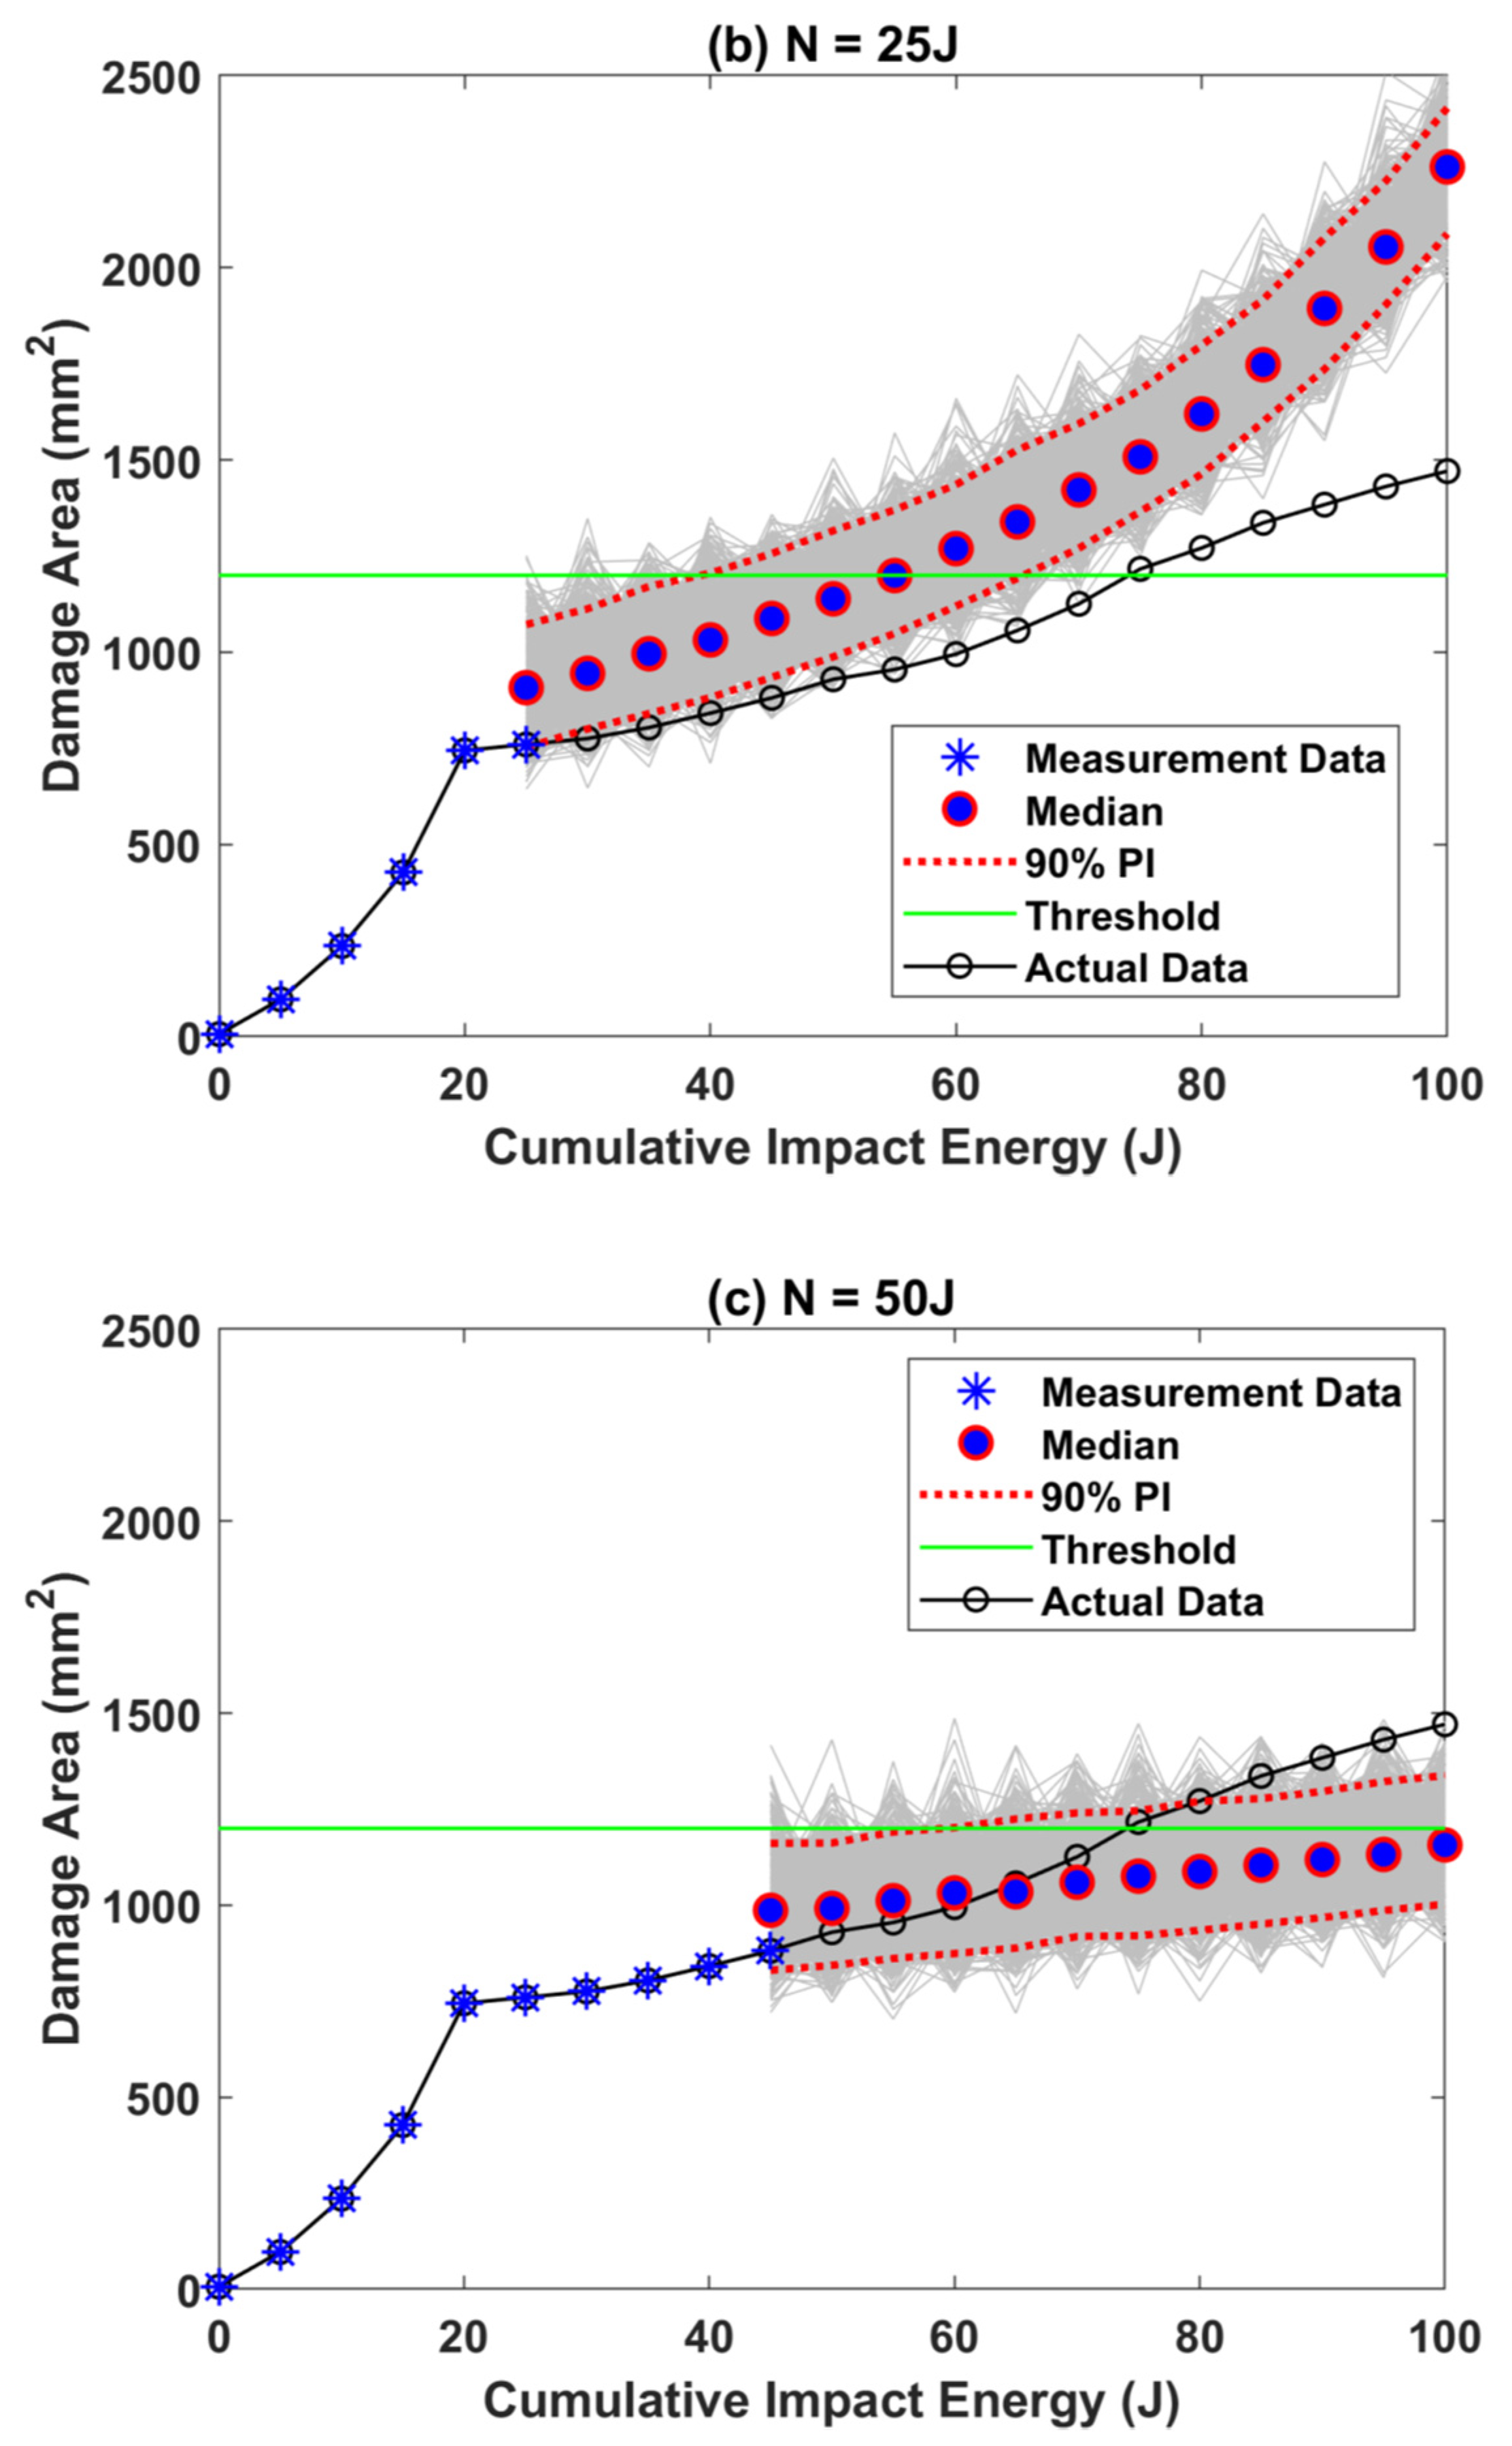
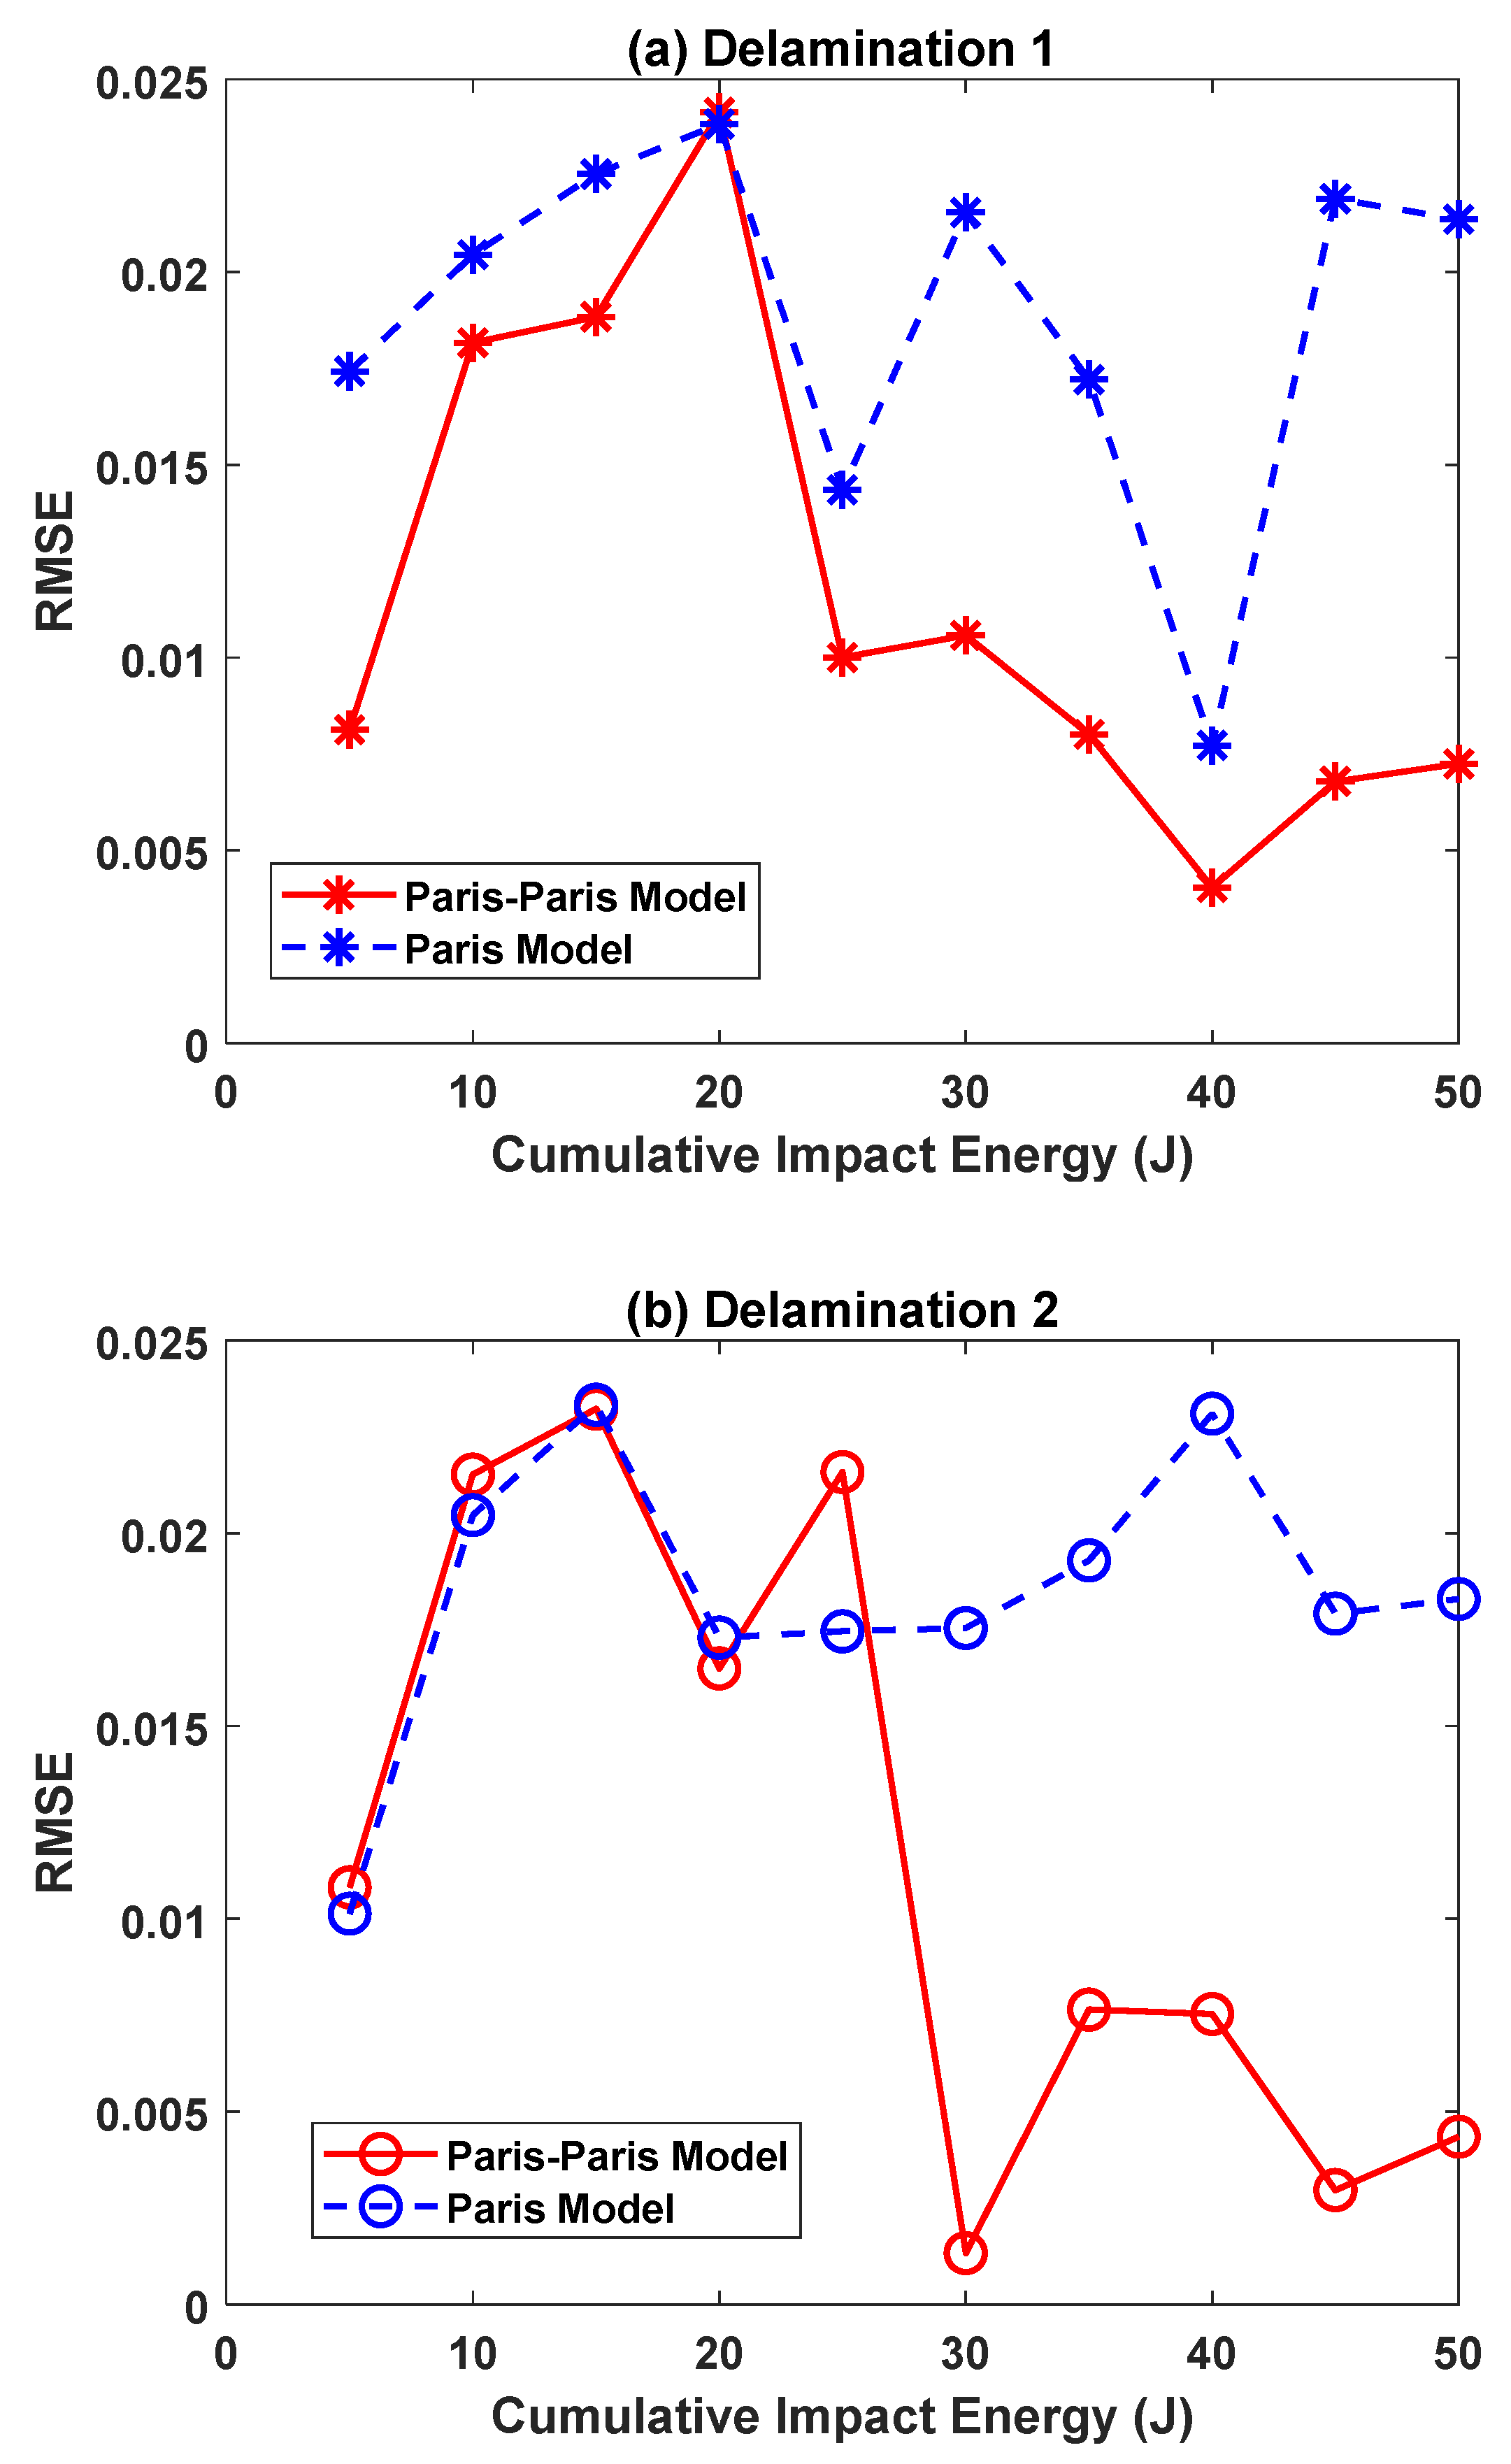
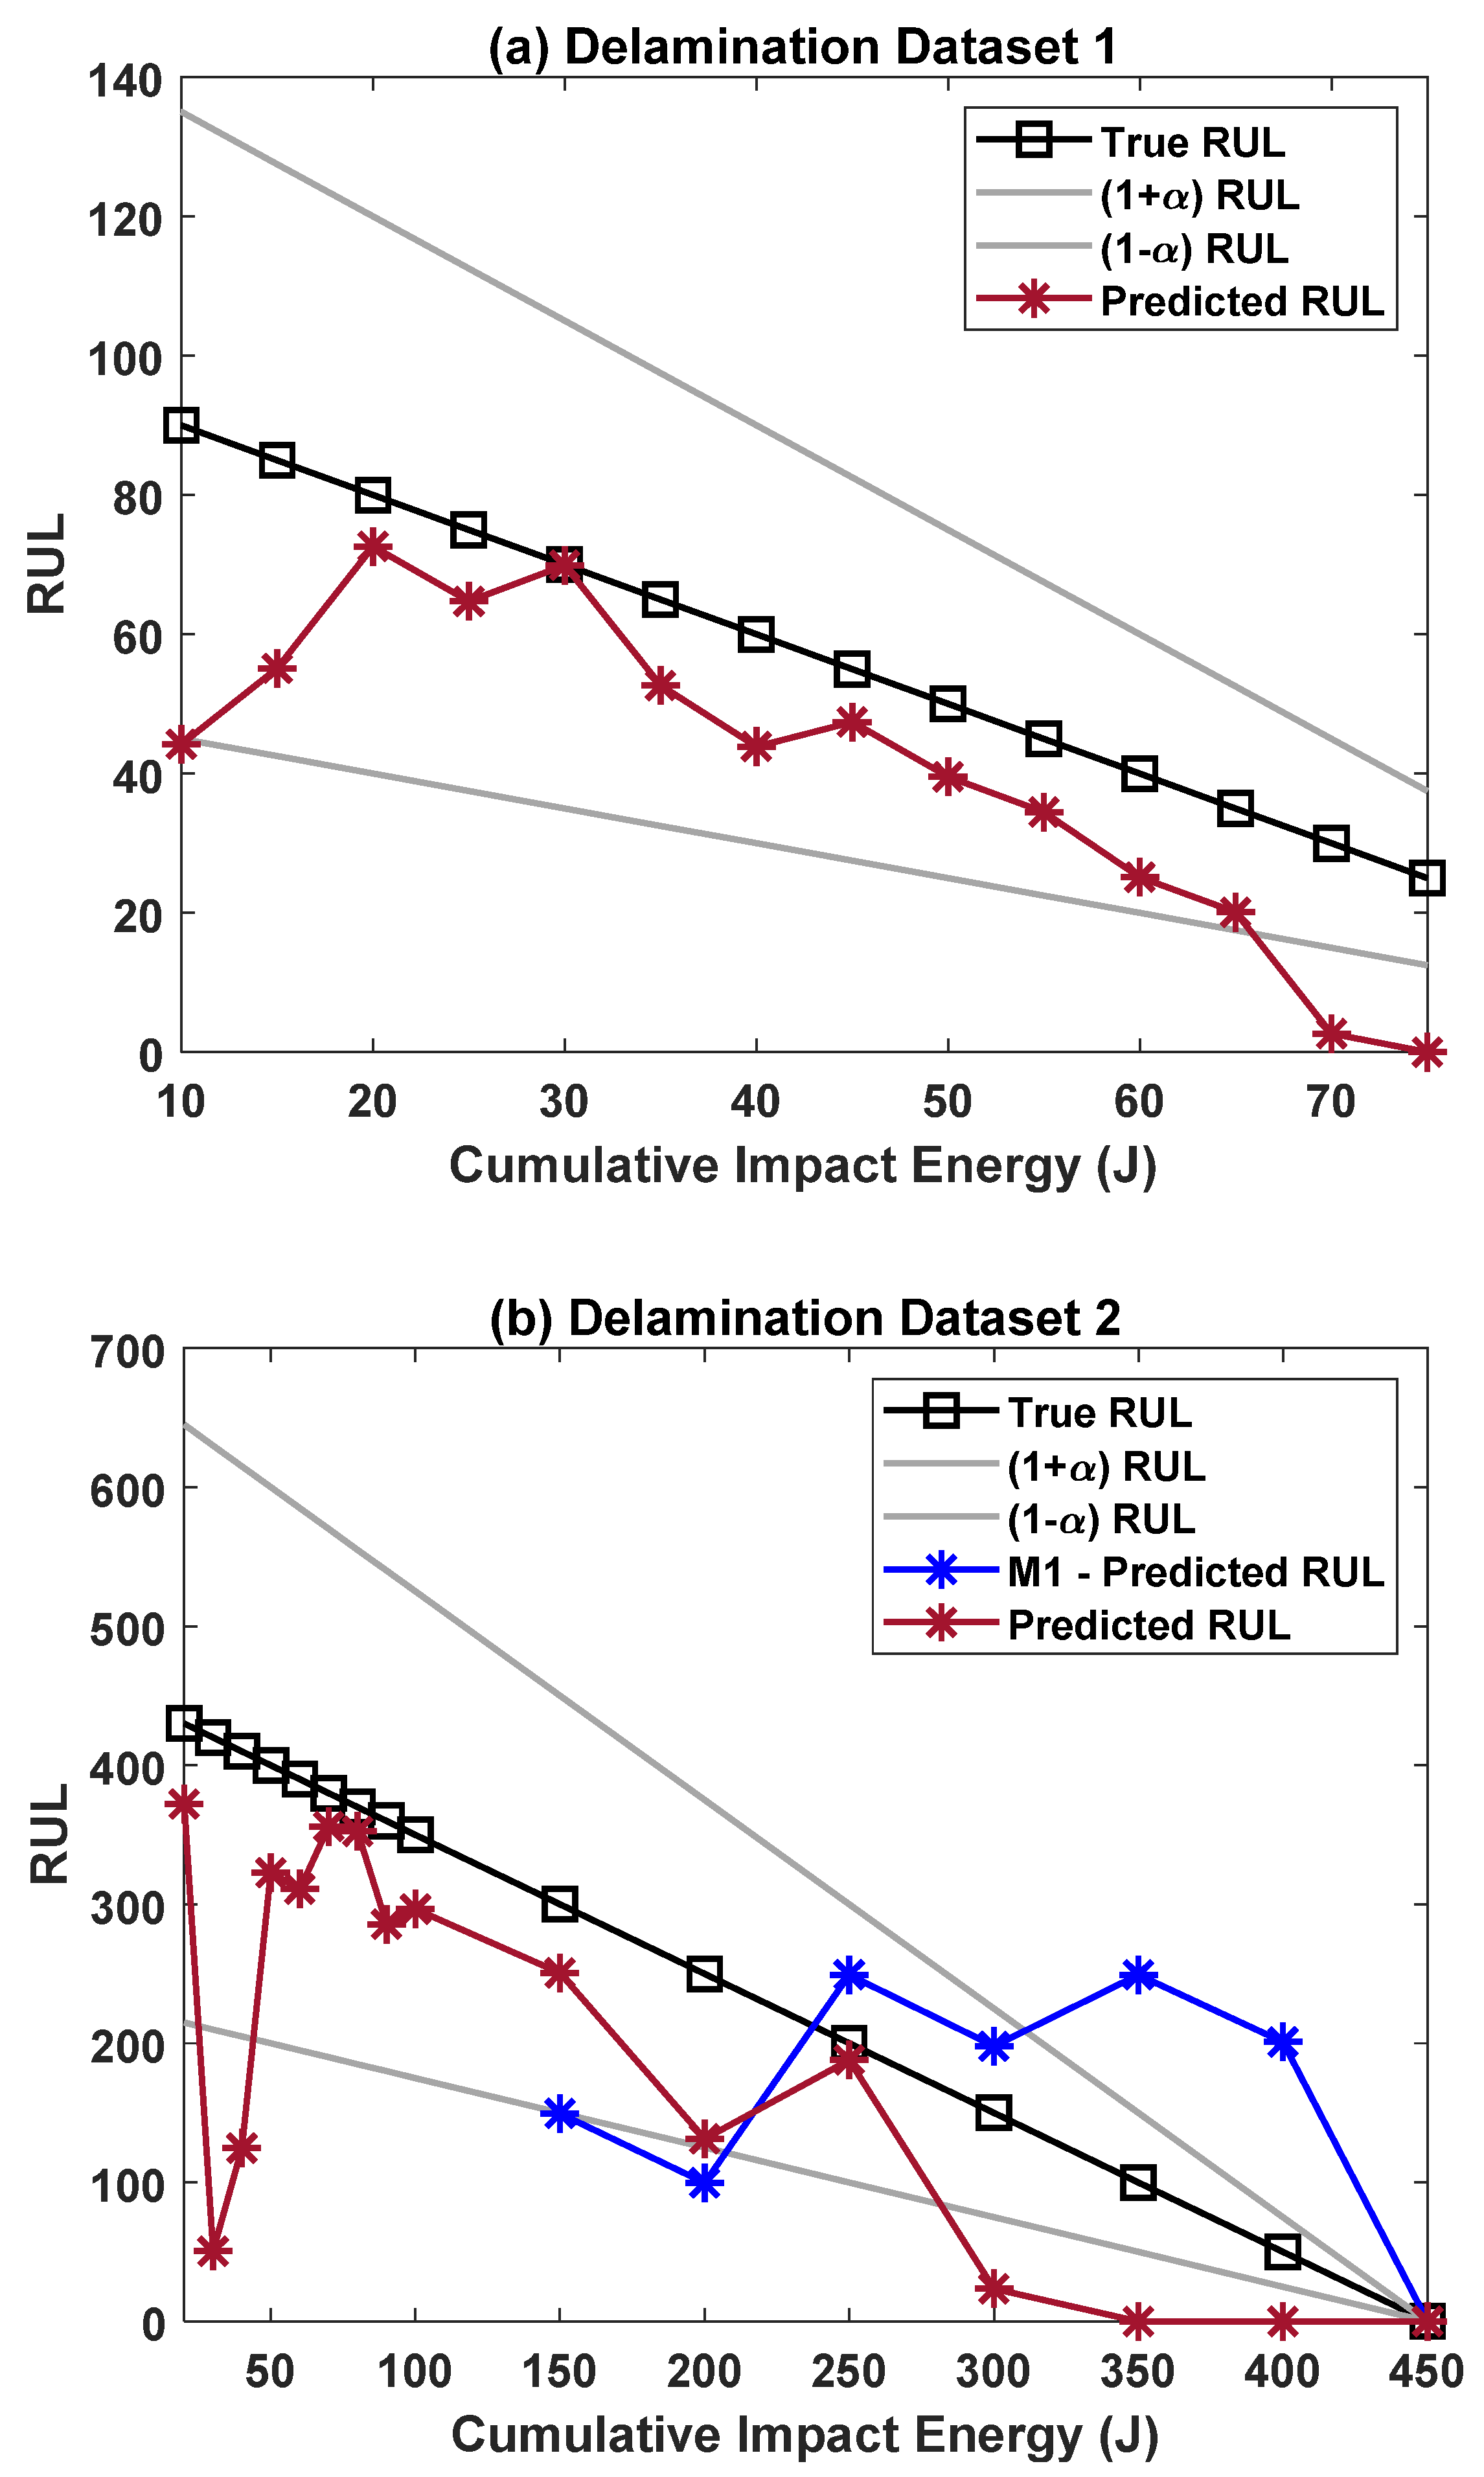
3.1. RUL Estimation Using Paris–Paris Model

The prediction results for the delamination growth area using the particle filtering approach are presented here. All three delamination datasets shown in Figure 1 were analyzed, but for the sake of brevity, we have discussed the prediction results of delamination dataset 1 here.
The prediction algorithm starts when there is a minimum of two measurement data available. For simplicity and coverage of wider range of scenarios, the prediction results at impact energies of 5 J, 25 J, and 50 J for Paris model is shown in Figure 3. The number of measurement data available at these impact energies are 2, 6, and 9, respectively. Similarly, the results for Paris–Paris model are shown in Figure 4.
For both the models, the prediction results at impact energy of 5 J when only two measurement data are available is poor and the damage propagation model completely fails to follow the actual degradation trend. At 25 J, the prediction algorithm detects the jump energy based on the slope difference between current and the previous prediction instants. The results in Figure 3b clearly show that the prediction results for the Paris model keep exponentially increasing and start to diverge away from the actual data. Even when a greater number of measurement data are available for prediction at 50 J, the Paris model fails to learn the degradation behavior. On the other hand, the results shown in Figure 4b. clearly show that the Paris–Paris model starts to follow the actual degradation trend using the Paris law parameters { m 2 , C 2 } for Region 2 at 25 J and 50 J.
The accuracy of the predictions was evaluated by computing the root mean square error (RMSE) values for both the models for each prediction instants as per the following Equation (14):
R M S E = 1 n i = 1 n ( a i a ^ i ) 2
where   n is the total number of observations. The RMSE value for the predictions for several delamination instants (including 5 J, 25 J, and 50 J) are plotted in Figure 5 (for three different delamination data sets). The results clearly show that in the case of the Paris–Paris model, the RMSE values drop drastically after the algorithm detects the jump energy at 25 J. These results clearly justify the need for using an optimized damage propagation model over the conventional Paris model.

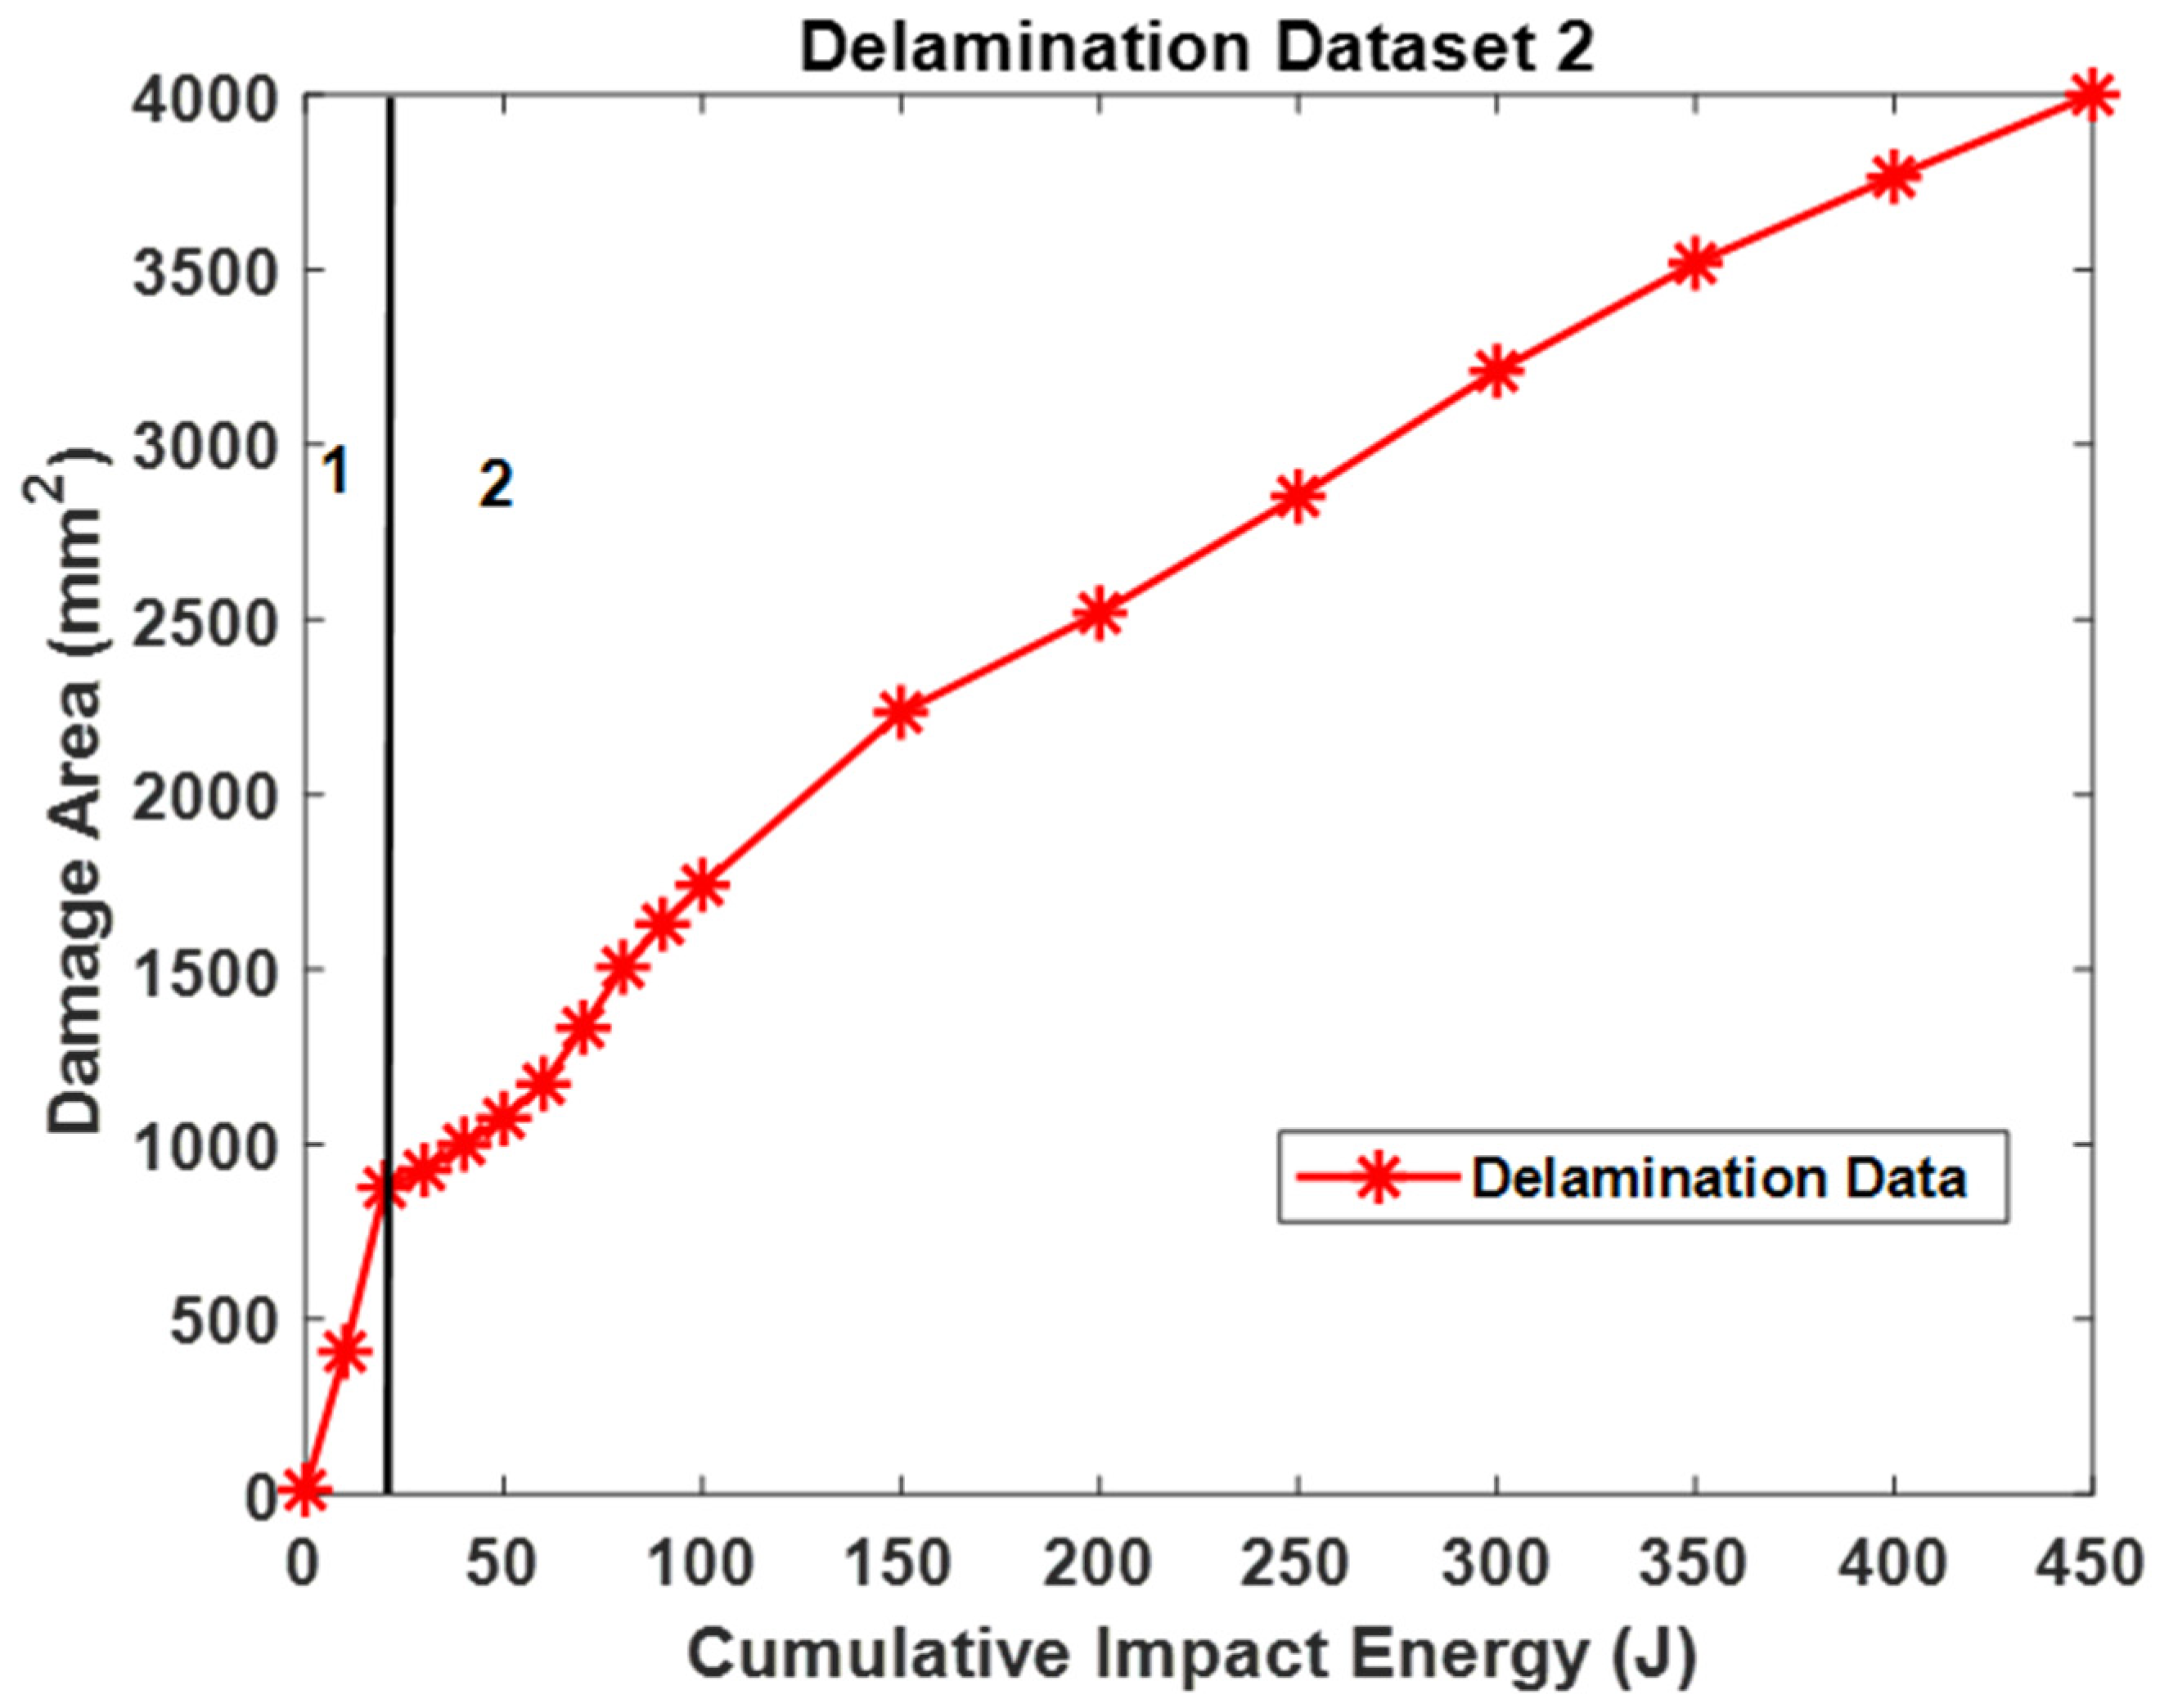
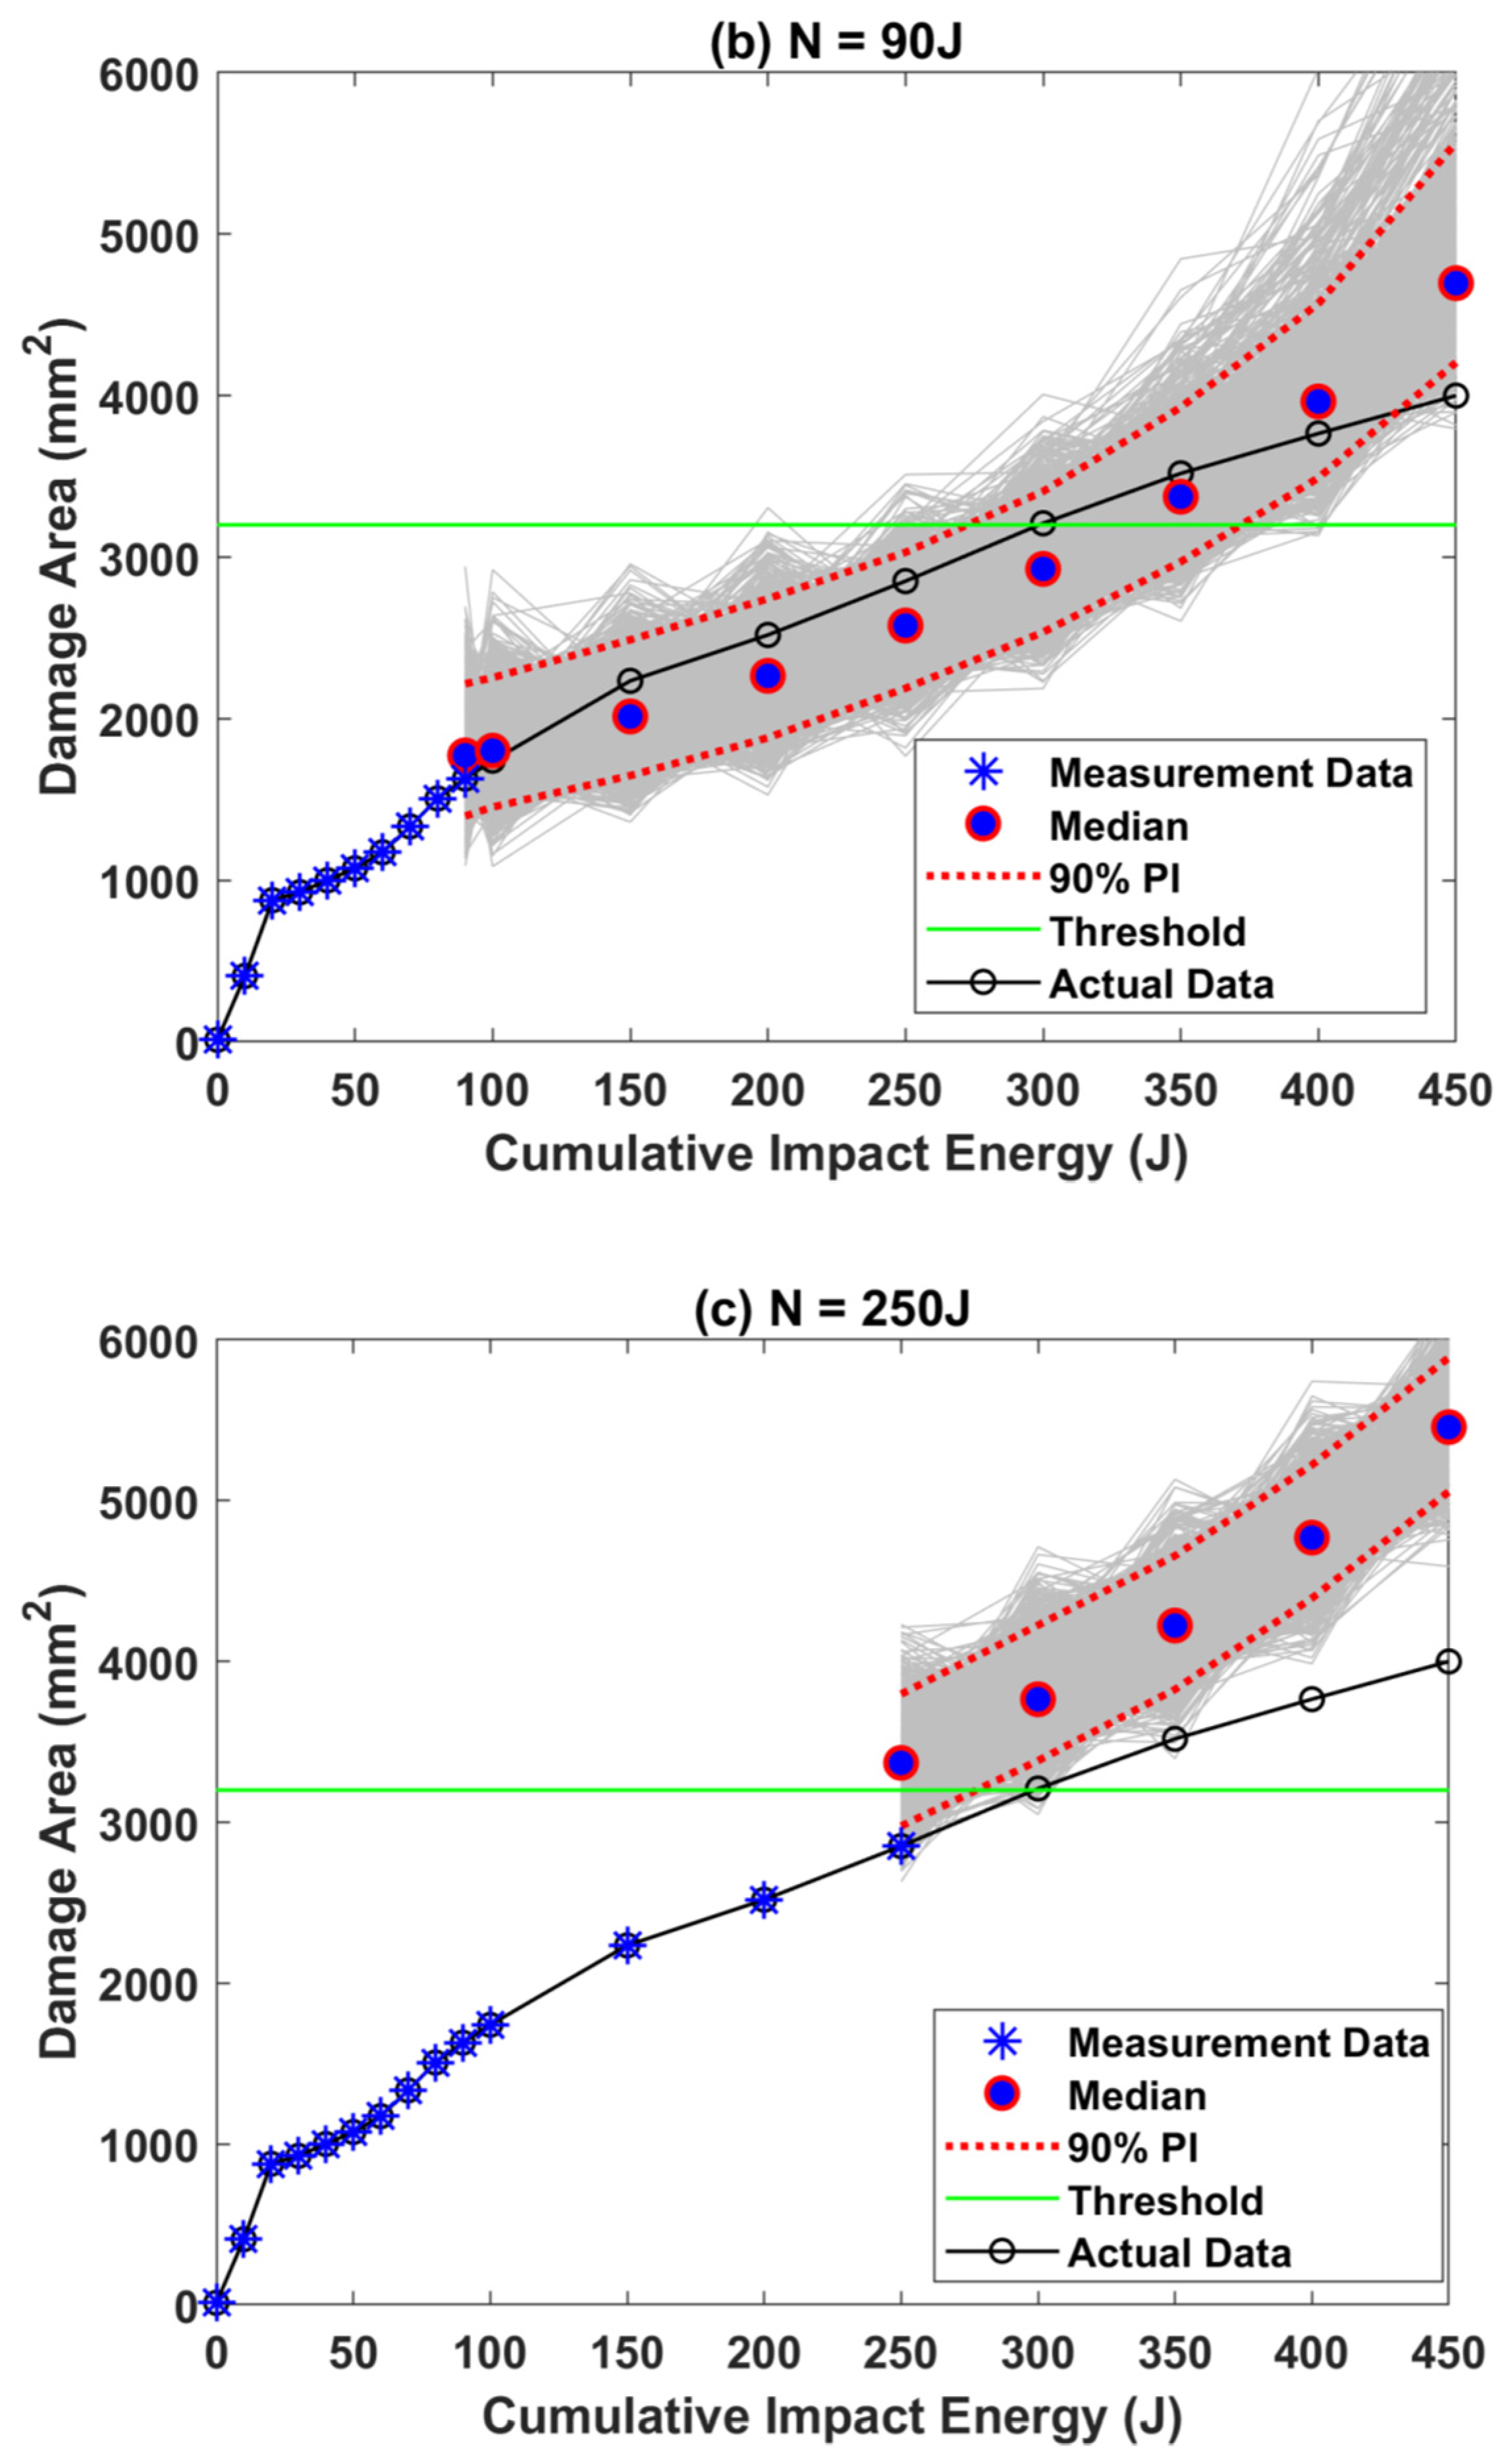
3.2. Delamination Dataset–2

Delamination is one of the crucial modes of failure in composite materials. The stress experienced by the composites due to low-velocity impacts leads to delamination. Composite materials, when subjected to a greater number of low impacts despite delamination, cause fiber breakage. In order to accurately compute the RUL, the authors of Ref. [22] subjected the S1 laminate further to a greater number of low-velocity impacts at higher energy intervals. At 450 J, the delamination extended to one of the edges of the laminate, causing eventual fiber breakage. The damage growth area evolution trend of S1 laminate leading to fiber breakage is shown in Figure 6.

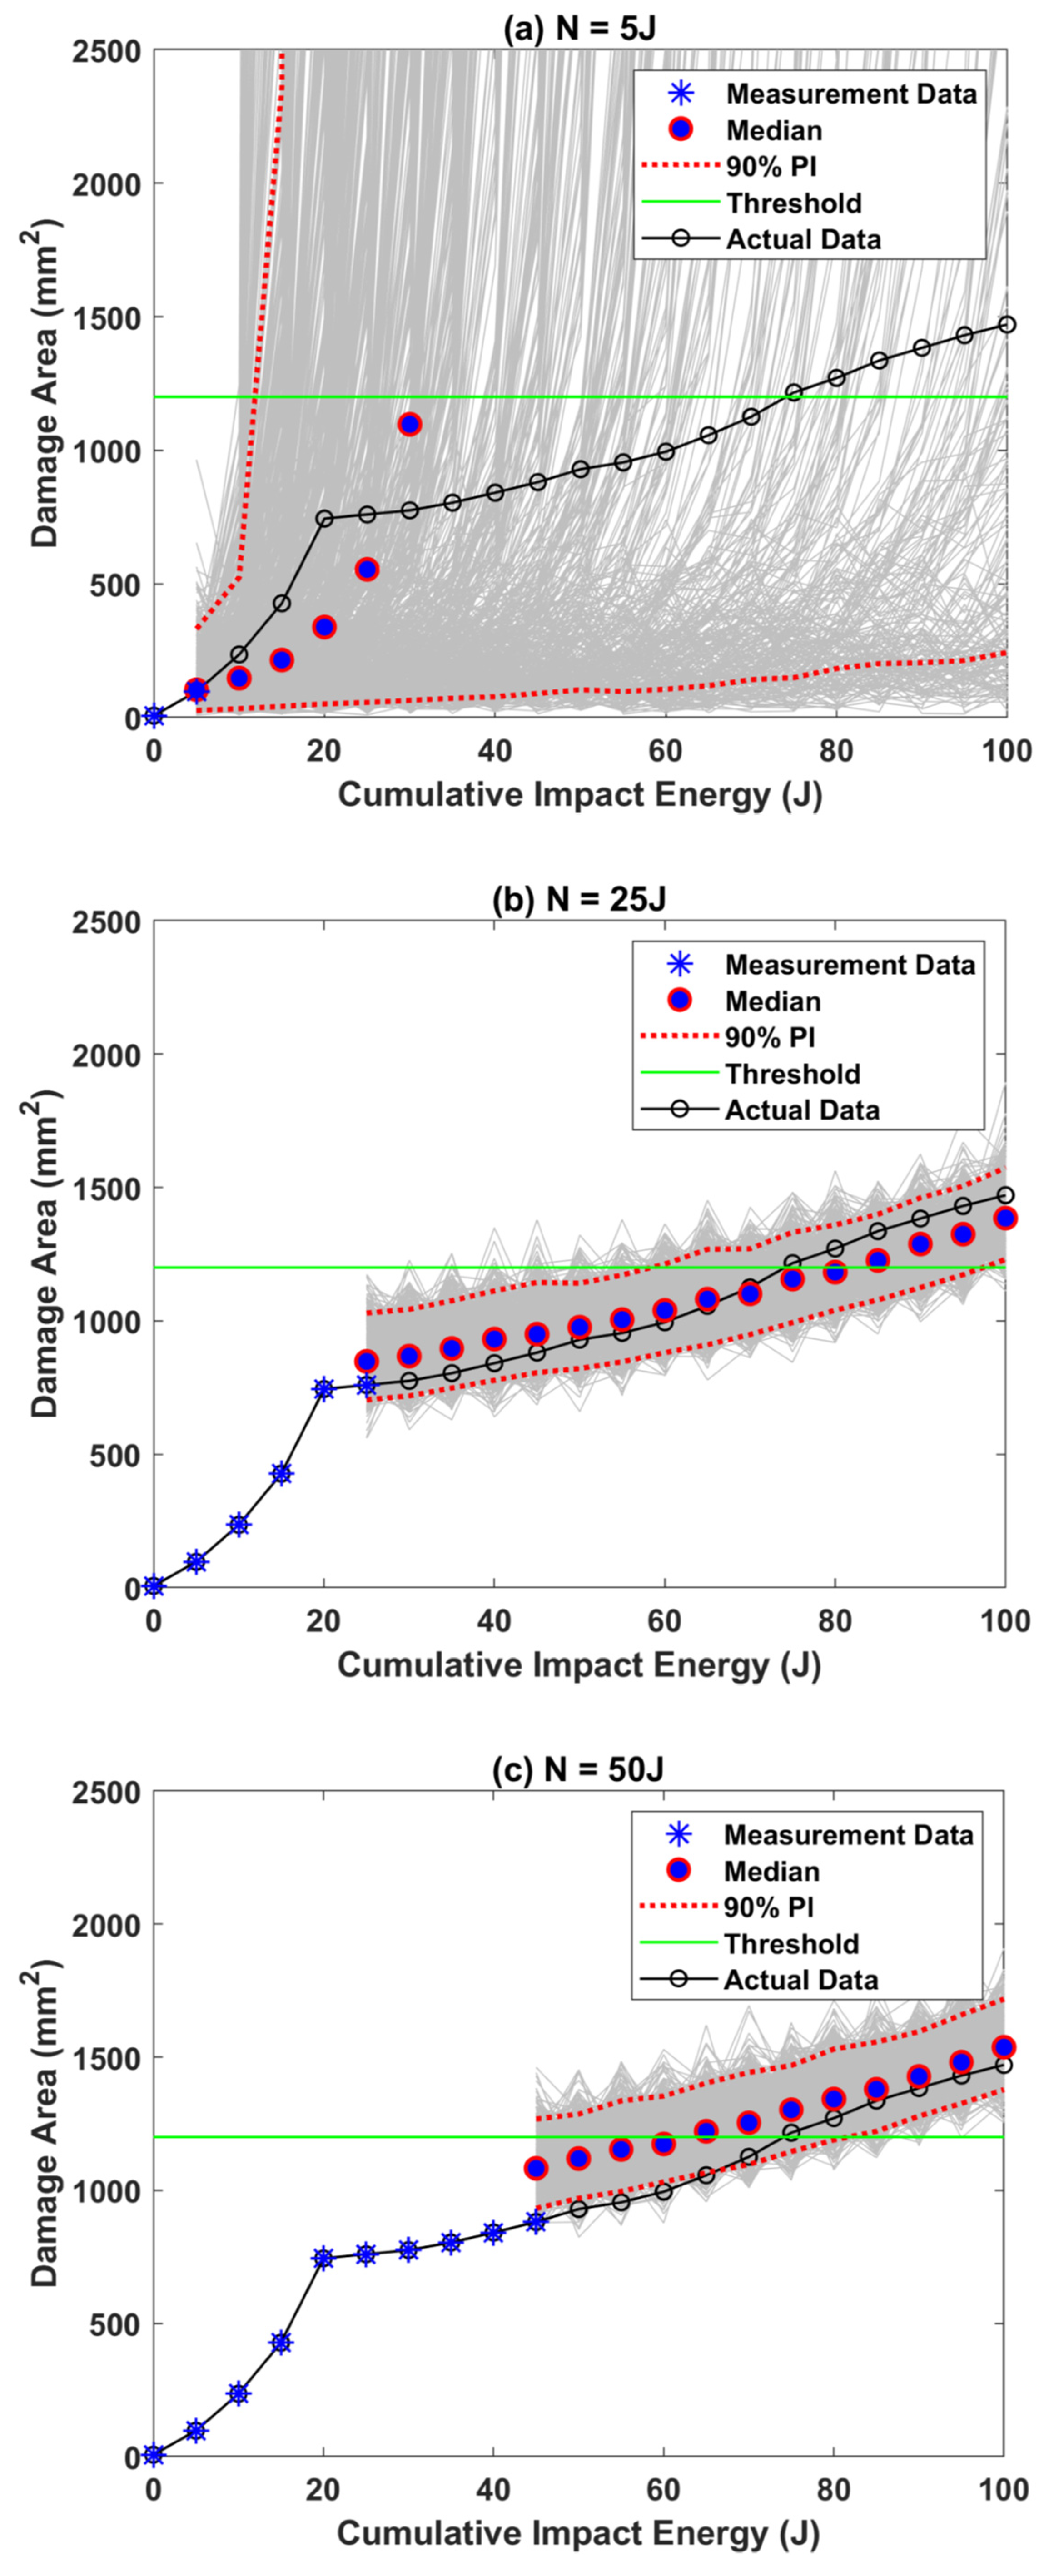
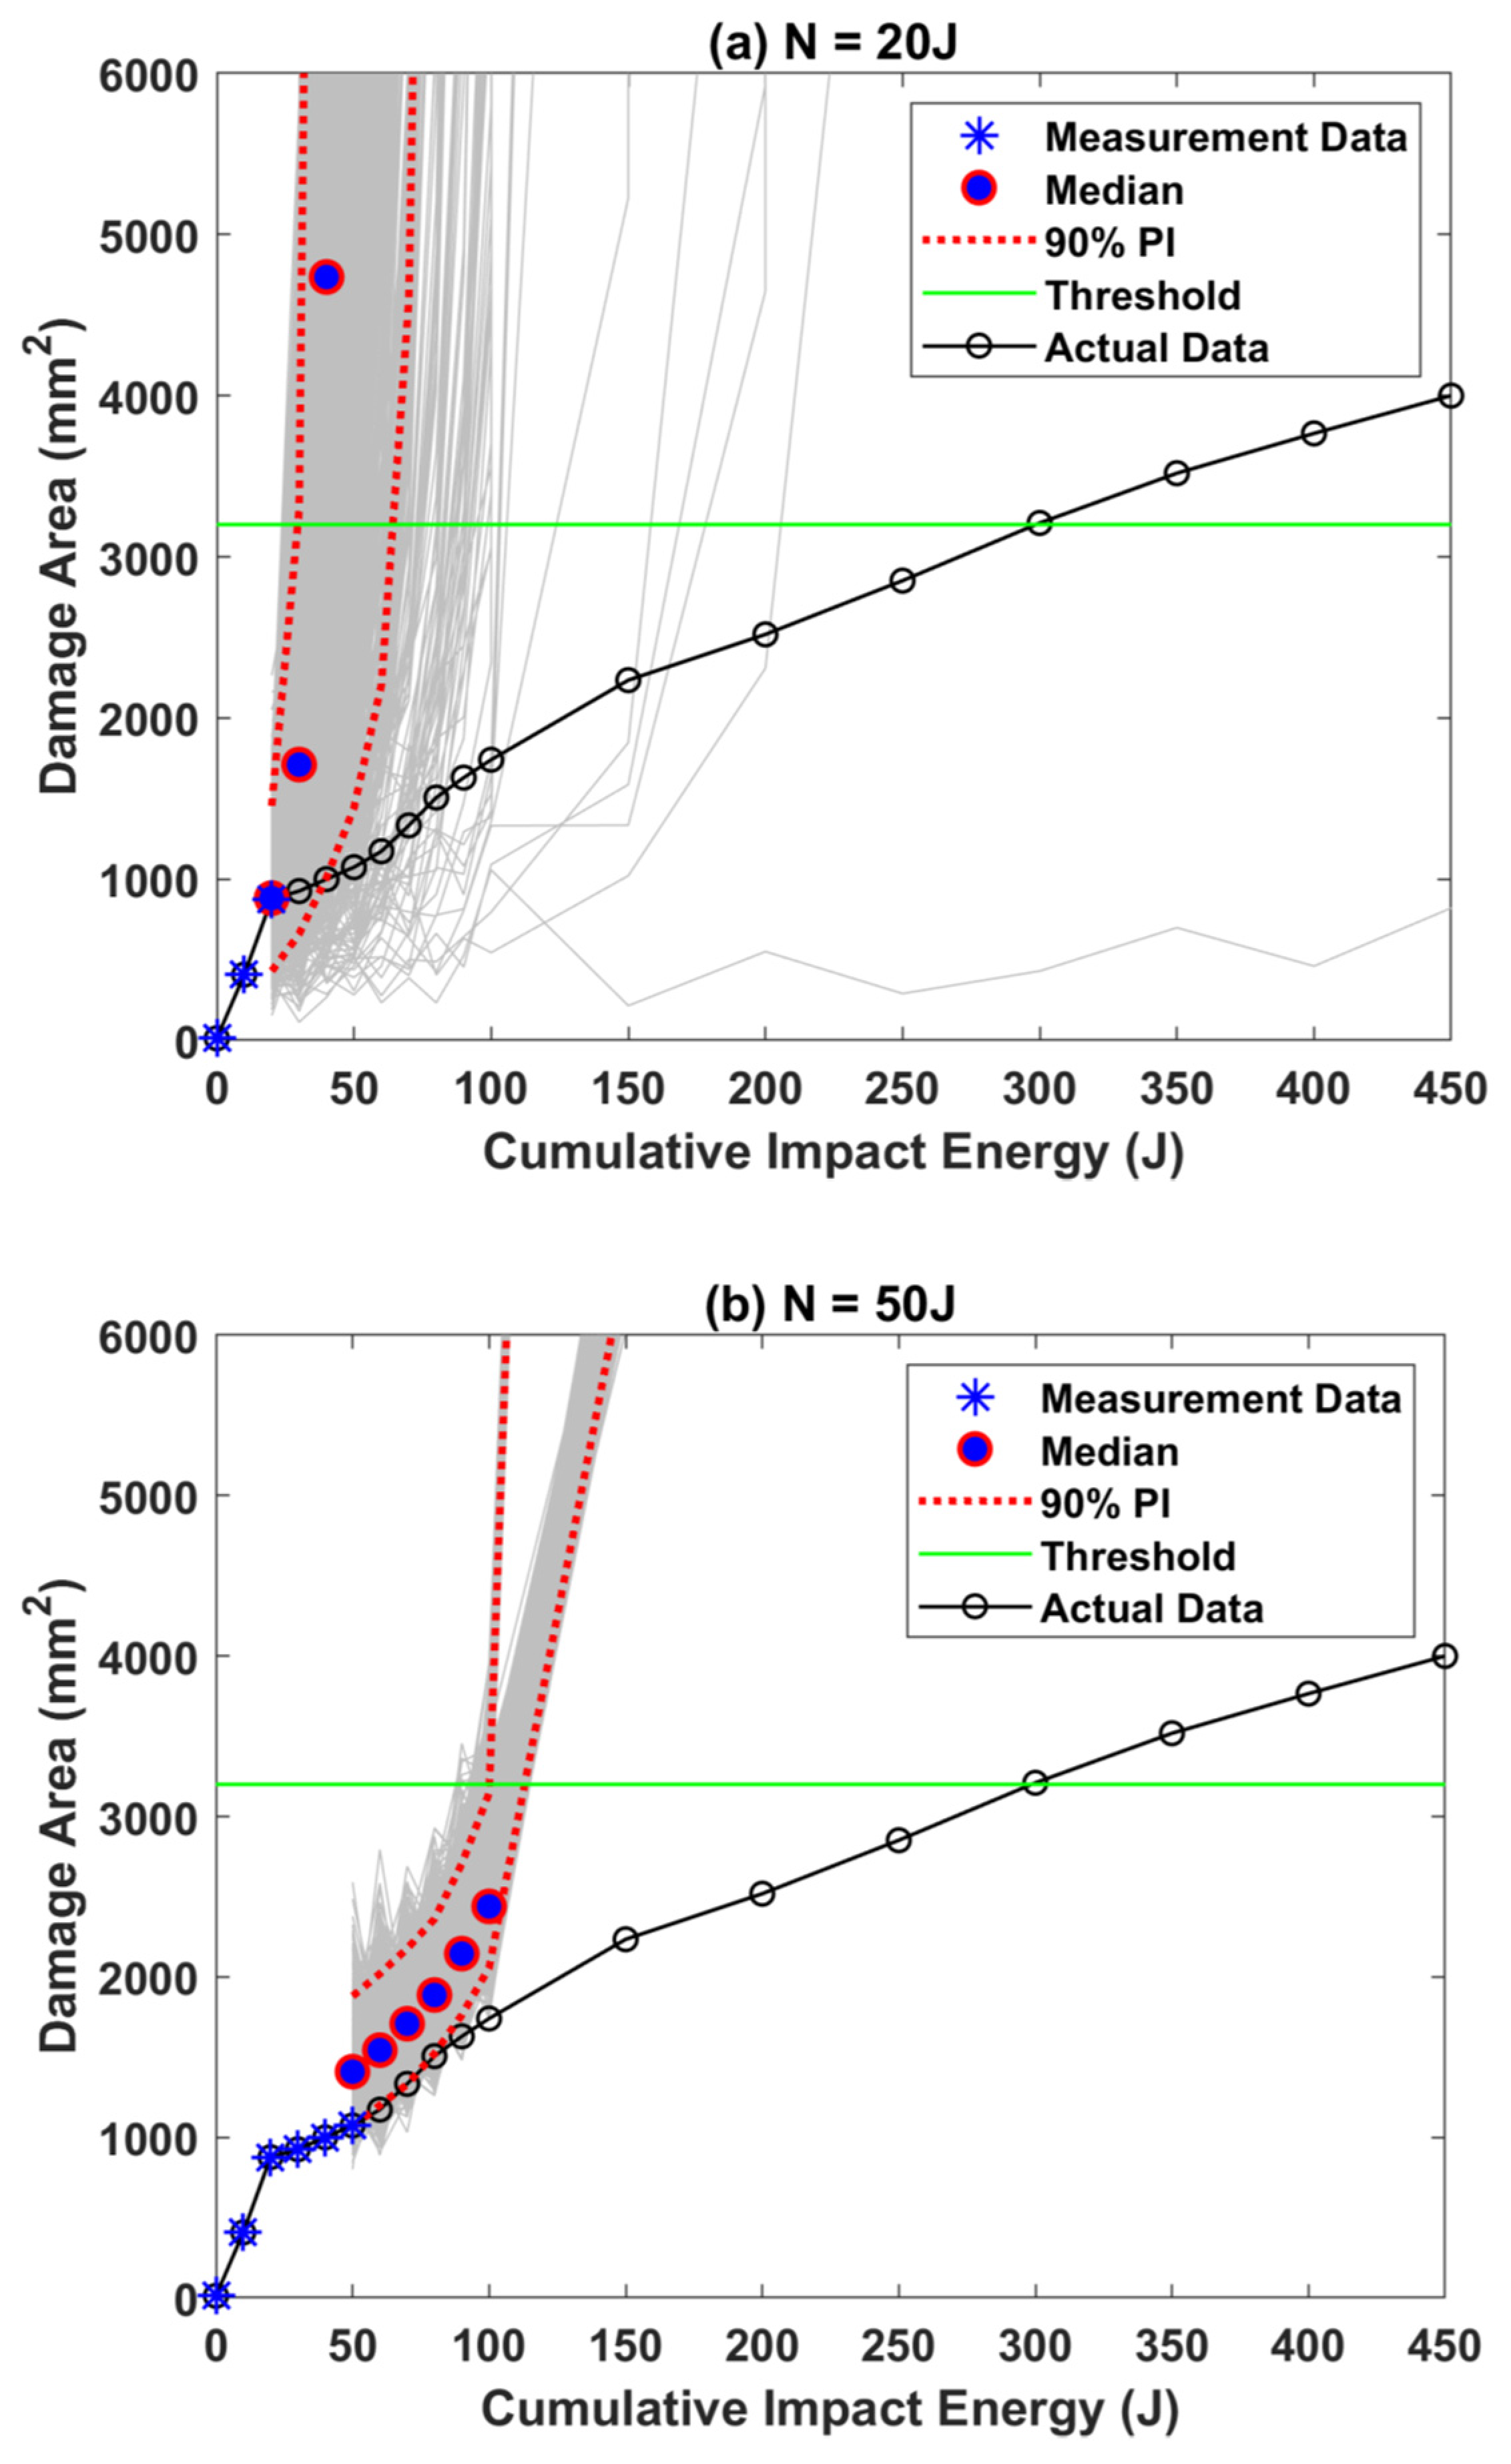
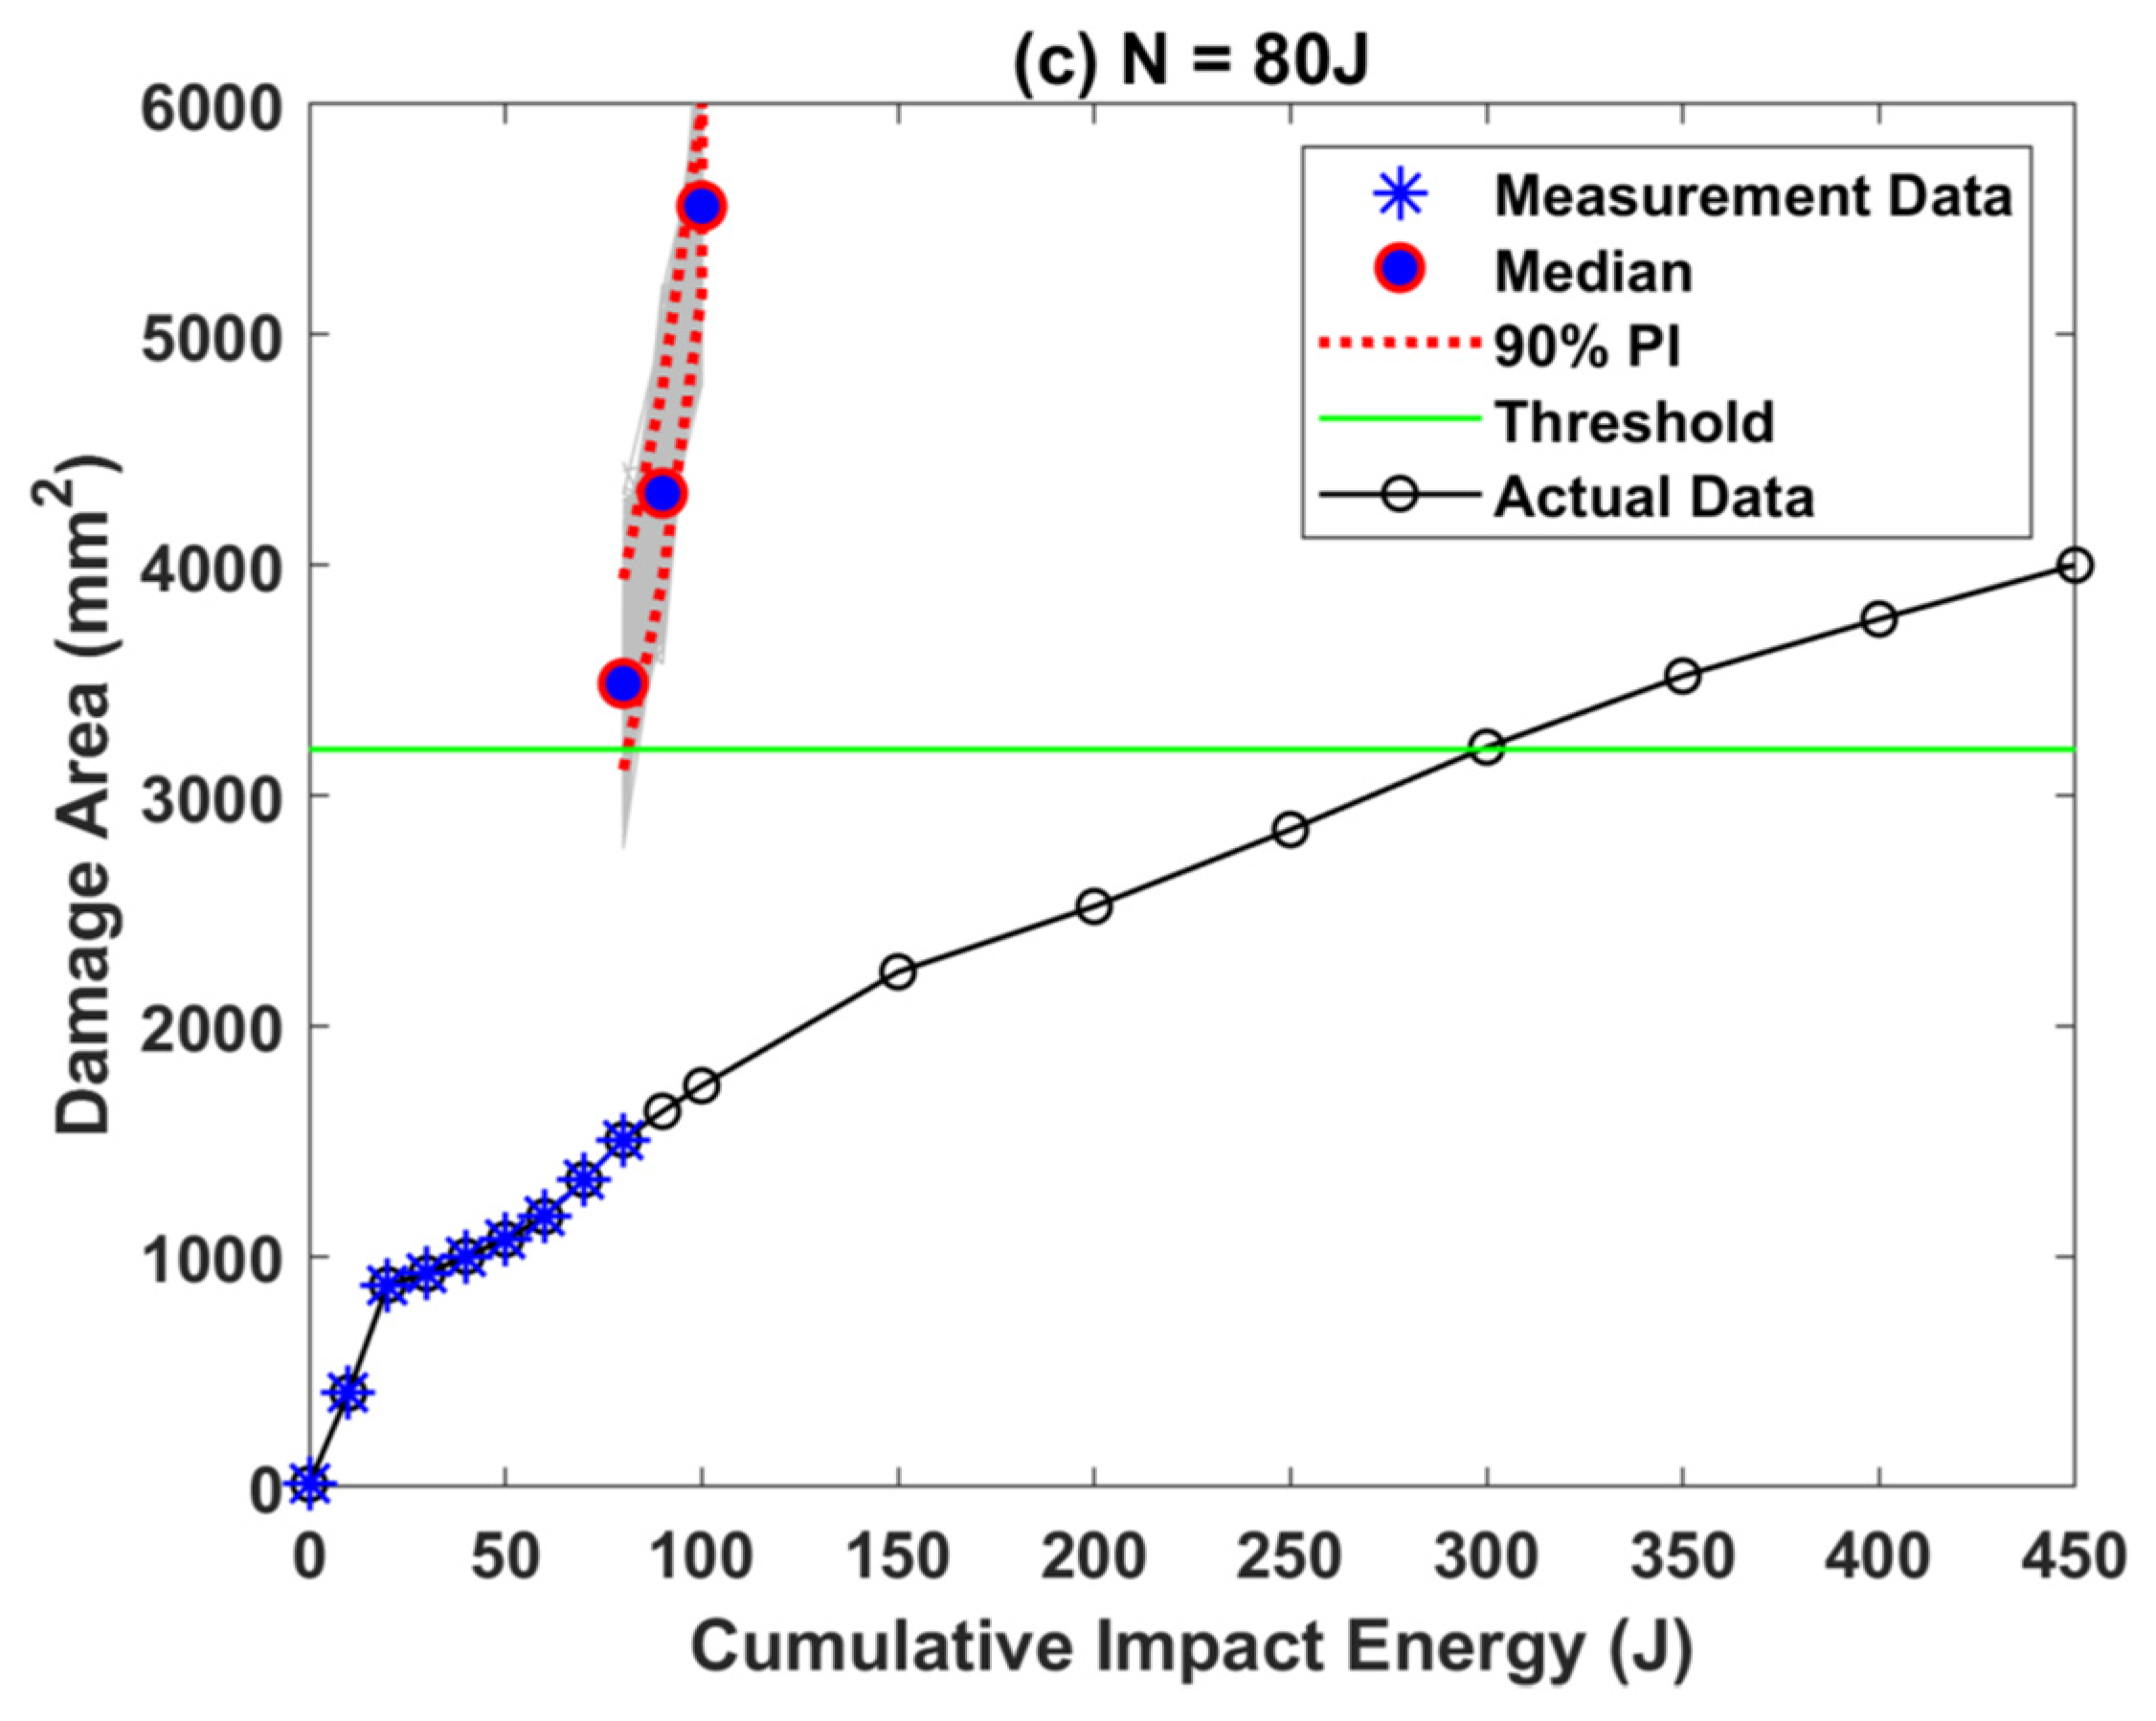
3.3. RUL Estimation for Dataset–2

The prediction results for the delamination Data Set 2 using Paris model is plotted in Figure 7a–c. As mentioned earlier, the proposed prognostic framework requires a minimum of two measurement datapoints available for prediction. For the Paris model, the model parameters for Region 1 ( m 1 , C 1 ) are used in the damage propagation model, and the prediction results show that the predictions follow an exponentially increasing trend completely diverging from the actual degradation behavior. Even when there are a greater number of observations available to learn from the failure trend, the predictions at 50 J and 80 J fail to capture the actual degradation trend as shown in Figure 7b,c. It is evident from the results here that the Paris model is unable to capture the degradation behavior of the GFRP S1 laminate.
The prediction results for the optimized Paris–Paris model is shown in Figure 8a–c. The predictions at 20 J are similar to that of the Paris model shown in Figure 8a. However, after the jump energy is detected at 25 J, the prediction accuracy improves as model parameters for Region 2 ( m 2 , C 2 ) are plugged into the damage propagation model. The results for 90 J shown in Figure 8b clearly show that the model manages to capture the degradation trend. However, the prediction accuracy starts decreasing with a prediction error of about 20% after 250 J as shown in Figure 8c.
The damage model proposed fails to capture the damage trend towards the end of life of the sample where the damage dynamics seems to have a more concave gradual increase in damage area, unlike the rapid exponential damage growth in the earlier stages of delamination. Thus, the model to be adapted has to be improvised further to improve the prediction accuracy in the final stages of delamination growth, which is out of the scope of this study here. If a more appropriate three-stage model for crack nucleation, growth, and resulting delamination could be proposed, our framework in Figure 2 can be easily extended to do prognosis for such scenarios with two thresholds instead of one.

4. Remaining Useful Life Comparison

Since the proposed methodology is an improvisation of the work published by Banerjee et al. in Ref. [22], we compare our results with the results published in the reference article. The RUL prediction results in Ref. [22] (which we refer to as M1) for the delamination dataset 2 show that the prediction error is about 50% when the number of available observations is 16 or less.
The prediction results are shown only from the 14th observation onwards, i.e., when the impact energy is about 90J and the results show a prediction error of about 72%. The prediction error reduces to about 2% at 200J when there are 17 observations available. One of the reasons for the poor performance in the initial stages in their study could be that the initial damage state a0 is assumed to be N (20,(0.01)2) based on the jump energy evaluated from the experimental data. Comparatively, the prognostic framework proposed in our work here is an online study.
Since we perform an online prognosis, the initial distribution for the damage state is assumed to be between zero and the current measurement data available for prediction. The RUL prediction results for the delamination dataset 2 is shown in Figure 9b. The results clearly show the RUL prediction error is as high as 80% when there are just two datapoints available for prediction. As more measurement data become available for prediction, the accuracy improves drastically. Compared to M1 (results of the work from Ref. [22]), the prediction accuracy of the proposed method is very good in the earlier degradation stages. One of the main reasons for better performance is that the initial damage state is adapted based on the new measurement data available online for prediction. However, the prediction accuracy dips after 250 J in both studies due to the reasons mentioned earlier (mechanics of final stage of delamination not captured by the two-stage model). Similar results were also observed for the delamination dataset 1 as shown in Figure 9a.

5. Conclusions

This study presented an online prognostic framework using particle filters for predicting the remaining useful life of GFRP laminates. The laminates suffered delamination and eventual fiber breakage due to repeated low-velocity impacts applied on them. The experimental results along with prognosis of the damage growth area were presented in a recently published work by Banerjee et al. [22]. We have improvised the methodology presented and performed an online prognostic study on the same damage growth data in our study here. The proposed prognostic framework has the ability to determine the jump energy or the inflection point in real time on-the-fly. The prediction results were compared to the results obtained in Ref. [22], and it was found that our proposed framework outperforms even when there are very few measurement data points available for prediction. Additionally, the proposed framework RUL prediction accuracy improves when there are about four datapoints available, i.e., at 20 J impact energy, and the predicted RUL overcomes the dependency on the initial distribution of the damage state based on the jump energy. This makes the methodology more robust as it can used for different composite materials or even for the same material under different operating conditions wherein the jump energy would also be different.
For future work, we intend to improve the prediction accuracy in the later stages of damage growth, i.e., for damage state values beyond 250 J impact energy by possibly considering a three-stage crack model. A particle filter framework would require a degradation model incorporating three regions of damage growth. This would considerably increase the computational complexity and time. Hence, a data-driven method may have to be adopted to overcome the dependency on the damage growth model. Additionally, the proposed methodology will be tested on other mechanical or electronic systems such as ball bearings, batteries wherein two-phase degradation trends are largely prevalent.

Author Contributions

K.P.: Conceptualization, Methodology, Formal analysis, Software, Visualization, Writing—Original draft preparation. P.L.T.D.: Software, Validation. Investigation. J.D.: Investigation and Data Visualization. S.H.: Discussions and Analysis. M.H.J.: Modeling, Analysis, and Validation. N.R.: Review and Editing, Supervision. Project administration, funding acquisition. All authors have read and agreed to the published version of the manuscript.

Funding

This research was funded by the A*STAR-NTU-SUTD AI partnership SEED grant (RGANS1904) and the Ministry of Education Tier-2 Academic Research Grant No. MOE-2017-T2-1-115. The corresponding author additionally acknowledges the support of Industry Postgraduate Fund Grant No. IGIPAMD1801 for partial payment of the article processing charges (APC).

Institutional Review Board Statement

Not applicable.

Informed Consent Statement

Not applicable.

Data Availability Statement

Not applicable.

Acknowledgments

The first author would also like to thank the Ministry of Education (MOE), Singapore for providing the research student scholarship (RSS) for 2018–2021. The corresponding author would like to acknowledge the financial support provided by the Ministry of Education (MOE), Singapore under the Tier-2 Grant Call No. MOE-2017-T2-1-115. The corresponding author, Duong, Hussain, and Jhon would like to acknowledge support from A*STAR–NTU–SUTD AI Partnership Grant No. RGANS1904.

Conflicts of Interest

The authors declare no conflict of interest.

References

  1. Ansari, M.T.A.; Singh, K.K.; Azam, M.S. Fatigue damage analysis of fiber-reinforced polymer composites—A review. J. Reinf. Plast. Compos. 2018, 37, 636–654. [Google Scholar] [CrossRef]
  2. Singh, J.; Kumar, M.; Kumar, S.; Mohapatra, S.K. Properties of glass-fiber hybrid composites: A review. Polym.-Plast. Technol. Eng. 2018, 56, 455–469. [Google Scholar] [CrossRef]
  3. Li, X.; Ma, D.; Liu, H.; Tan, W.; Gong, X.; Zhang, C.; Li, Y. Assessment of failure criteria and damage evolution methods for composite laminates under low-velocity impact. Compos. Struct. 2019, 207, 727–739. [Google Scholar] [CrossRef]
  4. Mehdikhani, M.; Gorbatikh, L.; Verpoest, I.; Lomov, S.V. Voids in fiber-reinforced polymer composites: A review on their formation, characteristics, and effects on mechanical performance. J. Compos. Mater. 2019, 53, 1579–1669. [Google Scholar] [CrossRef]
  5. Zio, E.; Peloni, G. Particle filtering prognostic estimation of the remaining useful life of nonlinear components. Reliab. Eng. Syst. Saf. 2019, 96, 403–409. [Google Scholar] [CrossRef]
  6. Orchard, M.E.; Vachtsevanos, G.J. A particle-filtering approach for on-line fault diagnosis and failure prognosis. Trans. Inst. Meas. Control. 2009, 31, 221–246. [Google Scholar] [CrossRef]
  7. Chiachıo, J.; Chiachıo, M.; Saxena, A.; Rus, G.; Goebel, K. A model-based prognostics framework to predict fatigue damage evolution and reliability in composites. In Proceedings of the 2nd European Conference of the Prognostics and Health Management Society, Nantes, France, 8–11 July 2014; pp. 732–742. [Google Scholar]
  8. Chiachío, J.; Chiachío, M.; Saxena, A.; Sankararaman, S.; Rus, G.; Goebel, K. Bayesian model selection and parameter estimation for fatigue damage progression models in composites. Int. J. Fatigue 2015, 70, 361–373. [Google Scholar] [CrossRef] [Green Version]
  9. Nguyen, H.P.; Liu, J.; Zio, E. Ensemble of models for fatigue crack growth prognostics. IEEE Access 2019, 7, 49527–49537. [Google Scholar] [CrossRef]
  10. Loutas, T.; Eleftheroglou, N.; Zarouchas, D. A data-driven probabilistic framework towards the in-situ prognostics of fatigue life of composites based on acoustic emission data. Compos. Struct. 2017, 161, 522–529. [Google Scholar] [CrossRef]
  11. Chen, J.; Yuan, S.; Jin, X. On-line prognosis of fatigue cracking via a regularized particle filter and guided wave monitoring. Mech. Syst. Signal. Process. 2019, 131, 1–17. [Google Scholar] [CrossRef]
  12. Qian, Y.; Yan, R.; Gao, R.X. A multi-time scale approach to remaining useful life prediction in rolling bearing. Mech. Syst. Signal. Process. 2017, 83, 549–567. [Google Scholar] [CrossRef] [Green Version]
  13. Wang, J.; Gao, R.X. Multiple model particle filtering for bearing life prognosis. In Proceedings of the 2013 IEEE Conference on Prognostics and Health Management (PHM), Gaithersburg, MD, USA, 24–27 June 2013; pp. 1–6. [Google Scholar]
  14. El-Thalji, I.; Jantunen, E. A summary of fault modelling and predictive health monitoring of rolling element bearings. Mech. Syst. Signal. Process. 2015, 60, 252–272. [Google Scholar] [CrossRef]
  15. Kumar, A.; Srivastava, A.; Goel, N.; Nayak, A. Model based approach and algorithm for fault diagnosis and prognosis of coated gas turbine blades. In Proceedings of the 2010 IEEE/ASME International Conference on Advanced Intelligent Mechatronics, Montreal, QC, Canada, 6–9 July 2010; pp. 800–805. [Google Scholar]
  16. Goel, N.; Kumar, A.; Narasimhan, V.; Nayak, A.; Srivastava, A. Health risk assessment and prognosis of gas turbine blades by simulation and statistical methods. In Proceedings of the 2008 Canadian Conference on Electrical and Computer Engineering, Niagara Falls, ON, Canada, 4–7 May 2008; pp. 001087–001092. [Google Scholar]
  17. Koul, A.K.; Bhanot, S.; Tiku, A.; Junkin, B. Improving component life prediction accuracy and reliability through physics-based prognosis: A probabilistic turbine blade case study. In Proceedings of the ASME Turbo Expo 2008: Power for Land, Sea, and Air, Berlin, Germany, 9–13 June 2008; pp. 533–539. [Google Scholar]
  18. Nesci, A.; Martin, A.D.; Jacazio, G.; Sorli, M. Detection and Prognosis of Propagating Faults in Flight Control Actuators for Helicopters. Aerospace 2020, 7, 20. [Google Scholar] [CrossRef] [Green Version]
  19. Finda, J.; Vechart, A.; Hédl, R. Prediction of fatigue crack growth in airframe structures. In Proceedings of the European Conference of Prognostics and Health Management Society, Dresden, Germany, 3–5 July 2012; pp. 1–7. [Google Scholar]
  20. Azaïs, R.; Abdessalem, A.B.; Touzet-Cortina, M.; Puiggali, M.; Gégout-Petit, A. Stochastic modelling and prediction of fatigue crack propagation using piecewise-deterministic Markov processes. In Proceedings of the ENBIS 2015, Prague, Czech Republic, 6–10 September 2015. [Google Scholar]
  21. Ben Abdessalem, A.; Azaïs, R.; Touzet-Cortina, M.; Gégout-Petit, A.; Puiggali, M. Stochastic modelling and prediction of fatigue crack propagation using piecewise-deterministic Markov processes. J. Risk Reliab. 2016, 230, 405–416. [Google Scholar] [CrossRef] [Green Version]
  22. Banerjee, P.; Karpenko, O.; Udpa, L.; Haq, M.; Deng, Y. Prediction of impact-damage growth in GFRP plates using particle filtering algorithm. Compos. Struct. 2018, 194, 527–536. [Google Scholar] [CrossRef]
  23. Banerjee, P.; Palanisamy, R.P.; Udpa, L.; Haq, M.; Deng, Y. Prognosis of fatigue induced stiffness degradation in GFRPs using multi-modal NDE data. Compos. Struct. 2019, 229, 111424. [Google Scholar] [CrossRef]
Figure 1. The damage growth area of sample S1 against the cumulative low-velocity impact energies.
Applsci 11 06046 g001
Figure 2. The proposed online prognostic framework using particle filter algorithm.
Applsci 11 06046 g002
Figure 3. The prediction results for delamination 1 of sample S1 using the Paris model with failure threshold assumed to be at 1200 mm2. The grey lines represent the particle trajectories for 1000 particles in the particle filter framework.
Applsci 11 06046 g003aApplsci 11 06046 g003b
Figure 4. The prediction results for delamination 1 of sample S1 using the Paris–Paris model with failure threshold assumed to be at 1200 mm2. The grey lines represent the particle trajectories for 1000 particles in the particle filter framework.
Applsci 11 06046 g004
Figure 5. Comparison plot for root mean square error values between the Paris model and Paris–Paris model for all the three delamination of Sample S1.
Applsci 11 06046 g005aApplsci 11 06046 g005b
Figure 6. The damage growth area for sample S1 subjected to low-velocity impacts till the damage eventually led to fiber breakage.
Applsci 11 06046 g006
Figure 7. The prediction results for Delamination Dataset 2 using the Paris model with failure threshold assumed to be at 1200 mm2. The grey lines represent the particle trajectories for 1000 particles.
Applsci 11 06046 g007aApplsci 11 06046 g007b
Figure 8. The prediction results for delamination dataset 2 using the Paris–Paris model with failure threshold assumed to be at 1200 mm2. The grey lines represent the particle trajectories for 1000 particles.
Applsci 11 06046 g008aApplsci 11 06046 g008b
Figure 9. (a) RUL prediction results for GFRP sample S1 using the proposed online prognostic framework till 75J impact energy. (b) RUL prediction results for delamination dataset 2 using the proposed online prognostic framework till 450J impact energy. Note that M1 refers to the analysis results reported in Ref. [20], which we consider as the datum for comparison of the effectiveness of our framework. Here, the α value for the accuracy cone was chosen to be 0.5.
Applsci 11 06046 g009
Publisher’s Note: MDPI stays neutral with regard to jurisdictional claims in published maps and institutional affiliations.

