Article

Proposal of a Nature-Inspired Shape for a Vertical Axis Wind Turbine and Comparison of Its Performance with a Semicircular Blade Profile

by
Javier Blanco
1,
Juan de Dios Rodriguez
2,
Antonio Couce
2 and
Maria Isabel Lamas
1,*
1
Nautical Sciences and Marine Engineering Department, Hygher Politechnic University College, University of Coruña, 15403 Ferrol, Spain
2
Industrial Engineering Department, Politechnic University College, Univertisy of Coruña, 15405 Ferrol, Spain
*
Author to whom correspondence should be addressed.
Appl. Sci. 2021, 11(13), 6198; https://doi.org/10.3390/app11136198
Submission received: 10 May 2021 / Revised: 29 June 2021 / Accepted: 2 July 2021 / Published: 4 July 2021
(This article belongs to the Special Issue Numerical Modeling in Energy and Environment)

Abstract

:

Featured Application

This work analyzes the Savonius vertical axis wind turbine. A new geometry inspired the Fibonacci’s spiral was analyzed, obtaining a considerable improvement by both CFD and experimental tests.

Abstract

In order to improve the efficiency of the Savonius type vertical axis wind turbine, the present work analyzes an improvement based on an innovative rotor geometry. The rotor blades are inspired on an organic shape mathematically analyzed, the Fibonacci’s spiral, presented in many nature systems as well as in art. This rotor was analyzed in a wind tunnel and through a CFD model. The power coefficients at different tip speed ratios (TSR) were characterized and compared for the Savonius turbine and two versions using the Fibonacci’s spiral. One of the proposed geometries improves the performance of the Savonius type. Particularly, the optimal configuration lead to an improvement in maximum power coefficient of 14.5% in the numerical model respect to a conventional Savonius turbine and 17.6% in the experimental model.

1. Introduction

Nowadays, the energy framework is experiencing a significant and fast change promoted by the awareness on climate change. In this framework, renewable energy plays an important role. Wind-power generation is one of the fundamental sources of renewable energy [1,2,3,4], which has become the major energy contributor to the renewable energy sector [5]. It is estimated that by 2030, wind energy will provide about 20% of the world’s electricity demand [6]. The main drawback, though, is that the wind resources are affected by wind volatility and, furthermore, sudden wind speed variations lead to an unstable operation of the wind turbine [7,8,9].
According to the orientation of the rotation axis, wind turbines are classified into horizontal axis wind turbines (HAWTs) and vertical axis wind turbines (VAWTs). VAWT are usually applied to small-scale, especially urban environments characterized by winds not totally appropriate to this end [10,11,12,13]. In addition, the power is generated in the place of consumption, reducing transportation losses [14]. In urban environments, the Savonius turbine constitutes one of the most appropriate candidates due to their adequacy to low wind velocities [13]. The Savonius wind turbine is a VAWT composed of two or three arc-type blades which can generate power even under poor wind conditions [15,16] such as bursts, fluctuating wind, and turbulence. In urban environments the Savonius VAWT offers an appropriate alternative since these turbines can start at low wind speeds and in highly turbulent flows. Other advantages are their simplicity, low cost, and independence on wind direction. In addition, these turbines are more easily maintained due to their small size and the fact that the alternator and gearbox can be placed on the ground. On the other hand, the main disadvantages of the Savonius turbines is the low power coefficient and efficiency in comparison with other VAWTs or HAWTs. In order to increase their efficiency and thus the power generation, these turbines have been studied for four decades. One of the most significant improvements consists on blade profiles that are not semicircular, initially proposed by Sigur Savonius [17]. In recent years, important investigations have been carried out to improve the semicircular blade profile. Most of these studies have proposed elliptical blade profiles as optimal geometries to increment the power produced by the vertical axis Savonius turbines [18,19,20,21,22,23,24].
After analyzing several models and taking into account the tendency observed in the literature, the present work proposes a nature-inspired blade profile, particularly a blade profile inspired by the Fibonacci’s spiral, based in turn on Fibonacci’s mathematical sequence. This is presented in many natural contexts such as the formation of some flowers and fruits, hurricanes, and even the galaxies with their rotation movements. The geometry proposed in the present work was analyzed both experimentally and numerically. The experimental analysis were carried out in a wind tunnel. The numerical analysis were developed by a 3D CFD (Computational Fluid Dynamics) model. Two different Fibonacci inspired geometries were compared with the Savonius turbine. The objective of the present work is to advance in the search for a more efficient blade geometry for a Savonius type VAWT. To this end, a modified blade profile has been implemented. The improvement in performance offered by the proposed geometry has been tested both numerically and experimentally, taking as a reference the performance of the VAWT with a semicircular profile. The numerical analysis was developed using a 3D CFD (Computational Fluid Dynamics) model. The corresponding experimental verifications were carried out in a wind tunnel, maintaining the premise of seeking clarity in the comparison despite having to lose precision in the replica of the numerical model. Two different Fibonacci-inspired geometries were compared with the Savonius turbine. In relation to biological inspirations, it is worth mentioning that two of the authors of the present work investigated an innovative propulsion for aquatic devices through biological inspiration in previous works, obtaining successful results [25,26,27].

2. Materials and Methods
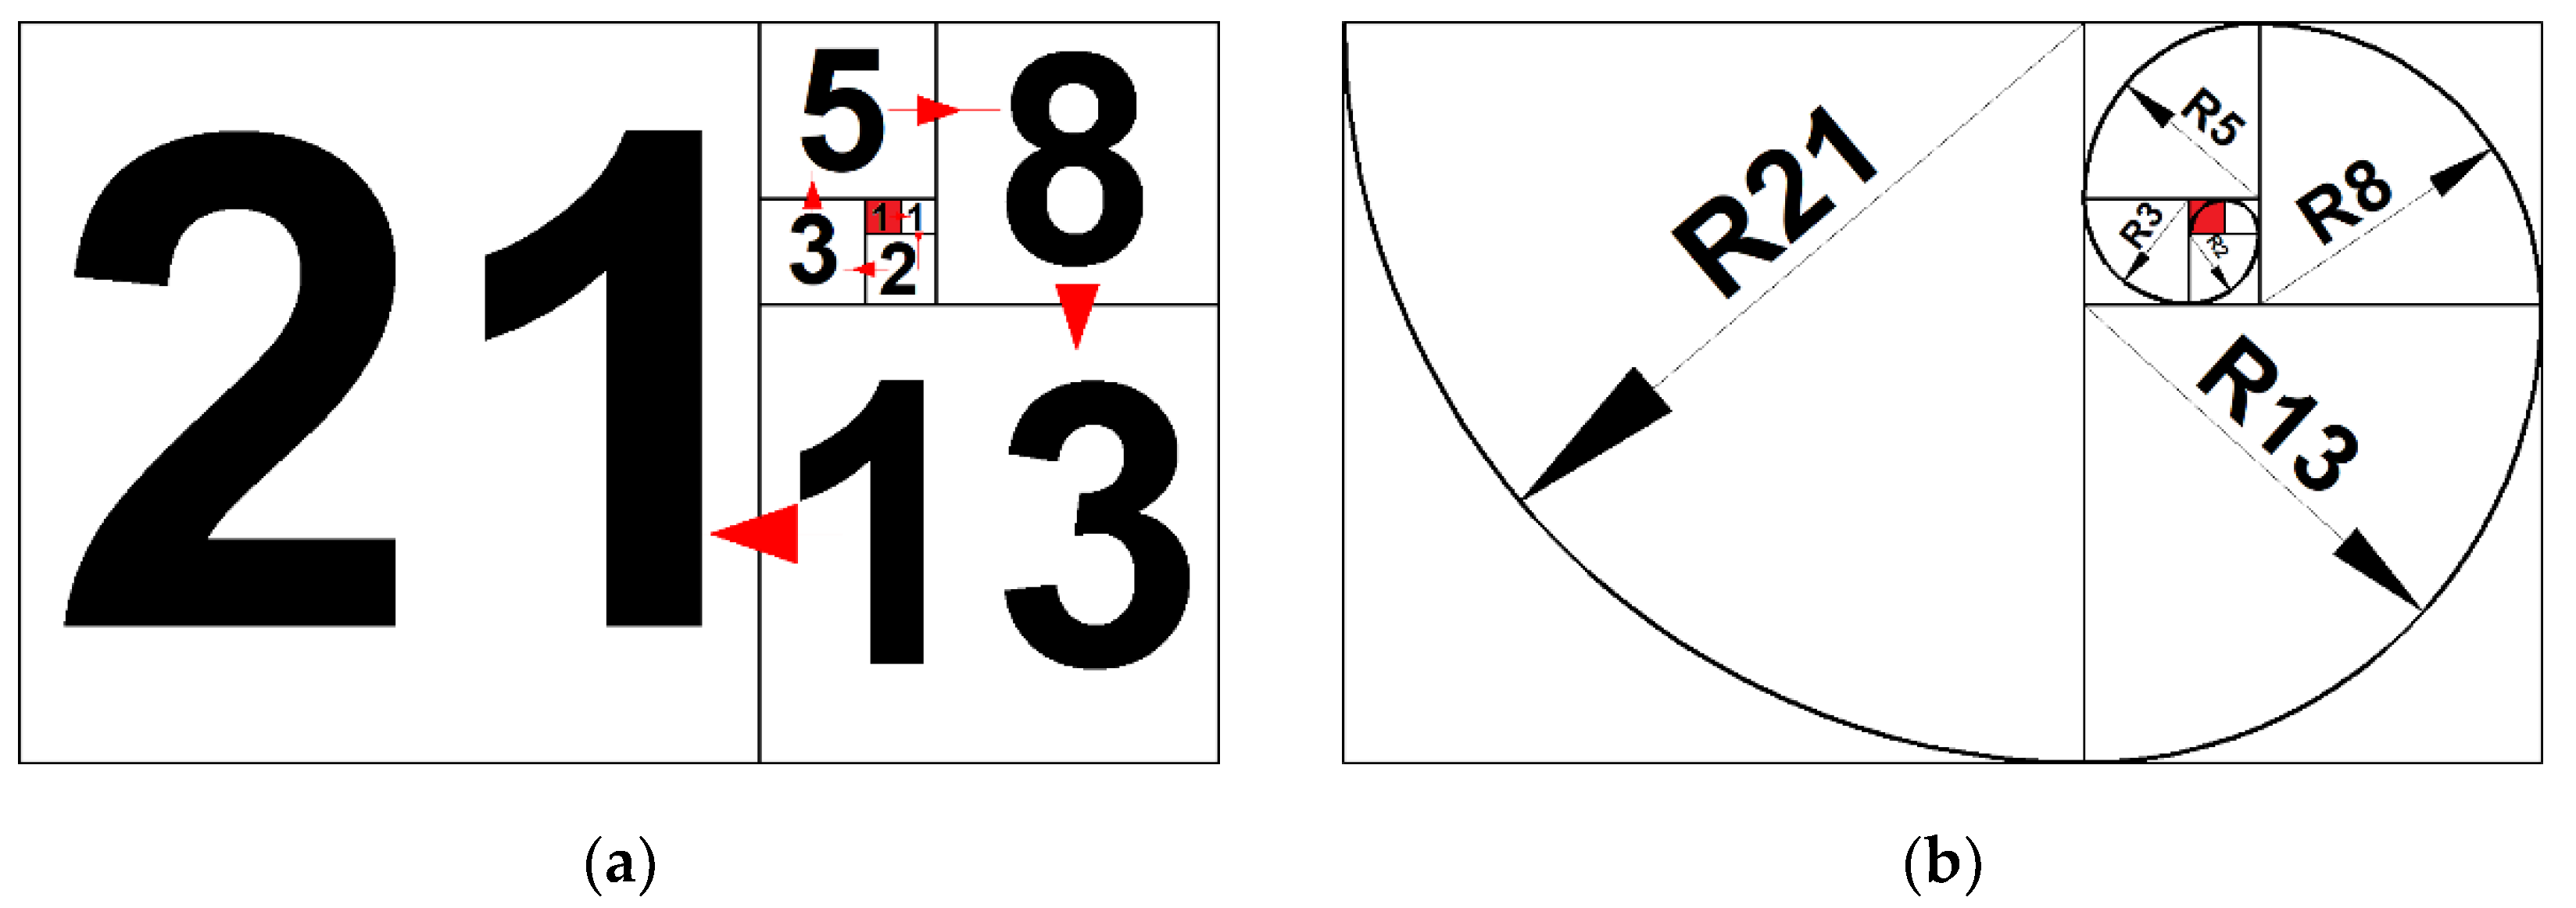
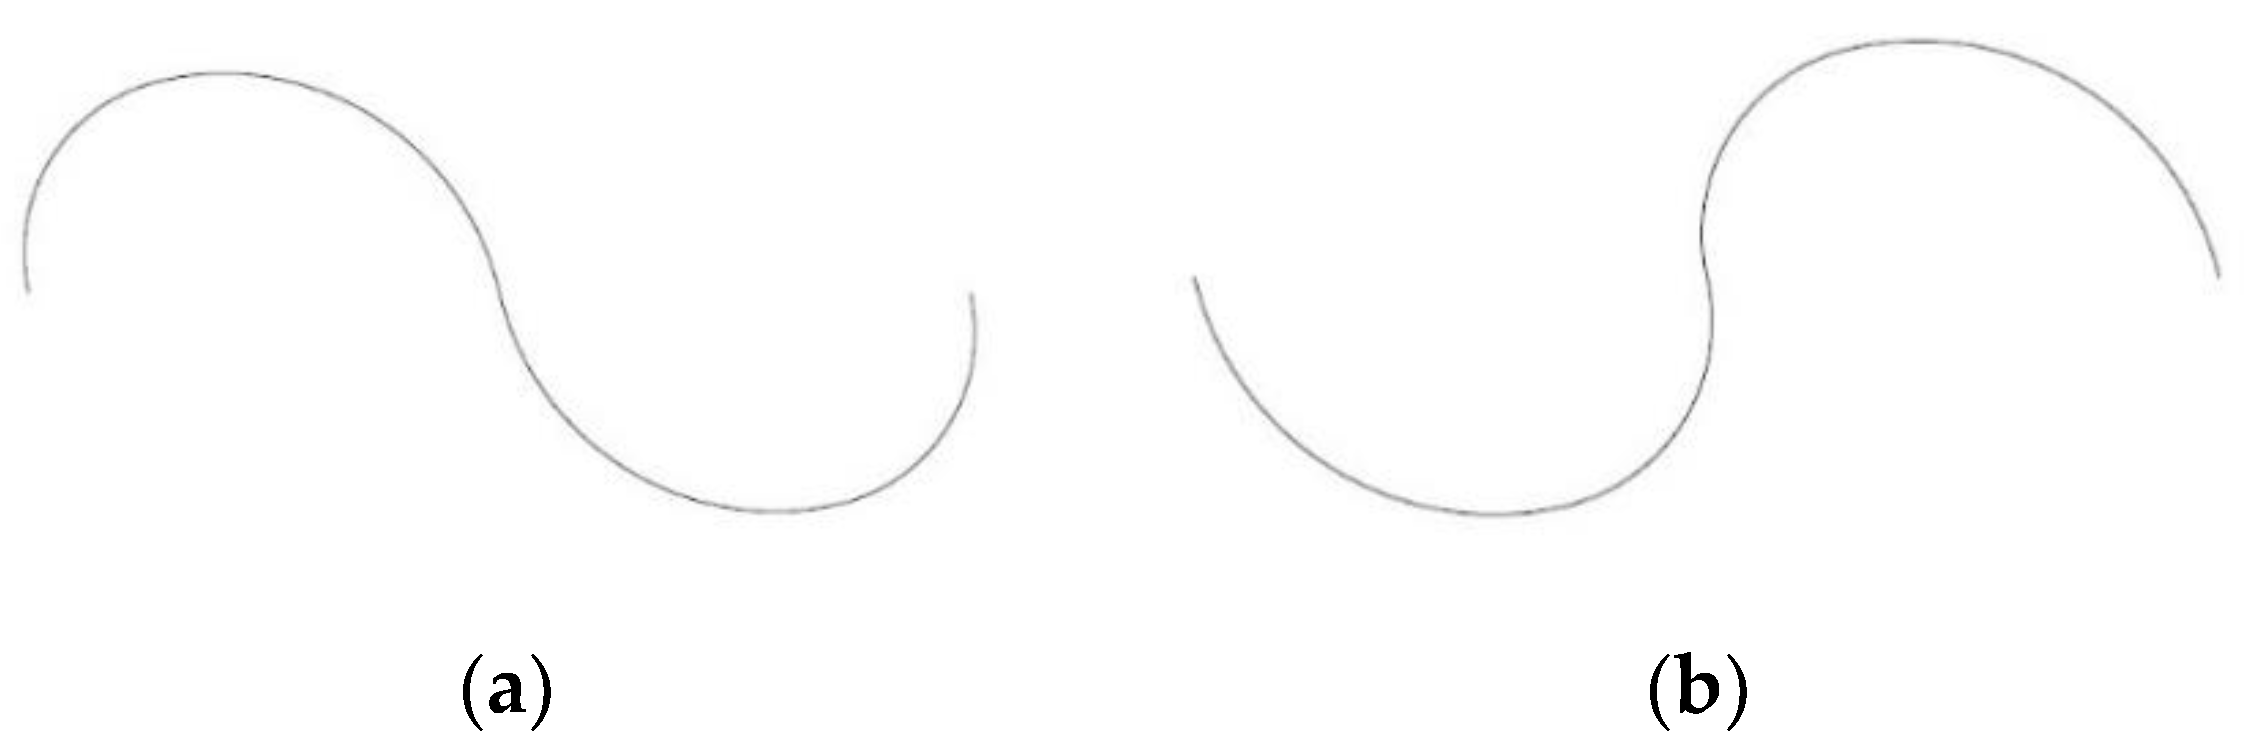
2.1. Blade Profile

The nature-inspired blade profile analyzed in the present work is constituted by two consecutive sections of the Fibonacci’s spiral, obtained through Fibonacci’s mathematical sequence. The Fibonacci sequence is recurrent, i.e., all previous terms are needed to compute a specific term. Equations (1)–(3) define the recurrence relation:
f 0 = 0
f 1 = 1 ,   if   n = 1
f n = f n 2 + f n 1 ,   if   n   >   1
where f is the relative square size and n is the number of squares.
The procedure to establish the graphical representation is based on a set of squares whose length is given by the successive terms of the Fibonacci’s sequence. These squares must be placed as shown in Figure 1a, where the numbers represent the relative size of each square side. According to Equations (1)–(3), the relative size of the sequence is 0, 1, 1, 2, 3, 5, 8, 12, 21, etc. As can be seen in Figure 1a, the first square has been colored in red. The second square is placed on the right of the previous one, the third square below the second one, the fourth on the left of the third one, and so on. The next step consists on drawing an arc as shown in Figure 1b.
This work proposes a 200 mm height rotor based on two Fibonacci spirals corresponding to the consecutive terms 34 and 55 of the sequence. Two support endplates have been incorporated. These dimensions have been chosen according to the size of the wind tunnel, 400 × 400 mm, used for the experimental setup. The goal was to obtain as much clarity as possible in the comparison. The higher the rotors are, the clearer the contrast is, but the accuracy is reduced due to the blockage effect [28]. The position of both these arcs relative to the rotating axis leads to two different configurations, Figure 2a,b.
Both profiles shown in Figure 2a,b, Fibonacci I and Fibonacci II, respectively, have been analyzed. The characteristics of these geometries are shown in Table 1. The parameters shown in this table are illustrated in Figure 3. As can be seen, the configuration Fibonacci II is obtained from Fibonacci I by simply inverting the order of the arcs, leading to a lower rotor diameter.

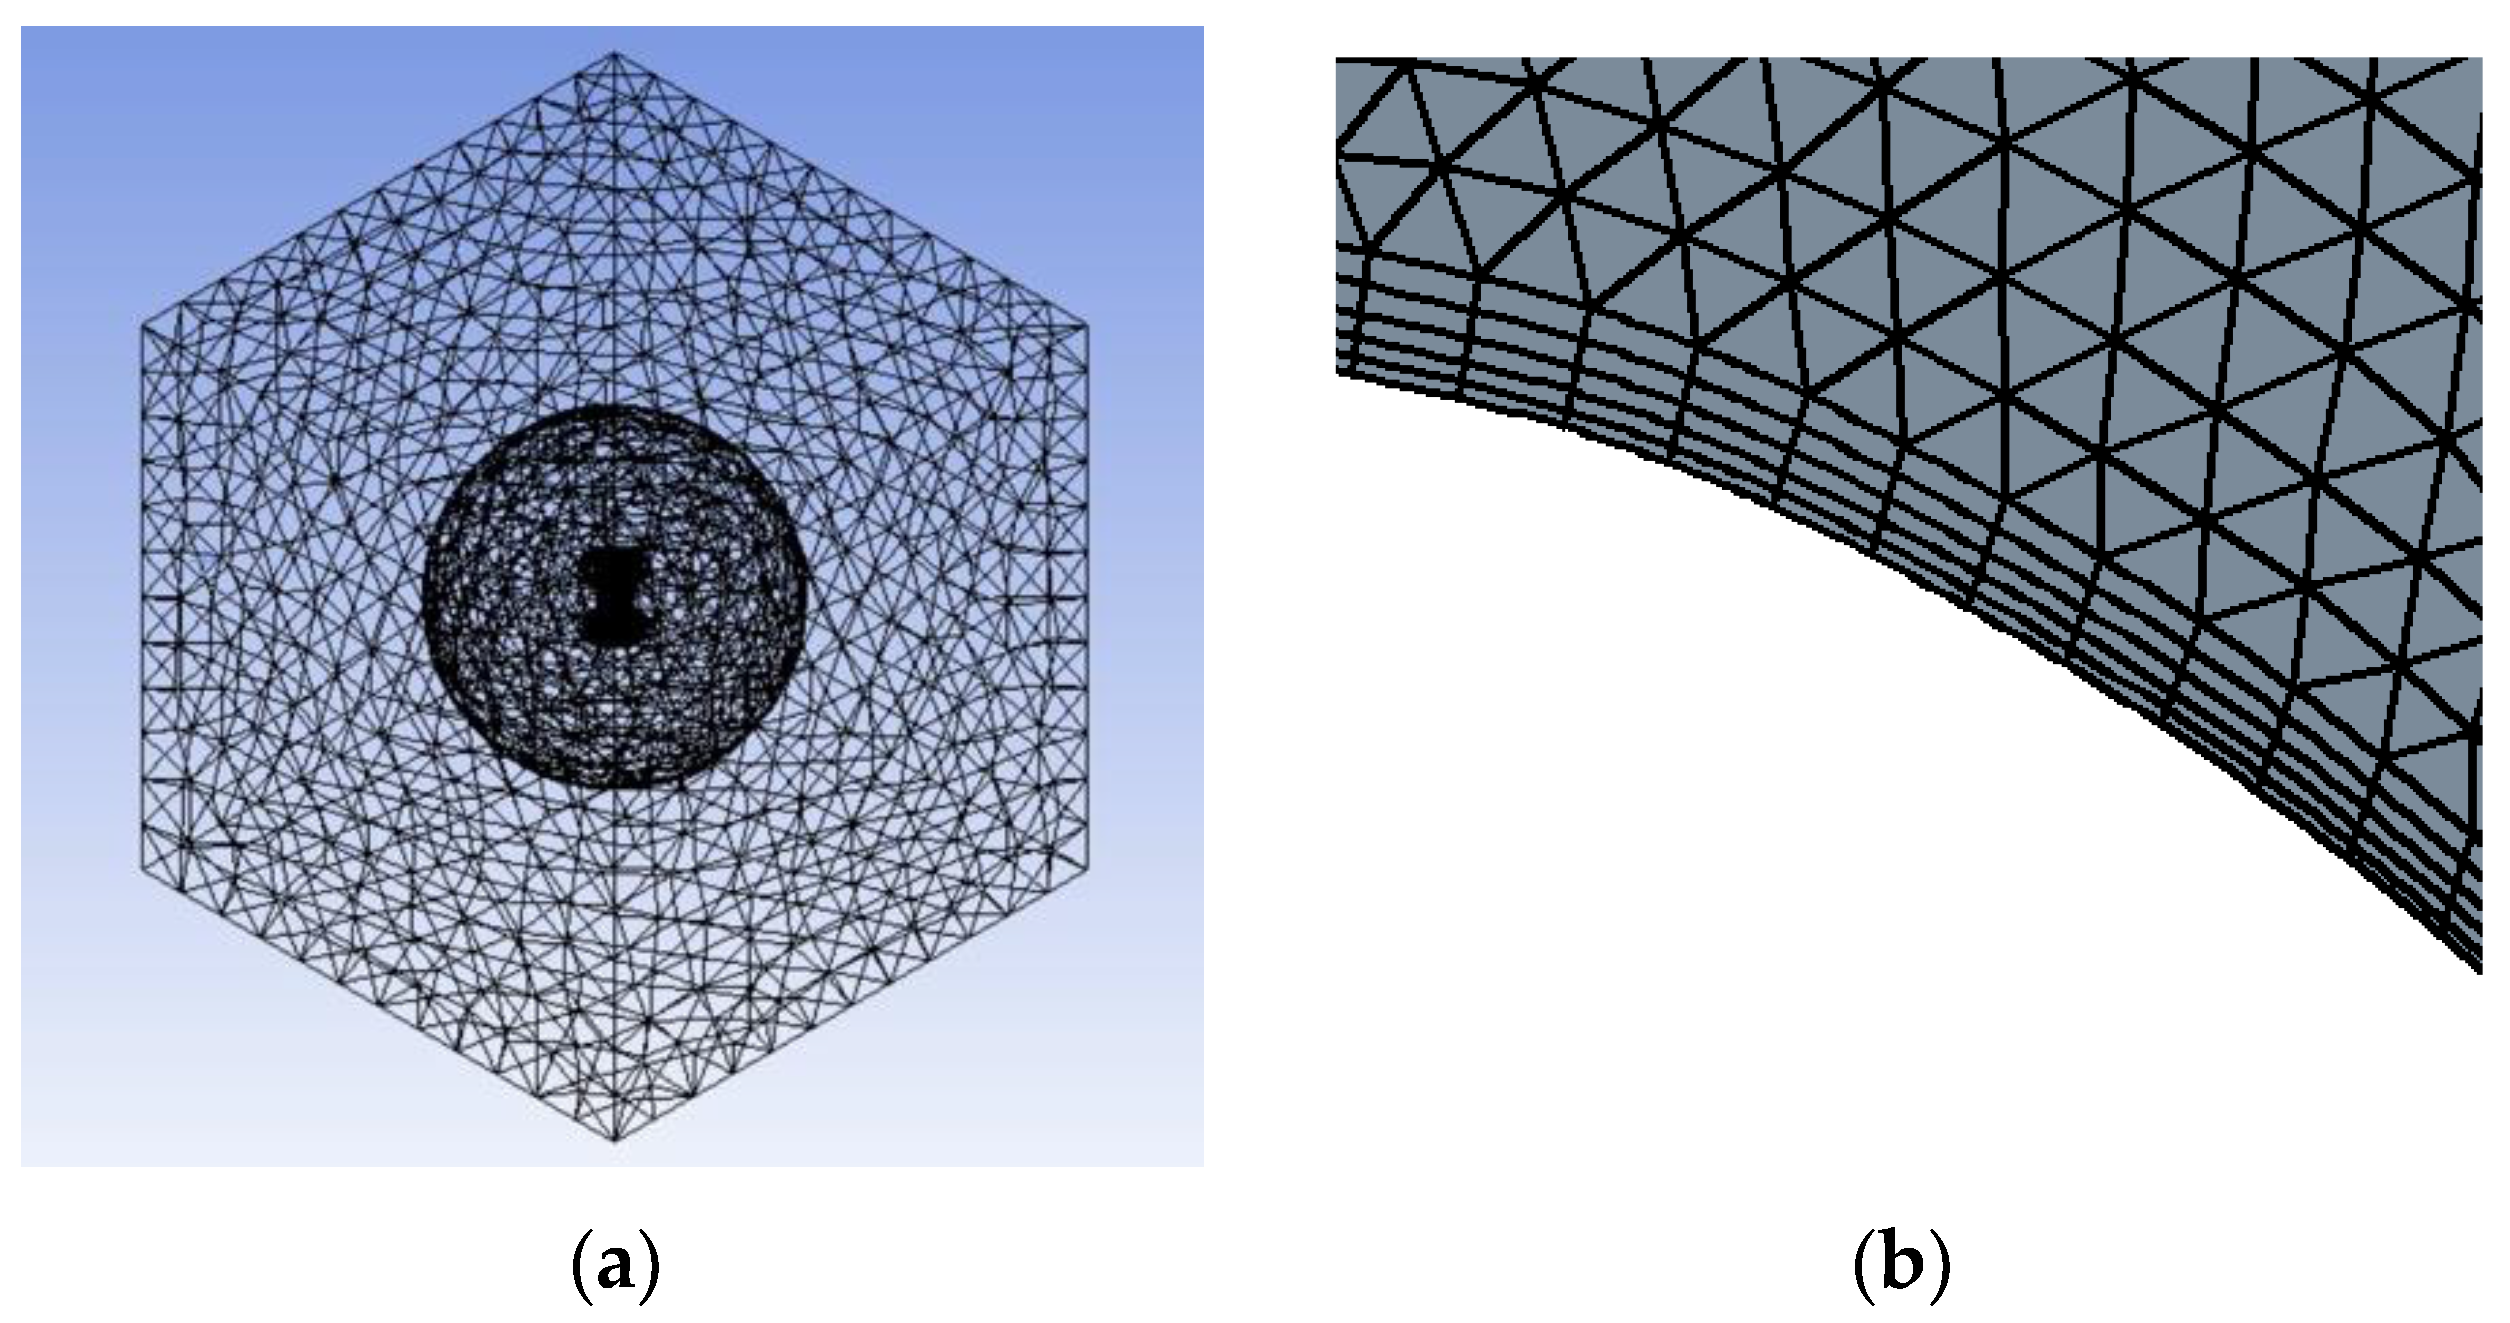
2.2. Numerical Model

A CFD model was carried out to analyze the wind turbines. This model is based on the RANS equations (Reynolds-averaged Navier–Stokes) of conservation of mass and momentum. The turbulence was treated through the k-ε turbulence model. The geometry was realized using Siemens NX and the CFD computation using Ansys Fluent.
The SIMPLE algorithm was chosen for the pressure–velocity coupling and a second order upwind scheme was employed to discretize the governing equations. The convergence was determined by 0.001 residuals as convergence criterion. The maximum number of iterations per time step was established as 20. The temporal treatment was resolved through an implicit method with a constant time step corresponding to 1° of rotor rotation. It was verified that this time step size is small enough to provide accurate results. In order to reach a situation which periodically repeats, i.e., a quasi-steady state, it was necessary to study a long enough interval of time. For the cases studied, it was verified that this state is achieved after approximately twenty revolutions. For this reason, all the results carried out in the present work correspond to the 20th revolution.
The computational mesh is shown in Figure 4a. It was realized using the mesh tool in ANSYS and consists of around 5 × 10⁵ tetrahedral elements. Several size meshes were tested in order to verify its adequacy. The mesh size was refined near the turbine, Figure 4b, and a boundary layer was set near the wall, in order to treat the boundary layer flow. Five layers were set, with a layer growth rate of 1.2. The size of the first layer fulfills y+ values between 30 and 300, depending on the rotation velocity. This range of y+ values is adequate to use the standard wall functions, employed in the present work to account for turbulent effects near the wall. Two zones were differenced, internal and external. The internal zone is spherical, 1000 mm diameter, and rotates around the axis. The external zone is static. It is a cube with side size 2000 mm. The inner boundaries of the static domain coincide with the outer boundaries of the rotating domain. A sliding mesh technique was adopted to interpolate the values at the boundary between the rotating and static domains. The initialization is based on a rotating reference frame simulation.
The boundary conditions are shown in Figure 5. The upstream surface was modelled as a velocity inlet with 7 m/s velocity, 5% turbulent intensity, and 0.028 m length scale. The downstream surface as pressure outlet, 0 Pa (gauge), 5% turbulent intensity, and 0.028 m length scale. A no-slip condition was imposed at the surface of the blades. An interface was imposed at the overlap surface between the adjacent domains in order to allow the transport of the flow properties. Finally, the external walls were modeled as no-slip.

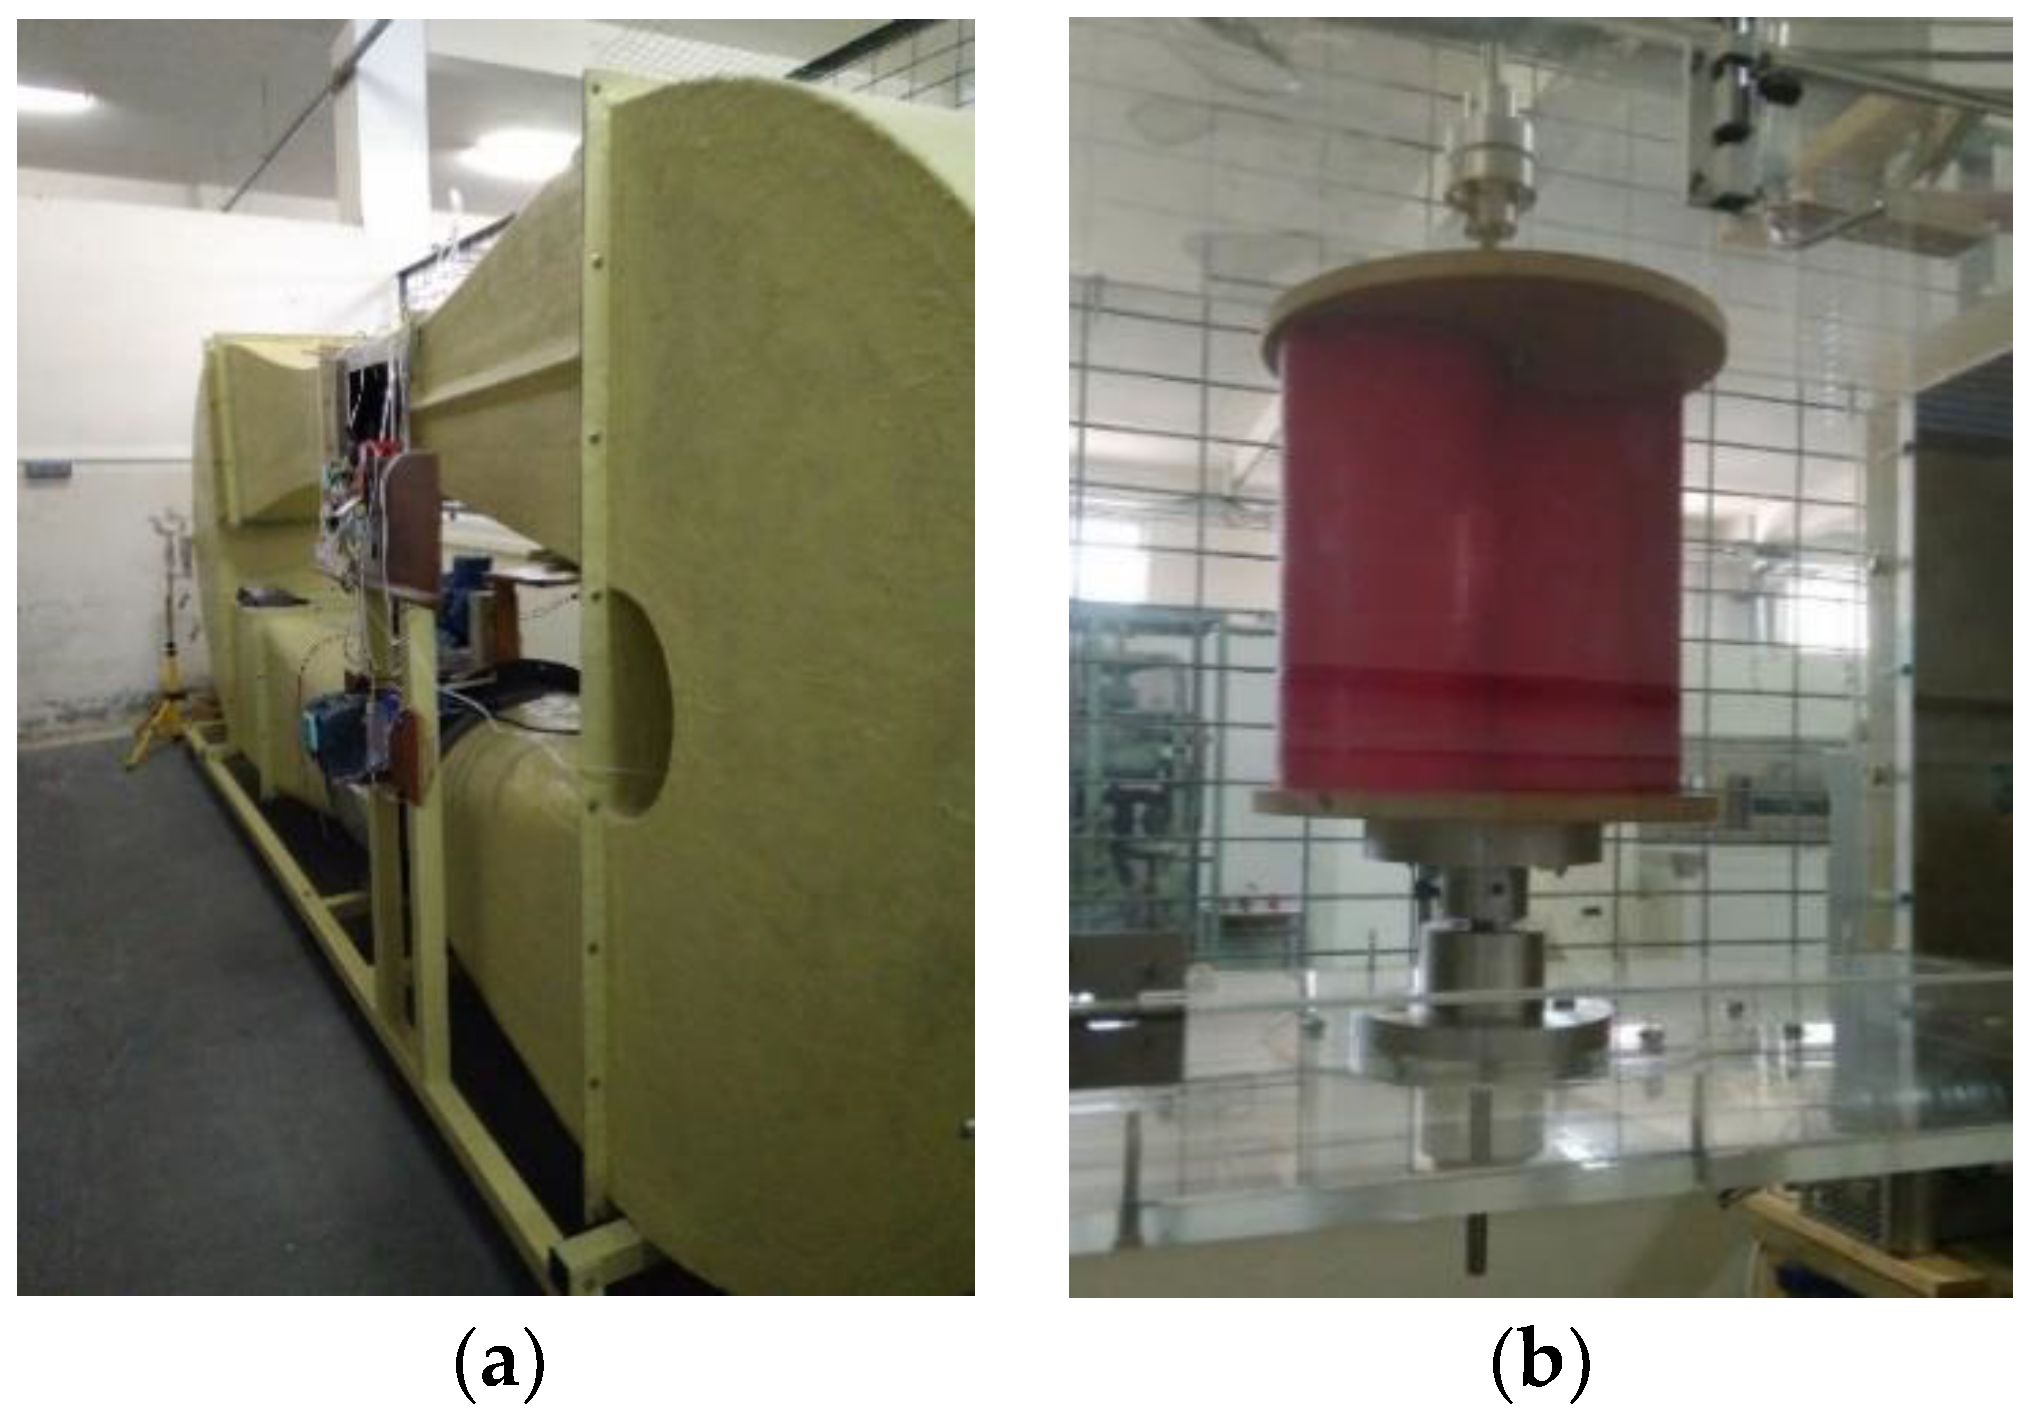
2.3. Experimental Setup

An experimental setup was carried out in the subsonic closed circuit wind tunnel of the Nautical Sciences and Marine Engineering department of University of Coruña, Figure 6a. This tunnel has a 400 × 400 × 800 mm (height × width × length) test section made of transparent glass, Figure 6b.
A flow fan is controlled through a variable-frequency drive, which provides a maximum speed of 16 m/s. A DC generator was attached to the rotor axis. A 50 Ω and 50 W rheostat was connected after the generator in order to regulate the braking torque in the turbine axis and thus the RPM. The power was characterized through readings of both intensity and voltage by means of a Keysight DSO306A oscilloscope. The readings of wind velocity were obtained through a Pitot tube connected to a KIMO MP200 manometer.

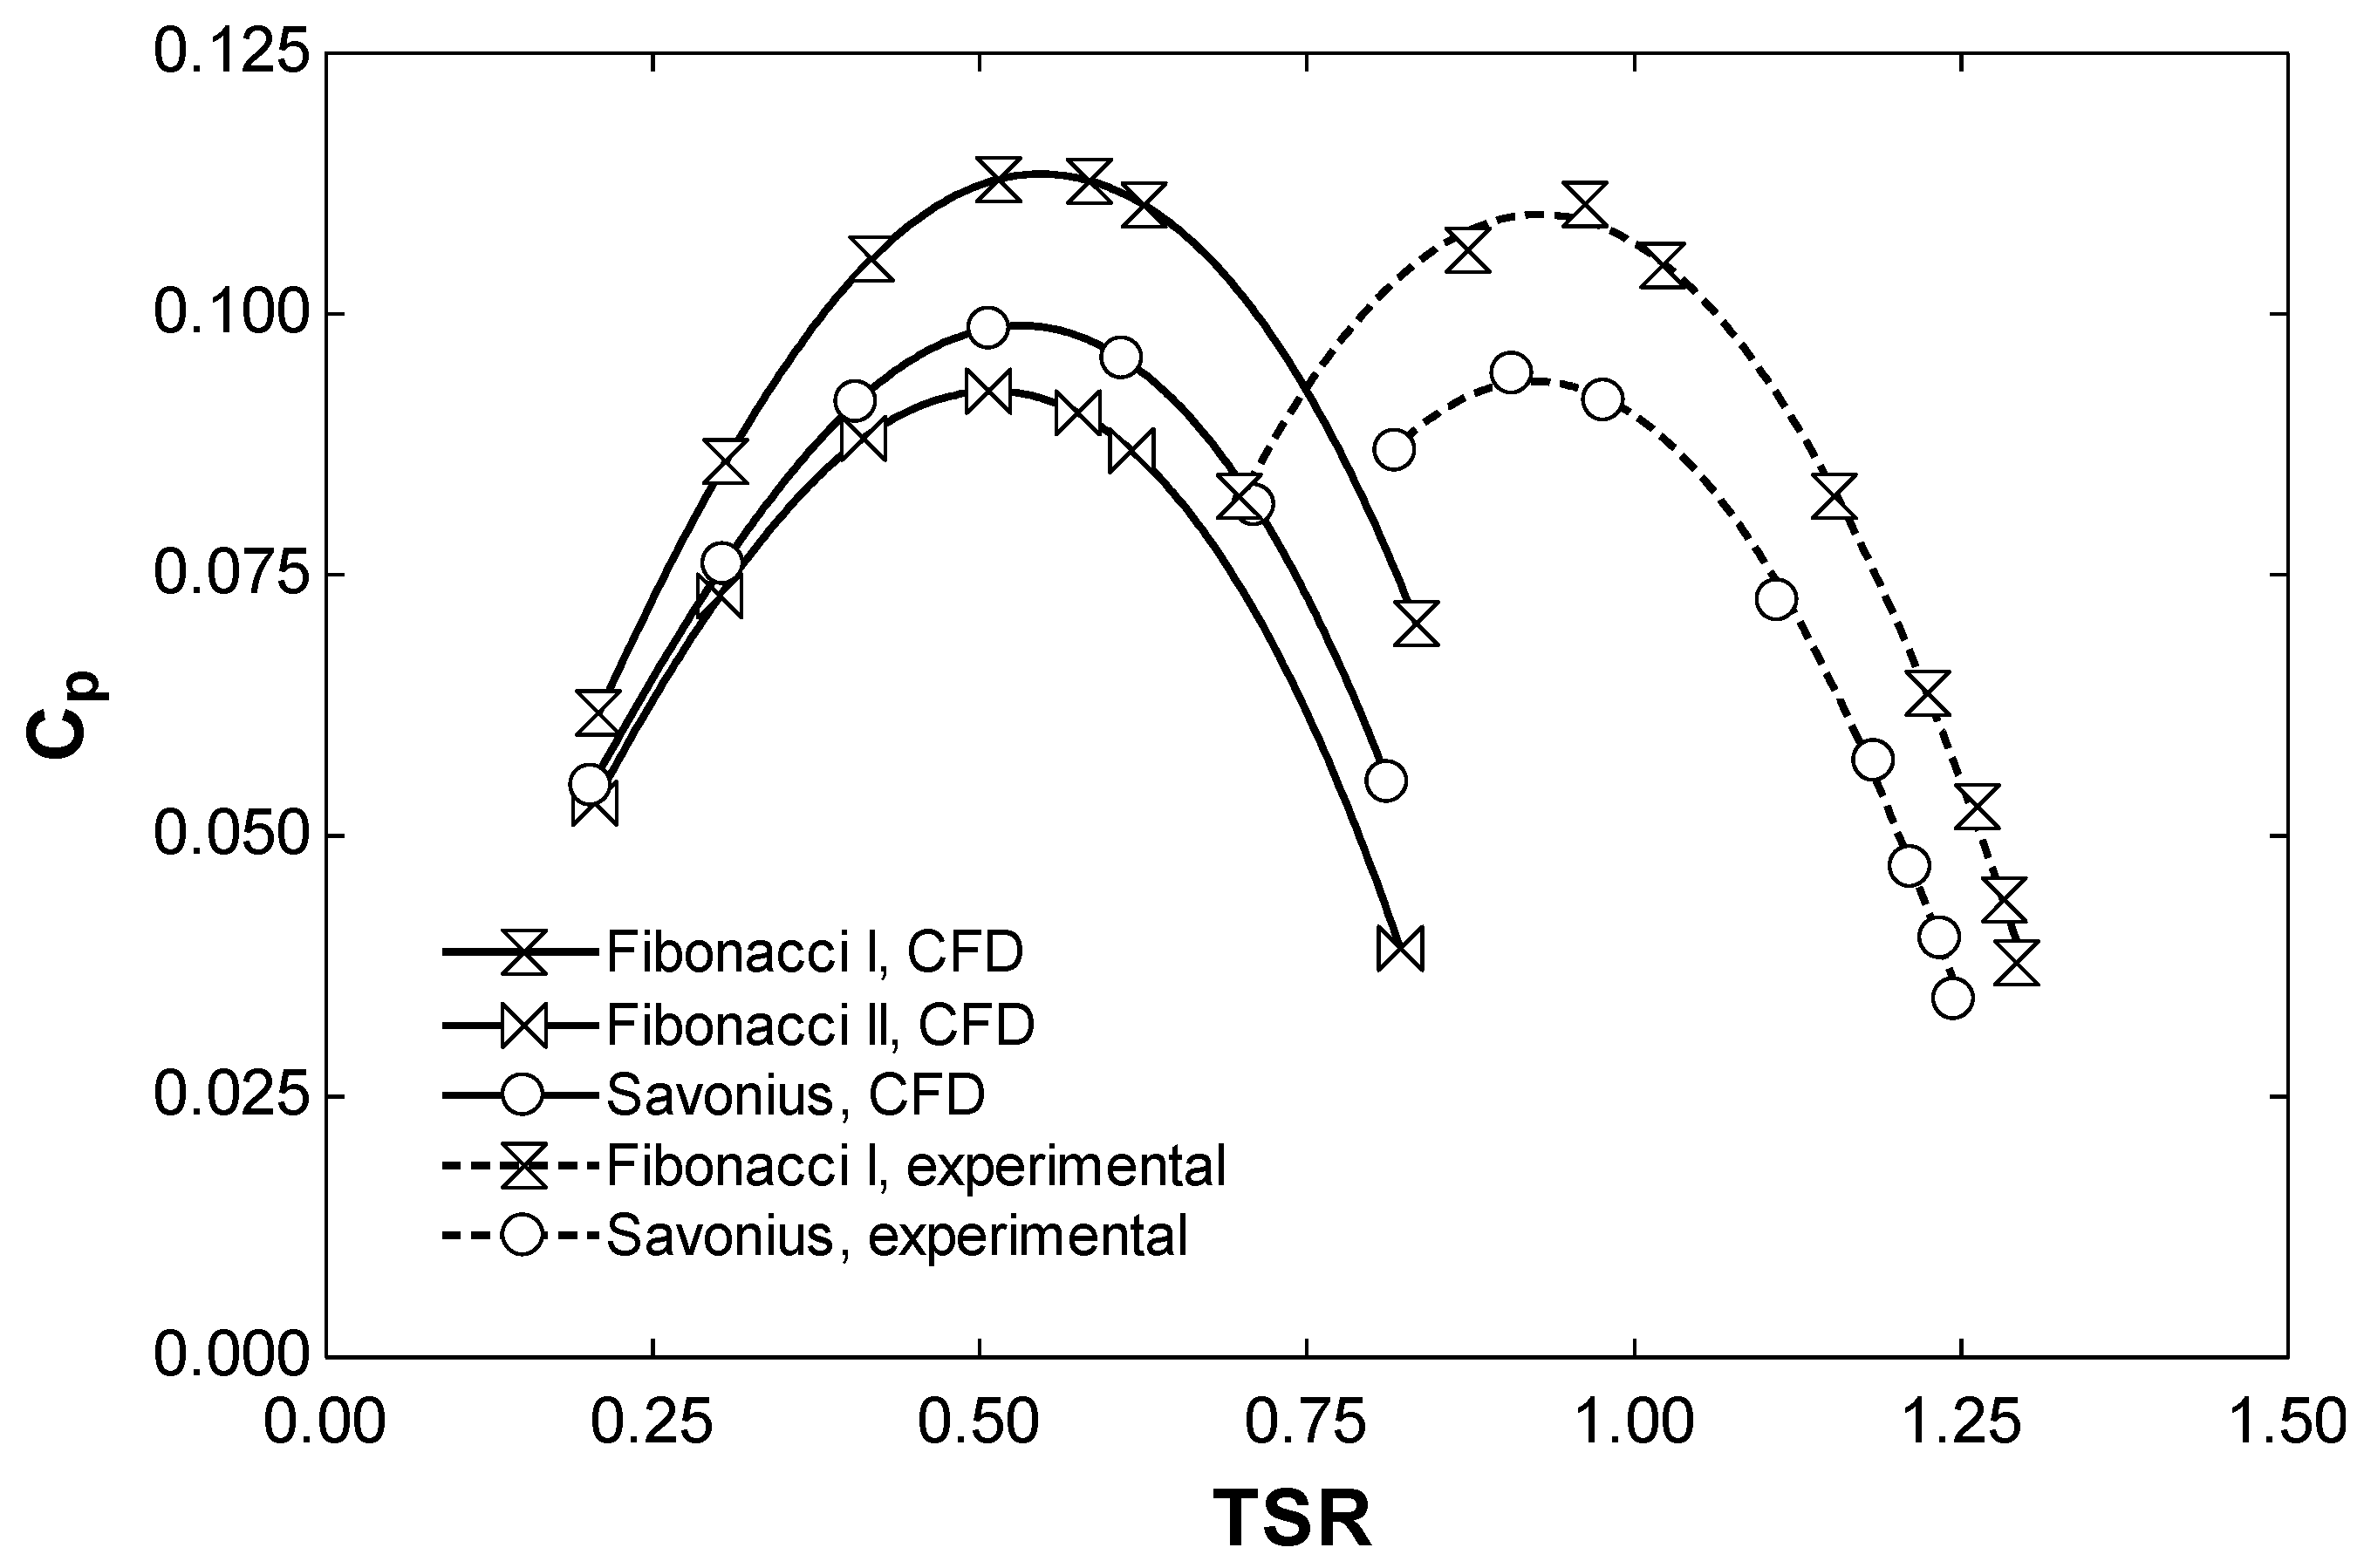
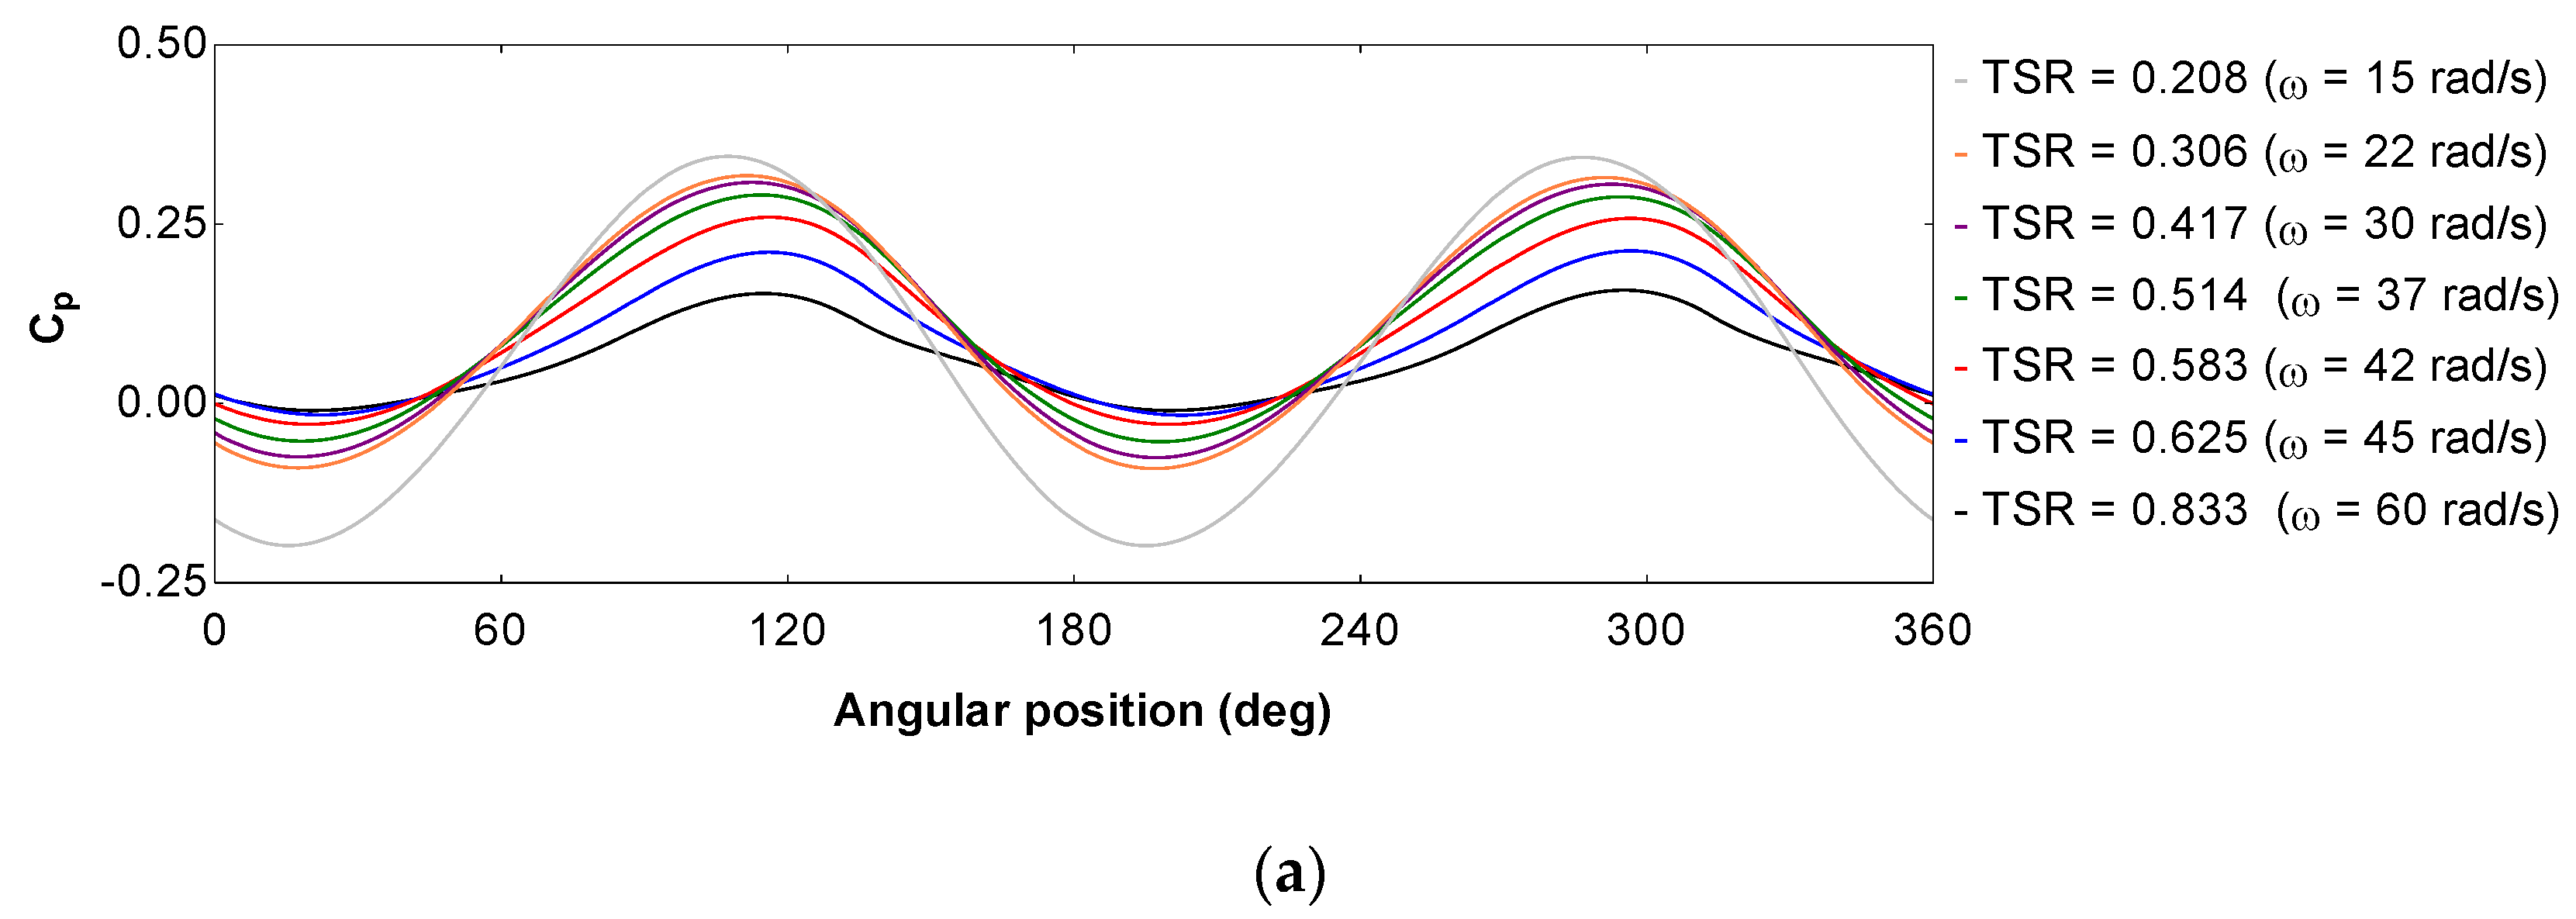
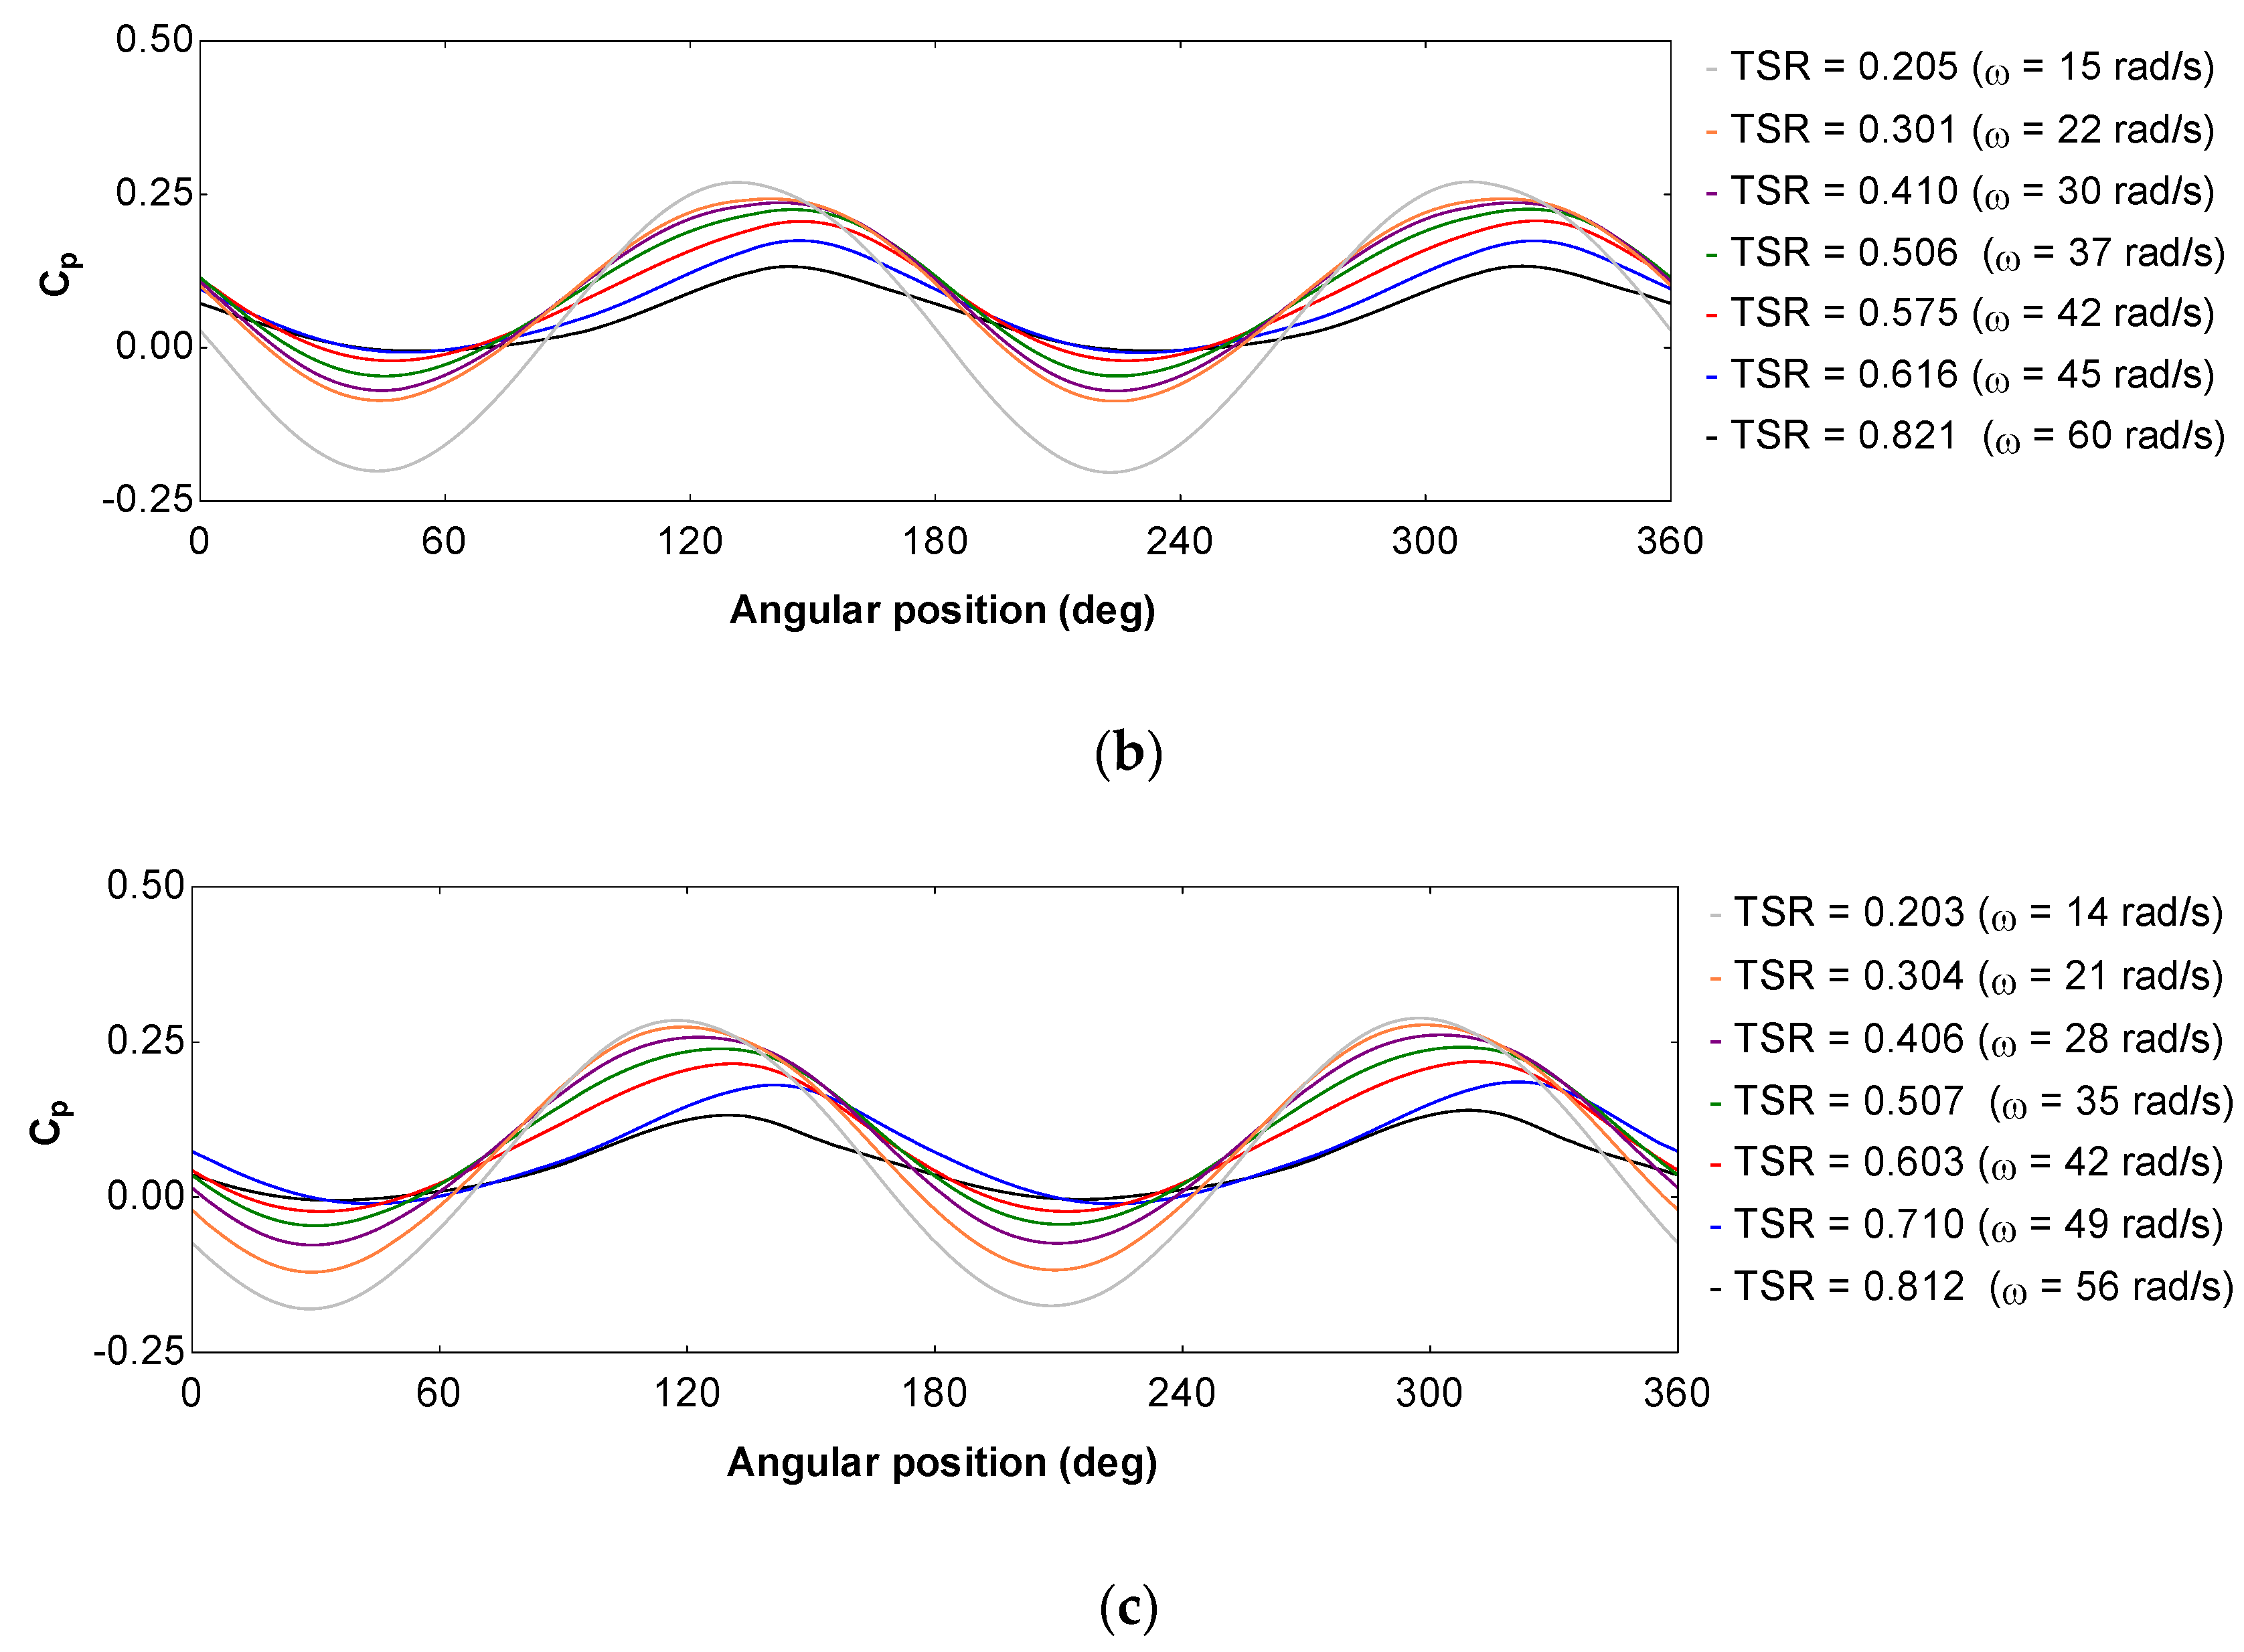
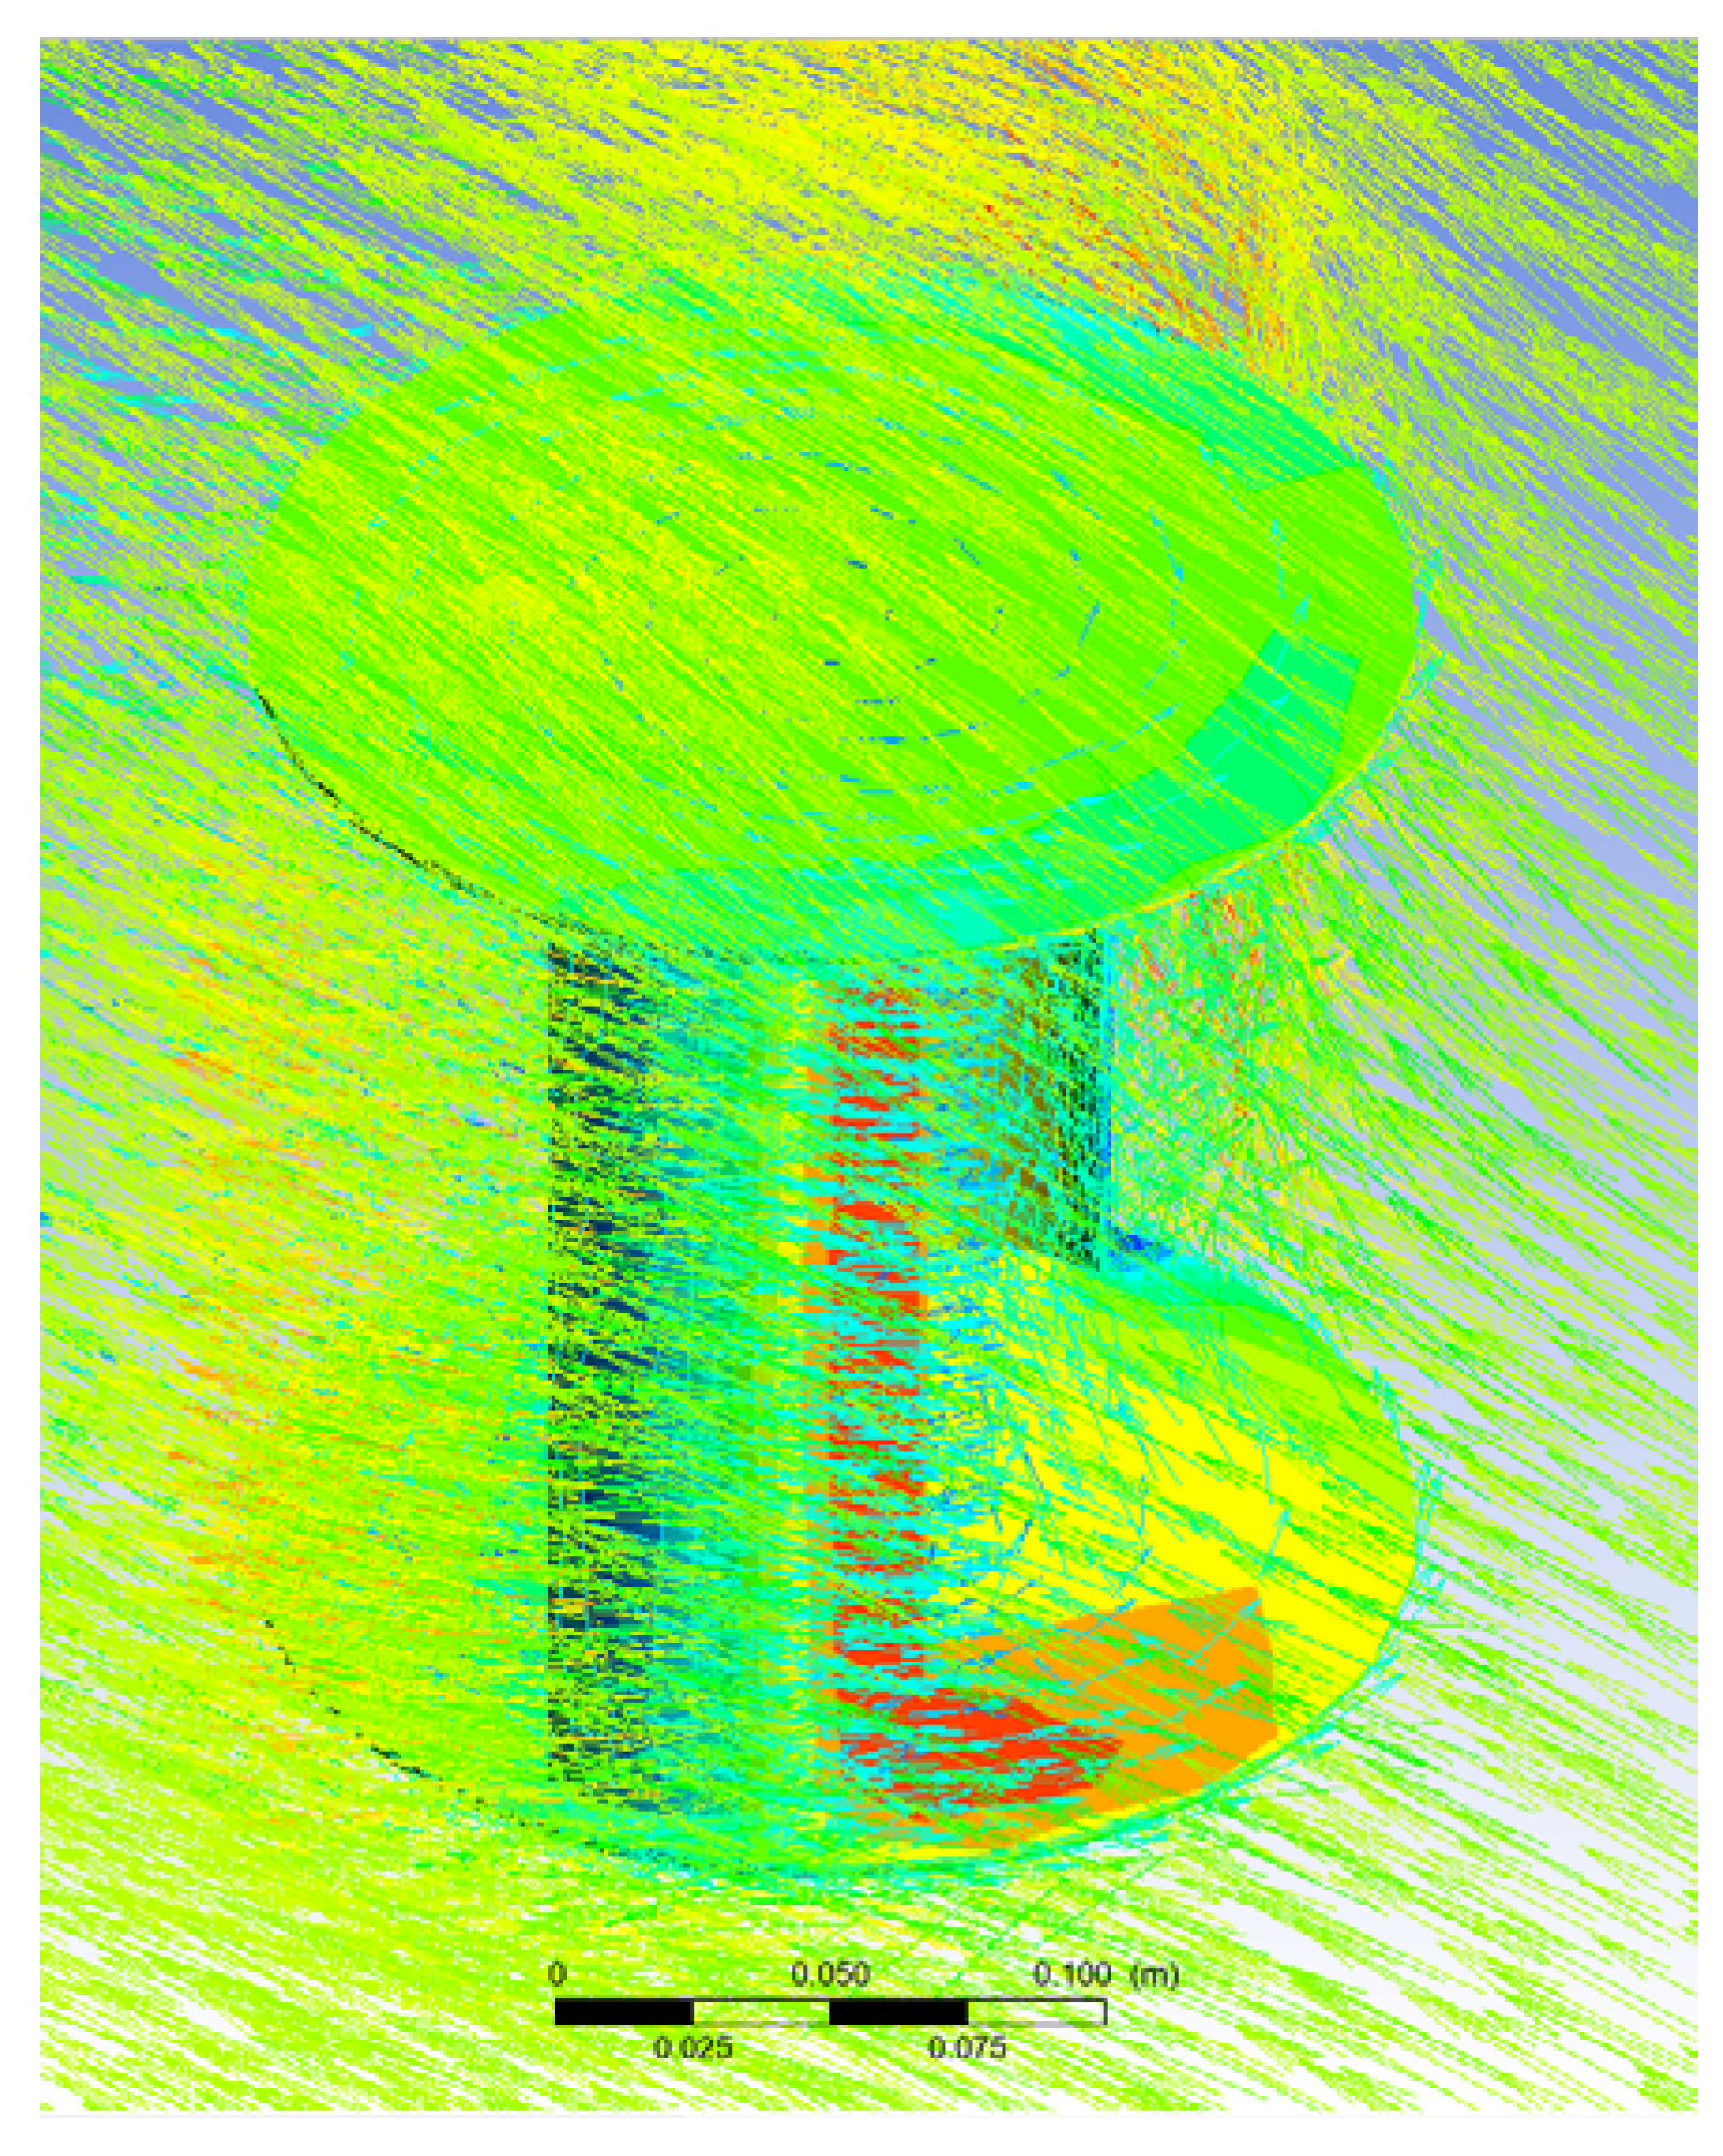
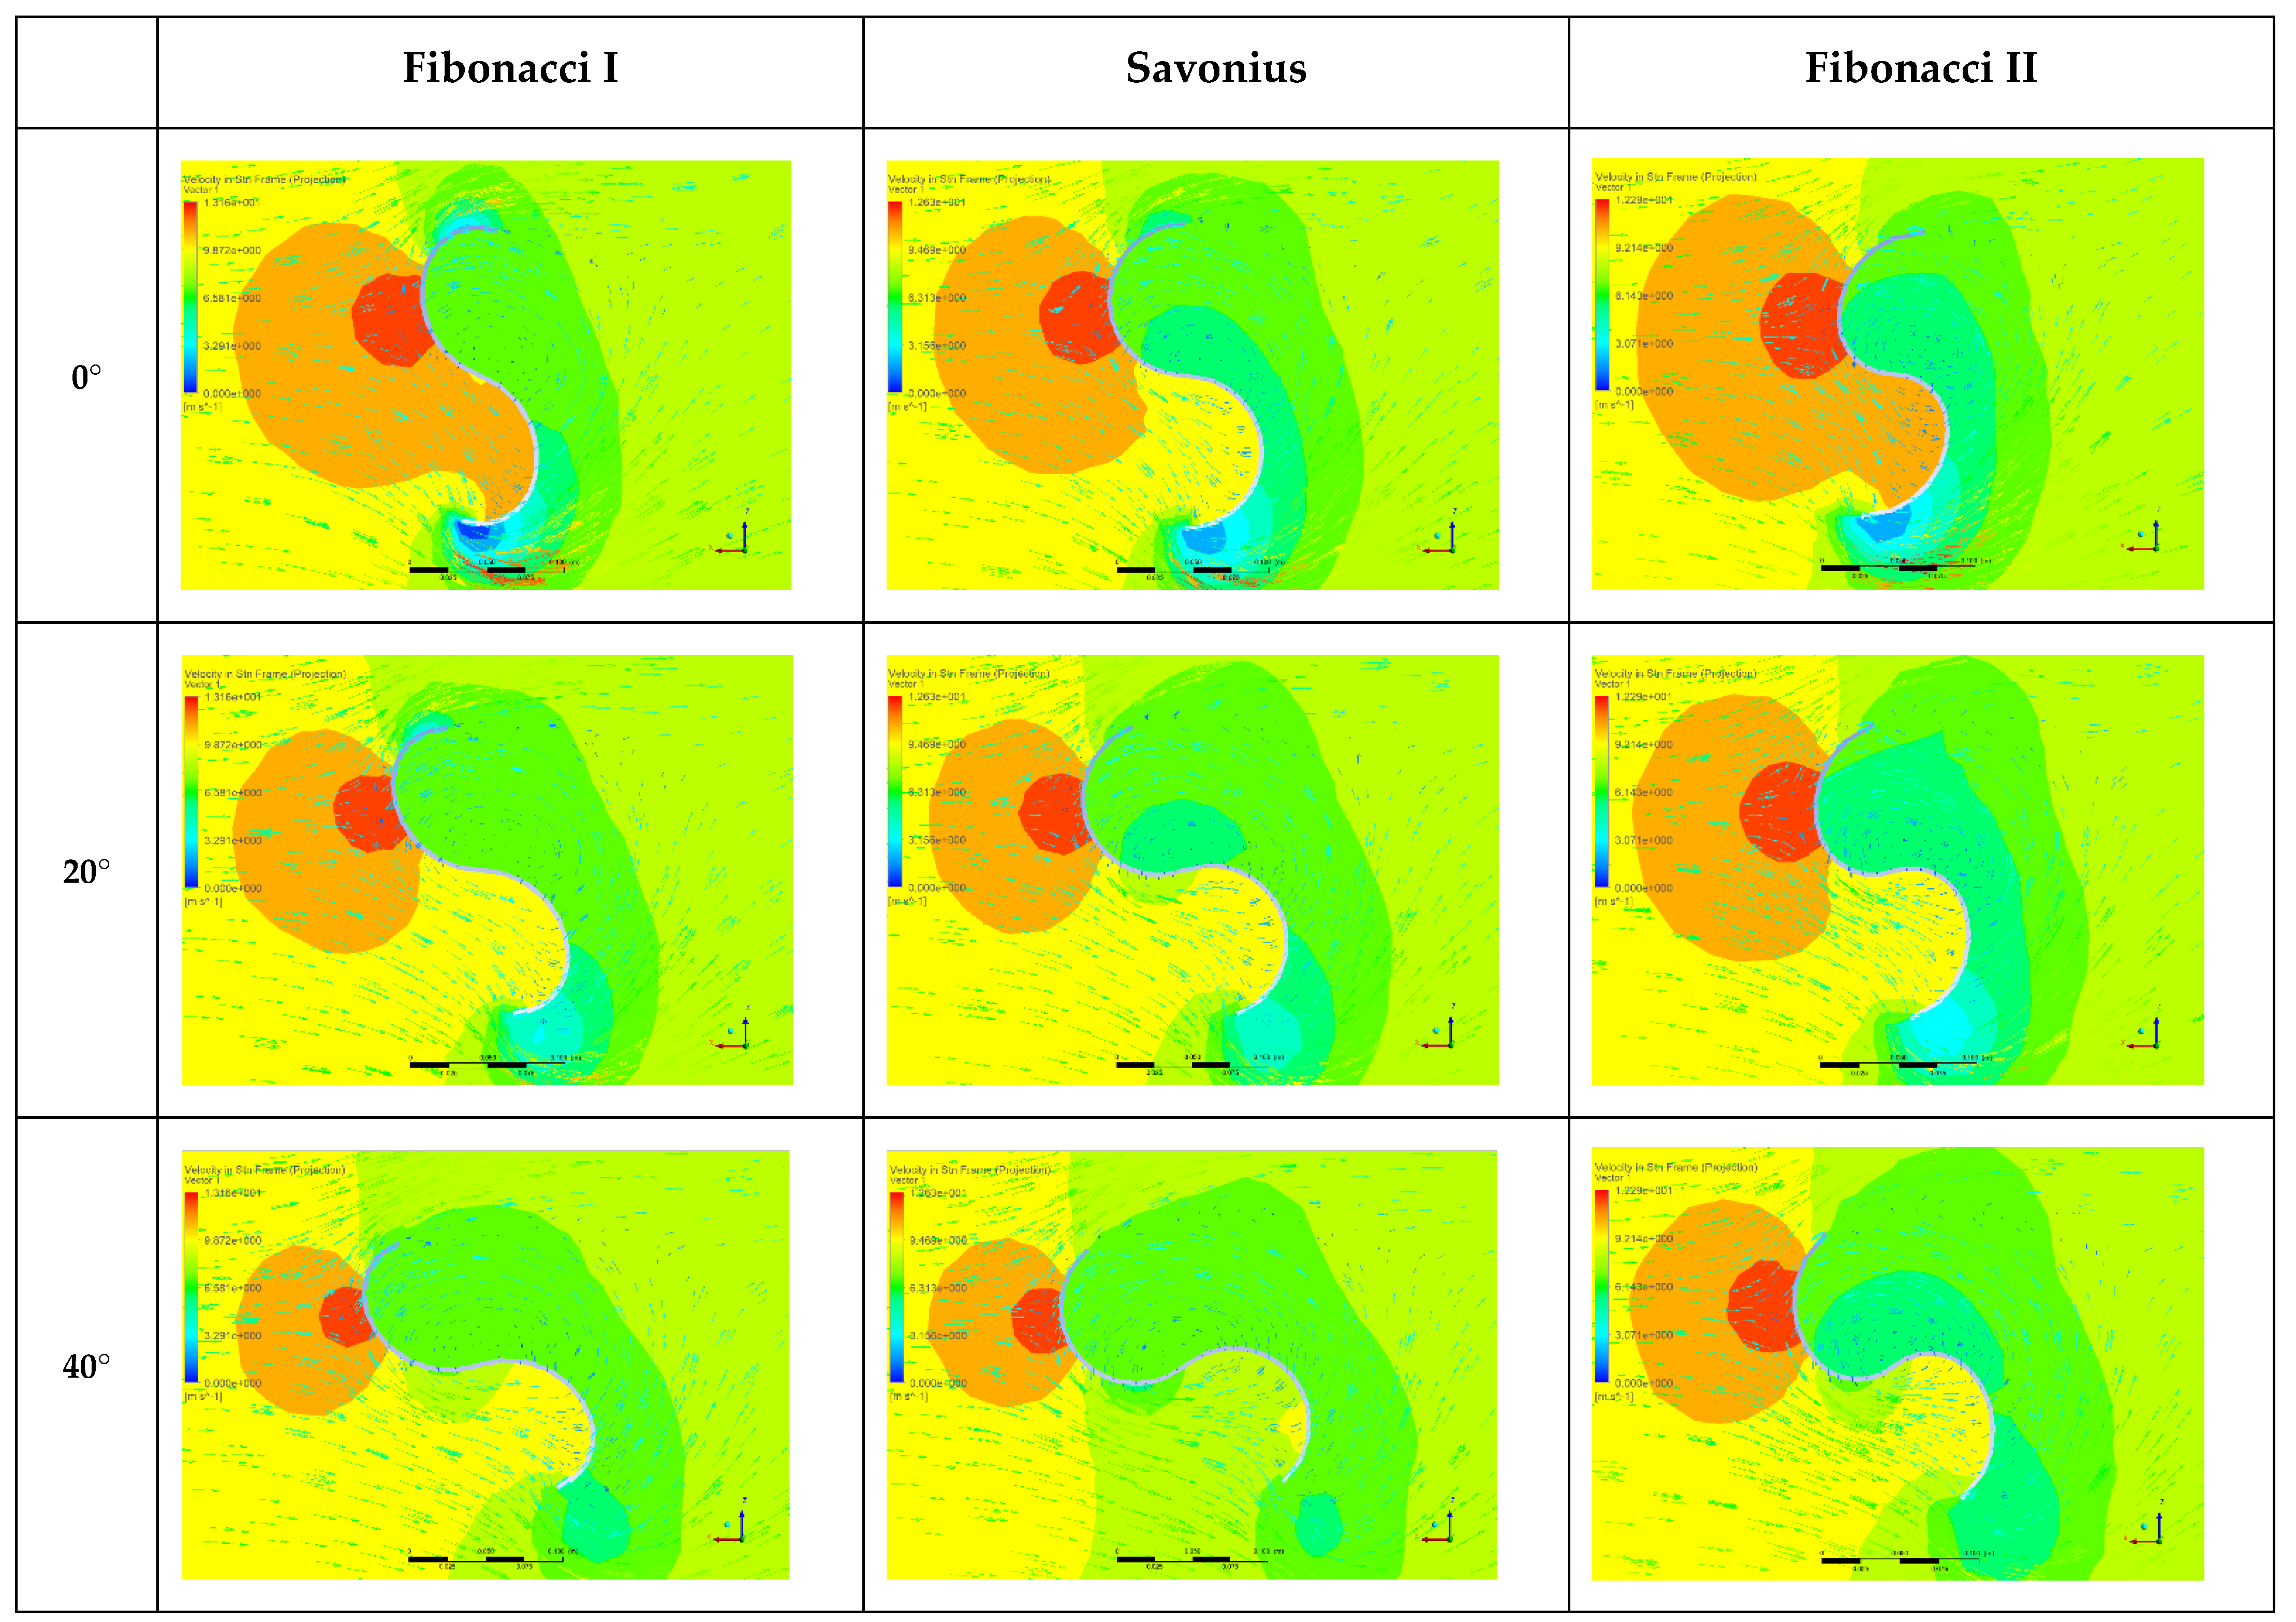
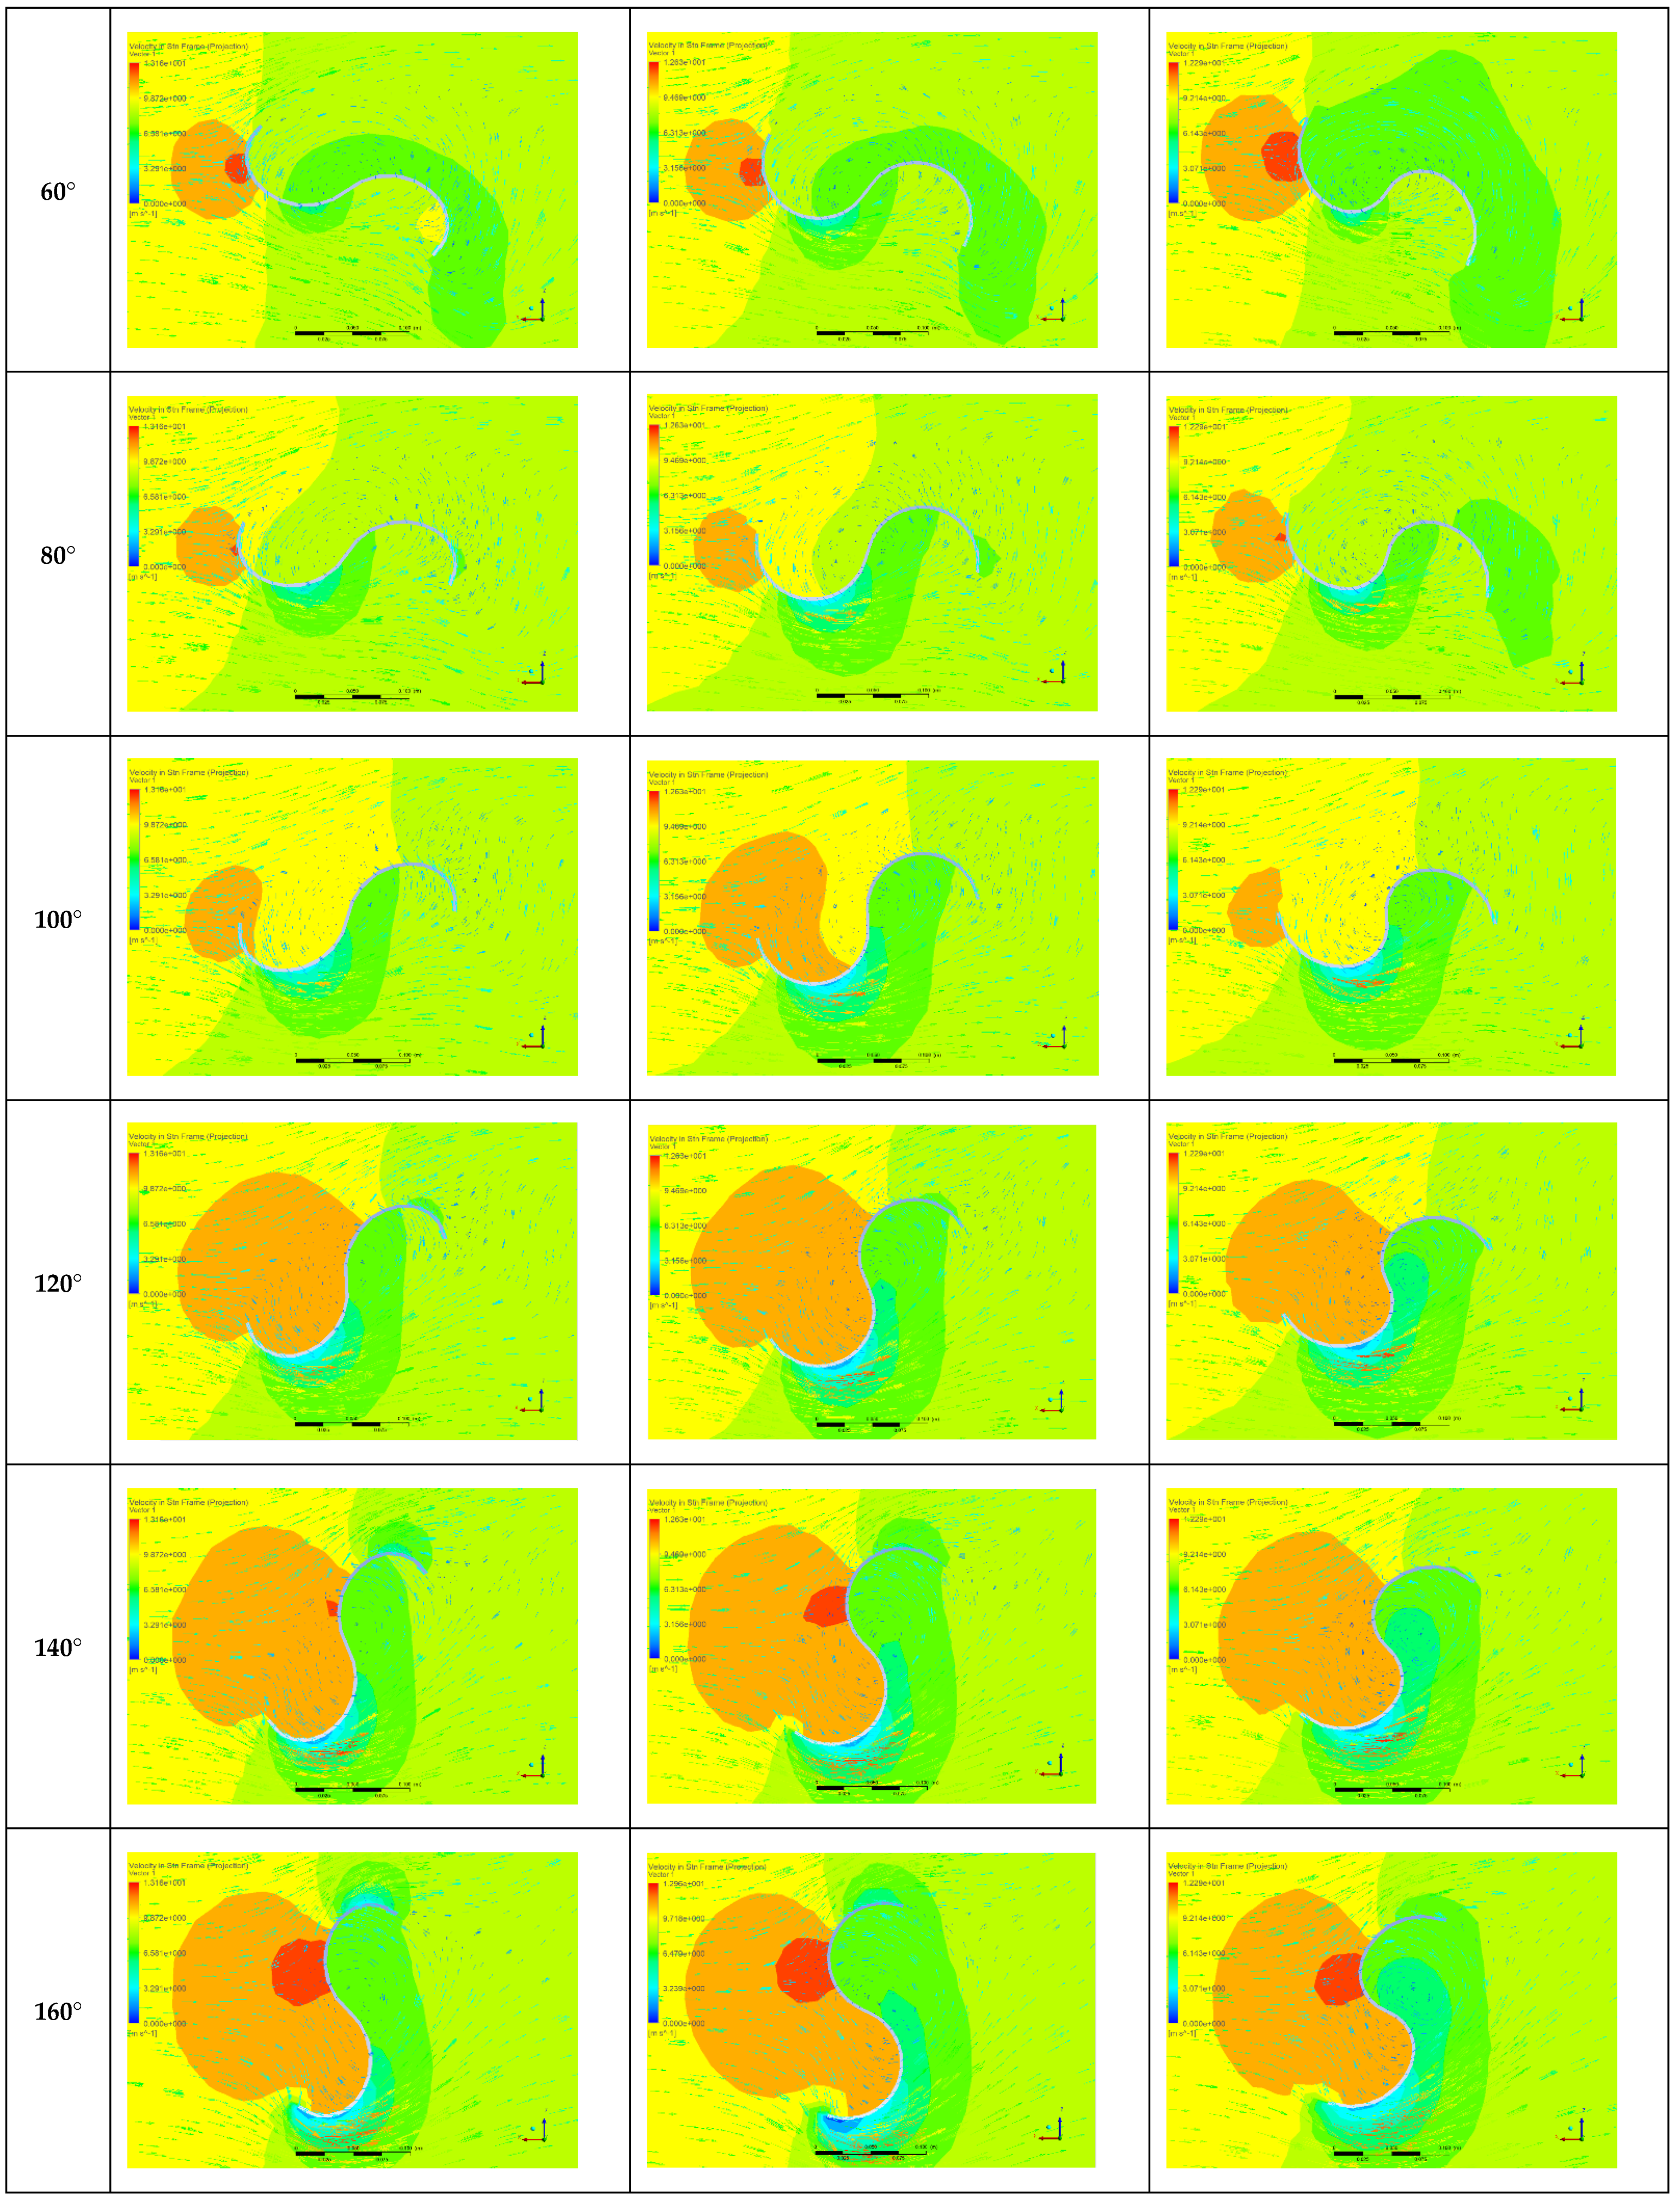
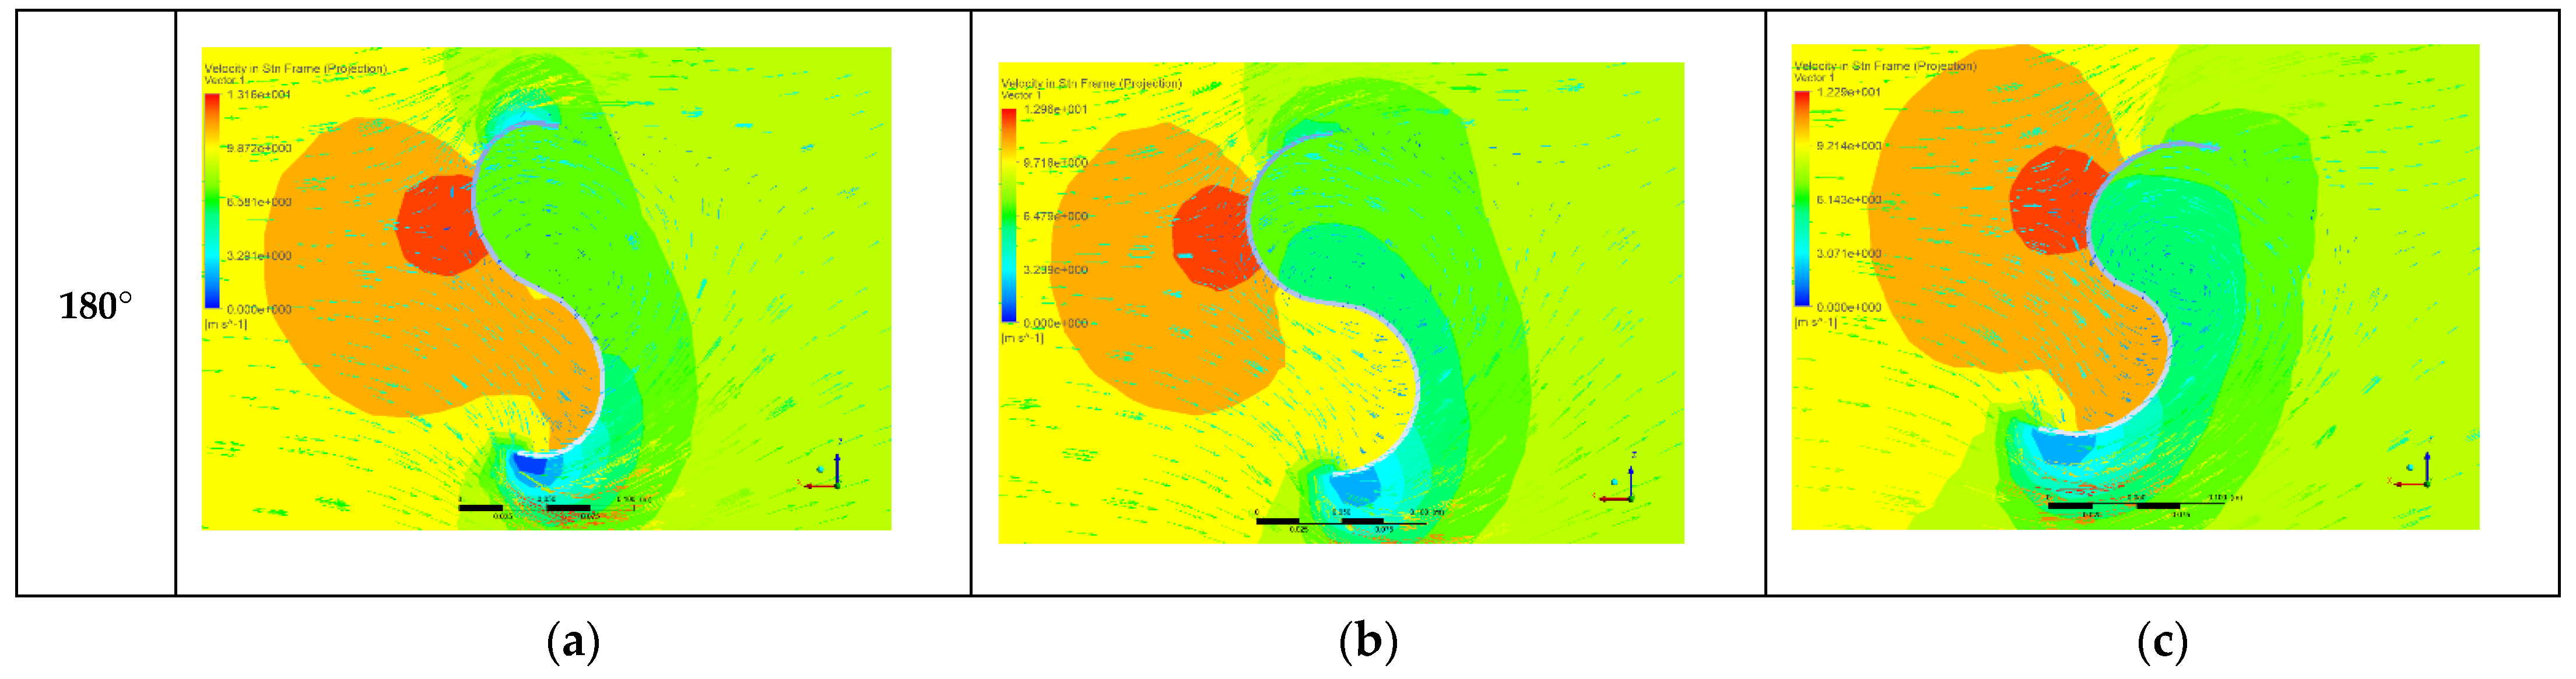
3. Results and Discussion

The present work employs dimensionless parameters to analyze the results. Since the turbines analyzed are scale models of real turbines, a dimensionless analysis allows a comparison with turbines of different sizes and in different wind conditions. TSR is the ratio between of the blade tip tangential velocity and the wind speed, calculated using Equation (4):
TSR = blade   tip   tan gential   velocity wind   speed = ω R V
where ω is the rotational speed of the rotor, R is the rotor radius, and V is the wind speed.
Cm is the torque coefficient, defined as follows:
C m = M 0.25 ρ SV 2 ϕ t
where M is the torque, 0.5ρV2 the kinetic energy per unit volume of the incoming flow and S the cross-section area, given by S = ϕ t H .
Cp is the power coefficient. It expresses which fraction of the power in the wind is being extracted by the turbine, as shown in Equation (6):
C p = P 0.5 ρ SV 3 = C m TSR
where P is the shaft power. This should be the power on the shaft, but since the objective of this study is to compare the performance of the Fibonacci rotor against the Savonius rotor, for this case P has been taken as output power (electrical power obtained), taking into account that the losses by friction and electrical are practically the same in both cases
Figure 7 shows the average power coefficients against the TSR for the Fibonacci I, Fibonacci II, and Savonius configurations. Both numerical and experimental results are shown in this figure. Since the Fibonacci II configuration lead to lower TSR than Savonius, it was not considered experimentally. The main difference between Fibonacci I and Fibonacci II is that the former places the lower arc in the end of the blade, Figure 4a, as indicated by the results obtained by other authors, Figure 1.
As can be seen in Figure 7, there is a peak value for each curve and the power coefficient increases with TSR up to a certain point after which it drops down as the TSR further increases. Both the experimental and numerical results show the superiority of the Fibonacci I turbine over the Savonius one. Particularly, the maximum power coefficients for Fibonacci I and Savonius were 0.1129 and 0.0986, respectively, for the CFD analysis, which means a 14.5% improvement of Fibonacci I over Savonius. Regarding the experimental results, the maximum power coefficients for Fibonacci I and Savonius were 0.1106 and 0.0943, respectively, which means a 17.6% improvement of Fibonacci I over Savonius.
Several reasons are responsible for the discrepancies between the numerical and experimental results shown in Figure 7. The mechanical losses in the generator, bearings, transmission, electrical losses in the generator, and the blockage effect do not allow for the experimental reproduction of the CFD data. Regarding CFD, the k-ε turbulence model does not provide accurate results near the wall [29]. DNS (Direct Numerical Simulation) or LES (Large Eddy Simulation) would provide more accurate results but with a considerably higher computational cost. CFD is not an exact science, and the mesh generation and discretization processes induce inevitable numerical errors. Another source of error in the numerical model is the length of the domain. A larger length should provide a better characterization of the wake behind the turbine.
Despite the discrepancies between numerical and experimental results, both procedures demonstrate the superiority of Fibonacci over Savonius, which is the goal of the present work.
Figure 8 shows the power coefficient as a function of the azimuth angle for several TSR values. This figure was obtained through the CFD model. As can be seen, the torque becomes positive as the azimuth angle increases above around 40 and 220° and reaches maximum values around 110 and 290°. The torque becomes negative around 170 and 360° and reaches minimum values around 20 and 200°.
Figure 9 shows the velocity and pressure field for the Fibonacci I profile and Figure 10a–c shows the velocity and pressure field in the middle plane for Fibonacci I at TSR = 0.514, Savonius at TSR = 0.507, and Fibonacci II at TSR = 0.506, respectively. As can be seen, a vortex that rotates counterclockwise can be observed. This vortex promotes the pressure gradients that produces power. Another vortex can be seen near the center of the rotor. Since this vortex is placed near the axis, it has little effect on the power generation. As can be seen in Figure 10, the pressure exerted on the recoil blade (rear blade) is lower for the Fibonacci profile, which favors the rotation of the turbine, being able to obtain higher results in the Cp. This effect can be observed in the illustrations facing the turbines with both profiles in the rotation from 0° to 60°, in which it is observed that greater pressure is exerted on the recoil blade for the Savonius profile than for the Fibonacci one, while the opposite occurs in the advance blade or front blade, the pressure exerted on the Savonius profile is less than that exerted on the Fibonacci profile. In turn, the velocity vectors are more uniformly distributed and have a greater incidence in the vicinity of the forward blade in the case of the Fibonacci profile, as well as in the blade peak, whose concentration is higher in the case of the Fibonacci rotor.

4. Conclusions

This paper proposes an improvement of the Savonius turbine which consists of implementing an innovative rotor geometry based on the Fibonacci spiral. These geometries were analyzed both experimentally and numerically. Two Fibonacci geometries were compared with the Savonius turbine, and it was found that the most efficient geometry is the one in which the lower radius arc is placed at the blade tip, Fibonacci I. This configuration provided higher power coefficients than the Savonius one. On the other hand, the Fibonacci II configuration lead to low power coefficients. This could be contradictory since, despite the fact that the Fibonacci II configuration is the one present in nature, Fibonacci I provided better results. This conclusion highlights the necessity of future works related to improving the performance of geometries based on the Fibonacci’s spiral applied, for instance, to centrifugal pumps or fans. Some parameters that need to be analyzed are the separation gap (SG), overlap (OL), combination of SG and OL, and so on. It is worth mentioning that this is a very small model with an even smaller wind speed.

Author Contributions

Conceptualization, J.B. and J.d.D.R.; methodology, J.B. and J.d.D.R.; software, J.B. and M.I.L.; validation, J.B. and J.d.D.R.; formal analysis, J.B. and A.C.; investigation, J.B., J.d.D.R., A.C. and M.I.L.; resources, J.B., J.d.D.R., A.C. and M.I.L.; writing—original draft preparation, J.B., J.d.D.R. and M.I.L.; writing—review and editing, J.B., J.d.D.R., A.C. and M.I.L.; visualization, J.B., J.d.D.R., A.C. and M.I.L.; supervision, J.B., J.d.D.R., A.C. and M.I.L. All authors have read and agreed to the published version of the manuscript.

Funding

This research received no external funding.

Institutional Review Board Statement

Not applicable.

Informed Consent Statement

Not applicable.

Acknowledgments

The authors would like to express their gratitude to the Nautical Sciences and Marine Engineering department of the University of Coruña.

Conflicts of Interest

The authors declare no conflict of interest.

References

  1. Hegler, S.; Plettemeier, D. Simulative investigation of the radar cross section of wind turbines. Appl. Sci. 2019, 9, 4024. [Google Scholar] [CrossRef] [Green Version]
  2. Ding, L.; Guo, T. Numerical study on the power efficiency and flow characteristics of a new type of wind energy collection device. Appl. Sci. 2020, 10, 7438. [Google Scholar] [CrossRef]
  3. Ancuti, M.C.; Musuroi, S.; Sorandaru, C.; Dordescu, M.; Erdodi, G.M. Wind turbines optimal operation at time variable wind speeds. Appl. Sci. 2020, 10, 4232. [Google Scholar] [CrossRef]
  4. Dolinski, L.; Krawczuk, M. Analysis of modal parameters using a statistical approach for condition monitoring of the wind turbine blade. Appl. Sci. 2020, 10, 5878. [Google Scholar] [CrossRef]
  5. Jessen, K.; Laugesen, K.; Mortensen, S.M.; Jensen, J.K.; Soltani, M.N. Experimental validation of aero-hydro-servo-elastic models of a scaled floating offshore wind turbine. Appl. Sci. 2019, 9, 1244. [Google Scholar] [CrossRef] [Green Version]
  6. Liu, Z.; Tu, Y.; Wang, W.; Qian, G. Numerical analysis of a catenary mooring system attached by clump masses for improving the wave-resistance ability of a spar buoy-type floating offshore wind turbine. Appl. Sci. 2019, 9, 1075. [Google Scholar] [CrossRef] [Green Version]
  7. Qi, L.; Zheng, L.; Bai, X.; Chen, Q.; Chen, J.; Chen, Y. Chen Nonlinear maximum power point tracking control method for wind turbines considering dynamics. Appl. Sci. 2020, 10, 811. [Google Scholar] [CrossRef] [Green Version]
  8. Astolfi, D.; Castellani, F.; Berno, F.; Terzi, L. Numerical and experimental methods for the assessment of wind turbine control upgrades. Appl. Sci. 2018, 8, 2639. [Google Scholar] [CrossRef] [Green Version]
  9. Han, X.; Liu, D.; Xu, C.; Shen, W.; Li, L.; Xue, F. Monin–Obukhov similarity theory for modeling of wind turbine wakes under atmospheric stable conditions: Breakdown and modifications. Appl. Sci. 2019, 9, 4256. [Google Scholar] [CrossRef] [Green Version]
  10. Damota, J.; Lamas, I.; Couce, A.; Rodríguez, J. Vertical axis wind turbines: Current technologies and future trends. In Proceedings of the International Conference on Renewable Energies and Power Quality (ICREPQ’15), La Coruña, Spain, 25–27 March 2015. [Google Scholar]
  11. Wijayanto, R.P.; Kono, T.; Kiwata, T. Performance characteristics of an orthopter-type vertical axis wind turbine in shear flows. Appl. Sci. 2020, 10, 1778. [Google Scholar] [CrossRef] [Green Version]
  12. Pagnini, L.C.; Burlando, M.; Repetto, M.P. Experimental power curve of small-size wind turbines in turbulent urban environment. Appl. Energy 2015, 154, 112–121. [Google Scholar] [CrossRef]
  13. Vita, G.; Šarkić-Glumac, A.; Hemida, H.; Salvadori, S.; Baniotopoulos, C. On the Wind Energy Resource above High-Rise Buildings. Energies 2020, 13, 3641. [Google Scholar] [CrossRef]
  14. Li, J.; Yu, X.B. Analyses of the extensible blade in improving wind energy production at sites with low-class wind resource. Energies 2017, 10, 1295. [Google Scholar] [CrossRef] [Green Version]
  15. Pujol, T.; Massaguer, A.; Massaguer, E.; Montoro, L.; Comamala, M. Net power coefficient of vertical and horizontal wind turbines with crossflow runners. Energies 2018, 11, 110. [Google Scholar] [CrossRef] [Green Version]
  16. Tian, W.; Song, B.; VanZwieten, J.H.; Pyakurel, P. Computational fluid dynamics prediction of a modified Savonius wind turbine with novel blade shapes. Energies 2015, 8, 7915–7929. [Google Scholar] [CrossRef]
  17. Savonius, S.J. The S-rotor and its applications. Mech. Eng. 1931, 53, 333–338. [Google Scholar]
  18. Zhang, H.; Li, Z.; Xin, D.; Zhan, J. Improvement of aerodynamic performance of Savonius wind rotor using straight-arc curtain. Appl. Sci. 2020, 10, 7216. [Google Scholar] [CrossRef]
  19. Vipin, G.K.; Ram, R.; Kumar, N. Numerical Analysis of different blade profile of wind turbine. Int. J. Appl. Eng. Res. 2018, 13, 375–385. [Google Scholar]
  20. Alom, N.; Saha, U.K. Influence of blade profiles on Savonius rotor performance: Numerical simulation and experimental validation. Energy Convers. Manag. 2019, 186, 267–277. [Google Scholar] [CrossRef]
  21. Kacprzak, K.; Liskiewicz, G.; Sobczak, K. Numerical investigation of conventional and modified Savonius wind turbines. Renew. Energy 2013, 60, 578–585. [Google Scholar] [CrossRef]
  22. Benesh, A.H. Wind Turbine System Using a Savonius-Type Rotor. U.S. Patent 4,784,568, 29 September 1987. [Google Scholar]
  23. Mohamed, M.H.; Janiga, G.; Pap, E.; Thevenin, D. Optimal blade shape of a modified Savonius turbine using an obstacle shielding the returning blade. Energy Convers. Manag. 2011, 52, 236–242. [Google Scholar] [CrossRef]
  24. Chan, C.M.; Bai, H.L.; He, D.Q. Blade shape optimization of the Savonius wind turbine using a genetic algorithm. Appl. Energy 2018, 213, 148–157. [Google Scholar] [CrossRef]
  25. Lamas, M.I.; Rodriguez, J.D.; Rodriguez, C.G. CFD analysis of biologically-inspired marine propulsors. Brodogradnja 2012, 63, 125–133. [Google Scholar]
  26. Lamas Galdo, M.I.; Rodriguez Vidal, C.G.; Rodriguez García, J.D. Optimization of the efficiency of a biomimetic marine propulsor using CFD. Ing. Investig. 2014, 34, 17–21. [Google Scholar]
  27. Lamas, M.I.; Rodríguez, J.D.; Rodríguez, C.G.; González, P.B. Three-dimensional CFD analysis to study the thrust and efficiency of a biologically inspired marine propulsor. Pol. Marit. Res. 2011, 18, 10–16. [Google Scholar] [CrossRef] [Green Version]
  28. Eltayesh, A.; Hanna, M.B.; Castellani, F.; Huzayyin, A.S.; El-Batsh, H.M.; Burlando, M.; Becchetti, M. Effect of wind tunnel blockage on the performance of a horizontal axis wind turbine with different blade number. Energies 2019, 12, 1988. [Google Scholar] [CrossRef] [Green Version]
  29. Versteeg, H.K.; Malalasekera, W. An Introduction to Computational Fluid Dynamics: The Finite Volume Method; Pearson Education Limited: London, UK, 2007; ISBN 978-0-13-127498-3. [Google Scholar]
Figure 1. Fibonacci’s spiral; (a) distribution of the squares; (b) spiral with rations.
Applsci 11 06198 g001
Figure 2. Profiles analyzed; (a) Fibonacci I; (b) Fibonacci II.
Applsci 11 06198 g002
Figure 3. (a) Constructive parameters; (b) 3D model.
Applsci 11 06198 g003
Figure 4. (a) Computational mesh; (b) boundary layer detail.
Applsci 11 06198 g004
Figure 5. Boundary conditions.
Applsci 11 06198 g005
Figure 6. (a) Wind tunnel used for the measurements; (b) turbine inside the test section.
Applsci 11 06198 g006
Figure 7. Power coefficients against TSR for Fibonacci I, Fibonacci II, and Savonius configurations.
Applsci 11 06198 g007
Figure 8. Power coefficient against the angular position; (a) Fibonacci I; (b) Fibonacci II; (c) Savonius.
Applsci 11 06198 g008aApplsci 11 06198 g008b
Figure 9. Velocity and pressure field for the Fibonacci I profile.
Applsci 11 06198 g009
Figure 10. Velocity and pressure field for (a) Fibonacci I at TSR = 0.514 (ω = 37 rad/s); (b) Savonius at TSR = 0.507 (ω = 35 rad/s); (c) Fibonacci II at TSR = 0.506 (ω = 37 rad/s).
Applsci 11 06198 g010aApplsci 11 06198 g010bApplsci 11 06198 g010c
Table 1. Characteristics of the analyzed wind turbines.
Model ϕ t ( mm ) R (mm)H (mm) ϕ endplate ( mm ) OL (mm)SG (mm)e (mm)
Fibonacci I194.5597.27200214.0003
Fibonacci II191.6695.83200210.8003
Publisher’s Note: MDPI stays neutral with regard to jurisdictional claims in published maps and institutional affiliations.

