Article

The 3D Printing of Freestanding PLLA Thin Layers and Improving First Layer Consistency through the Introduction of Sacrificial PVA

Department of Materials Science and Metallurgy, University of Cambridge, 27 Charles Babbage Road, Cambridge CB3 0FS, UK
*
Author to whom correspondence should be addressed.
Appl. Sci. 2021, 11(14), 6320; https://doi.org/10.3390/app11146320
Submission received: 28 May 2021 / Revised: 2 July 2021 / Accepted: 5 July 2021 / Published: 8 July 2021
(This article belongs to the Special Issue Materials for Tissue Engineering Scaffolds)

Abstract

:
Fused filament fabrication (FFF) is an inexpensive way of producing objects through a programmed layer-by-layer deposition. For multi-layer, macro-scaled prints, acceptable printing is achieved provided, amongst other factors, first layer adhesion is sufficient to fix a part to the surface during printing. However, in the deposition of structures with a single or few layers, first layer consistency is significantly more important and is an issue that has been previously overlooked. As layer-to-bed adhesion is prioritised in first layer printing, thin layer structures are difficult to remove without damage. The deposition of controllable thin structures has potential in tissue engineering through the use of bioactive filaments and incorporation of microfeatures into complex, patient-specific scaffolds. This paper presents techniques to progress the deposition of thin, reproducible structures. The linear thickness variation of 3D-printed single PVA and PLLA layers is presented as a function of extrusion factor and the programmed vertical distance moved by the nozzle between layers (the layer separation). A sacrificial PVA layer is shown to significantly improve first layer consistency, reducing the onus on fine printer calibration in the deposition of single layers. In this way, the linear variation in printed single PLLA layers with bed deviation is drastically reduced. Further, this technique is used to demonstrate the printing of freestanding thin layers of ~25 µm in thickness.

1. Introduction

Fused filament fabrication (FFF) printers are an increasingly common sight in laboratories around the world where a wide range of available feedstock materials, low machine costs, quick printing times, and material processing characteristics similar to conventional extrusion have become highly desirable in facilitating day-to-day research and development [1]. Whilst the majority of machines are for support, there is a growing transition to move FFF from a tool for prototyping parts [2,3] to a fully-fledged manufacturing technique in its own right [4]. FFF printing has allowed innovation across a broad range of fields. For example, tissue support meshes created by Pattinson et al. harness extrusion 3D printing processes to aid patient recovery [5], and shape-changing components designed by Yu et al. implement 4D printing and shape memory polymer multi-materials to create structures that dynamically respond to thermal stimulus [6]. The production of custom microfluidic devices perhaps exemplifies the potential of tailored FFF, incorporating rapid fabrication times and flexibility of design whilst maintaining functionality [7,8,9,10].
The ease by which complex shapes can be modelled and fabricated using FFF is of growing interest in tissue engineering, where extruded polymers can be used to produced scaffolds [11,12]. PLA filament can be blended or mixed with additional biomaterials components such as chitosan [13], antibacterial alloys [14], lignin [15], structural metals [16], and hydroxyapatite [17,18,19]. The ability to extrude controllable thin depositions is desirable in tissue engineering, where 3D-printed meshes have recently been used to improve the mechanical properties of electrospun biomaterial scaffolds [20]. The generation of reproducible thin mesh structures would be of interest in biomedical engineering and in the pursuit of controlling localised cell interaction through printing microfeatures.
FFF printing, however, inhabits a fairly narrow macroscopic scale. Larger, high-resolution parts (such as those with a volume over 100 cm3) may take too long to print for FFF to be considered a viable production method. Despite being the most popular 3D printing method available, the development of microscale FFF is limited [21]. Direct ink writing (DIW) has inspired work on microextrusion with some success, with fine PDMS line widths of 10 µm achieved [22]. However, the optimisation of such printing is highly involved, printing is slow and of questionable scalability. Microextrusion is unsuitable at the mixed scale to, for example, embed microscale features inside the bulk of a macroscopic part or incorporate surface microtopographies. This issue of scalability is reflected in cost, as requiring the purchase of a specific printer to make thin structures is prohibitive to research. These units are not widely available and are therefore of little use to researchers seeking thin structures to complement their work. Access to conventional FFF printers, however, is likely to be available in most facilities.
In FFF printing, first layer consistency represents a significant barrier in decreasing part size and enabling a reasonable comparison of structures printed on different printers. It is surprising then that many studies overlook the importance of reporting the calibration of their machines. In general, a preprinting calibration might involve:
  • Levelling of the print bed;
  • Levelling of the extruder;
  • Adjustment of the z offset (calibrating the ‘zero point’ between the nozzle and bed);
  • Optimising the ‘First Layer’.
The specifics vary by printer manufacturer but these main points are broadly consistent. Print beds or surfaces are manually [23] or automatically [24] aligned to ensure that the distance between the nozzle and the printing surface does not vary across the bed and that the nozzle is ‘zeroed’. In reality, calibration for macro parts has a wide tolerance, as long as the part sticks to the surface and the nozzle remains unclogged printing is deemed acceptable. To enhance adhesion to the print surface and aid the removal of parts, the printer bed can be covered with painter’s tape [25], though many studies elect to print directly on the bed.
The challenges of consistent, and thin, single layers are especially apparent with the growing availability of self-assembled units and impact heavily on the financial requirements of implementing the printing of microscale layers. For example, Serdeczny et al. highlight that cross-sectional area changes with standoff distance in their empirical and CFD modelled study of single-layer extrusion. Further, they address a print surface misalignment that must be manually corrected [26]. These concerns are often not considered in the literature, where detailed optimisation and discussions are focused on bulk parts built up with many layers, rather than thin, flexible, structures comprised of a few or even single layers [27,28,29,30,31,32,33,34].
A further unreported complication of printing thin structures, such as single layers, struts, and meshes is the difficulty in their removal from the printing surface, especially as good adhesion is required for successful printing. Thin layers are damaged when peeled from a printer bed, or adhesive tape, resulting in curling and warping, thus limiting the printing of thin architectures. Producing thin, single-layer samples for mechanical testing is therefore challenging. This limits the study of the effect of printing parameters on the physical properties of prints—it is difficult to distinguish whether it is the intra-layer polymer properties that have altered within a part or interlayer bonding. These effects would be better isolated and distinguished in separate single and multilayer studies.
The use of soluble or breakaway material for support during 3D printing is a long-established technique to aid in the printing of complex shapes or overhanging sections of parts, introduced by Stratasys in 1999 [35]. This paper presents a new application of soluble support material to mitigate several existing issues in FFF 3D printing. Here, we extend the printing of supports through the introduction of an initial PVA (a water-soluble thermoplastic polymer) sacrificial layer to printed architectures. Harnessing this technique, we demonstrate the novel printing and removal of freestanding thin struts, at a thickness of approximately 25 µm. The use of a sacrificial layer is shown to minimise the effects of both printer misalignment and poor calibration. Further, the effect of bed damage is reduced. Reduced printer-to-printer variation and looser calibration requirements provide an ideal solution for the deposition of consistent single or first layers. In this way, we hope to extend the utility of relatively inexpensive 3D printers into the production of microscale layers and meshes that may be useful in areas such as MEMS, microfluidics, tissue engineering, and photonics. Additionally, we hope this method might be used in the future to aid study into the effects of printing parameters on intra- and inter-layer properties in fused filament fabrication.

2. Materials and Methods

2.1. Printing Parameters and Definitions

The understanding of the polymer deposition in multilayer and/or multi-material 3D printing throughout this paper may be aided by the definition of several key printing parameters. Extruder and printer bed temperatures (Text and Tbed) can be altered during printing to match favourable extrusion conditions for different filaments. Print speed is defined with respect to nozzle displacement as the relative speed at which the nozzle travels across the print bed (mm/min).
Filament extrusion is often described through a feed rate (mm/s), independent of print speed. Whilst useful for independent control in manufacturing, this can lead to confusion when isolating the effects of print speed and extrusion on layer properties. In this paper, filament extrusion is specified via an extrusion factor, e, defined below (for 1.75 mm filament diameters and a 400-micron nozzle diameter), and ensures a constant volume of extruded material for all print speeds.
e = l e n g t h   o f   f i l a m e n t   e x t r u d e d   / n o z z l e   d i s p l a c e m e n t
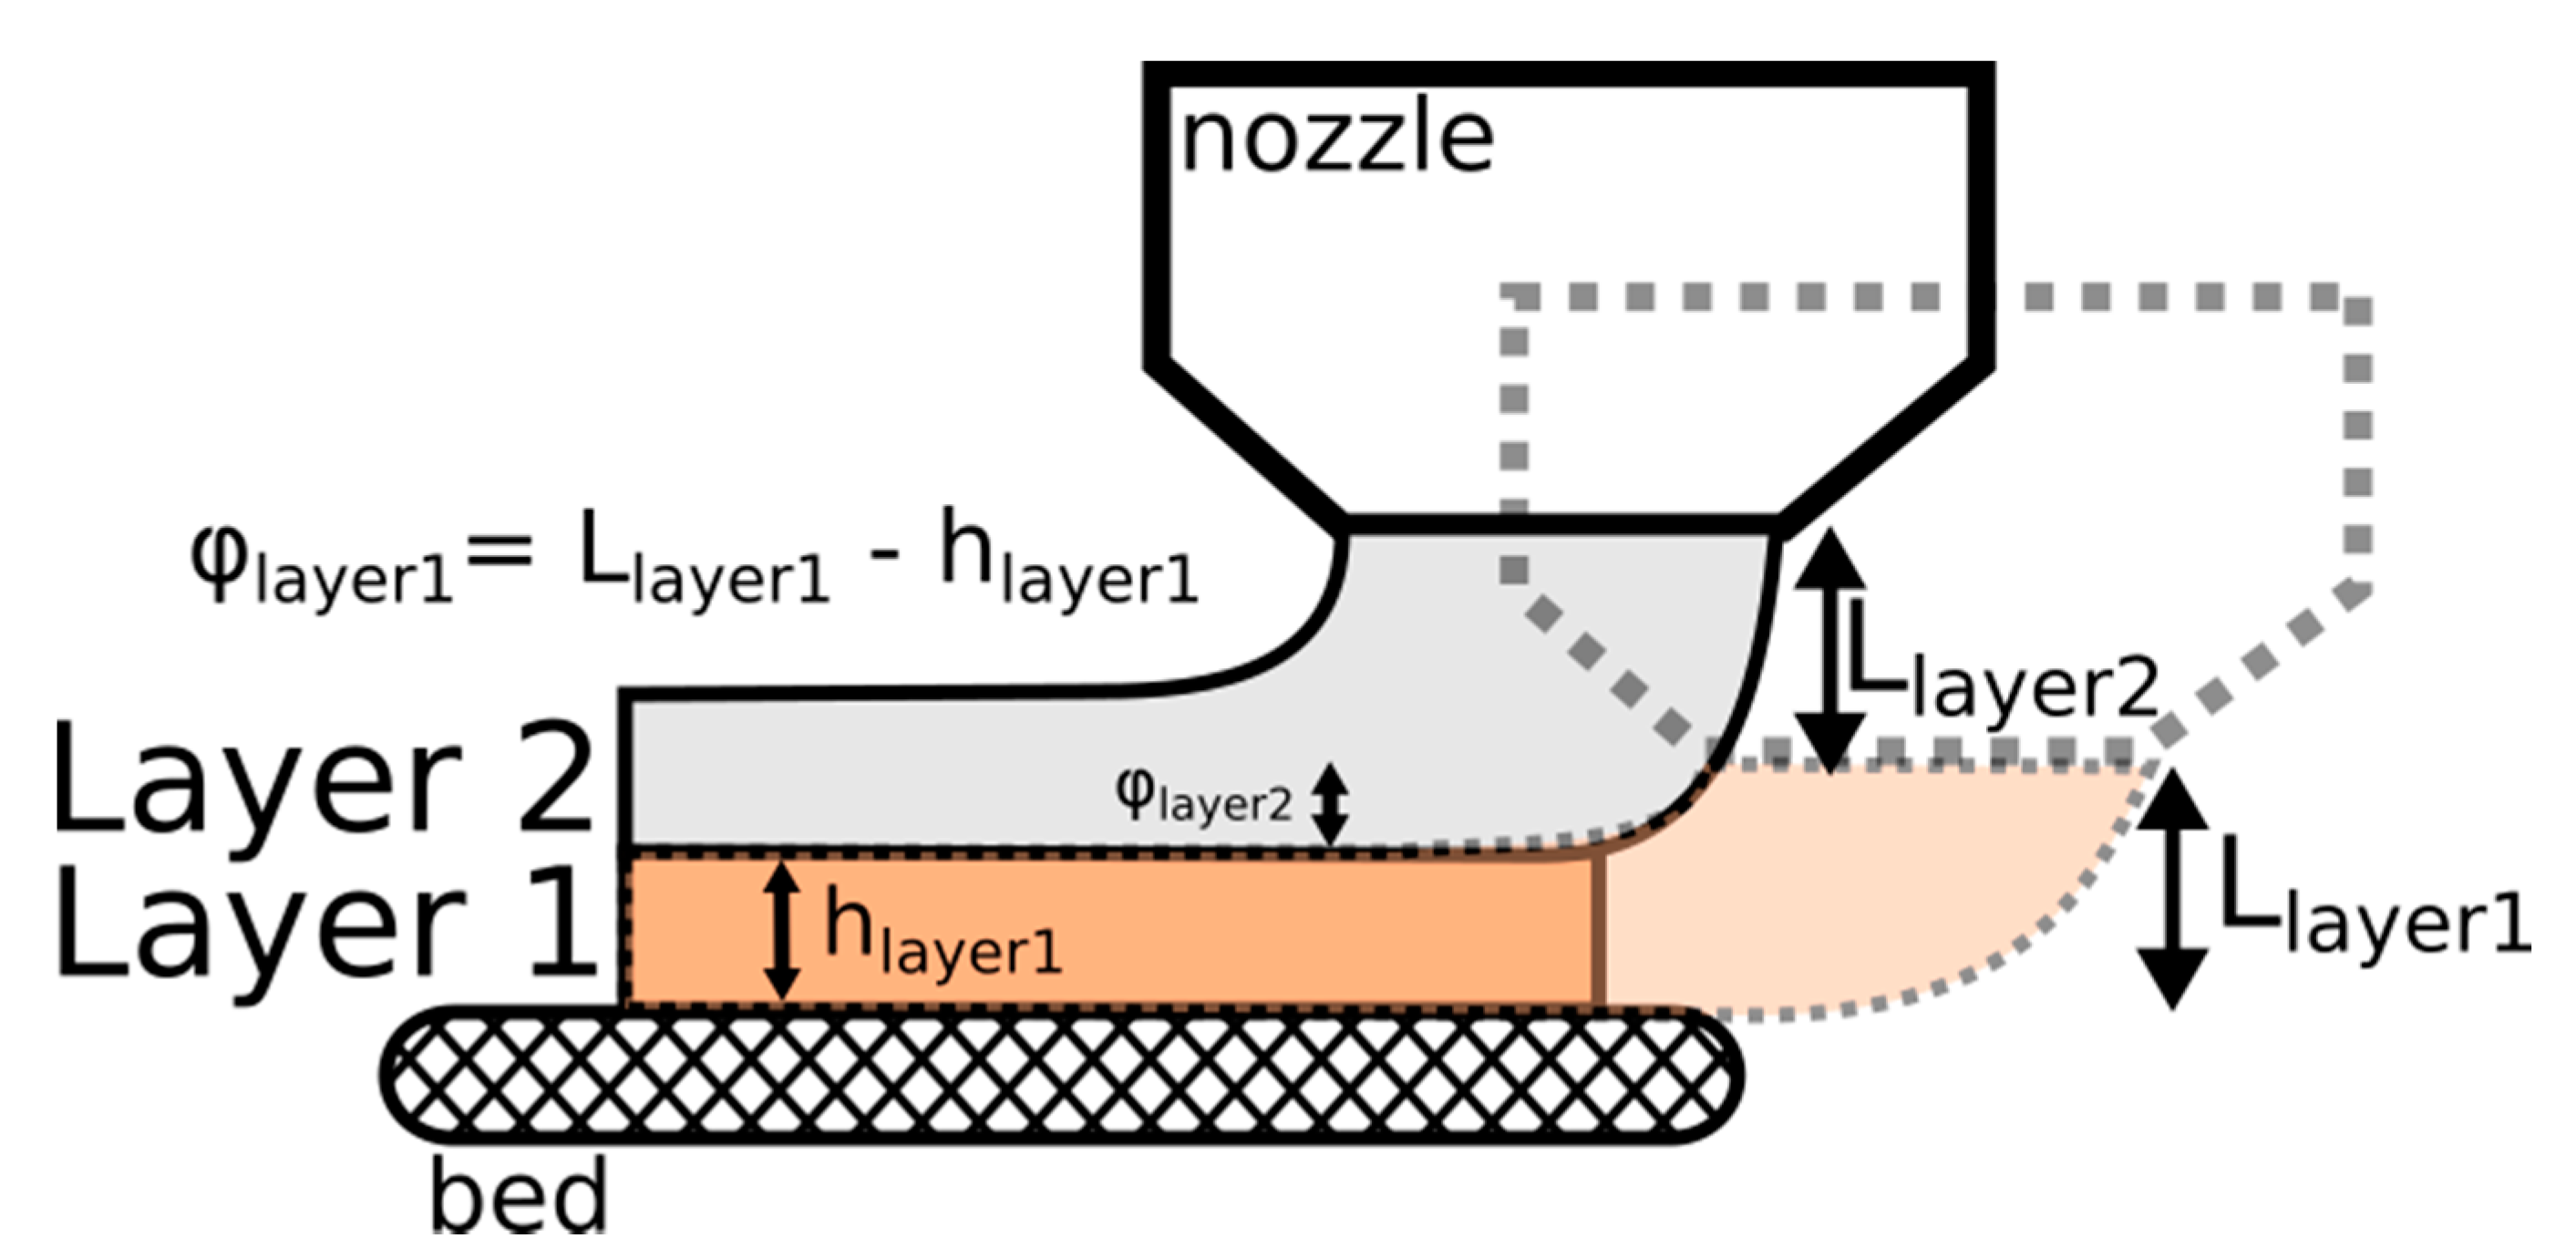
Figure 1 shows a schematic of the two printing passes required to form a dual-layer print. A layer separation, L, may be defined as the programmed vertical distance moved by the nozzle between layers. For single-layer prints, this is simply the extrusion gap and refers to the space between the nozzle and the printer bed (as shown by Llayer1 in Figure 1).
As deposited layers were found to be thinner than the available extrusion gap, an offset φlayer2 is included when considering the next layer separation, Llayer2. This effect is not cumulative. The subsequent layer is effectively printed with a larger extrusion gap (Llayer2 + φlayer2), which will result in a layer that is thicker than expected. It could be imagined that this might result in alternating layers that are then thinner or thicker than expected that eventually reach an equilibrium such that Ln = hn. An example of the first few layers of printing is shown in Figure 2, featuring five layers deposited within a single raster. Here, the steady state of printing is achieved when h3 = L3 after alternating layers with h1 < L1 and h2 > L2.

2.2. 3D Printer Setup and Materials

PVA/PLLA dual-layer prints (and single-layer controls) were prepared using a self-assembled 3D printer (Prusa MK2S, nozzle diameter = 398 µm) modified to increase extrusion torque through the addition of Titan extruder (E3D) at a 3:1 gear ratio. To preserve accurate feed rates, the step rate of the extruder motor was adjusted such that programmed and measured extrusion lengths matched. The printer features controllable bed and extrusion temperatures, Tbed, which was held at 55 °C, and Text, which was set to 195 °C and 215 °C for PVA and PLLA layers, respectively.
The printer was tethered to a computer, from which G-code files were executed. Widely available ‘slicing’ software typically used to prepare G-code from CAD models was found to be too restrictive for direct printing of single or dual layers. Safety limits and insufficient control over printing parameters limit their use to larger, multilayer parts. Writing G-code directly, however, can be rather tedious—variables and loops included in G-code scripts are not supported by the Prusa MK2S firmware. To address this, MATLAB scripts were used to prepare the required G-code files, enabling custom variables and looping to make creating experimental scripts quicker and easier.
To print PVA/PLLA dual layers, a change of filament was executed directly in G-code. After a PVA layer had been deposited, the nozzle was raised and the extruder motor reversed. Once the spool of PVA was removed, the print was then paused whilst the nozzle was heated to Text = 215 °C before PLLA filament was fed into the motor and extruded slightly to clear any remaining PVA. Any hanging polymer was removed with a pair of tweezers and the nozzle wiped with an isopropanol-soaked paper towel. The print was then resumed, with the nozzle lowered to deposit the PLLA layer.
Ingeo™ Biopolymer 2500HP PLLA pellets were purchased from Natureworks™ (Minnetonka, MN, US) and extruded into 50 cm filament lengths using a Noztek™ (Shoreham-by-Sea, UK) Pro Extruder (182 °C at a target filament diameter of 1.75 mm). Prior to extrusion, pellets were vacuum dried overnight. Filament mean diameters varied between 1.60 and 1.68 mm. Lengths with >0.05 mm variation in diameter were discarded. Extrusion factors (ePLLA) were scaled with respect to a standard 1.75 mm diameter to ensure consistent volume extrusion (scale factor = 1.752/d2, where d is the selected filament diameter).
PrimaSelect PVA+ Soluble Support filament was purchased from Prusa Research™ (Prague, Czech Republic). Before printing, the PVA filament was vacuum dried overnight.

2.3. Mimicking a Misaligned or Poorly Calibrated Printer Bed

The deposition of PLLA onto a poorly calibrated or misaligned printer bed and the inclusion of a compensatory sacrificial PVA layer are depicted in Figure 3a and 3b, respectively. The variation of thickness in a PVA layer due to an uneven or poorly calibrated printing surface was simplified and replicated as a series of experiments on a (nominally) flat print bed (Figure 3c). By increasing the layer separation for the printing of the PVA layer, LPVA, the effect of printer beds at differently calibrated z zero points and extrusion gaps can be mimicked. In this way, we investigated the variation of PLLA thickness, hPLLA with PVA layer separation, LPVA.
PVA layers were printed for LPVA values between 150 and 325 µm and a print speed of 1000 mm/min, at an ePVA of 0.04 and 0.06. After a filament change, a PLLA layer was printed onto the PVA layer at LPLLA = 200 µm and ePLLA = 0.02. Once cooled, the PLLA was peeled from the PVA, sectioned, and mounted for cross-sectional optical microscopy. As a control, PLLA layers were additionally printed directly onto the bed for LPLLA values between 150 and 275 µm, and ePLLA = 0.02.

2.4. Mitigating Surface Roughness

To create a test surface, a Bakelite block was formed in a hot mounting press and super glued to a microscope slide. Cuts of varying depth (<1 mm) and width (<2 mm) were carved using a variety of small hand saws and chisels. This slide was then fixed to the printer bed with electrical tape and left to reach thermal equilibrium (Tbed = 55 °C). A PVA layer of high extrusion factor (ePVA = 0.06, Text = 195 °C) was deposited directly onto the Bakelite, at an LPVA of 250 µm. A second pass depositing a PLLA layer (ePLLA = 0.02, LPLLA = 200 µm, Text = 215 °C) followed. After cooling to room temperature, the PLLA and PVA layers were separated and mounted to card for µCT imaging.

2.5. Printing Freestanding Thin Struts

To explore the thickness limits of 3D-printed thin freestanding struts, PLLA layers of low layer separation (LPLLA = 50 µm, 25 µm, 10 µm) were printed at a range of extrusion factors (ePLLA = 0.001 to 0.0075) on sacrificial PVA layers (LPVA = 200 µm, ePVA = 0.04). As samples were too thin to be peeled without damage, they were taped to microscope slides and the PVA was washed away in regularly changed deionised water (every 10 minutes until the beaker was clear), with turbulence generated by a small magnetic stirrer at slow speed. Samples were dried overnight in a vacuum oven, before mounting to the card for µCT imaging.

2.6. Characterisation

The resultant PVA and PLLA layers were initially analysed through optical microscopy. Sample sets were prepared in batches of 4 repeats of printing conditions. For single PVA layers, thickness values are reported as an average across 3 printing batches of 4 samples for each printing condition (12 in total). Single-printed PLLA and PLLA layers prepared with a sacrificial PVA layer are reported as an average of a single printing batch of 4 samples. Each sample was sectioned using wire clippers and mounted to a support card to keep upright during imaging. The cross sections were imaged at 10× magnification to measure mean layer thickness. Standard deviations are reported across each dataset in the figures presented. For detailed 3D scanning, selected samples were studied further using a SkyScan 1172 Micro-CT system (Bruker MicroCT, Kontich, Belgium). 2 cm PLLA segments were scanned with a pixel size of 1.96 µm, an operating voltage of 25 kV, 0.2° step size with a frame averaging of 2 and 180° rotation. Projections were reconstructed using NRecon software (Bruker MicroCT, Kontich, Belgium), and areas of interest were viewed in DataViewer (Bruker MicroCT, Kontich, Belgium) to measure thicknesses and also capture cross-sectional images.

3. Results

3.1. Printing PLLA Directly onto the Bed

To explore the effect of a varying extrusion gap on 3D-printed PLLA, the thickness of a printed PLLA layer is plotted as a function of programmed layer separation in Figure 4. This is equivalent to the effects of printing on a poorly calibrated printing surface. A constant of proportionality of 0.89 ± 0.03 is observed between the thickness of a printed PLLA layer, hPLLA, and the programmed layer separation, LPLLA. The variation of thickness with layer separation measured would result in an error of around 45 µm for every 50 µm of miscalibration, which is an unacceptable variation.

3.2. Printing PVA Directly onto the Bed

The effectiveness of a PVA sacrificial layer in reducing the dependency of layer thickness on print bed misalignment and/or poor calibration is explored in Figure 5, Figure 6, Figure 7 and Figure 8. The variation in thickness of PVA printed directly onto the printer bed at layer separations, LPVA, between 150 µm and 325 µm is shown in Figure 5 for values of ePVA = 0.04 and 0.06. Proportionalities of 0.98 ± 0.03 and 0.80 ± 0.05 were measured for ePVA = 0.04 and 0.06, respectively. A greater degree of variation in sample thickness for a given layer separation was observed for ePVA = 0.06, especially at larger layer separations. These values are different from those reported for PLLA in Figure 4, indicating a material and printing condition dependence for the effect of programmed layer separation on sample thickness.
The change in the cross-sectional aspect ratio of the printed line with increasing LPVA can be seen Figure 6. Sample width is reduced and surface curvature increased as layer separation is raised. This might limit the range of LPVA that would successfully support a layer of PLLA. However, LPVA of 150 µm through to 275 µm are shown to have sections flat and wide enough (≥400 µm) to provide a reasonable surface for printing. An increase in sample width was observed on increasing ePVA from 0.04 to 0.06 due to a greater volume of polymer deposited.
The PVA thicknesses presented in Figure 5 were used to calculate the variation in φLayer2 with layer separation, LPVA, which is shown in Figure 7. First considering ePVA = 0.04 at higher layer separations, φLayer2 appears fairly uniform, with a mean value between 35 and 40 µm—as would be expected given a thickness to layer separation proportionality of 0.98 ± 0.03 reported in Figure 5. At lower layer separations, for example, LPVA = 150 µm, φLayer2 is reduced to a mean value close to 25 µm. A similar trend is observed for ePVA = 0.06, albeit with a much larger variance. At higher layer separations, LPVA = 225 µm, φLayer2 approaches a value between 40 and 50 µm. At lower layer separations, LPVA < 225 µm, φLayer2 reduces linearly with decreasing layer separation.

3.3. Printing PLLA onto a PVA Layer

To explore a range of acceptable LPVA to support uniform PLLA layers, and, in turn, a tolerable calibration or misalignment range, Figure 8 shows the variation in layer thickness for both the peeled sacrificial PVA and a PLLA layer deposited on top (Figure 8a and 8b, respectively). Thicknesses of PLLA layers (ePLLA = 0.02, LPLLA = 200 µm) are presented for PVA sacrificial layers of ePVA = 0.04 (magenta) and 0.06 (black) with a LPVA, varying between 150 and 300 µm in 25 µm increments (Figure 8b). The variation in peeled PVA thickness (Figure 8a: ePVA = 0.04, 0.06|blue, red) with layer separation was measured as gradients of 0.89 ± 0.05 and 0.69 ± 0.04 for ePVA = 0.04 and 0.06, respectively. This shows a reduction in proportionality when compared with the values for single layer PVA reported in Figure 5 (0.98 ± 0.03 and 0.80 ± 0.05 for ePVA = 0.04 and 0.06, respectively).
PLLA deposited on PVA layers printed at both ePVA = 0.04 and 0.06 showed a marked reduction in thickness variation, compared with the trend reported in Figure 4. However, whilst PLLA layers are fairly uniform across the entire range of LPVA for ePVA = 0.04, a layer separation dependency of 0.22 ± 0.02 is still present for ePVA = 0.06. Cross-sectional optical microscopy of the peeled PLLA samples is shown in Figure 8c.

3.4. Mitigating Surface Roughness

To assess PVA performance in mitigating the impact of damaged, uneven or unconventional print surfaces, PLLA samples with PVA sacrificial layers were printed on a distressed Bakelite block. A photograph of this damaged surface can be seen in Figure 9a. Schematic and idealised representations of the sequential deposition of PVA and PLLA onto the block are shown in Figure 9b, with the former ‘filling in’ surface imperfections to facilitate improved PLLA printing.
Micro-CT cross sections of the resultant PLLA and PVA layers are shown in Figure 9c, with average thicknesses of 120 ± 9 µm and 230 ± 110 µm measured, respectively. Distinct increases in PVA layer thickness, corresponding to deep grooves on the damaged surface are observed. In stark contrast, the PLLA layer appears uniform and shows minimal impression from the distressed Bakelite block. Minor PLLA thickness changes of around 15 µm are noted at sites of larger scratches (~1 mm); however, these are significantly reduced in comparison to the 100 µm to 300 µm protrusions present in the PVA layer.

3.5. Printing Freestanding Thin Struts

Thin PLLA layers were successfully printed and liberated from their PVA supports through gentle washing. The calibration study presented in Figure 8 provides a range of LPVA values for which the variation of PLLA thickness using sacrificial PVA layers is known. A value of LPVA = 200 µm and ePVA = 0.04 was chosen as a preferred extrusion factor to both minimise hPLLA variation and maintain reasonable thermal contact with the printer bed. At LPLLA = 50 µm, PLLA layer thicknesses of between 40 and 50 µm were observed in both peeled and washed samples for ePLLA = 0.0050 and 0.0075. Layers with lower ePLLA values broke during washing. For LPLLA = 25 µm the PLLA could not be peeled from the PVA but was successfully washed to yield a PLLA thickness of between 23 and 28 µm for ePLLA = 0.0025, 0.0035, 0.0045. Samples of LPLLA = 10 µm were found to be too fragile and did not survive the washing process.
Figure 10 shows micro-CT cross sections (Figure 10a: End-on, Figure 10b: side-view) of two representative 3D-printed (LPLLA = 25 µm and ePLLA = 0.0025) thin layers. Samples are indicated by the white arrows and are shown loosely taped to the piece of a card used to facilitate scanning. The image shows a slice taken through a 3D volume constructed through X-ray tomography. An average thickness and width of 25 µm and 450 µm, respectively, were recorded.

4. Discussion

The results presented in this paper are significant in demonstrating a simple technique to reproducibly print freestanding thin parts. In Figure 4, the relationship between programmed layer separation and measured sample thickness was shown. In this experiment, changes in LPLLA are synonymous with deviations in the distance between the nozzle and the bed that occurs across misaligned printing surfaces or the inconsistencies that might be found between differently calibrated 3D printers. This reported variation, therefore, demonstrates that even relatively small deviations in bed offset, or tilt, yield proportional changes in sample geometry. For example, a miscalibration of around 50 µm would yield a PLLA thickness difference of close to 45 µm. Consider two printers which are built and calibrated by two different users. It would not be unreasonable to suggest that the absolute point at which either user determines to be z = 0 might vary by between 50 to 100 µm. In this scenario, on moving from one machine to another a significant difference in layer separation would be observed. Likewise, should the user need to replace and perform maintenance on their printer, such as unblocking and rebuilding the extruder, or replacing the nozzle, calibration must be reperformed. We found that between nozzle changes and recalibrations, layer thicknesses were noticeably different visually, and measured to vary on the order of 10 s of microns.
This, however, is shown to be largely mitigated in Figure 8 through the incorporation of a sacrificial PVA layer. Here, for a PVA layer printed at ePVA = 0.04, PLLA (ePLLA = 0.02, LPLLA = 200 µm) thickness does not appear to vary significantly with PVA layer separation. There is a small variation (proportionality of 0.22 ± 0.02) in PLLA thickness with a sacrificial layer of ePVA = 0.06, but this is still a significant improvement over the susceptibility introduced in Figure 4.
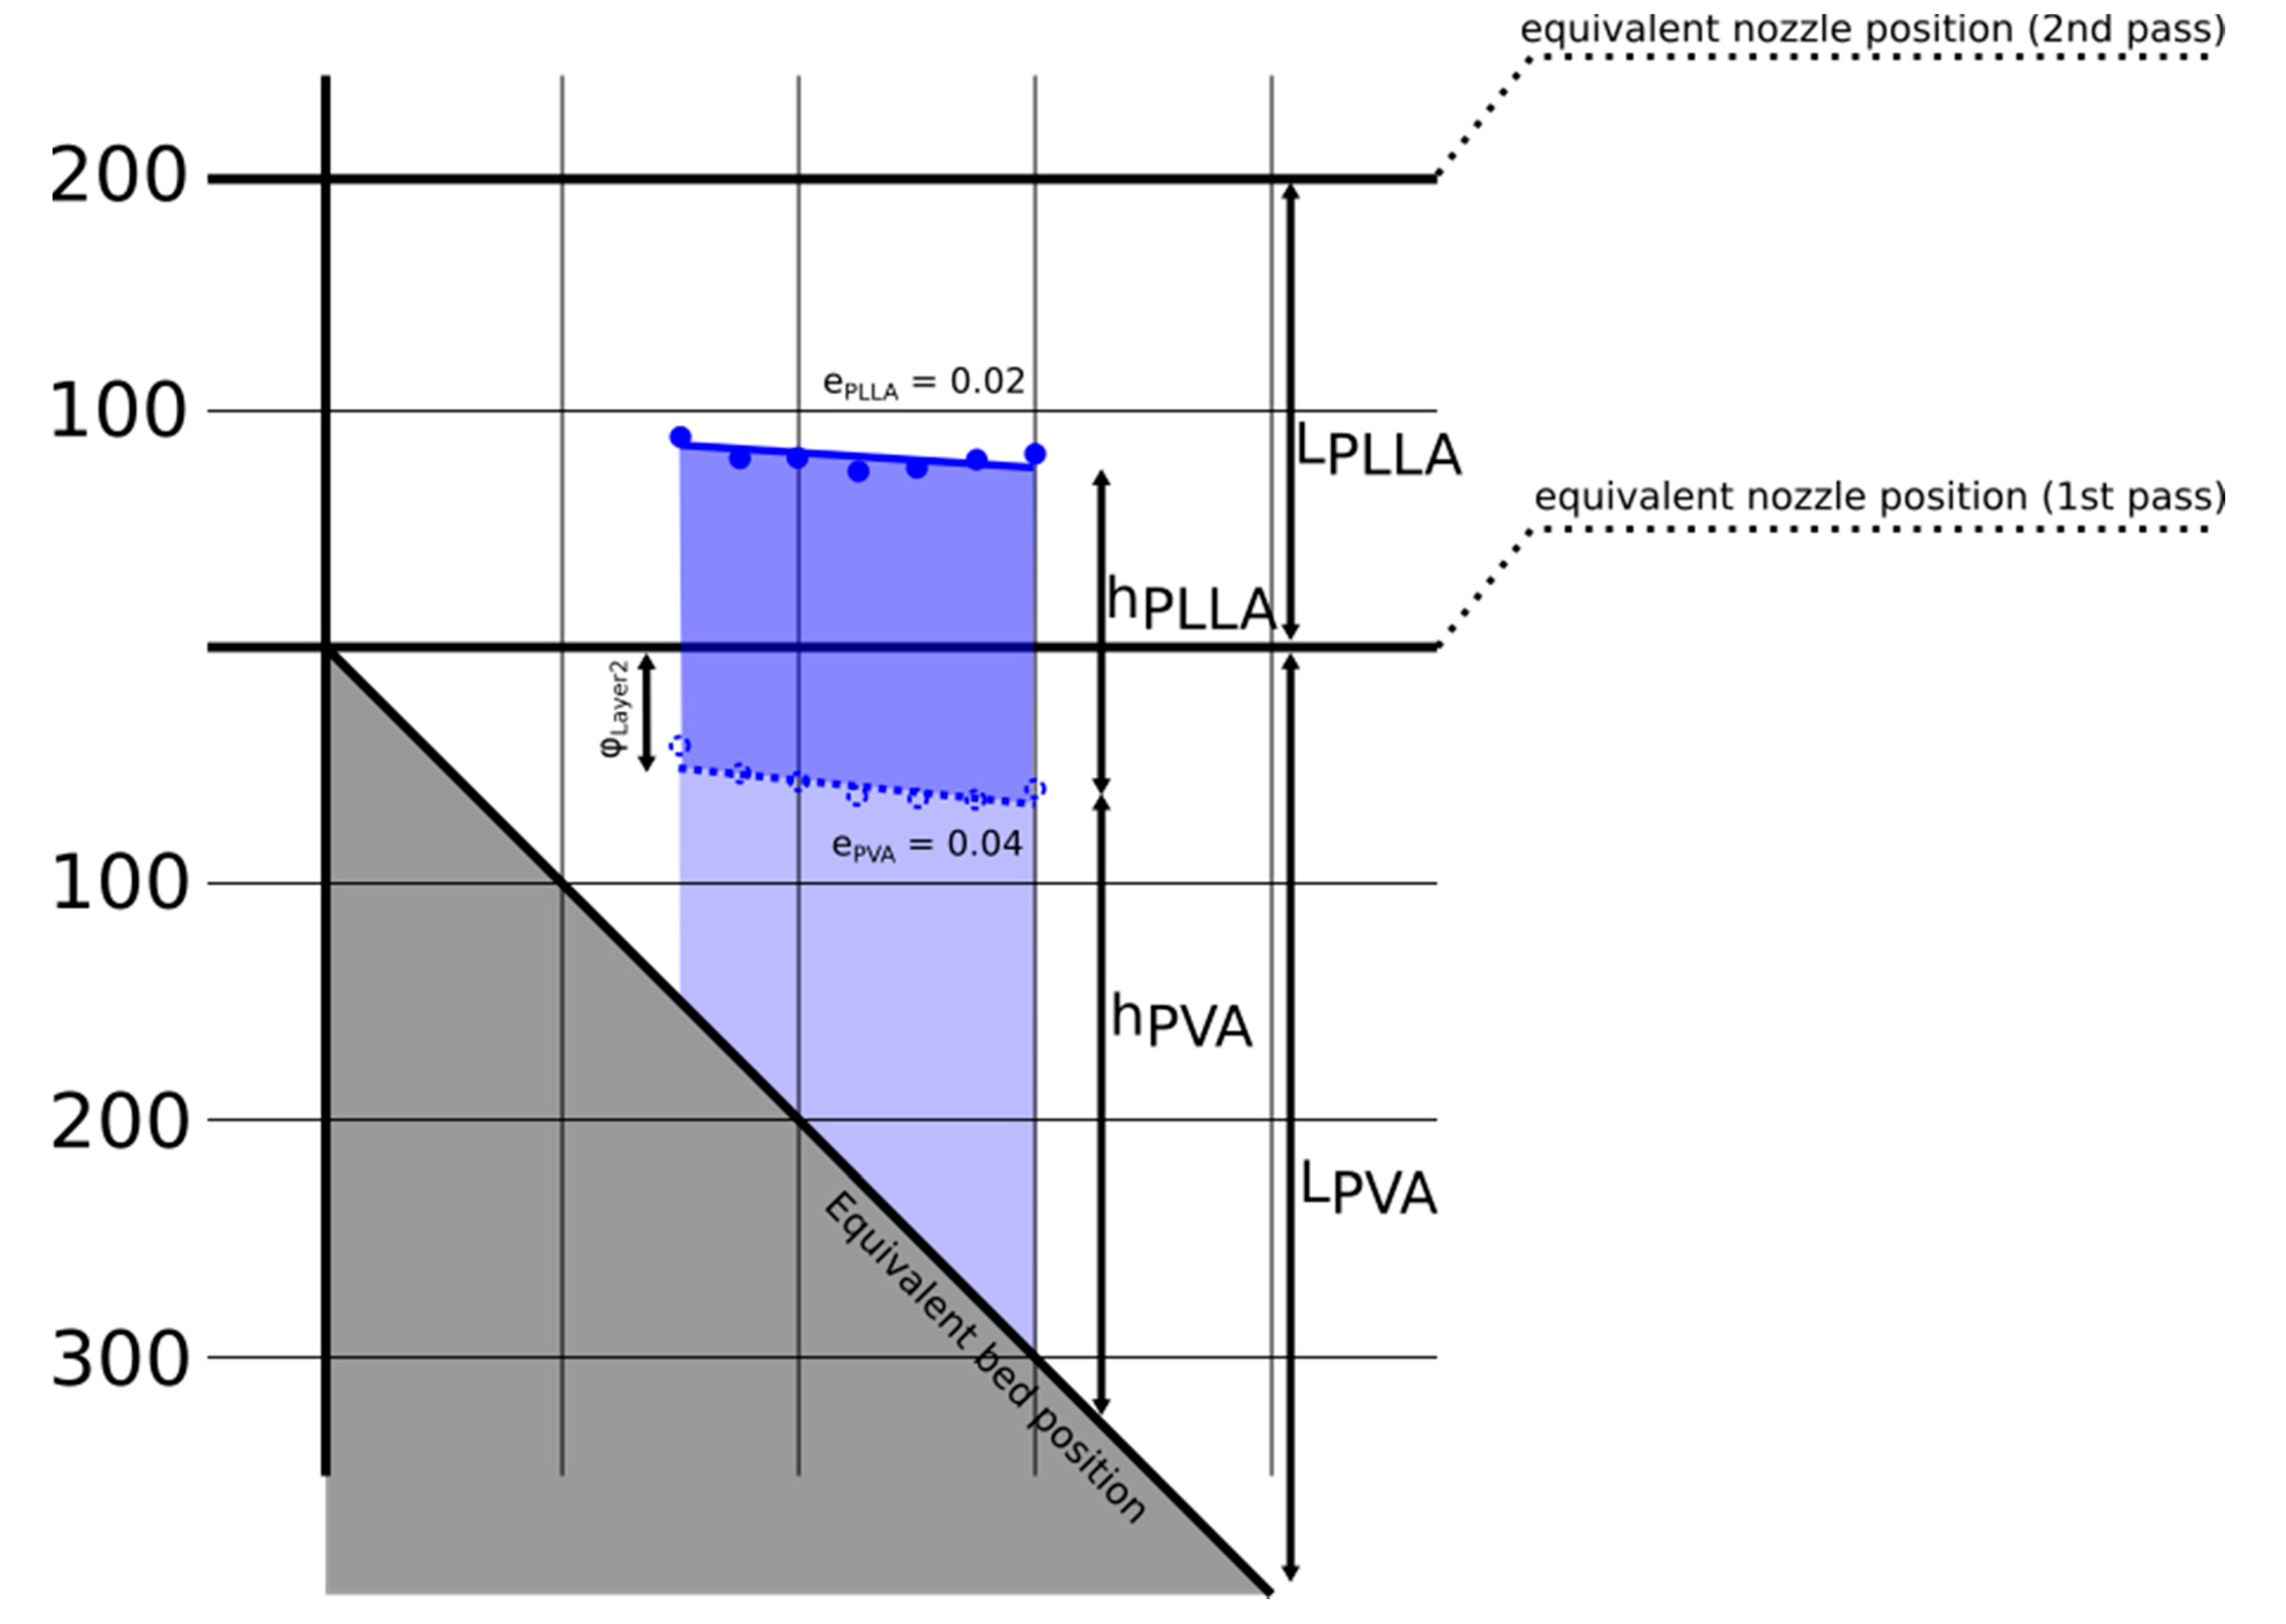
The sequential nozzle passes that deposit both the sacrificial PVA layer, and PLLA layer, are easier to visualise if the measured sample thicknesses are represented on an imagined sloped printing surface. This is depicted in Figure 11, reconstructed from the dataset introduced in Figure 8. Here, the lightly shaded region is ‘filled’ in with PVA, providing a flatter surface onto which PLLA can be printed. The height of the more heavily shaded parallelogram represents PLLA layer thickness, hPLLA, and is consistent across the range of LPVA sampled.
There is, however, a discrepancy between the thicknesses of the peeled PVA layers in Figure 8a and the standalone layers printed in Figure 5, notably in a reduction of proportionality from 0.98 ± 0.03 to 0.89 ± 0.05 and shift of around 15 µm for ePVA = 0.04, though these values still fall within the ranges of error set in Figure 5. Firstly, measurements of peeled samples (Figure 8a) should be prefaced by the fact the layers are printed PVA, hence are quite difficult to keep uniform during peeling, and are likely to be deformed, especially if air humidity is fairly high. Samples may also be deformed during sectioning. Secondly, reheating as the PLLA layer is deposited (Text = 215 °C) is likely to push the PVA above its glass transition temperature (Tg = 80 °C), and therefore, this layer might be expected to deform slightly under the force exerted by PLLA deposition. However, this is likely to be tempered by friction between the polymer and print surface, which might restrict the expansion in the width of the deposited layers.
The distinction in thickness between PLLA layers printed on PVA at ePVA = 0.04 and 0.06 might be understood by inspecting the cross-sectional optical microscopy presented in Figure 8c. Here, PLLA thickness is fairly uniform across a cross section for ePVA = 0.04 but shows a pronounced central dip for ePVA = 0.06 (likewise a central bump is seen in the peeled PVA). This is likely to be related to the increased extrusion of PVA at higher extrusion factors, though this effect is not observed in the unpeeled PVA layers included in Figure 5. It might be suggested that the increased width of the sacrificial layer at the higher extrusion factor experiences a greater resistance to any expansion that may be driven by the deposition of the PLLA layer, with the outer regions less restricted to expansion than the central. For a more analytical consideration of these observations, the spreading of extruded material deposited on a translating surface during 3D printing has been recently modelled through the finite element method by Agassant et al. [36].
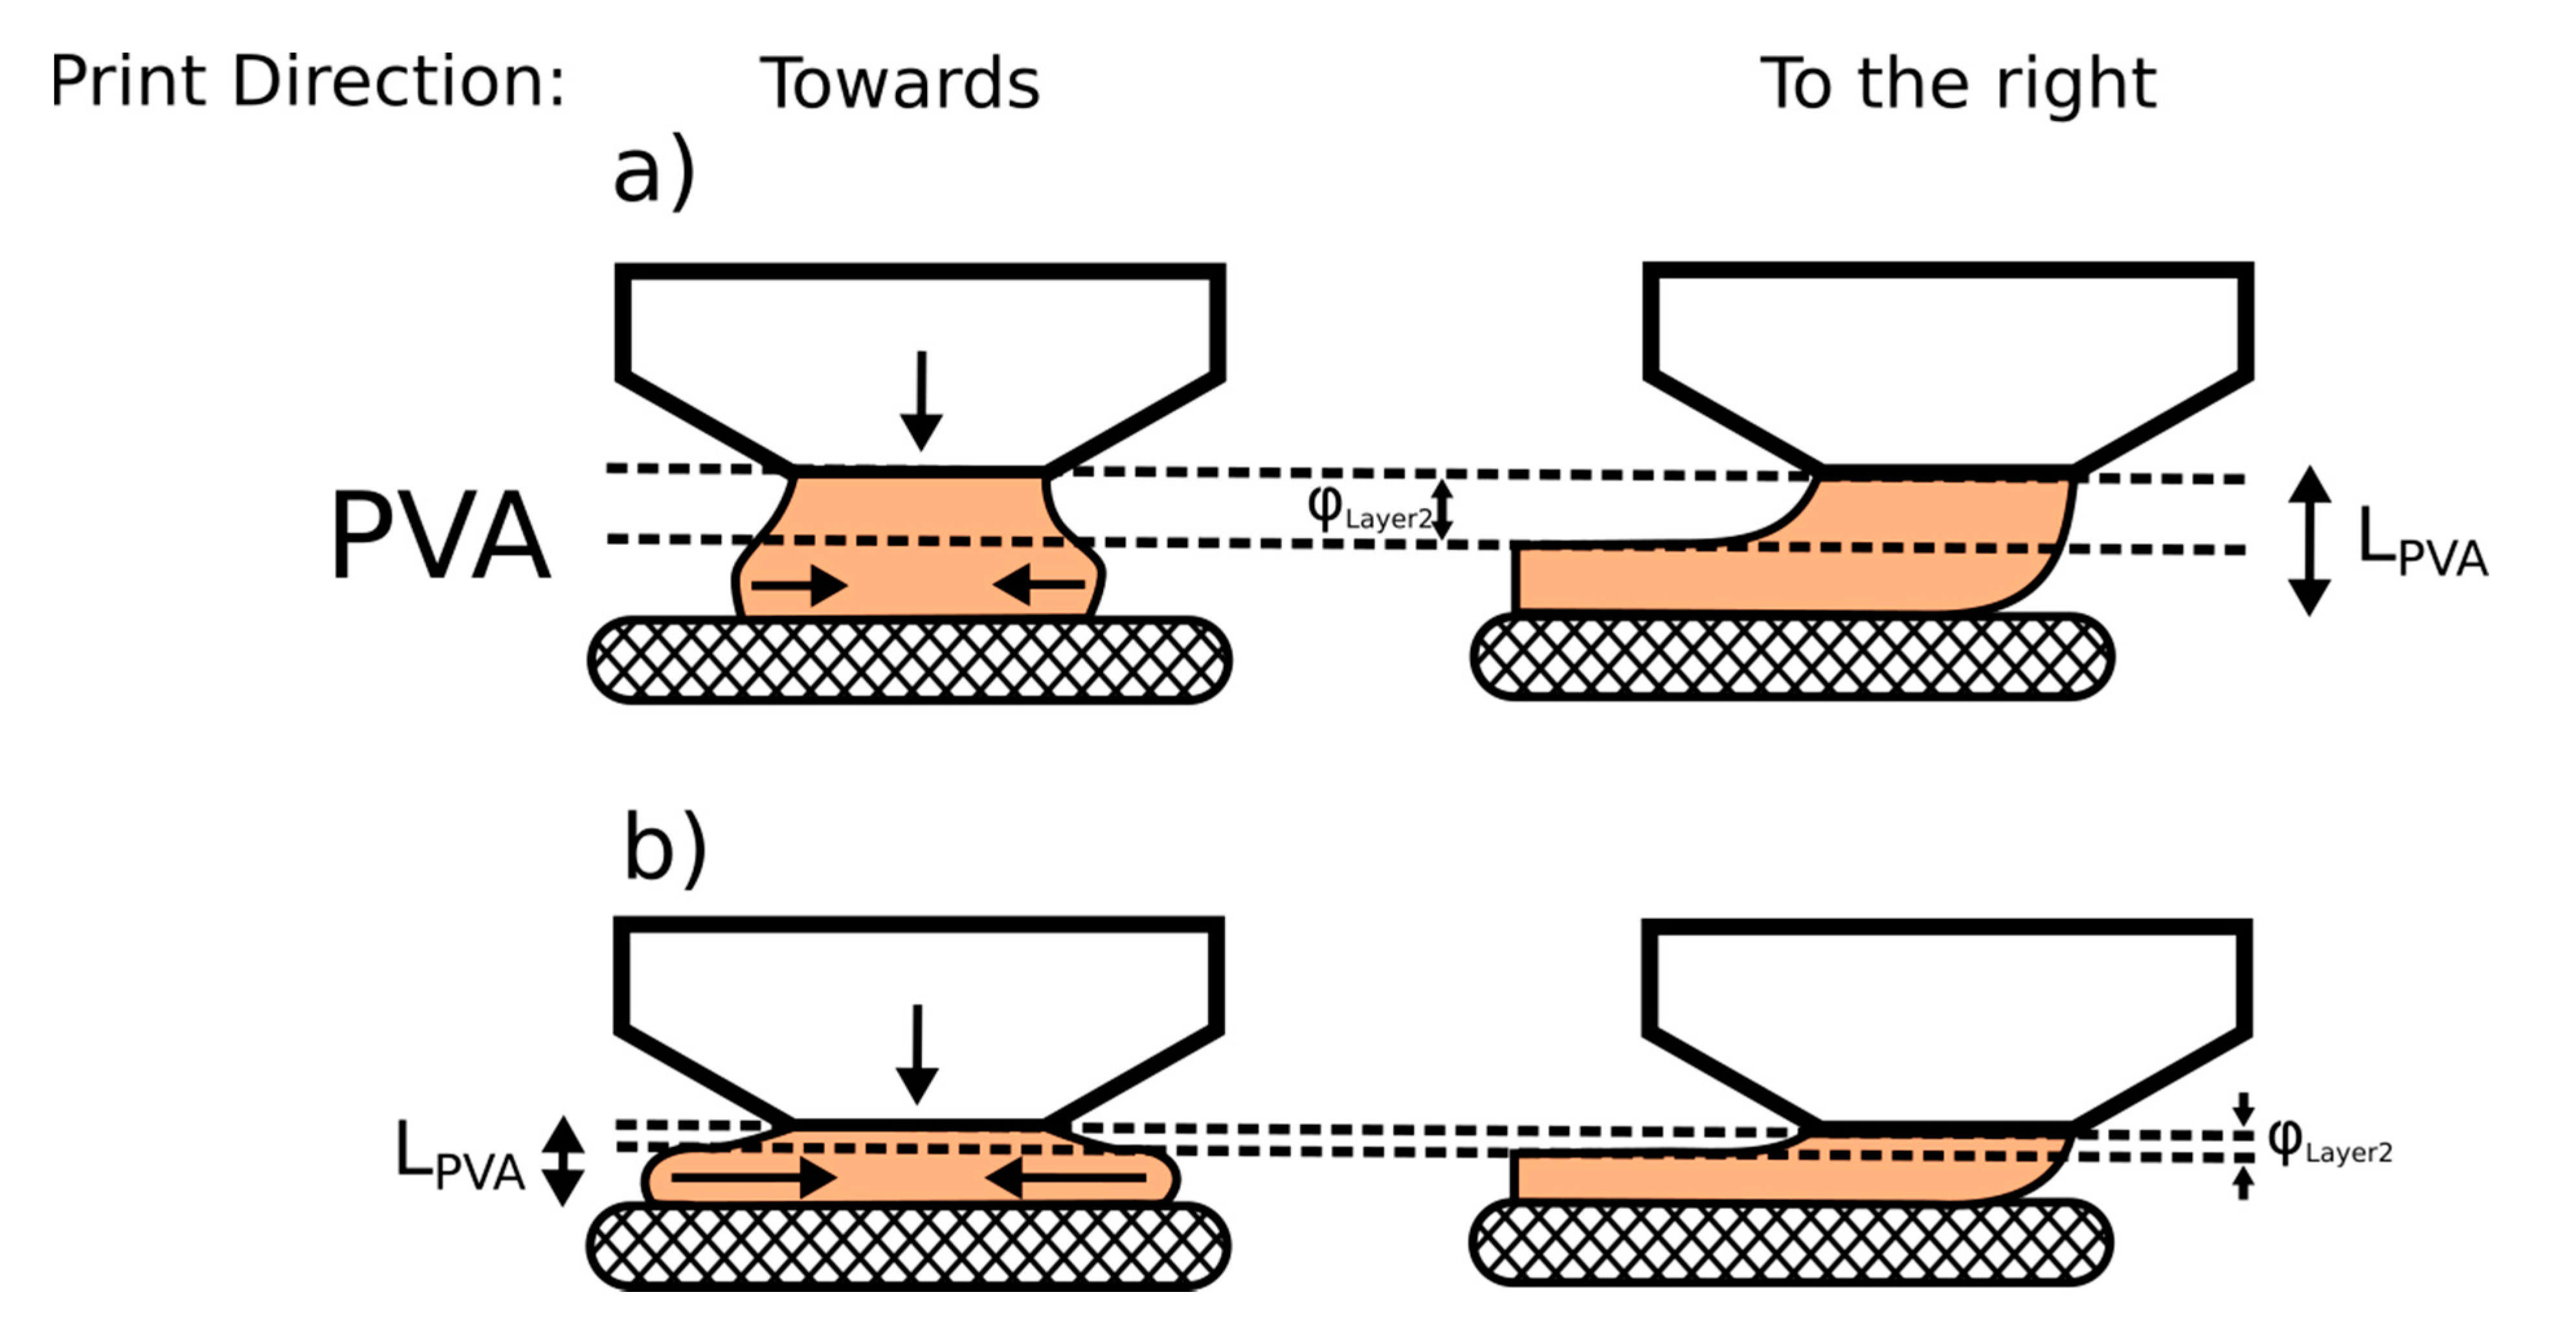
Similarly, this restricted expansion can be used to explain the difference in proportionalities in PVA printed at ePVA = 0.04 and 0.06 in Figure 5. A drop from 0.98 ± 0.03 to 0.80 ± 0.05 on increasing extrusion factor may be indicative of resistance to expansion, and results in a dependency of φLayer2 on LPVA—lower layer separations yield lower values of φ. This is depicted in Figure 12. Two views of the nozzle moving towards (Figure 12 Left) and to the right (Figure 12 Right) of the page reference are shown. As LPVA is reduced, the width of the deposited layer increases to maintain a constant volume and experiences a greater resistance to further expansion, where frictional forces scale with the contact area. Whilst the relatively uniform values of φLayer2 presented in Figure 7 for ePVA = 0.04 somewhat highlights a lack of this effect at lower extrusion factors, it is clearly visible in the linear proportionality of φ at LPLLA < 225 µm for ePVA = 0.06. Similar variation in φlayer2 is evident in the variation in offset between idealised nozzle motion and layer cross section reported by Serdeczny et al. [26].
In the experiments reported here, the printer bed is only nominally level. Further, this printer incorporates an inbuilt ‘mesh-bed-levelling’ function that automatically adjusts for deviations in bed calibration, but this could vary by tens of microns between prints. A lack of first layer consistency, the reason for the suggestion of this technique, is also an issue—it is difficult to measure an exact point for z = 0. A zero point with an error of ±30 µm might serve as a rough estimate. Aside from the clear demonstration of repeatable sample thicknesses, there is, therefore, a limitation on what might be concluded from the absolute measurements of layer thickness and therefore φLayer2 in this paper. Rather, the finer points of discussion of layer offsets are presented conceptually—fully quantitative analysis could be achieved with a more precise and accurate printer.
The technique of bed levelling is emphasised in Figure 9, where sacrificial PVA layers were used to support the printing of PLLA on a damaged Bakelite block. Here, uniform PLLA layers are produced despite exaggerated surface indentation (~1 mm). Localised damage to the print bed reduces useable printing space and requires repair to maximise fabrication frequency in commercial printing, and part reproducibility in a research and development environment. The adoption of a sacrificial layer may therefore either extend the lifespan of print beds in heavy use or reduce the manufacturing tolerances of bed levelness and smoothness whilst still maintaining a good surface finish on printed parts.
The 3D printing of freestanding thin struts was demonstrated as a novel application of this technique, and an expansion of the applicability of budget FFF 3D printers. In Figure 10, cross-sectional micro-CT images of a representative freestanding, 25 µm thick PLLA layer were presented. While previously, thin parts were too fragile to remove from a print surface or required the implementation of expensive dedicated machines, here, we demonstrate the printing of freestanding thin layers of ~25 µm in thickness. Precision printing of thin layers opens up a wider use to multilayered printing, where these findings may extend an ability to dynamically control individual layer properties to create structures not possible through standard fabrication techniques.
In mitigating the effects of printer calibration, bed misalignment, and surface damage, and in demonstrating the printing of consistent freestanding thin struts, this technique may both reduce the printer setup time and printer-to-printer variability whilst improving part consistency and lowering minimum print dimensions. We also note the potential in applying these techniques to position off-the-shelf FFF printing as an acceptable microscale fabrication technique to minimise existing 3D printed parts and reduce prototyping costs as a replacement for expensive existing technologies such as photolithography and laser ablation where possible. Additionally, the introduction of the rapid printing times, widely available materials, and ability to control polymer processing inherent with FFF printing to the freestanding microscale may address the limitations of part fabrication with stereolithographic printing (SLA) and selective laser sintering (SLS). Currently, the advantages of SLA and SLS printing, namely, increased resolution and smaller freestanding part sizes, are hindered by limited available materials, expensive printers, and minimal control over polymer properties. Further, the production of consistent freestanding thin layers is crucial in future work to understand the influence of printing parameters on part properties, in particular allowing the distinction between intra- and interlayer mechanical properties, and to study the effects of bonding between layers.

5. Conclusions

With the ever-growing interest in 3D printing development in academic and hobbyist spaces, cost and precision considerations remain significant hurdles to overcome. In this paper, the use of a sacrificial layer has demonstrated the extension of the cheap, readily available, off-the-shelf FFF 3D printing method to a consistent, repeatable fabrication technique on the order of the microscale. A linear relationship is confirmed between the programmed vertical distance moved by the nozzle between layers (layer separation) and the thicknesses of 3D-printed single layers of PLLA and PVA that is dependent on polymer type and extrusion factor. The issues of print bed misalignment and inconsistent calibration (modelled as a variation in the initial layer separation) are shown to be dramatically reduced through the incorporation of a sacrificial PVA layer.
The life span of printer bed surfaces may be extended using a sacrificial PVA layer to reduce the influence of damage on printed layer consistency. A pathway for repeatable, consistent first layers is demonstrated and advocated, with a reduced burden on user-led calibration. Finally, the use of this technique in the production of freestanding thin layers (~25 µm) expands the use of FFF into the affordable printing of complex thin architectures. It is hoped that the techniques presented in this paper will make the use of cheaper 3D printers more attractive, might reduce the barrier to experimentation with new and unconventional applications within academia, and enable further study into the effects of printing parameters on polymer properties within layers and on interlayer bonding.

6. Patents

“Method of Additive Layer Manufacturing”, DM Roper, KA Kwon, SM Best, RE Cameron.

Author Contributions

Conceptualisation, D.M.R., K.-A.K., R.E.C. and S.M.B. Data curation, D.M.R. Software, D.M.R. Writing—original draft preparation, D.M.R. Writing—review and editing, K.-A.K., S.M.B. and R.E.C. Supervision, R.E.C. and S.M.B. All authors have read and agreed to the published version of the manuscript.

Funding

This work was supported by Engineering and Physical Sciences Research Council (EP/M508007/1, EP/N509620/1 and EP/N019938/1) and “Fast Assessment and Treatment in Healthcare” (FAST Healthcare) (EP/N027000/1).

Data Availability Statement

The data used in the preparation of this article may be found in the University of Cambridge data repository: https://doi.org/10.17863/CAM.64902.

Conflicts of Interest

The authors declare no conflict of interest. All funding sponsors had no role in the design, execution, interpretation or writing of the study.

References

  1. Rahim, T.N.A.T.; Abdullah, A.M.; Akil, H.M. Recent Developments in Fused Deposition Modeling-Based 3D Printing of Polymers and Their Composites. Polym. Rev. 2019, 59, 589–624. [Google Scholar] [CrossRef]
  2. MacDonald, E.; Salas, R.; Espalin, D.; Perez, M.; Aguilera, E.; Muse, D.; Wicker, R.B. 3D Printing for the Rapid Prototyping of Structural Electronics. IEEE Access 2014, 2, 234–242. [Google Scholar] [CrossRef]
  3. Rayna, T.; Striukova, L. From rapid prototyping to home fabrication: How 3D printing is changing business model innovation. Technol. Forecast. Soc. Chang. 2016, 102, 214–224. [Google Scholar] [CrossRef] [Green Version]
  4. Bak, D. Rapid prototyping or rapid production? 3D printing processes move industry towards the latter. Assem. Autom. 2003, 23, 340–345. [Google Scholar] [CrossRef]
  5. Pattinson, S.W.; Huber, M.E.; Kim, S.; Lee, J.; Grunsfeld, S.; Roberts, R.; Dreifus, G.; Meier, C.; Liu, L.; Hogan, N.; et al. Additive Manufacturing of Biomechanically Tailored Meshes for Compliant Wearable and Implantable Devices. Adv. Funct. Mater. 2019, 29. [Google Scholar] [CrossRef] [Green Version]
  6. Yu, K.; Ritchie, A.; Mao, Y.; Dunn, M.L.; Qi, H.J. Controlled Sequential Shape Changing Components by 3D Printing of Shape Memory Polymer Multimaterials. Procedia IUTAM 2015, 12, 193–203. [Google Scholar] [CrossRef] [Green Version]
  7. Nelson, M.D.; Ramkumar, N.; Gale, B.K. Flexible, transparent, sub-100 µm microfluidic channels with fused deposition modeling 3D-printed thermoplastic polyurethane. J. Micromech. Microeng. 2019, 29, 095010. [Google Scholar] [CrossRef]
  8. Beauchamp, M.J.; Nordin, G.; Woolley, A.T. Moving from millifluidic to truly microfluidic sub-100-μm cross-section 3D printed devices. Anal. Bioanal. Chem. 2017, 409, 4311–4319. [Google Scholar] [CrossRef] [PubMed]
  9. Gaal, G.; Mendes, M.; De Almeida, T.P.; Piazzetta, M.H.; Gobbi, Â.L.; Riul, A.; Rodrigues, V. Simplified fabrication of integrated microfluidic devices using fused deposition modeling 3D printing. Sens. Actuators B Chem. 2017, 242, 35–40. [Google Scholar] [CrossRef]
  10. Ho, C.M.B.; Ng, S.H.; Li, H.; Yoon, Y.-J. 3D printed microfluidics for biological applications. Lab Chip 2015, 15, 3627–3637. [Google Scholar] [CrossRef] [PubMed]
  11. Bayart, M.; Charlon, S.; Soulestin, J. Fused filament fabrication of scaffolds for tissue engineering; how realistic is shape-memory? A review. Polymers 2021, 217, 123440. [Google Scholar] [CrossRef]
  12. Chia, H.N.; Wu, B.M. Recent advances in 3D printing of biomaterials. J. Biol. Eng. 2015, 9, 1–14. [Google Scholar] [CrossRef] [PubMed] [Green Version]
  13. Singh, S.; Singh, G.; Prakash, C.; Ramakrishna, S.; Lamberti, L.; Pruncu, C.I. 3D printed biodegradable composites: An insight into mechanical properties of PLA/chitosan scaffold. Polym. Test. 2020, 89, 106722. [Google Scholar] [CrossRef]
  14. Alam, F.; Shukla, V.R.; Varadarajan, K.; Kumar, S. Microarchitected 3D printed polylactic acid (PLA) nanocomposite scaffolds for biomedical applications. J. Mech. Behav. Biomed. Mater. 2020, 103, 103576. [Google Scholar] [CrossRef] [PubMed]
  15. Domínguez-Robles, J.; Martin, N.K.; Fong, M.L.; Stewart, S.A.; Irwin, N.J.; Rial-Hermida, M.I.; Donnelly, R.F.; Larrañeta, E. Antioxidant PLA Composites Containing Lignin for 3D Printing Applications: A Potential Material for Healthcare Applications. Pharmaceutics 2019, 11, 165. [Google Scholar] [CrossRef] [Green Version]
  16. Lee, J.; Lee, H.; Cheon, K.-H.; Park, C.; Jang, T.-S.; Kim, H.-E.; Jung, H.-D. Fabrication of poly(lactic acid)/Ti composite scaffolds with enhanced mechanical properties and biocompatibility via fused filament fabrication (FFF)–based 3D printing. Addit. Manuf. 2019, 30, 100883. [Google Scholar] [CrossRef]
  17. Mondal, S.; Nguyen, T.P.; Pham, V.H.; Hoang, G.; Manivasagan, P.; Kim, M.H.; Nam, S.Y.; Oh, J. Hydroxyapatite nano bioceramics optimized 3D printed poly lactic acid scaffold for bone tissue engineering application. Ceram. Int. 2020, 46, 3443–3455. [Google Scholar] [CrossRef]
  18. Alksne, M.; Kalvaityte, M.; Simoliunas, E.; Rinkunaite, I.; Gendviliene, I.; Locs, J.; Rutkunas, V.; Bukelskiene, V. In vitro comparison of 3D printed polylactic acid/hydroxyapatite and polylactic acid/bioglass composite scaffolds: Insights into materials for bone regeneration. J. Mech. Behav. Biomed. Mater. 2020, 104, 103641. [Google Scholar] [CrossRef] [PubMed]
  19. Zhang, H.; Mao, X.; Du, Z.; Jiang, W.; Han, X.; Zhao, D.; Han, D.; Li, Q. Three dimensional printed macroporous polylactic acid/hydroxyapatite composite scaffolds for promoting bone formation in a critical-size rat calvarial defect model. Sci. Technol. Adv. Mater. 2016, 17, 136–148. [Google Scholar] [CrossRef] [PubMed] [Green Version]
  20. Pensa, N.W.; Curry, A.S.; Bonvallet, P.P.; Bellis, N.F.; Rettig, K.M.; Reddy, M.S.; Eberhardt, A.W.; Bellis, S.L. 3D printed mesh reinforcements enhance the mechanical properties of electrospun scaffolds. Biomater. Res. 2019, 23, 1–7. [Google Scholar] [CrossRef]
  21. Vaezi, M.; Seitz, H.; Yang, S. A review on 3D micro-additive manufacturing technologies. Int. J. Adv. Manuf. Technol. 2013, 67, 1721–1754. [Google Scholar] [CrossRef]
  22. Udofia, E.N.; Zhou, W. A Guiding Framework for Microextrusion Additive Manufacturing. J. Manuf. Sci. Eng. 2019, 141, 1–33. [Google Scholar] [CrossRef]
  23. Halli, M.B.; Narayanaswamy, R.; John, T. Design and Implementation of Arduino Based 3D Printing Using FDM Technique. Int. J. Res. Eng. Technol. 2016, 5, 182–185. [Google Scholar] [CrossRef]
  24. Attaran, M. The rise of 3-D printing: The advantages of additive manufacturing over traditional manufacturing. Bus. Horiz. 2017, 60, 677–688. [Google Scholar] [CrossRef]
  25. Wang, L.; Gramlich, W.M.; Gardner, D.J. Improving the impact strength of Poly(lactic acid) (PLA) in fused layer modeling (FLM). Polymers 2017, 114, 242–248. [Google Scholar] [CrossRef]
  26. Serdeczny, M.P.; Comminal, R.; Pedersen, D.B.; Spangenberg, J. Experimental validation of a numerical model for the strand shape in material extrusion additive manufacturing. Addit. Manuf. 2018, 24, 145–153. [Google Scholar] [CrossRef]
  27. Sood, A.K.; Ohdar, R.; Mahapatra, S.S. Improving dimensional accuracy of Fused Deposition Modelling processed part using grey Taguchi method. Mater. Des. 2009, 30, 4243–4252. [Google Scholar] [CrossRef]
  28. Torres, J.; Cole, M.; Owji, A.; DeMastry, Z.; Gordon, A.P. An approach for mechanical property optimization of fused deposition modeling with polylactic acid via design of experiments. Rapid Prototyp. J. 2016, 22, 387–404. [Google Scholar] [CrossRef]
  29. Afrose, M.F.; Masood, S.H.; Iovenitti, P.; Nikzad, M.; Sbarski, I. Effects of part build orientations on fatigue behaviour of FDM-processed PLA material. Prog. Addit. Manuf. 2016, 1, 21–28. [Google Scholar] [CrossRef]
  30. Lee, B.; Abdullah, J.; Khan, Z. Optimization of rapid prototyping parameters for production of flexible ABS object. J. Mater. Process. Technol. 2005, 169, 54–61. [Google Scholar] [CrossRef]
  31. Anitha, R.; Arunachalam, S.; Radhakrishnan, P. Critical parameters influencing the quality of prototypes in fused deposition modelling. J. Mater. Process. Technol. 2001, 118, 385–388. [Google Scholar] [CrossRef]
  32. Mohan, N.; Senthil, P.; Vinodh, S.; Jayanth, N. A review on composite materials and process parameters optimisation for the fused deposition modelling process. Virtual Phys. Prototyp. 2017, 12, 47–59. [Google Scholar] [CrossRef]
  33. Chacón, J.M.; Caminero, M.A.; García-Plaza, E.; Núñez, P.J. Additive manufacturing of PLA structures using fused deposition modelling: Effect of process parameters on mechanical properties and their optimal selection. Mater. Des. 2017, 124, 143–157. [Google Scholar] [CrossRef]
  34. Abid, S.; Messadi, R.; Hassine, T.; Ben Daly, H.; Soulestin, J.; Lacrampe, M.F. Optimization of mechanical properties of printed acrylonitrile butadiene styrene using RSM design. Int. J. Adv. Manuf. Technol. 2019, 100, 1363–1372. [Google Scholar] [CrossRef]
  35. Priedeman, W.R., Jr.; Brosch, A.L. Soluble Material and Process for Three-Dimensional Modeling. U.S. Patent 6,790,403, 14 September 2004. [Google Scholar]
  36. Agassant, J.-F.; Pigeonneau, F.; Sardo, L.; Vincent, M. Flow analysis of the polymer spreading during extrusion additive manufacturing. Addit. Manuf. 2019, 29, 100794. [Google Scholar] [CrossRef] [Green Version]
Figure 1. Schematic labelling printing parameters for dual-layered or multi-material printing.
Applsci 11 06320 g001
Figure 2. A series of diagrams representing the progressive deposition of multiple layers to form a single raster. The transition to stable printing such that layer thickness, h, is equal to programmed layer separation, L, is shown.
Applsci 11 06320 g002
Figure 3. (a) A representation of PLLA printed with a 3D printer with a poorly aligned or calibrated bed; (b) a PVA layer is shown to ‘level’ the bed surface to enable uniform PLLA deposition. This printing condition can similarly be represented as (c) discrete experiments on a flat print bed.
Applsci 11 06320 g003
Figure 4. A plot to show the measured layer thickness of PLLA deposited directly onto the printer bed at layer separations LPLLA = 150 to 275 µm at ePLLA = 0.02. A gradient of 0.89 ± 0.03 in PLLA variation is shown, compared with a trend of one-to-one variation in thickness with layer separation (indicated by the black dotted line).
Applsci 11 06320 g004
Figure 5. The variation in measured PVA thickness for layer separations (LPVA) between 150 and 325 µm. Gradients of 0.98 ± 0.03 and 0.80 ± 0.05 are shown for ePVA = 0.04 and 0.06, respectively. A trend of one-to-one variation in thickness with layer separation is represented by a black dotted line.
Applsci 11 06320 g005
Figure 6. Cross-sectional optical microscopy of PVA layers, ePVA = 0.04 and ePVA = 0.06, for layer separations LPVA = 150 to 325 µm.
Applsci 11 06320 g006
Figure 7. The variation of φLayer2 for PVA layers printed at ePVA = 0.04 (left) and 0.06 (right) for layer separations (LPVA) between 150 and 325 µm. Values of φ are calculated from the sample thicknesses recorded in Figure 5.
Applsci 11 06320 g007
Figure 8. (a) The variation in measured peeled PVA thickness for layer separations (LPVA) between 150 and 300 µm. Gradients of 0.89 ± 0.05 and 0.69 ± 0.04 are shown for ePVA = 0.04 and 0.06, respectively. A one-to-one variation is indicated by the black dotted line; (b) peeled PLLA printed at a fixed LPLLA = 200 µm, ePLLA = 0.02 above PVA layers varying between LPVA = 150 to 300 µm. Measured hPLLA = 130 µm at LPLLA = 200 µm printed directly on the printer bed is indicated by the black dotted line; (c) cross-sectional optical microscopy of the PLLA layers.
Applsci 11 06320 g008
Figure 9. PVA layers are shown to be printed on (a) a damaged Bakelite surface such that (b) the surface is smoothed prior to the deposition of a PLLA layer; (c) µ-CT cross sections of PVA (A) and PLLA (B). An uneven thickness is observed in the PVA layer through contact with the damaged surface, whilst the PLLA layer remains uniform.
Applsci 11 06320 g009
Figure 10. Cross-sectional µ-CT images (a) end-on (b) side-on of 3D-printed PLLA layers (LPLLA = 25 µm and ePLLA = 0.0025) after washing to remove PVA layer. Samples are mounted on a card.
Applsci 11 06320 g010
Figure 11. A representation of the PVA and PLLA layer thicknesses previously presented in Figure 8. Layers are visualised on a 45° sloped printing surface. PVA and PLLA layers are represented by dashed and solid markers, respectively. The surface slope is shown to be drastically reduced in severity, with the heavily shaded region showing uniform PLLA thickness, hPLLA.
Applsci 11 06320 g011
Figure 12. A pictorial representation of PVA deposition on a printer bed with a nozzle moving towards (Left) or to the right (Right) of the vantage point. The differences in the aspect ratio of the cross sections of the deposited polymer are shown for (a) larger and (b) smaller values of LPVA. The forces exerted by polymer deposition and contact with the print bed are marked by arrows shown.
Applsci 11 06320 g012
Publisher’s Note: MDPI stays neutral with regard to jurisdictional claims in published maps and institutional affiliations.

